Article

Measuring Customer Equity in Noncontractual Settings Using a Diffusion Model: An Empirical Study of Mobile Payments Aggregator

1
School of Statistics, Center for Applied Statistics of Renmin University of China, Renmin University of China, Beijing 100872, China
2
National Academy of Innovation Strategy, CAST, Beijing 100863, China
3
School of Business & Economics, Indiana University Northwest, Gary, IN 46408, USA
4
Business School, Renmin University of China, Beijing 100872, China
*
Author to whom correspondence should be addressed.
J. Theor. Appl. Electron. Commer. Res. 2021, 16(3), 409-431; https://0-doi-org.brum.beds.ac.uk/10.3390/jtaer16030026
Submission received: 22 February 2020 / Revised: 6 October 2020 / Accepted: 20 October 2020 / Published: 20 November 2020

Abstract

:
Customers are important intangible assets of firms. Customer equity (CE) and customer equity sustainability ratio (CESR) cannot only provide a crucial basis for measuring the growth potential of firms but also provide managers a reference standard to allocate the marketing resource. This empirical study discussed the CE measurement of a mobile payments aggregator. With the rapid development of mobile payment in China, it is very meaningful to calculate the CE of these aggregators as an emerging business pattern because calculating CE cannot only help the mobile payments aggregator evaluate its future business development but also help it to provide value-added services and generate service fee from its clients, i.e., the retailers. The main purpose of this paper is to calculate CE of a mobile payments aggregator generated from a specific retailer from the perspective of technology diffusion. Based on the Bass model and Rogers’ theory of innovation diffusion, we calculated CE and CESR for five segments, namely innovators, early adopters, early majorities, late majorities, and laggards. The results show that it is the early adopters and the early majorities who generate most of the profit and it is also these two segments that have the greatest growth potential in the future.

1. Introduction

Customers are important intangible assets [1,2,3,4] and sources of profits of the firms [5]. As an important supplement to corporate financial indicators, customer equity (CE) and its derivative indicator, customer equity sustainability ratio (CESR), are measurements of the financial status of a firm’s customers and thus clearly reflect the future development trend and growth potential of the firm [6]. Customer equity has thus become an important reference for investment decisions and this concept has established its important position in both the academic and industry field [7,8,9].
Customer equity reflects the value of customers and is closely associated with the customer lifetime value (CLV). CLV refers to the net present value of profits that a customer can bring to a firm during his or her entire life of transactions with the firm [10,11]. Customer equity is then defined as the sum of the lifetime value for all customers of the firm [2,12]. Skiera, Bermes, and Horn [13] further proposed the concept of customer equity sustainability ratio (CESR), which is defined as the ratio of a customer’s (or all customers’) future CLV (or CE) to the customer’s (or their) total CLV (or CE). The definitions of major concepts and their abbreviations are shown in Table A1 in the Appendix A. Customer equity is a forward-looking indicator that measures the future profits generated by the customers and therefore it can provide a reference foundation for firms to allocate marketing resources and formulate value-based marketing strategies [1]. Although customer equity plays an important role in terms of either the disclosure of stakeholder information [13,14] or the allocation of marketing resources [1], the accurate prediction of customer equity remains a difficulty in research [3]. Many researchers have conducted in-depth studies and explorations of the measurement of customer equity under different scenarios using different data sources.
On the basis of previous research, this paper focuses on the measurement of customer equity for the scenario of mobile payment that has continued its global growth due to the development of mobile devices, Internet, and wireless communication technologies. China is experiencing rapid development of mobile payment and ranks among the top nations in the world in terms of both the transaction volume and the penetration rate. According to the data provided by the People’s Bank of China, China’s banking institutions handled 60.531 billion mobile payment transactions with a total amount of 277.39 trillion RMB in 2018. It is estimated that the number of mobile payment users in China will reach 790 million in 2020. With the rapid development of mobile payment, many third-party payment providers have sprout out, among which Wechat pay and Alipay are the main players. Under this circumstance, mobile payments aggregators have been established as a new business pattern in order to integrate different third-party payment methods and provide one-stop payment solutions for retailers. These platform-based aggregators can take full advantage of the network effect. Besides providing convenient and efficient payment solutions, these aggregators can also provide the retailers with derived services such as membership management and precision marketing since they have direct access to customer payment data. Predicting customer equity and customer equity sustainability ratio based on customer mobile payment data is very important for these mobile payments aggregators. One reason is that most income of these aggregators comes from a commission fee, which is 0.3% the amount of each mobile payment. Calculating customer equity and the customer equity sustainability ratio based on customers’ mobile payment data helps to assess the future development of these aggregators. The other reason is that calculating customer equity and customer equity sustainability ratio also helps the retailers, i.e., the clients of these mobile payments aggregators, to better understand the value generated from their customers who are using mobile payment and thus helps to make marketing and promotion decisions. Therefore these payment aggregators can generate a service fee from their clients and it is gradually becoming an important source of income for these aggregators. We can see that predicting customer equity and customer equity sustainability ratio is an essential task for these mobile payments aggregators.
Mobile payment has been well accepted in brick-and-mortar stores. Shoppers can use their mobile devices to scan the code and make a payment. This new payment method begun in 2015 and has become the most popular payment method in brick-and-mortar stores. According to Payment and Clearing Association of China, 89.1% of shoppers embraced this new payment method in 2018. The rapid development can be explained from both sides of the retailers and the consumers. From the retailers’ perspective, there are four reasons: firstly, mobile payment is faster than credit card and cash payment, helping retailers to improve their customer services; secondly, using mobile payment helps brick-and-mortar retailers attract a large number of existing Wechat pay and Alipay users in online payment scenarios; thirdly, the commission fee on each mobile payment is 0.3%, however the commission fee on each credit card payment is 1%; lastly, mobile payment offers offline retailers new communication channels and opportunities for personalized marketing. From the consumers’ perspective, firstly, mobile payment is easy to use, especially for those who have already got used to Wechat pay or Alipay for an online payment; secondly, mobile payment is good to use, on the one hand it is more convenient than paying by cash or credit card, and on the other hand, the retailers offered preferential treatment to the consumers using a mobile payment at the early stage of promotion; lastly, imitating other shoppers at the cashier’s also contribute to the rapid development of this new payment method. Due to these above reasons, it took only three years for the mobile payment to become popular in brick-and-mortar stores.
The development and popularization of mobile payment in brick-and-mortar stores can be seen as a diffusion process of a new technology. Consumers are different in technology acceptance. Segmenting consumers based on their acceptance of new technology and understanding their behavior is more and more important in today’s fast-paced and technology-driven world. Therefore, in this paper we use the Bass diffusion model [15] to estimate the potential number of customers of a retailer and group these customers according to their first-time adoption of mobile payment in brick-and-mortar stores. On the basis of customer segmentation, a Pareto/NBD (Negative Binomial Distribution) model [16] is used to describe customer behavior and estimate the customer retention rate. This paper thus proposes a method of measuring customer equity under the scenario of mobile payment by combining the Bass diffusion model and Pareto/NBD model. In this paper, we conduct an empirical study using data from one of the leading mobile payments aggregator in China. These data are customer mobile payment data of an offline retailer from May 2016 to May 2018. This period covers the whole diffusion process of mobile payment in brick-and-mortar stores in China, which started in late 2015 and popularized in 2018. The gradual adoption of mobile payments by customers during the 25 months can be seen as the diffusion of a new technology, we therefore calculate customer equity of the mobile payments aggregator generated from this specific retailer using the Bass diffusion model and Pareto/NBD model. First, we use the Bass model to estimate the potential customer number and group customers into five categories including innovators, early adopters, early majorities, late majorities, and laggards according to their first-time adoption of mobile payment. Second, the Pareto/NBD model is used to estimate the use frequency and retention rate of each customer category. Finally, the customer equity and customer equity sustainability ratio for each customer category is calculated and the overall customer equity of the mobile payments aggregator generated from this specific retailer is obtained by summing up the customer equity of each customer category.
The paper is organized as follows. Section 2 presents a literature review of customer equity modeling approaches, especially the measurement of customer equity based on a diffusion model. Section 3 introduces the theoretical models of this paper. Section 4 presents the research methodology and research framework. Section 5 presents empirical research and analysis results. Section 6 outlines the managerial relevance of the study and summarizes the contributions of the paper.

2. Literature Review

2.1. Brief Introduction of CE

In recent years, marketing theory and practice have become increasingly customer-centered. Customers and the relationship with customers are treated as important intangible assets of a firm. These assets, like any other ones, should be measured and managed. This is the key idea of the customer relationship management (CRM). This shift from a transaction-centered to a relationship-centered marketing approach has led to an interest in measuring customer value. Customer equity and customer equity sustainability ratio are being discussed more than ever before.
Customer equity is an essential metric to measure firm performance and it provides a good proxy for firm value. Many researchers believe customer equity is a new tool for firm valuation [17,18]. This customer-based corporate valuation method can make better estimates of what a firm is really worth than the traditional financial-valuation methods. The reason is that customer equity not only focuses on the profit already generated by the customers but also consider their longer-term profit potential. Customers are the underlying fundamentals of the firm value. Understanding the critical behaviors of customers including their acquisition, retention, buying frequency, and basket-size gives us a more precise estimate of future revenue streams. Customer equity brings us “a much higher degree of precision, accountability, and diagnostic value to the new loyalty economy” [17].
Customer equity is more than a metric to assess a firm’s underlying value. It can be rendered as a way of thinking and doing business [19]. Successful implementation of customer equity helps firms to adopt a customer-centric marketing practice. Maintaining the highest-value customers and abandoning unprofitable customers is the cornerstone of a successful marketing program [7]. Firms can evaluate the expected contribution of each individual customer or customer segments and then allocate marketing resources to specific customers or customer segments in order to increase future profits. For example, Kumar and Shah [20] propose a five-step process to find the optimal level of marketing resources at the individual level based on customer lifetime value. In the aggregate level, customer equity works in a similar way to help managers make customer-centric marketing strategies and thus enhance the overall performance of the firm.
Since customer equity plays an important role in both customer-centric firm valuation and marketing practice, the first question is how to measure it. Customer equity is a forward-looking metric and it is closely related to future customer behaviors. Different approaches have been established to measure customer equity given different circumstances and data availability. We here provided a summary of literature on the modeling approaches of customer equity.

2.2. CE Measurement Model

The concept of customer equity was initially proposed by Blattberg and Deighton [7] and was defined as the sum of the current customer lifetime value (CLV) of a company, i.e., the current customer equity. Gupta, Lehmann, and Stuart [8] later proposed that the customer equity of a firm comprised of two parts: the first part is the sum of the lifetime value of the current customers, i.e., the current customer equity, while the second part is the sum of the lifetime value of the future potential customers, i.e., potential customer equity. Currently, the customer equity of a firm is generally defined as the sum of customer lifetime value for the current and potential customers of the firm [9], i.e.,
C E = i = 1 N C L V i
where C L V i is the lifetime value of customer i while N is the sum of current and estimated future customers. Gupta et al. [10] gave a basic formula for the CLV as
C L V = t = 0 T ( p t c t ) r t ( 1 + d ) t A C
where p t is the payment made by a customer at time t, c t denotes the direct costs of the customer at time t, d is the discount rate, r t is the probability of customer survival at time t, AC denotes the customer’s acquisition costs, and T is the time horizon for CLV prediction. It is seen that basic factors determining customer equity include the number of customers, the cash flow that the customer brings to the firm, the survival time of the customer (i.e., the survival rate, retention rate, churn rate, or repurchase rate) and the discount rate.
Using the basic formula, many researchers have explored the measurement of customer equity and further developed different measurement models. See Table 1 for examples of customer equity measurement researches.
  • In terms of the relationship between a firm and its customers, the approaches of customer equity measurement can be divided into contractual models and noncontractual models [21,22]. In contractual settings, such as insurance, telecommunications, and magazine subscriptions, firms can accurately understand the cash flow generated by their customers as customers usually sign long-term contracts with the firms. In such cases, the measurement of customer equity should focus on the prediction of whether customers in the following period will continue to subscribe for products or services of the firm (i.e., investigation of the retention rate) [7]. Noncontractual models are used, for example, in the retail industry, where customers and firms are not bound by contracts and customers may shift among different products or service providers. In such cases, the measurement of customer equity involves not only the prediction of the frequency of customers’ future purchases but also the prediction of customers’ future purchase amount [23]. The measurement of customer equity under a noncontractual relationship thus appears to be more complicated.
  • In terms of the data source, the measurement of customer equity can be based on firm-level data (such as financial data from annual reports) or individual-level data (such as individual transaction data) [24]. For the former, the average customer lifetime value is calculated through financial data and is multiplied by the number of customers to obtain customer equity. As no individual customer lifetime value is involved in this top-down approach, it is also called an aggregate-level approach [3,9,25,26]. For the latter, the lifetime value of each customer is calculated based on individual transaction data. Customer equity is then calculated by summing up the lifetime value of all customers. This bottom-up approach is also referred to as a disaggregate-level approach [23].
  • In terms of the model type, customer equity can be calculated by taking deterministic and stochastic approaches [2,27]. For the former, there are no random components involved in the model. The heterogeneity among individual customers is usually not considered. Customer equity can thus be directly calculated based on a simple formula [7,25]. For the latter, the stochastic factors and the heterogeneity among customers are fully considered. Although the stochastic approach is more complicated, it can make the calculation of customer equity more accurate [11].
  • In terms of the specific modeling approach, customer equity can be calculated using probability models, econometric models, persistence models, computer science models, and diffusion/growth models. Probability models are built under certain probability distribution assumptions of customers’ purchasing behaviors. For example, the customers’ future purchasing frequency can be predicted using a Pareto/NBD model [16] and a BG/NBD model [28], the amount of customers’ future purchase can be predicted using the normal distribution [29] or log-gamma distribution [30], and the Conway–Maxwell–Poisson distribution is used to jointly model the purchase frequency and purchase quantity [31]. The central concept of econometric models is to explain different purchasing behaviors of customers through a series of covariates. This approach emphasizes factors that affect customer equity and its components. Commonly used econometric models include the simple regression model, the logit/probit model [32,33] and the survival analysis model [34]. When the time series data is long enough, persistence models, including the unit root test, cointegration model, and VAR model, can be established to predict customer equity, quantifying the long-term dynamic effects of different covariates in customer equity modeling [35,36]. Computer science models introduce machine learning and modern nonparametric statistics to the measurement of customer equity. These models need no theoretical assumptions and generally have stronger predictive ability than parametric models. The main models used are the support vector machine (SVM) [37], random forest [38], Lasso regression, and generalized additive model (GAM) [39]. Diffusion/growth models emphasize the prediction of the number of future customers and thus lay a foundation for customer equity measurement. The diffusion models are discussed in detail below.

2.3. CE Measurement Using a Diffusion Model

Customer equity is the sum of the lifetime value of a firm’s current and potential customers. It is thus important to estimate the number of potential customers and the customer retention rate. For new products or services, it is more appropriate to estimate the number of potential customers from the perspective of technology diffusion. Technology diffusion (also known as innovation diffusion) refers to the whole process from the initial application of a new technology to its development and popularizations and finally to its eliminations. The concept is originated from the innovation theory proposed by Schumpeter [40]. Mansfield [41] later proposed the S-type diffusion model, laying a foundation for research in this field. In the field of product market research, Bass proposed the Bass model to predict the diffusion of products and services [15].
The diffusion model reflects the adoption of new products and services by customers and some researchers have applied the model in customer equity measurement [8,42,43]. Based on quarterly data from annual reports, Gupta, Lehmann, and Stuart [8] calculated customer equity according to the number of customers, retention rate, quarterly margin, and acquisition cost. The number of customers was described by the technological substitution model, which appears as an S-shaped curve. The retention rate was decided by industry experts or followed the industry average. The income and cost data that determine profits were directly obtained from annual reports. Silveira et al. [44] believed that the method proposed by Gupta, Lehmann, and Stuart [8] requires a constant retention rate and contribution margin, and the method thus appeared more suitable to the calculation of customer equity under contractual settings. Additionally, researchers have also studied customer churn using diffusion models. For example, Hogan, Lemon, and Libai [43] studied the value of lost customers using the Bass model while Libai, Muller, and Peres [42] emphasized the effect of customer churn on customer equity. Libai, Muller, and Peres [42] believed that customer loss should be considered during the process of service diffusion and they adopted a diffusion model to measure customer equity of a growing service firm. Similar to Gupta, Lehmann, and Stuart [8], Libai, Muller, and Peres [42] also treated the customer churn rate as an endogenous variable that could be obtained from industry experts, financial reports, or related literature.
Through the literature review, we found that, firstly, customer equity measurements using diffusion models usually adopt an aggregate-level approach. The retention rate is regarded as an exogenous variable and can be obtained from annual reports, related literature, or industry experts. This approach is appropriate for measuring customer equity in contractual settings. Different from this top-down approach, which is based on public financial data in the current literature, customer equity measurement in this paper is based on customers’ individual transaction data. The retention rate in this bottom-up modeling approach is estimated based on customers’ transaction behaviors, which is more appropriate for measuring customer equity in noncontractual settings. Secondly, aggregate-level approaches in the current literature often take customers as a whole and calculate the average customer lifetime value, without considering the heterogeneity of different customer groups. Although it is much easier to calculate customer equity from the perspective of customers as a whole, ignoring the heterogeneity of customer groups may cause large measurement errors. We, therefore, believe it is necessary to calculate customer equity according to customer segmentation. Although some scholars have proposed that customer equity should be calculated according to different customer segmentations, there is still relatively little discussion on specific implementation methods. Gupta, Lehmann, and Stuart [8], for example, proposed the idea of segmenting customers according to time periods, however they did not discuss how to determine the specific time periods. Wiesel, Skiera, and Villanueva [6] clearly stated that the customer equity of the current, new and lost customers should be calculated respectively, but data limitations would increase the difficulty of applying the method. In this paper, we provide a specific customer segment method according to the time of adoption of a new service (i.e., mobile payment in brick-and-mortar stores) and calculate customer equity on the basis of five customer categories, namely innovators, early adopters, early majorities, late majorities, and laggards. Finally, in this paper, we further calculated the customer equity sustainability ratio of each category, an indicator that can be used to objectively evaluate the future increase in customer equity.

3. Theoretical Model

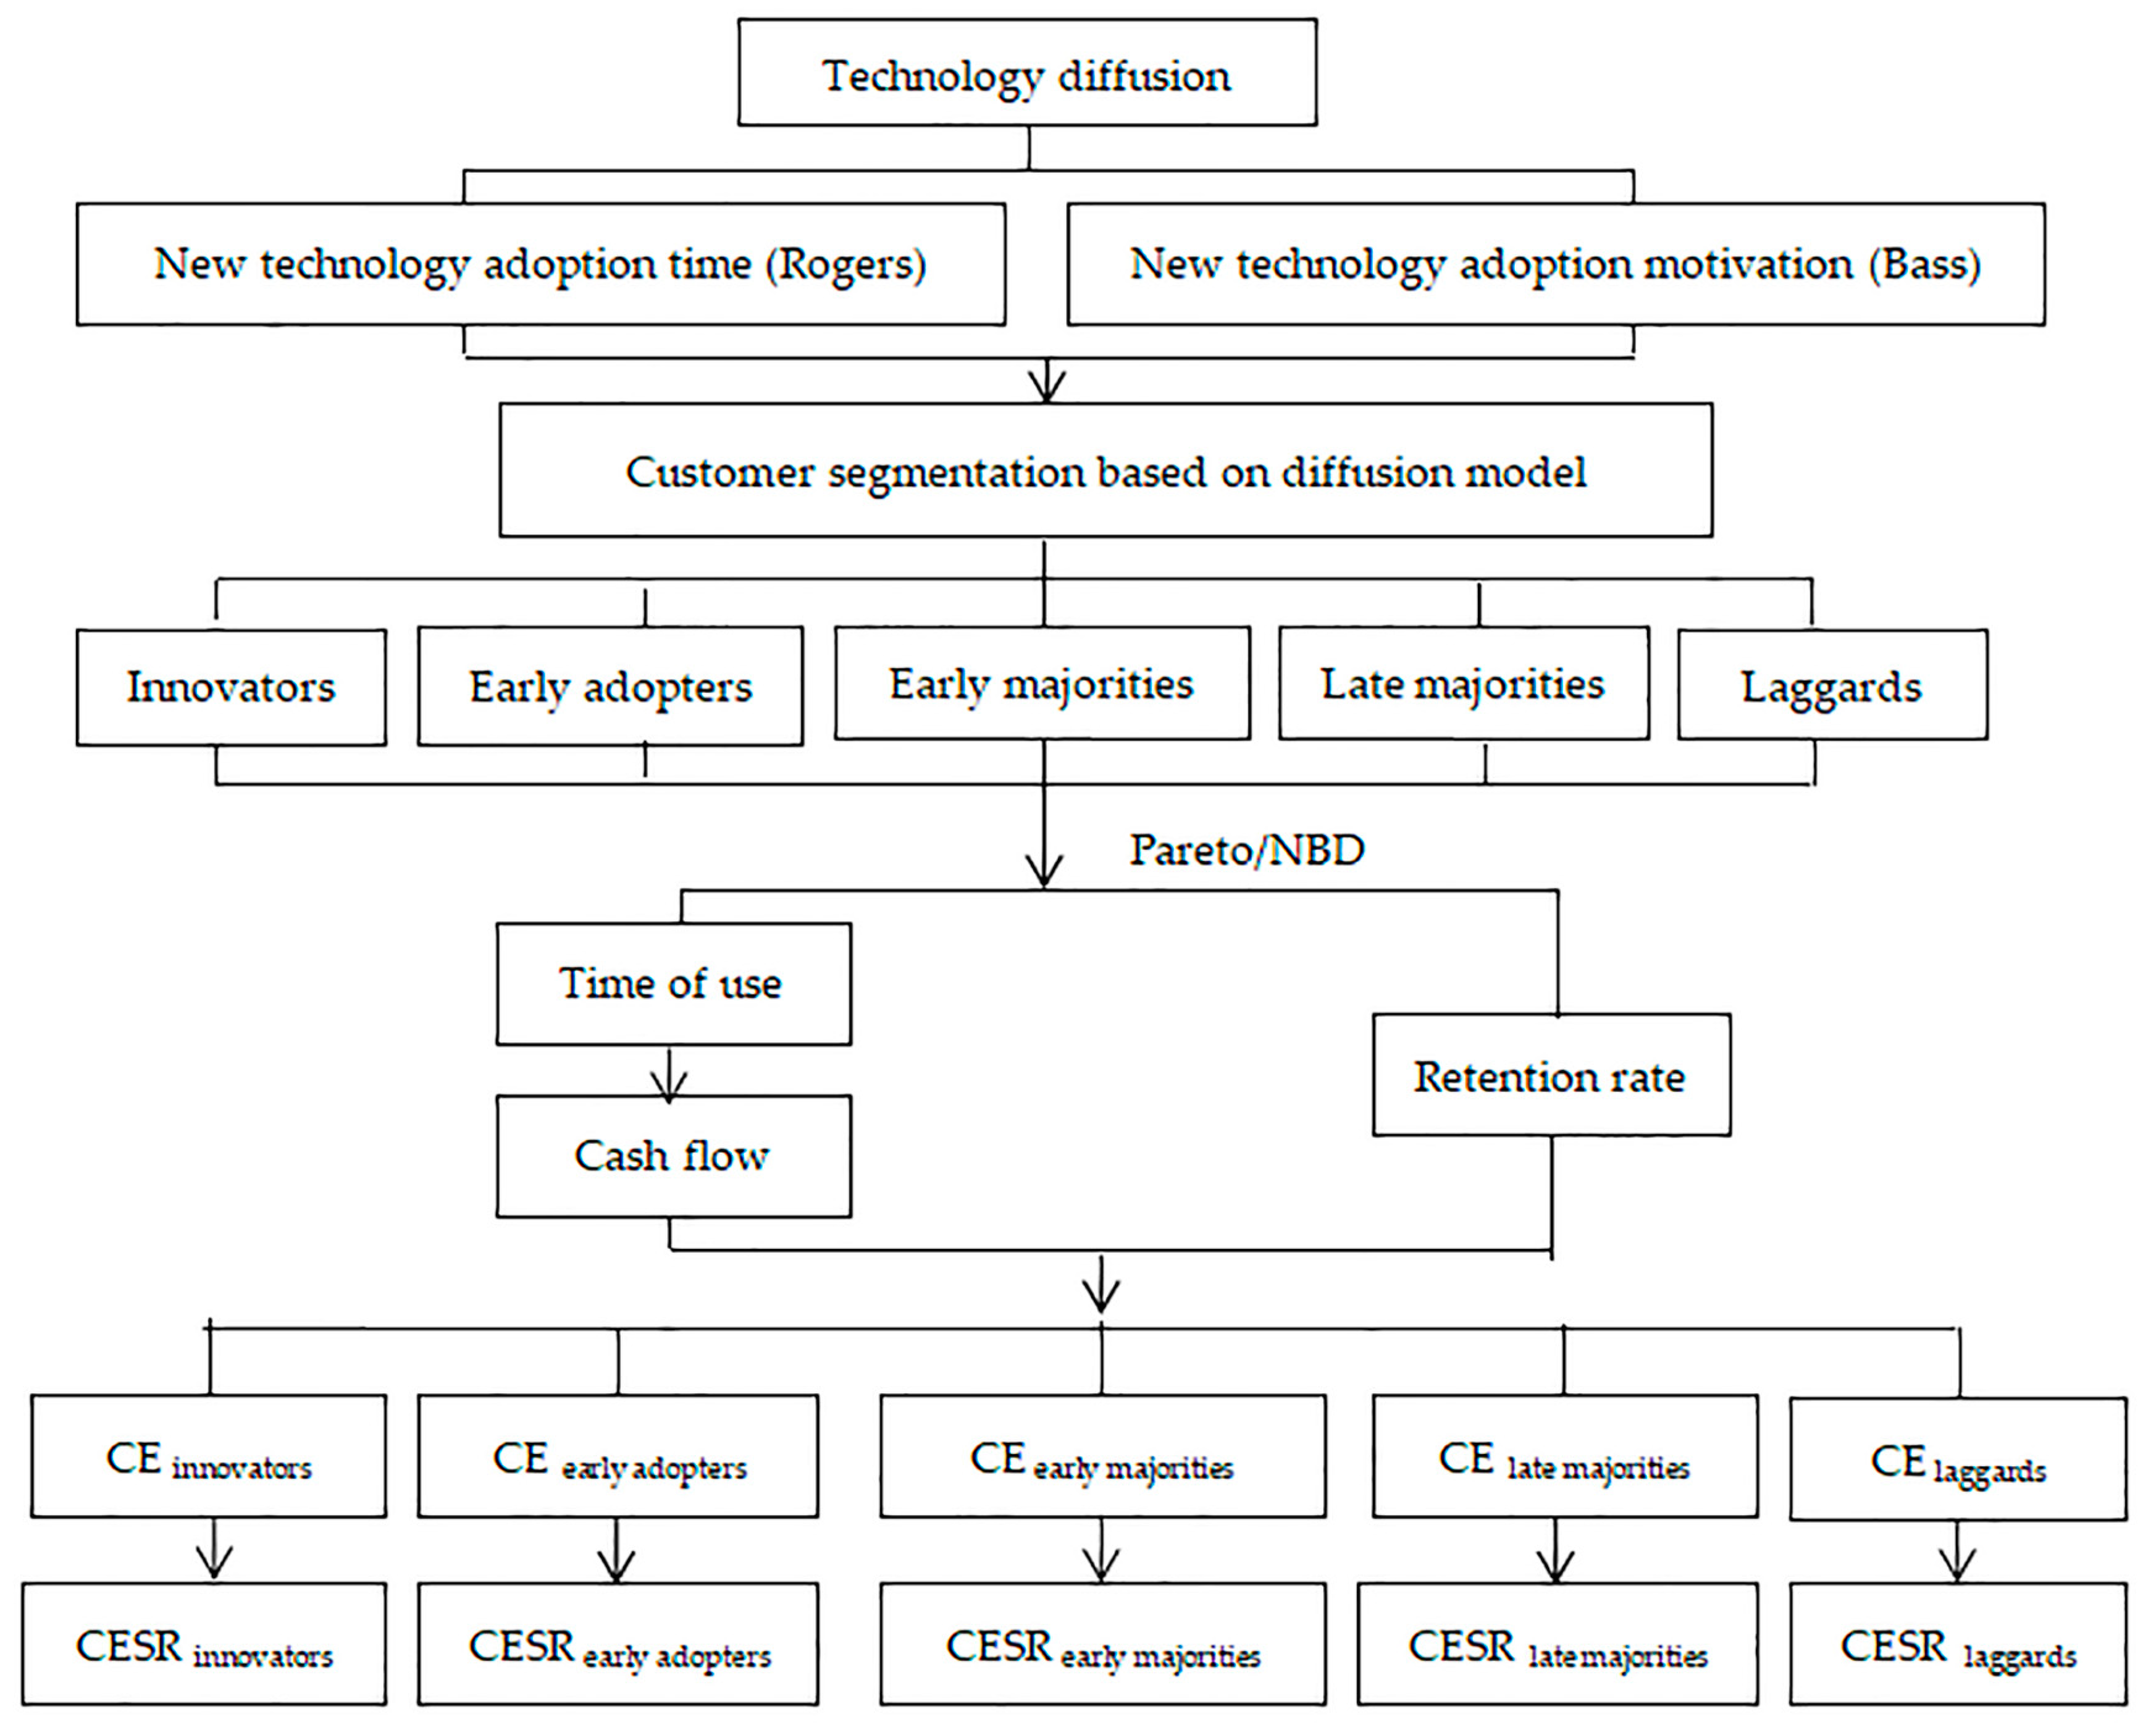
3.1. Customer Segmentation Based on a Diffusion Model
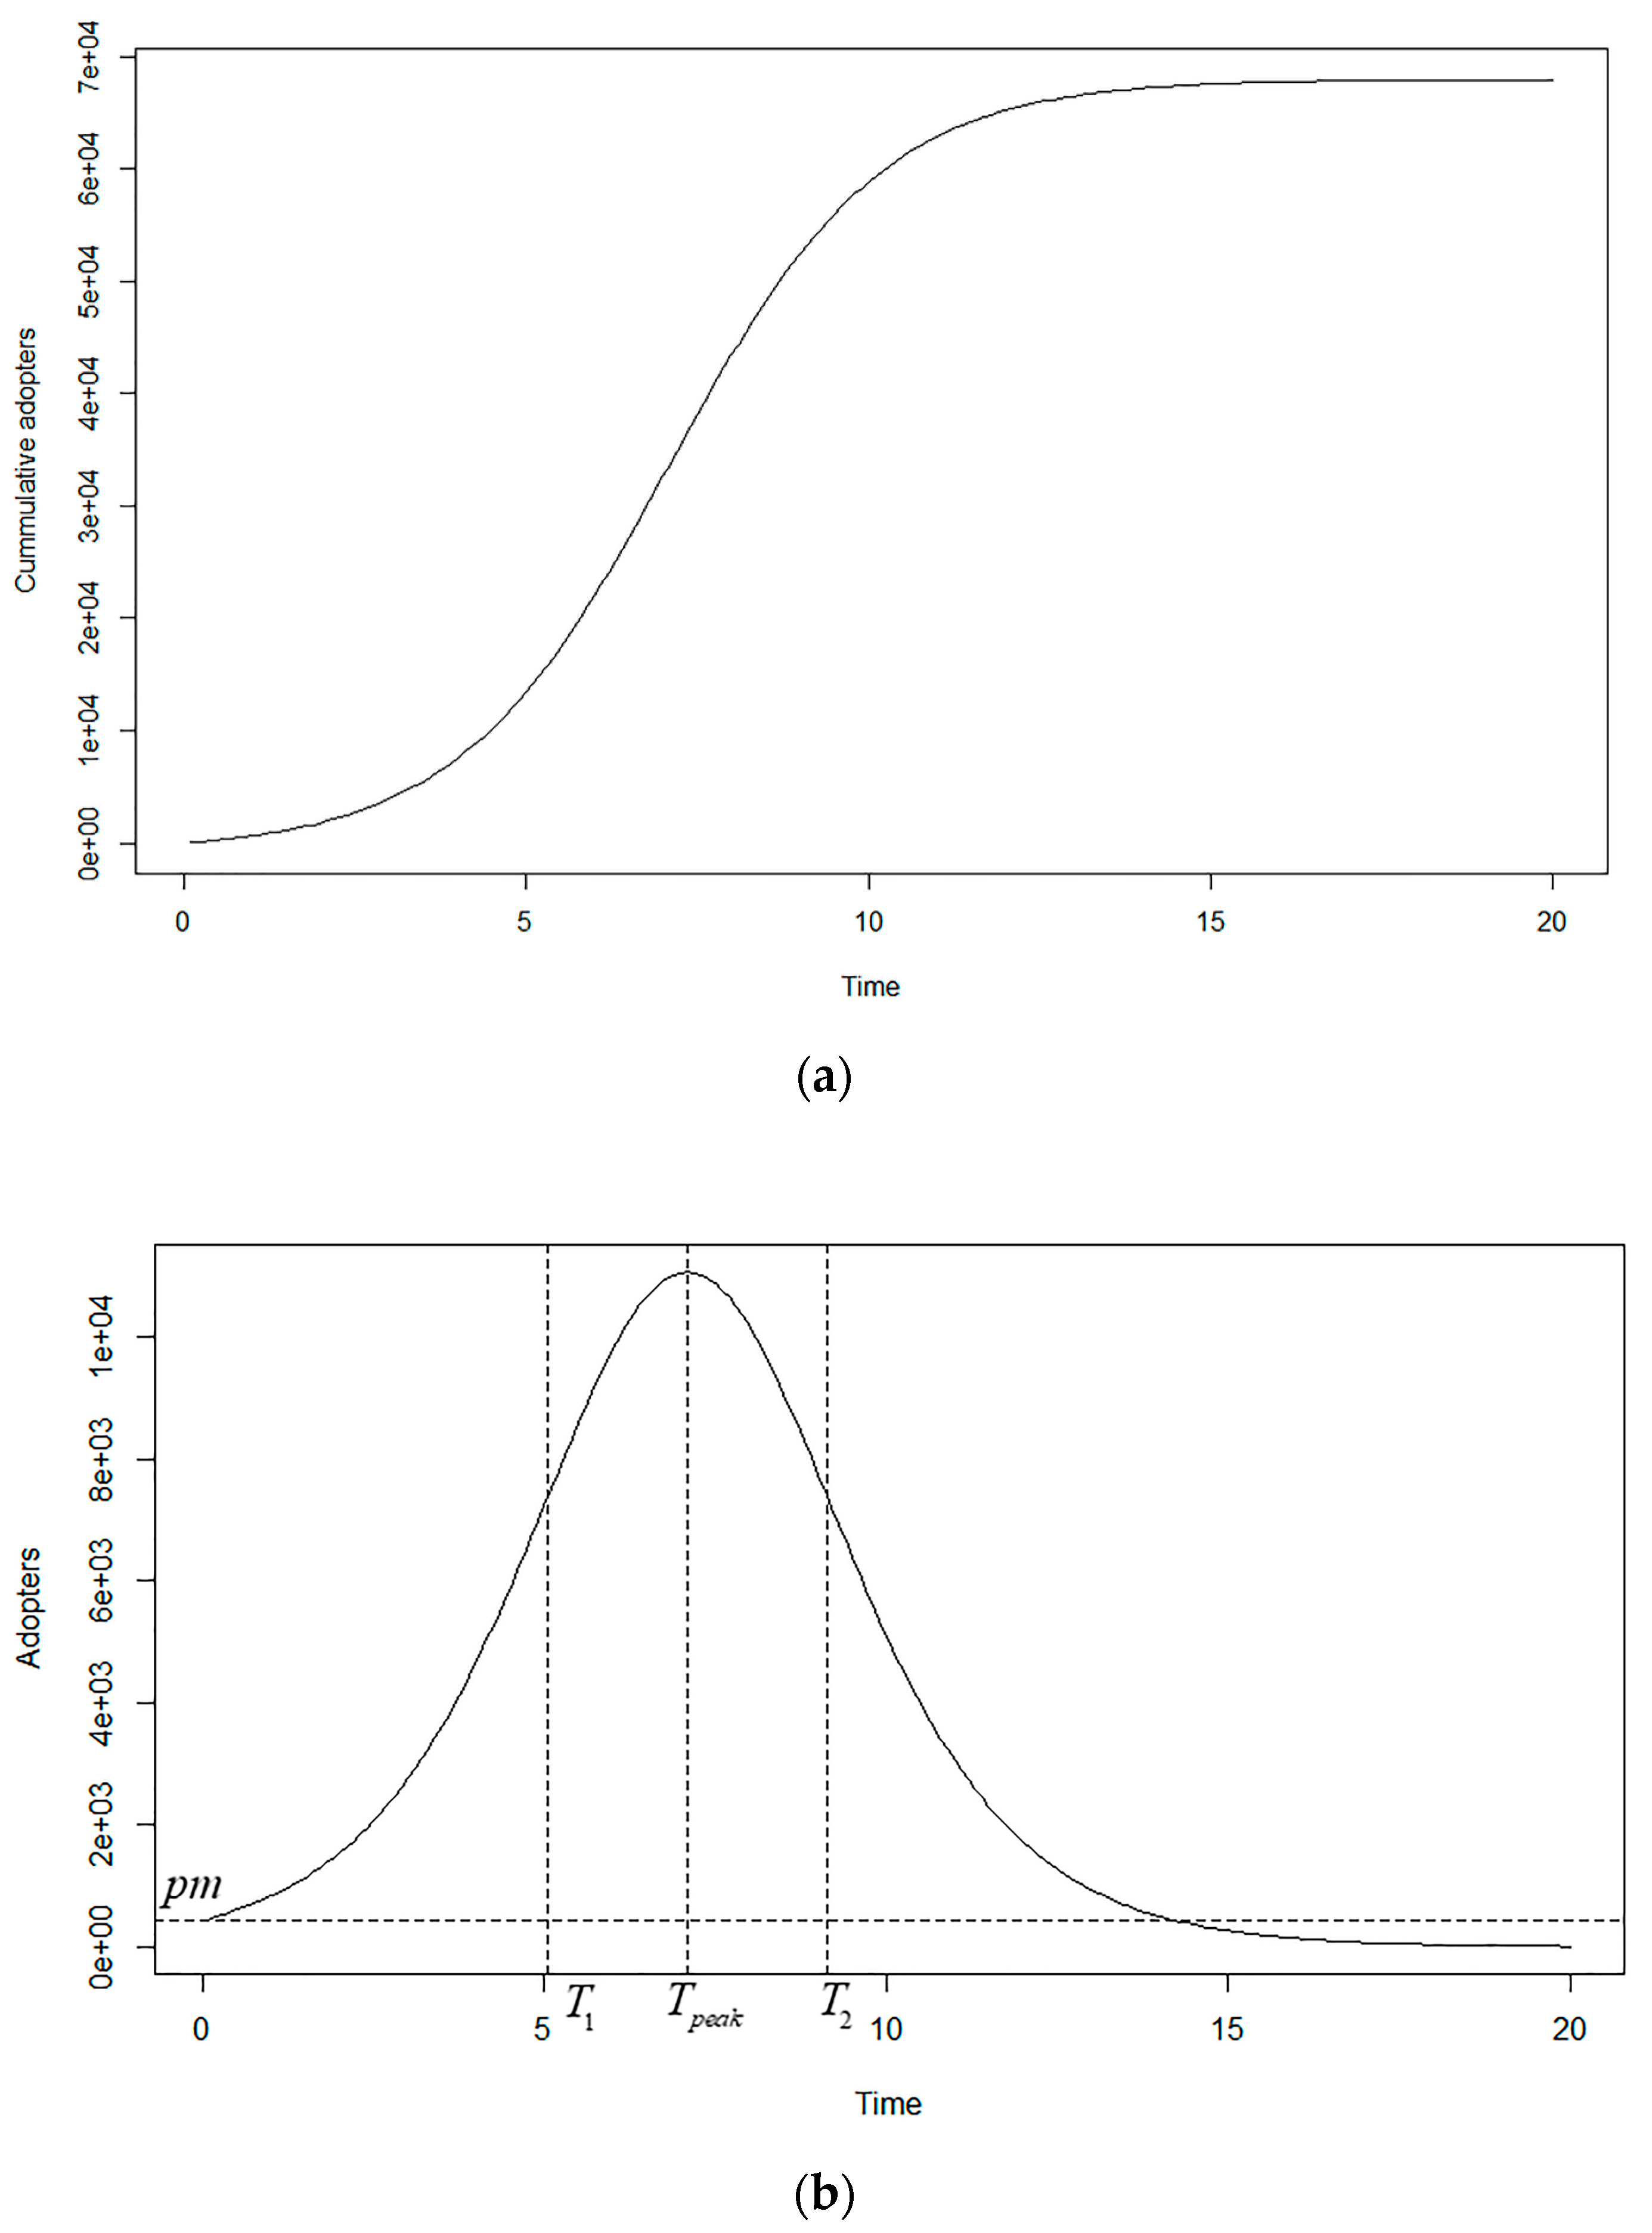
From the perspective of innovation diffusion, there are two aspects that need to be discussed, which are the time-point of adoption and the reason of adoption. On the one hand, the time-point that customers adopt new products or services tends to be different. Rogers [45] believed that the adoption time (t > 0) followed the normal distribution with an average of μ and a standard deviation of σ (expectation μ and standard deviation σ). He also proposed segmenting customers into five categories according to their adoption time; i.e., 0 < t < μ 2 σ for innovators (theoretical proportion of about 2.5%), μ 2 σ t < μ σ for early adopters (theoretical proportion of about 13.5%) μ σ t < μ for the early majorities (theoretical proportion of 34.0%), μ t μ + σ for the late majorities (theoretical proportion of about 34.0%), and t μ + σ for laggards (theoretical proportion of about 16.0%). On the other hand, the reasons why customers adopt new products or services differ. Bass [15] pointed out that the adoption of new products or services by customers mainly stemmed from external influence (e.g., mass media) and internal influence (e.g., interpersonal communication and imitation among customers). Customers who adopt new products owing to an external influence were innovators while those who adopt new products owing to an internal influence were imitators.
In view of the above two aspects, Mahajan, Muller, and Srivastava [46] believed that, firstly, the assumption that the time of adoption by customers followed the normal distribution was not necessarily applicable to all new products or services. Instead, the parameters of the adoption time distribution and the actual proportion of the five customer categories should be estimated according to the diffusion model and actual data; secondly, innovators not only appeared in the early days but probably at each stage of the diffusion process. The distinction between innovators and imitators does not depend on the adoption time but rather on the adoption motivation (i.e., an external or internal influence). Following the idea of Mahajan, Muller, and Srivastava [46], we estimate the number of potential customers and develop adopter categories by considering both the adoption time and adoption motivation.

3.1.1. Bass Model

Let Nt be the cumulative number of customers who adopt new products at time t and m be the total population of potential adopters. The difference equation of the Bass model is
N t + 1 N t = p ( m N t ) + q N t ( m N t ) / m ,
where p is the coefficient of innovation and q is the coefficient of imitation. The increase in the number of customers at t + 1 is derived from the following two groups.
Innovators among current potential customers ( m N t ) . The number of innovators depends on the coefficient of innovation, i.e., p. Obviously, pm is the number of first batch customers who adopt new products at time t = 0, and these customers are innovators in the sense of adoption time, which also correspond to the innovators proposed by Rogers. As the diffusion process continues, p ( m N t ) innovators will continue to emerge in subsequent periods, and Rogers classified these customers into other categories, such as early adopters. It is seen that innovators in the Bass model are not necessarily pioneers in terms of the adoption time. They are referred to as innovators because they make their adoption decision without being affected by interpersonal communication or customer imitation.
Imitators among current potential customers ( m N t ) . The number of imitators depends on the coefficient of imitation, i.e., q. It is obvious that the number of imitators at time t = 0 is zero. Imitators emerge in the following periods, together with innovators of the same period, forming the categories defined by Rogers.
The solution to the difference Equation (1) is N t = m 1 e ( p + q ) t 1 + q p e ( p + q ) t , which gives the cumulative number of adopters at time t. The cumulative distribution function F(t) is depicted by an S-shaped curve in Figure 1a and expressed as
F t = 1 e ( p + q ) t 1 + q p e ( p + q ) t ,
The probability density function is depicted by the curve in Figure 1b and expressed as
f t = p + q 2 e ( p + q ) t p 1 + q p e ( p + q ) t 2
The number of adopters at time t can, therefore, be calculated as S t = m f t = m p + q 2 e ( p + q ) t p 1 + q p e ( p + q ) t 2 and the time that the number of adopters peaks is expressed as
T p e a k = log q log p p + q
The cumulative number of adopters and the number of adopters at peak time are respectively expressed as F T p e a k = 1 2 p 2 q and f T p e a k = 1 4 q p + q 2 .
In Figure 1b the probability density function curve of the Bass model, the ordinate for the horizontal dashed line is pm, which refers to the innovators of Rogers. We can see that the distribution of the adoption time in the Bass model varies from the normal distribution that is proposed by Rogers [45].

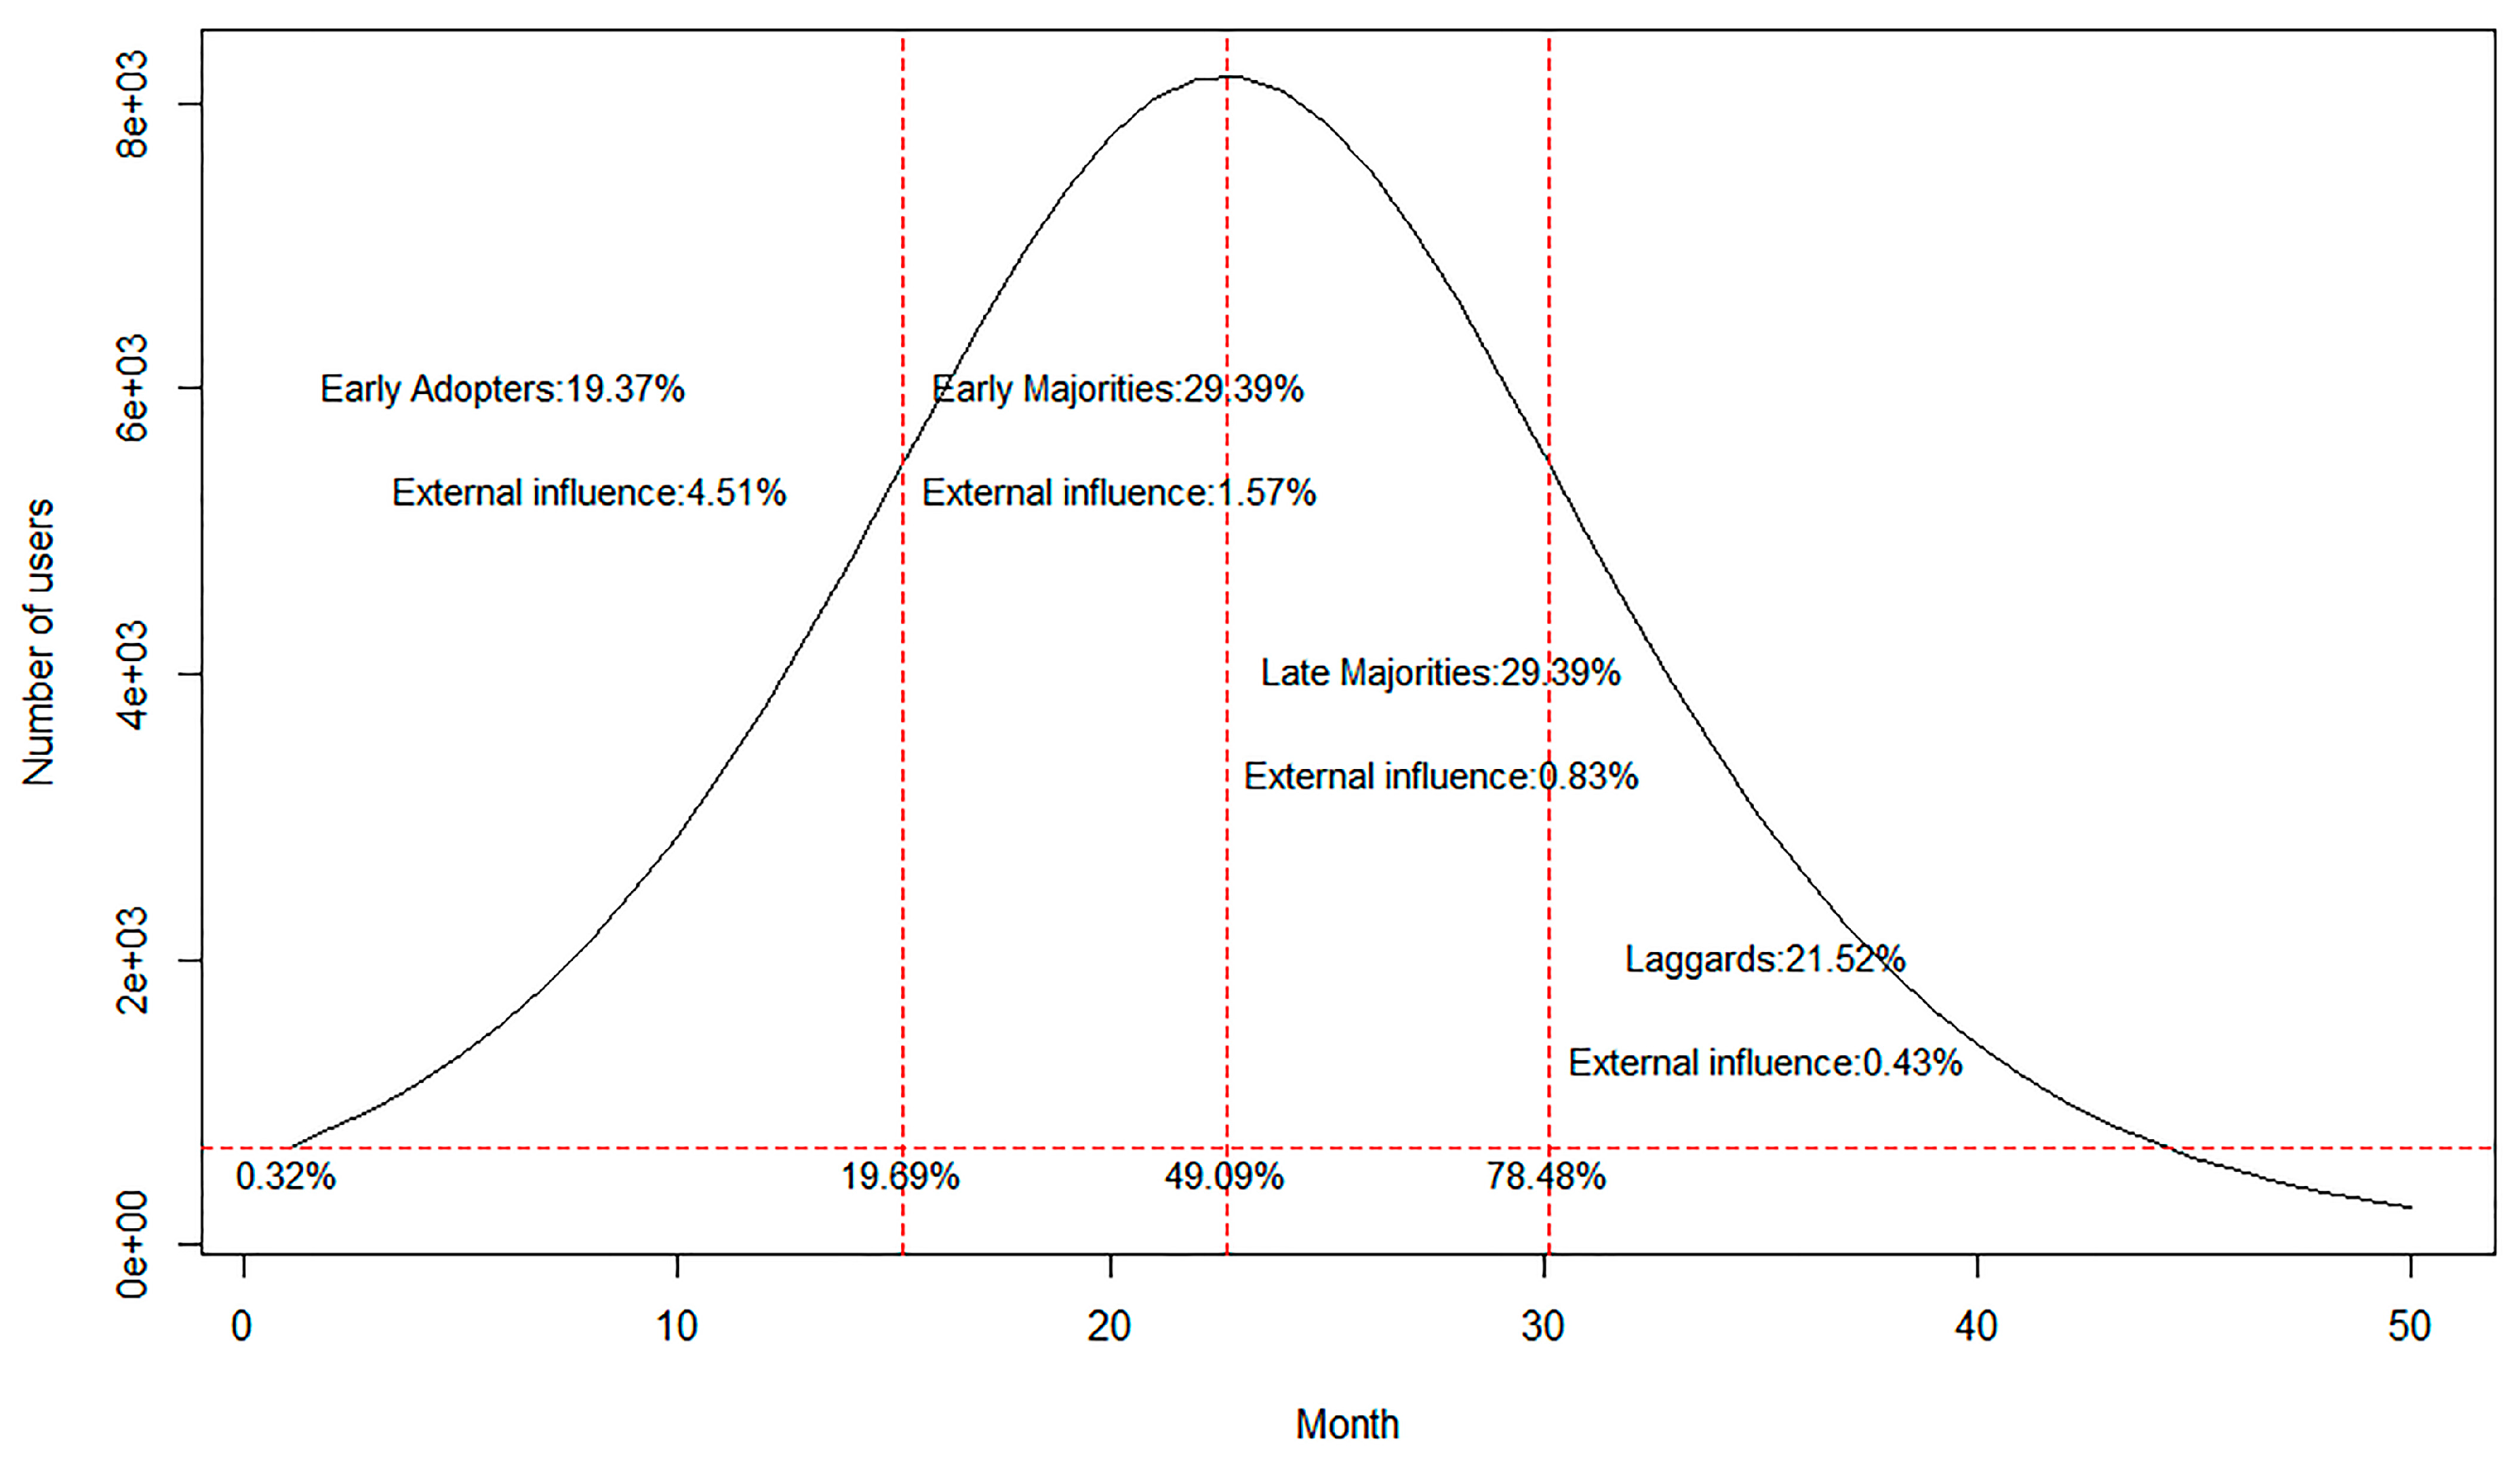
3.1.2. Bass Model and Adopter Categories Proposed by Rogers

The Bass model has helped to further develop Roger’s research on adopter categories. On the one hand, there are certain proportions of innovators and imitators among each adopter category classified according to the time-axis of Figure 1b (except at time t = 0). The consideration of both the adoption time and the adoption motivation can further enrich Rogers’ research on the five adopter categories. On the other hand, both curves in Figure 1a,b are affected by the innovation coefficient p and the imitation coefficient q. These two coefficients can be estimated from actual data, which means customers can be segmented as long as the corresponding relationship between Rogers’ four adopter categories (excluding innovators) and the time-axis in Figure 1b is identified. Additionally, the proportion of each customer segment can also be estimated, effectively expanding the applicability of Roger’s research.
Mahajan, Muller, and Srivastava [46] proposed that, as shown in cumulative distribution function curve and probability density function curve of the Bass model (Figure 1), the diffusion rate of the Bass model changes nonlinearly. Thus, according to the changes in the diffusion rate, i.e., the second derivative of f(t), four time intervals can be obtained, namely intervals of rapid growth, slow growth, slow negative growth to rapid negative growth, and rapid negative growth to slow negative growth, corresponding to the periods (0–T1), (T1Tpeak), (TpeakT2), and (T2–∞) respectively. In the case that d 2 f t d t 2 = 0 ,
T 1 = 1 p + q log 2 + 3 p q
T 2 = 1 p + q log p 2 + 3 q
The customers in these four-time intervals correspond to the early adopters, early majorities, late majorities, and laggards proposed by Rogers. Here,
F T 1 = F ( T p e a k ) 1 12 1 + p q
F T 2 = F ( T p e a k ) + 1 12 1 + p q
The proportions of the early adopters, early majorities, late majorities, and laggards are then F T 1 p , F T p e a k F T 1 , F T 2 F T p e a k and 1 F T 2 respectively.

3.2. Estimation of CE and CESR

3.2.1. Estimation of CE

Wiesel, Skiera, and Villanueva [6] proposed a method of calculating customer equity in contractual settings. Assuming the average cash flow C ¯ t and the retention rate of customers rt are constants that do not change with time t, that is, C ¯ t = C F and rt = r, d is referred to as the discount rate. Without considering marketing costs, customer retention costs and customer acquisition costs, the lifetime value of a single customer is C L V = t = 0 C F × r t 1 + d t = C F × r 0 1 + d 0 + C F × r 1 1 + d 1 + . It is the sum of an infinite geometric sequence in the case that r 1 + d < 1 and may be rewritten as C L V = C F × 1 + d 1 + d r . Thus, customer equity C E = N e n d × C F × 1 + d 1 + d r , where N e n d is the number of customers at the end of the period. In contractual settings, the retention rate r = 1 N c a n c e l N b e g + N e n d / 2 , where N b e g is the number of customers at the beginning of the period and N c a n c e l is the number of lost customers. Pfeifer [47] further improved the above method, firstly the author believed that new customers were immune to (initial) churn and the retention rate can be adjusted to the ratio of the number of retained customers to the number of customers at the beginning, that is r = N e n d N a d d N b e g , here, N a d d is the number of new customers; secondly, the author proposed that the replacement of the beginning of the period with the middle of the period as the time-point when there is cash flow appears more consistent with the actual situation. Then,
C E = N e n d × 1 1 + d 0.5 × r × C F × 1 + d 1 + d r
The estimation of the retention rate r is the key to the customer equity calculation. However, the above approach is only applicable to contractual settings and it is inappropriate to assume that all customers share the same churn rate. We thus believe in this paper that, firstly, the classic Pareto/NBD model can be used to estimate the retention rate in noncontractual settings; secondly, compared with modeling customers as a whole, the estimation of the retention rates of different customer segmentations can effectively reduce the estimation error caused by customer heterogeneity. The cash flow CF is directly observable in contractual settings. In noncontractual settings, however, cash flow depends on future purchase times and the single transaction amount, which can also be estimated using the Pareto/NBD model.

3.2.2. Estimation of CESR

On the basis of customer equity, Skiera, Bermes, and Horn [13] proposed the concept of the customer equity sustainability ratio (CESR). The CESR of customer i is defined as the ratio of his or her future CLV (t ≥ 1) to its total CLV:
C E S R i = t = 1 C F i × r t 1 + d t t = 0 T C F i × r t 1 + d t = 1 C L V i t = 0 C L V i ,
C L V i t = 0 is the CLV of customer i at current time t = 0. The customer equity sustainability ratio of all customers (total number N) is expressed as
C E S R = 1 i = 1 N C L V i t = 0 i = 1 N C L V i = 1 C E t = 0 C E
CESR takes a value between 0 and 1. A larger value indicates a higher future value of the customer and a greater growth potential. The customer only has a current value if the CESR is equal to zero.
It is believed in this paper that time t in the second term of Equation (11) can be extended to time j, which is more suitable for the actual problem, that is, C E S R = 1 i = 1 N C L V i t = j i = 1 N C L V i = 1 C E t = j C E . For example, if j is three months or half a year, the growth space for customers’ value after three months or half a year will be measured. Additionally, the customer equity sustainability ratio can be calculated separately for different customer segments, allowing comparison of the potential values of different customer groups.

3.3. Estimation of Customer Purchase and Retention Rates Using a Pareto/NBD Model

The Pareto/NBD model, proposed by Schmittlein, Morrison, and Colombo [16], is a classic probability model describing the future purchase behavior of customers in noncontractual settings and thus lays a solid foundation for the calculation of the lifetime value of noncontractual customers. The probability distribution is assumed as follows.
When a customer is “alive” (i.e., it maintains a transaction relationship with the firm), the customer’s number of purchases X in a period of time t follows a Poisson distribution with transaction rate λ:
P X = x | λ , t = λ t x x ! e λ t , x = 0 , 1 , 2 ,
1.
The time when a customer becomes “inactive” is exponentially distributed with churn rate μ. The probability density function is:
f t | μ = μ e μ t , t > 0
2.
There is a difference in the transaction rate of individual customers. The transaction rate λ across customers follows a gamma distribution. The probability density function is:
f λ | γ , α = α γ Γ γ λ γ 1 e α λ , λ > 0 , γ , α > 0
The expectation of transaction rate and variance are: E λ = γ / α and V a r λ = γ / α 2 respectively.
3.
There is a difference in the churn rates of individual customers. The churn rate μ across customers follows a gamma distribution. The probability density function is:
g μ | s , β = β s Γ s μ s 1 e β μ , μ > 0 , s , β > 0
The expectation of churn rate (retention rate = 1 − churn rate) and variance are: E μ = s / β and V a r μ = s / β 2 respectively.
4.
Transaction rate λ is independent of the death rate μ. The expected number of transactions from the initial transaction period T0 to the observation period T is therefore
E x T | γ , α , s , β , T = γ β α s 1 1 β β + T s 1
If a customer remains active in the future T * periods, the expected number of transactions E x T * | γ * , α * , s * , β * , T * can also be calculated according to Equation (16). Here, γ * = γ + x ,   α * = α + T ,   s * = s ,   β * = β + T .

4. Methodology

4.1. Research Framework
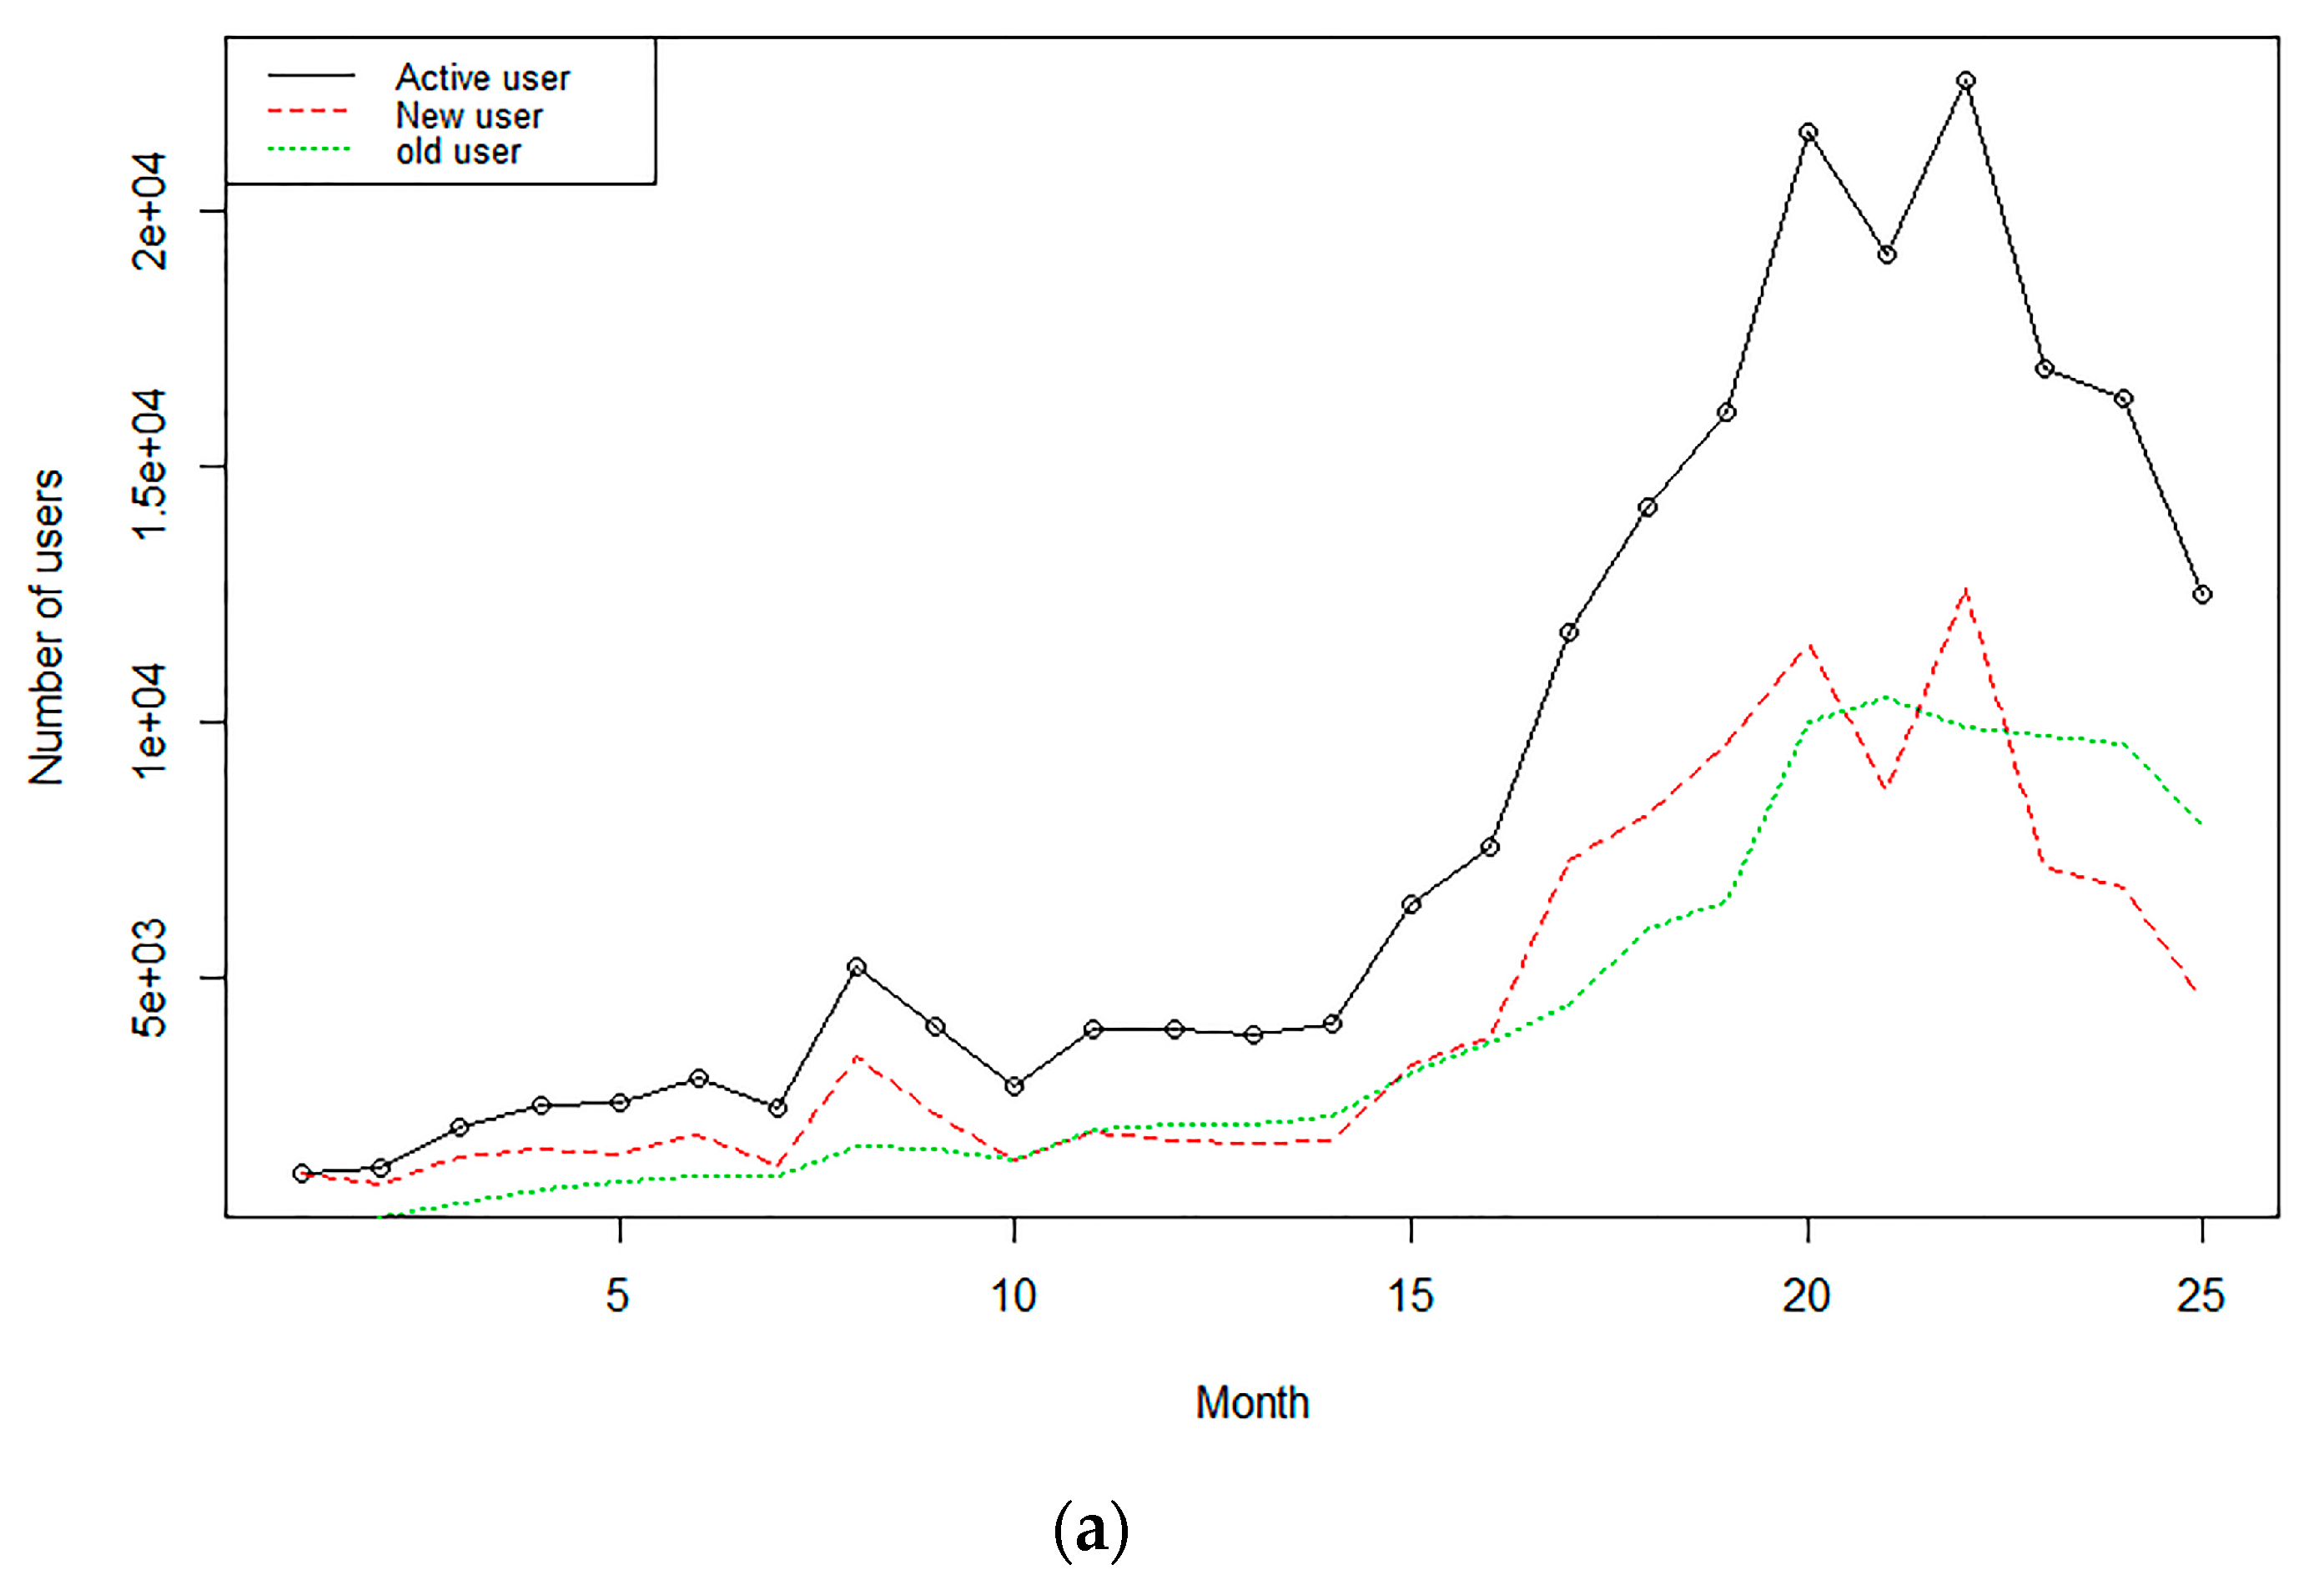
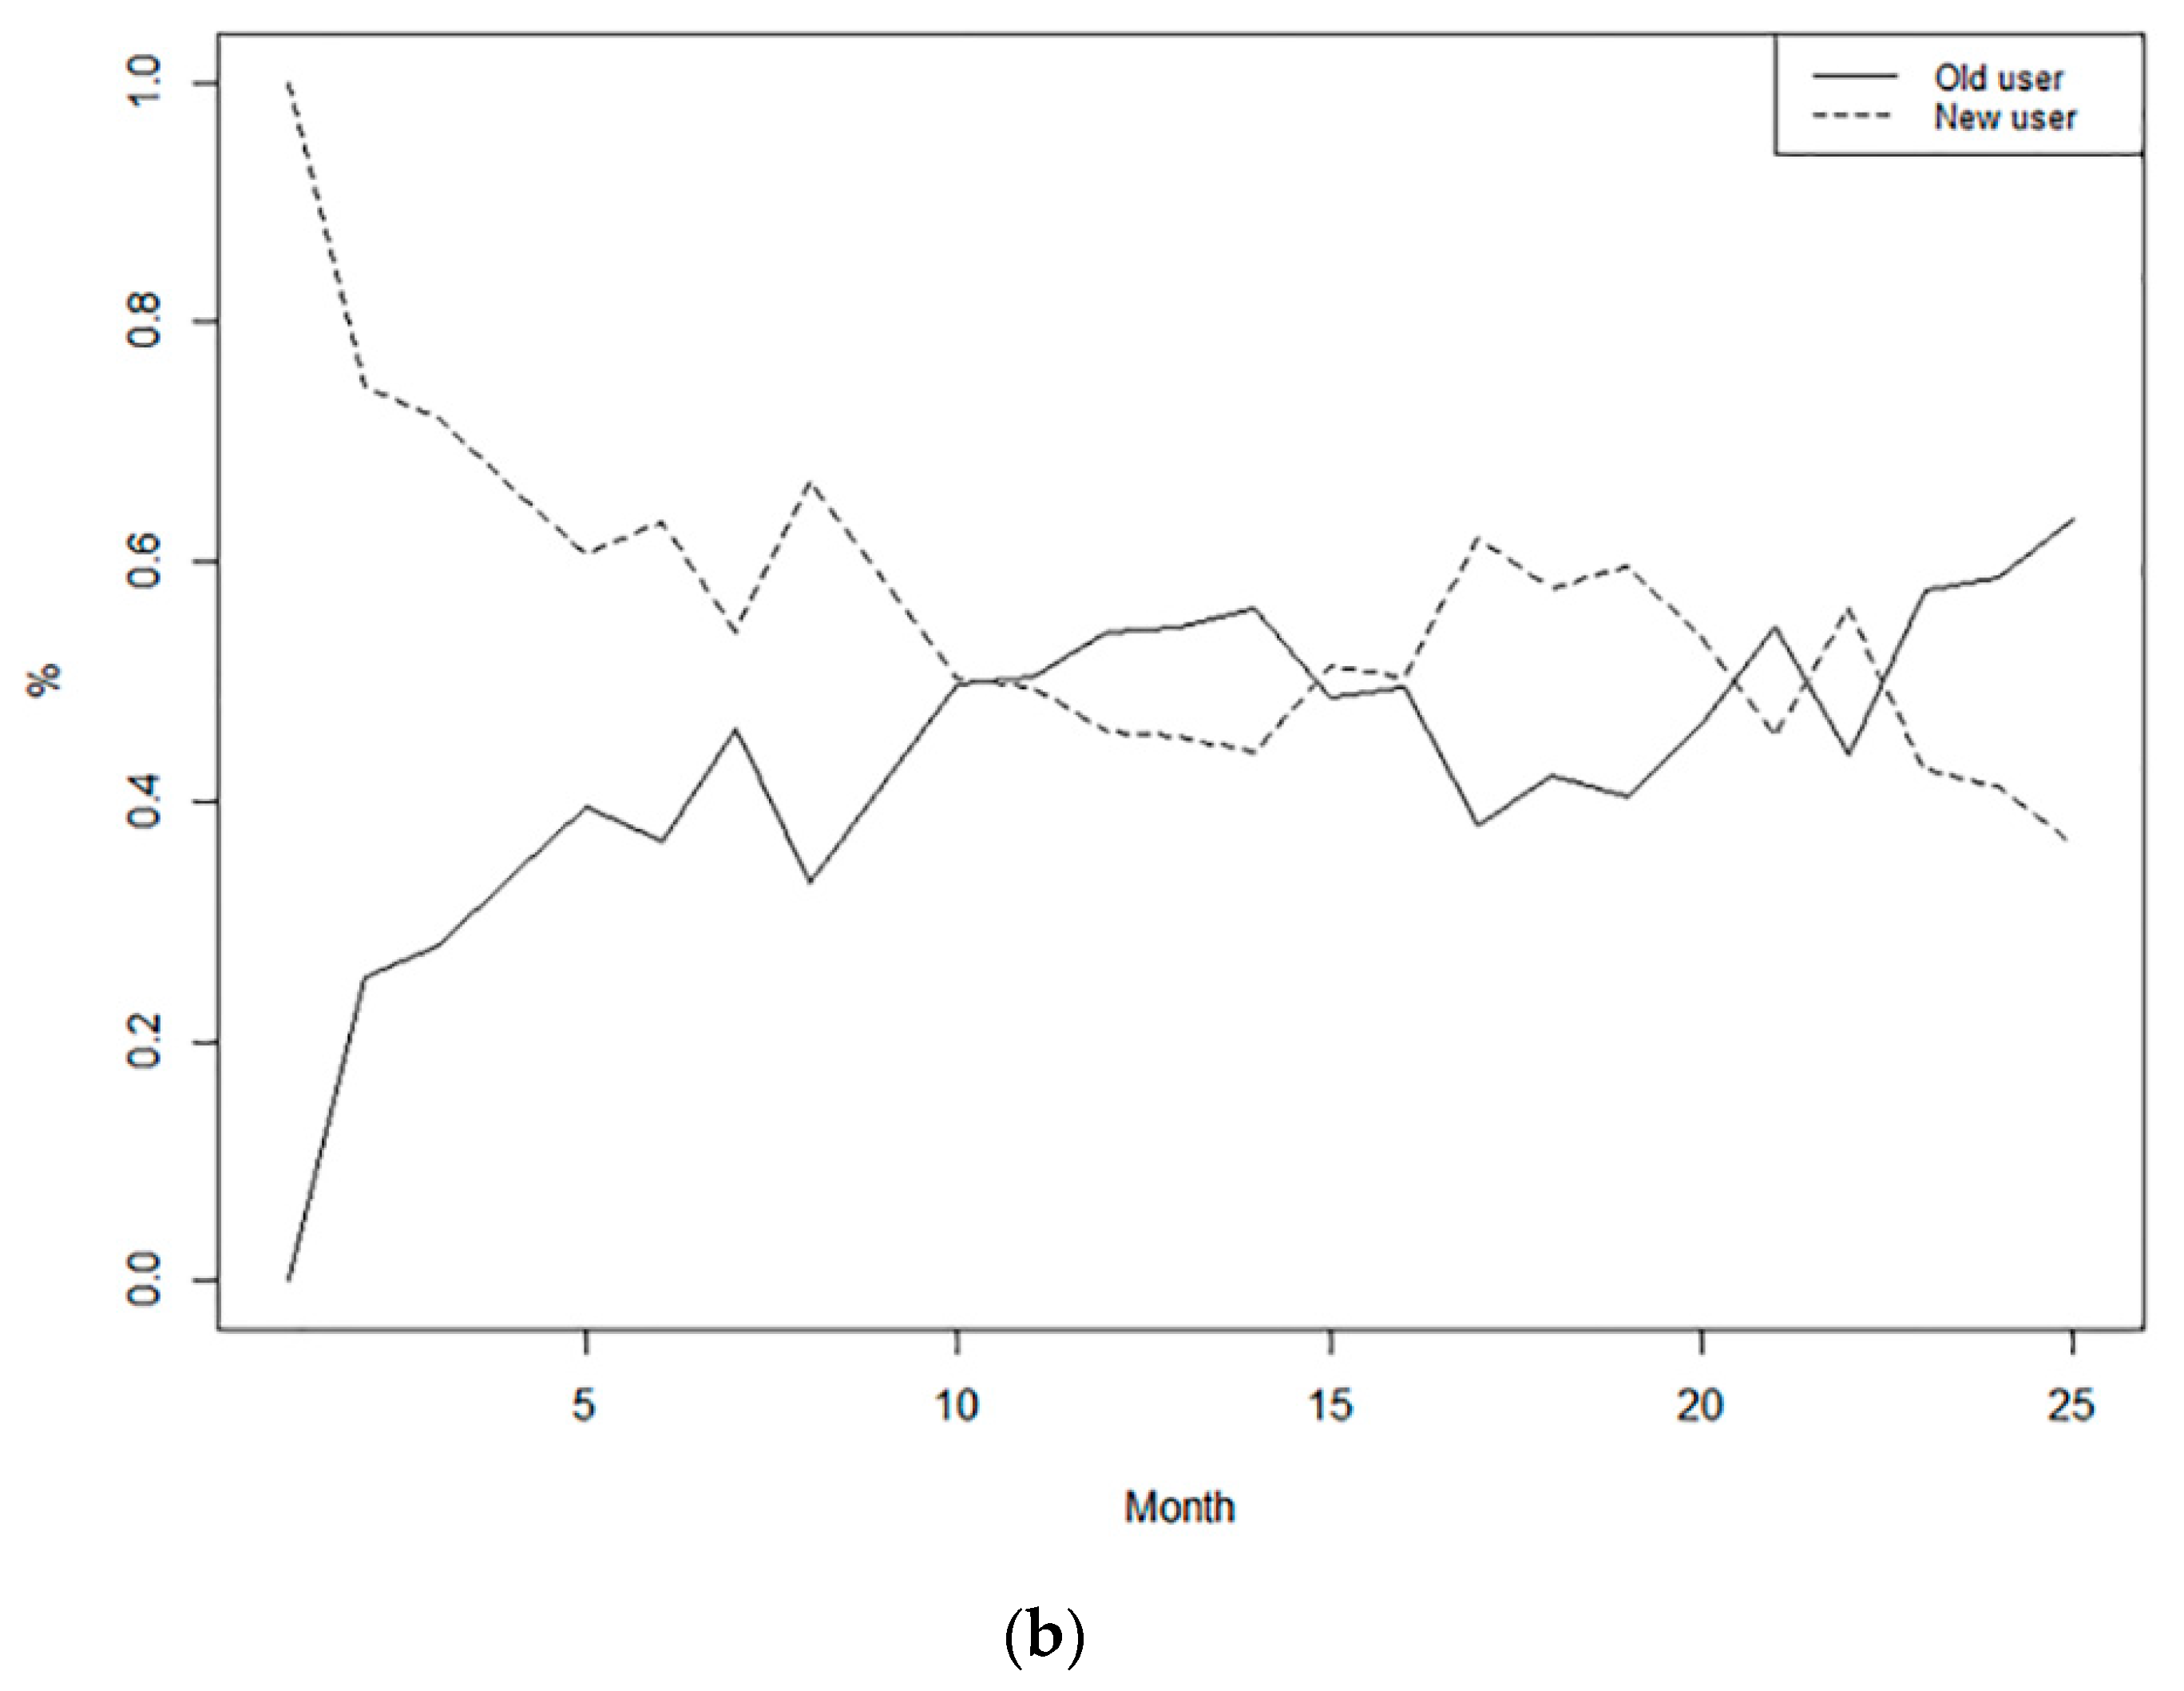
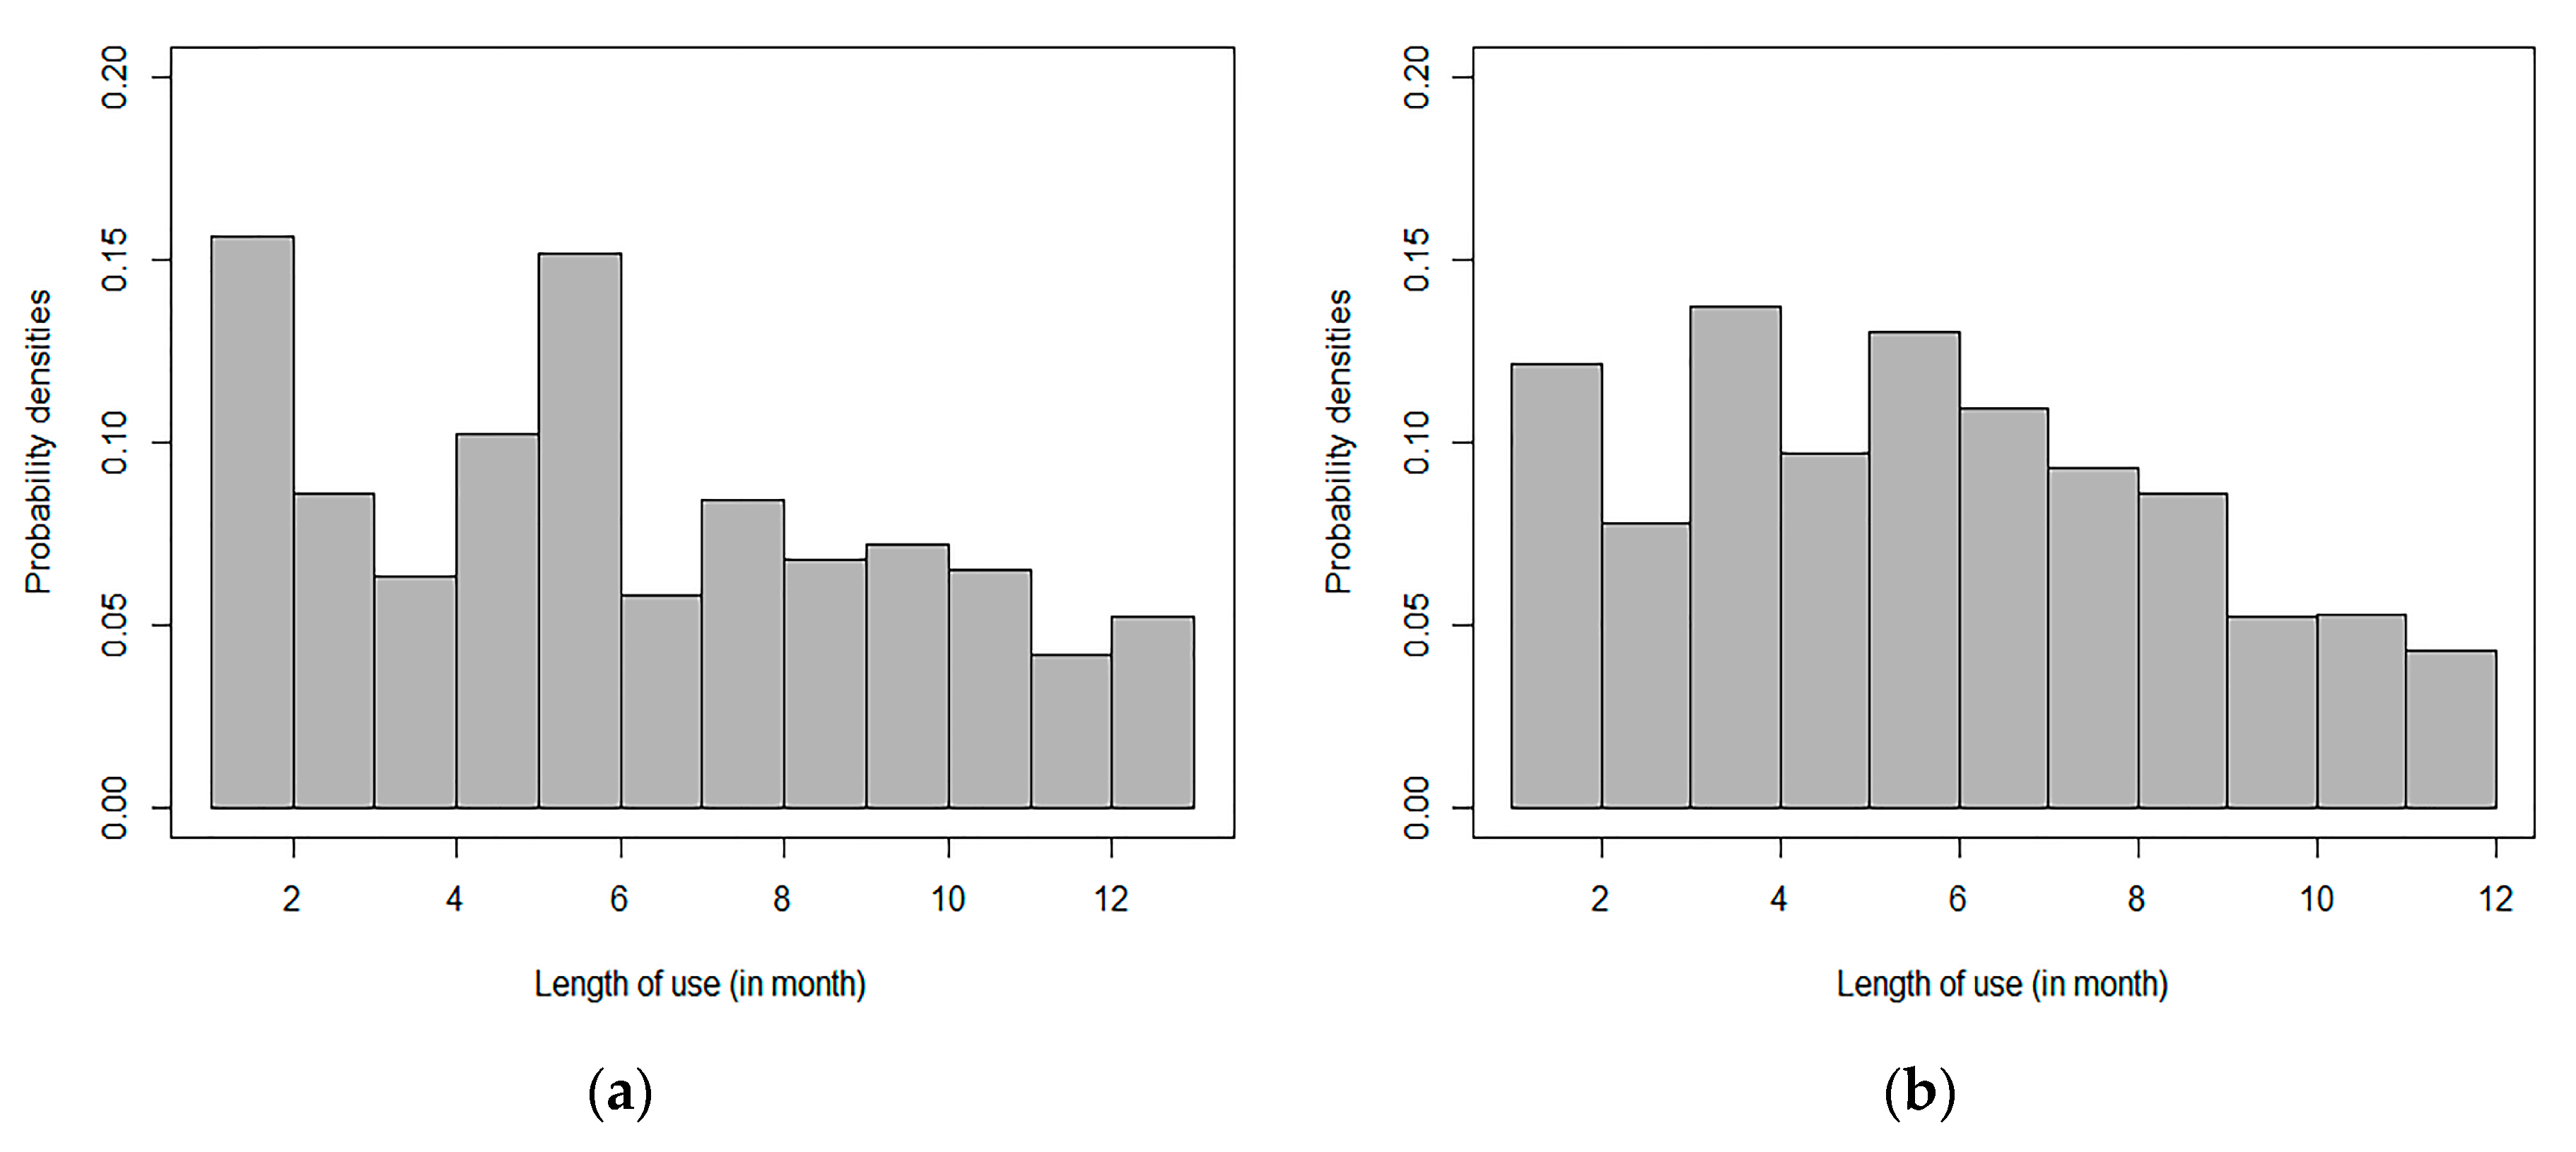
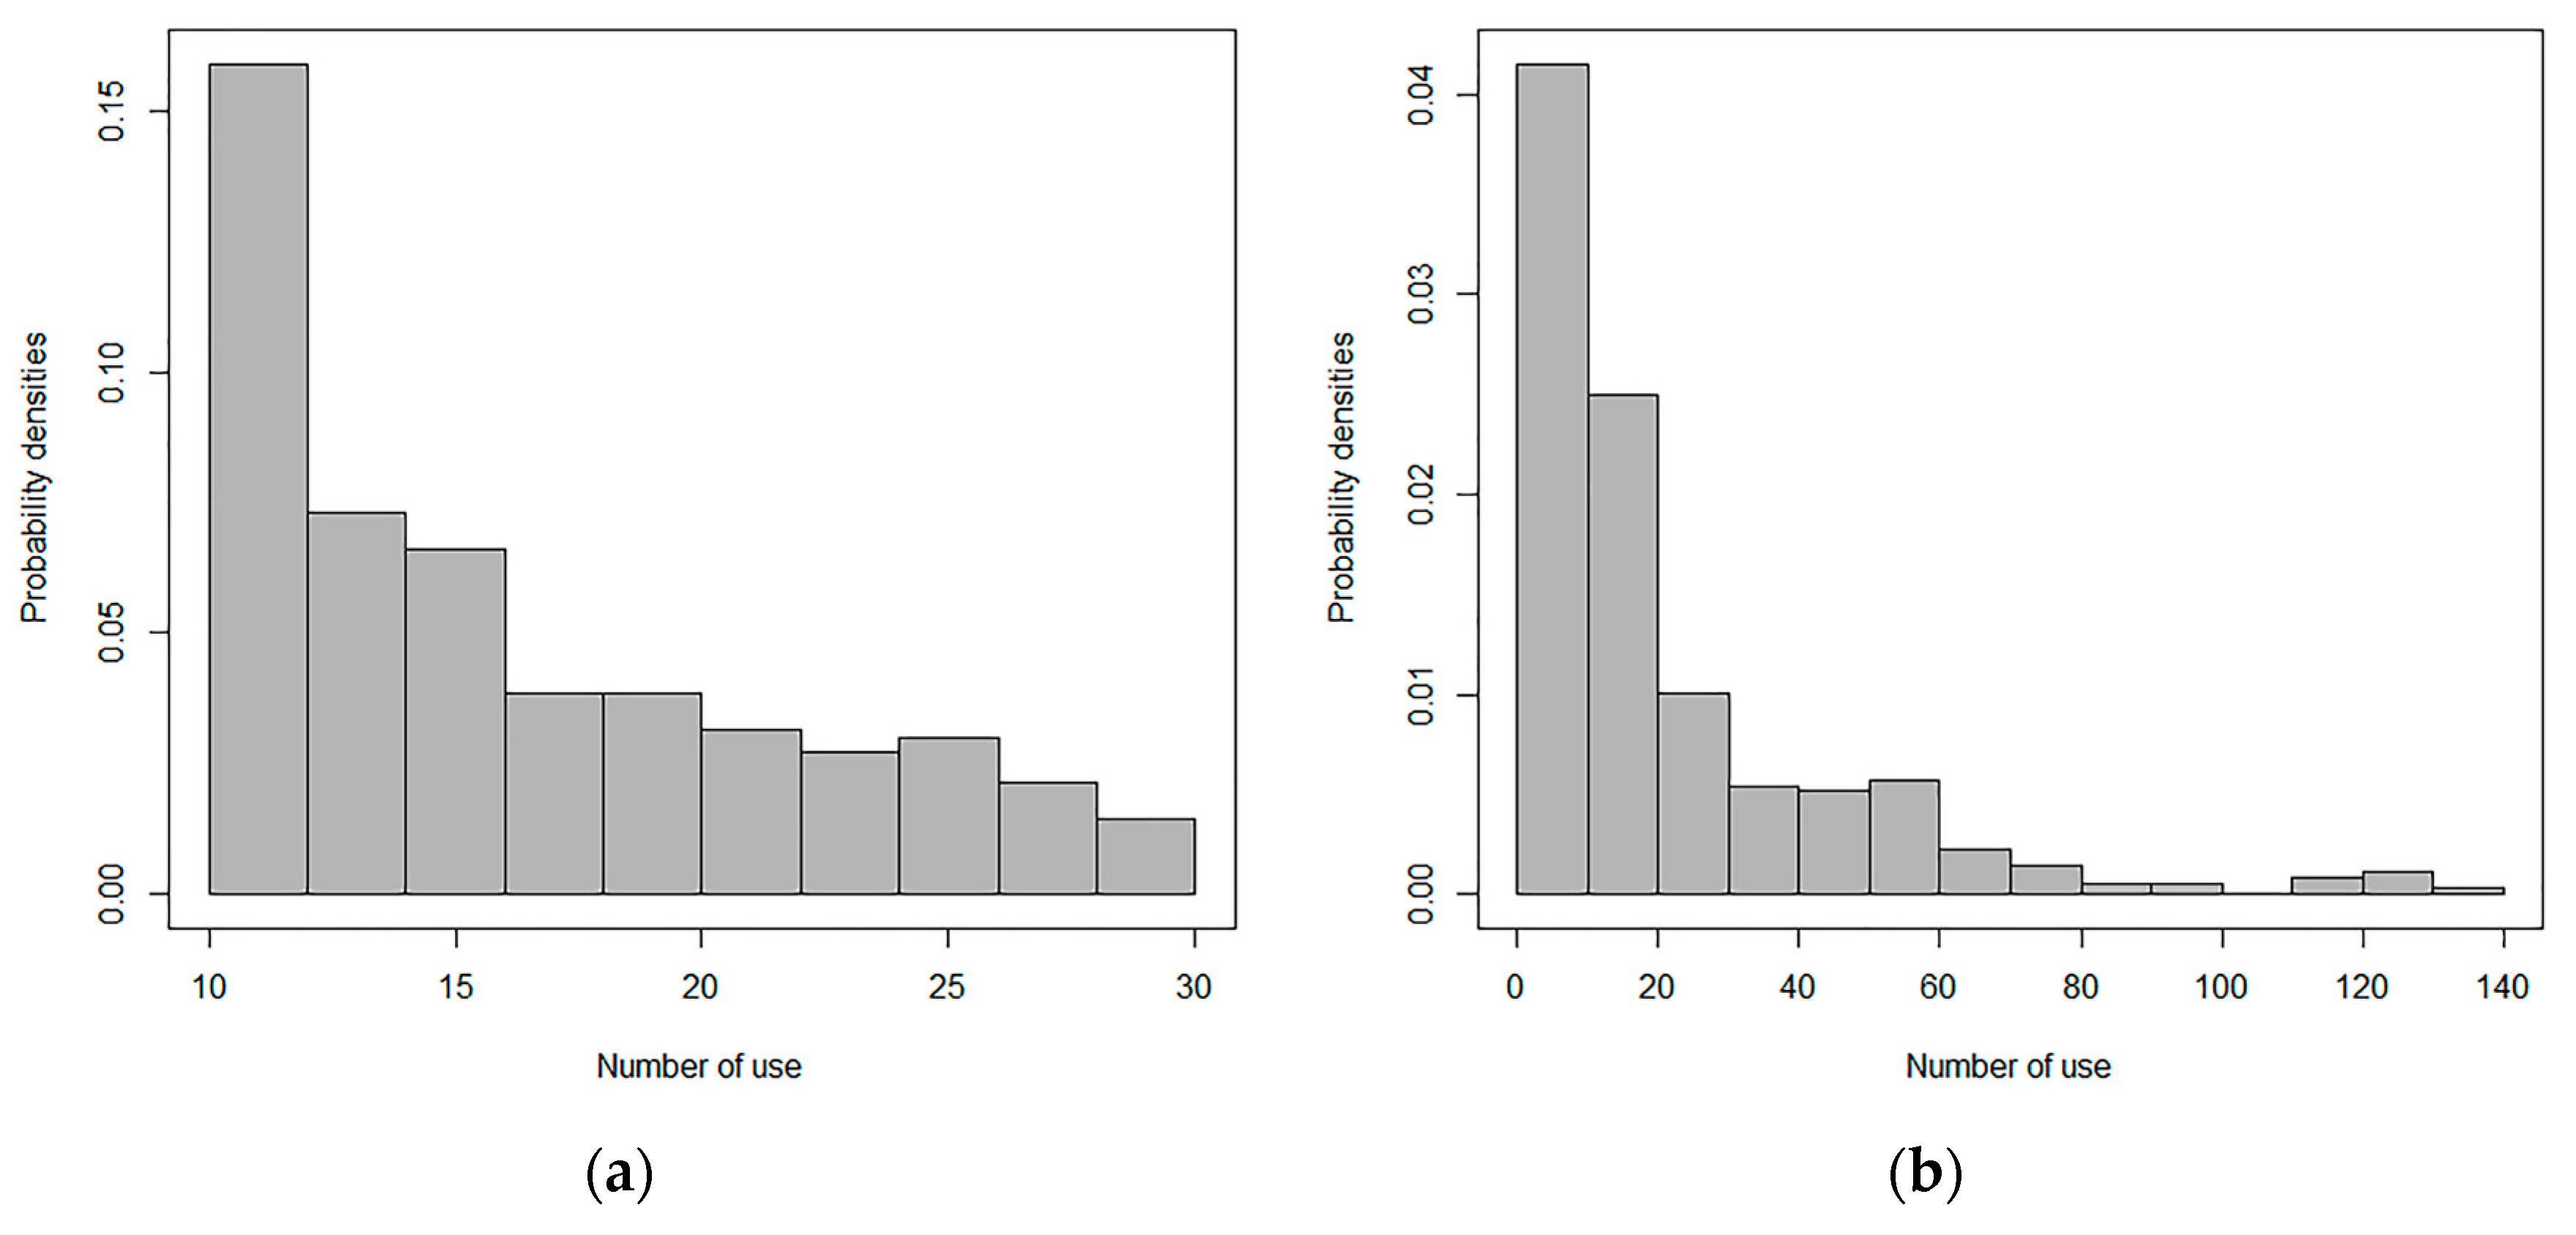
This paper explored the measurement of customer equity using a diffusion model. Since customer equity is the sum of the lifetime value of a firm’s current and potential customers, the following aspects were discussed in detail. Firstly, the number of potential customers in the future was estimated using the Bass diffusion model. Secondly, considering that customer heterogeneity may lead to huge measurement errors, customers were segmented into five categories according to their adoption time. Customers are usually segmented based on their demographic or psychographic characteristics. However, in this study, we used the adoption time of mobile payment as customer segmentation criteria. The reason is that the customer equity of this mobile payments aggregator generated from this specific retailer comes from the commission fee of each transaction, which is directly connected with the customers’ mobile payment behavior. Therefore, customers with a different adoption time will contribute differently to customer equity. Segmenting customers according to their adoption time and calculating customer equity based on these segmentations will make the prediction more accurate. Besides, it also allows us to further look into the profitability of each customer category segmented by a new technology acceptance degree. Understanding their behavior and profitability is very important when new technologies are emerging in an endless stream. Thirdly, on the basis of customer segmentation in step two, the classic Pareto/NBD model is used to explore the future purchasing behavior and retention rate of each customer segment. Finally, the short-term customer equity and lifetime customer equity of each customer segment were calculated separately. Additionally, the customer equity sustainability ratio of each customer segments was further calculated and the future development potentials of different customer segments were compared. The research framework is shown in Figure 2.

4.2. Data

The data used in our research come from a leading Chinese mobile payments aggregator that integrates various mobile payment methods and provides one-stop payment solutions for 130,000 offline retailers. Among these retailers, we chose the offline mobile payment data of a large-scale supermarket since the purpose of this paper was to calculate customer equity of this mobile payments aggregator generated from a specific retailer and further provide value added services to these retailers based on the calculation results. The data includes detailed records of customer payments made by scanning the code using a mobile device between May 2016 and May 2018, totaling 25 months, with 208,562 transaction data for 108,512 customers. The study was conducted on a monthly basis. We, therefore, combined the transactions of a customer in the same month, calculating the total number of purchases and monetary value of each customer per month. As we mentioned before, this period covered the stage in which mobile payments were gradually accepted and widely popularized in brick-and-mortar stores in China. This paper thus regarded the process of customers gradually adopting mobile payments during the 25 months as the diffusion of a new technology. During the data period, every month there are users joining and leaving, and the number of users, frequency of use and amount of payment changed to various degrees. Since the mobile payments aggregator receives a certain percentage of commission fee based on the amount of mobile payment made by the customers of the retailer, this paper hopes to measure the customer equity of the mobile payments aggregator generated from this specific retailer, not only helping the aggregator evaluate its future business development but also providing value-added service to it client, i.e., the retailer. A line chart showing the change in the number of users per month is shown in Figure 3.
As shown in Figure 3a the change in the number of users and the number of new users slowly grew in the first 10 months, rapidly grew in the 15th to 22nd months, and then grew more slowly from the 23rd month. A total of 108,512 new users were added during the 25 months. The trend of active users was basically similar to that of new users. According to Figure 3b the change in the composition of users, the proportion of new users was initially higher than that of old users. The subsequent period witnessed an alternating change of high and low proportions. After the 23rd month, the proportion of old users was higher than that of new users. A total of 100,050 users were retained during the 25 months.
To further observe the customers’ use of mobile payment, the data were roughly divided into two stages, each of which lasted about 1 year. The first stage is from May 2016 to May 2017, totaling 13 months. The second stage is from June 2017 to May 2018, totaling 12 months. In Figure 4 the length of use shows distributions of the length of use for the two stages.
In Figure 4a the distribution of the length of use in the first stage from right to left shows that in the first stage, about 6% of users began to adopt mobile payment in the very early stage of the diffusion process of mobile payment and they had a use history for more than twelve months. The proportion of new users did not change much in the following months. The eighth month witnessed an increase of 15%. The reason is that the mobile payments aggregator together with the retailer made sales promotion during the Double 12 shopping festival. The number of new users then dropped and rose again, by about 15%, during the eve of the May Day Holiday the next year. In Figure 4b the distribution of the length of use in the second stage from right to left shows that the monthly number of new users continued to grow steadily and slightly, and then dropped after the Double 11 and Double 12 shopping festivals. It then peaked around the Spring Festival because of the sales promotion.
Figure 5 presents the distribution of use frequency, i.e., the number of uses, of customers sampled randomly from the users in the first stage. The figure shows that, for users who began making mobile payments in the first stage, most of them made mobile payments fewer than 20 times during the first stage, while only a small number use mobile payment frequently. In the second stage, most of these randomly selected users made mobile payments fewer than 30 times, and only a few of them made mobile payments more than 30 times, showing that there was no obvious change in the behavior of these randomly selected users.

5. Empirical Results and Analysis

5.1. Parameter Estimation for the Bass Diffusion Model

May 2016 is regarded as the starting point for technology diffusion in this paper. The users of this month are not only innovators proposed by Rogers, but also innovators in the Bass model. We took the monthly cumulative number of new users as modeling data and use nonlinear least square method and genetic algorithm (GA) respectively to estimate the parameters of the Bass model. The nonlinear least square method implements the Taylor expansion of the model and estimates the model parameters according to the minimum sum of squared errors. As a representative of the time-varying estimation method, the genetic algorithm has gradually become the main method of parameter estimation of the Bass model due to its flexibility and relatively small sample size. According to Venkatesan and Kumar [48], the GA estimation of the Bass model is better than the nonlinear least square estimation for small samples. Figure 6 shows the comparison between the fitted values of the two estimates and the actual cumulative number of new users.
In Figure 6, the fitted lines obtained using the two estimation methods basically coincided with each other. Overall, the fitted values of the two models were lower than the actual value in the early stage, higher in the middle stage, and lower again in the late stage. This deviation is directly related to the fluctuation of users caused by the sales promotions during the Double 11 and Double 12 shopping festivals, May Day Holiday, Spring Festival, and other holidays. On the whole, the estimation of the two models fit the actual number of users. The mean square error (MSE) of the nonlinear least square estimation was 2113.545 while MSE of the GA estimate was 1893.29. The GA estimate was thus adopted.
In the GA estimation, the estimated values of the innovation parameter p, the imitation parameter q and the total number of users m were respectively 0.0032, 0.1734, and 182,343, and the number of new users peaks in the 22.4th month (around the Spring Festival of 2018). We can see that the innovation coefficient p was relatively small and imitation coefficient q was relatively large, which indicates that most users adopted mobile payments owing to interpersonal communication and imitation among people.

5.2. User Segmentation Based on the Diffusion Model

On the basis of the above Bass model parameter estimation, two important time points T1 and T2 were first calculated to be 15.2 and 30.2 respectively using Equations (5) and (6). These time points respectively differentiate the early adopters from the early majorities and the late majorities from the laggards. The proportions of the five user categories were then calculated according to Equations (7) and (8). Finally, the proportions of innovators and imitators in each category were calculated. Figure 7 shows the user segmentation.
In Figure 7 user segmentation, the dotted line parallel to the horizontal axis represents the number of innovators, who are the first batch of mobile payment users. The innovators accounted for 0.32% of the total users, having an actual number of 1208. The three vertical dotted lines represent the time points used to classify early adopters, early majorities, late majorities, and laggards. According to Figure 7 user segmentation, users who adopted mobile payments before the end of July 2017 (i.e., about 15 months after May 2016) are early adopters, accounting for 19.37% of the total users and having an actual number of 27,007. Among them, 4.51% were innovators and 95.49% were imitators. Users who adopted mobile payments from August 2017 to late February 2018 (i.e., month 15th to 22nd after May 2016) are the early majorities, accounting for 29.39% of the total users and having an actual number of 61,783. Among them, 1.57% were innovators and 98.43% were imitators. In Figure 7 user segmentation indicates that as of the end of February 2018 (i.e., the peak time), new users accounted for 49.09%. Users who adopted mobile payment from March 2018 to the end of October 2018 (i.e., from the 23rd month to around the 30th month) were the late majorities, with 0.83% being innovators, and users who adopted mobile payment after November were laggards, with 0.43% being innovators. The user proportions of the two categories are respectively 29.39 and 21.52%. The number of the late majorities was 18,514. Subsequent users were classified into the late majorities and laggards according to time points. By the end of the 50th month, there will be a total of 182,343 users making payments by a mobile device.

5.3. Modeling Customer Behavior Using a Pareto/NBD Model

A Pareto/NBD model was used to estimate the use frequency and the retention rate for the five user categories. Due to the limited time span of the data, the late majorities and laggards were binned in the parameter estimation. According to Schmittlein and Peterson [29], a two-step method of the moments estimation was used to estimate Pareto/NBD model parameters.
In the first step, we chose Tm. For all customers making an initial use at least Tm time units ago, we chose γ / α , s , β to minimize
T = 1 T m E x | γ / α , s , β , T x ¯ T ( T m ) 2
where x ¯ T ( T m ) is the average number of uses for each user from the initial month T0 to the current month T.
Second step, estimate γ , α according to the estimated value of γ / α in the first step. For each T = 1 , 2 , , T m we chose α ^ T to equate V a r x | γ , α , s , β , T with V a r x T T m where V a r x T T m is the variance across customers in the number of uses from T0 to T. Average these estimates to obtain α ^
α ^ = 1 T m T = 1 T m α ^ T
Based on the estimation of model parameters, the expected value of the number of uses in the following month was calculated using Equation (16). The results of parameter estimation are given in Table 2.

5.4. CE and CESR Calculation

5.4.1. Calculating Customer Equity of Current Users

First step, estimate the monthly cash flow of a single user for each user category. This paper defines the cash flow of user category k as C F k = F k × M k × s , where F k is the estimated number of uses per month for category k, M k is the estimated average amount of each payment (i.e., the total payment made by category k divided by the total number of payments in this category), and s is the commission fee for the transaction (generally assumed to be 0.3% of the transaction according to industry practice). The calculation result shows that the monthly cash flows of a single user classified as an individual innovator, early adopter, early majority, and late majority were respectively RMB 0.45, RMB 0.79, RMB 0.97, and RMB 0.06.
Second step, estimate the short-term customer equity for each category. This paper defines the short term as the future six months including the current month. We assumed that the monthly discount rate d equaled 0.0025, which was the weighted average capital cost of the firm. According to the customer equity calculation formula proposed by Gupta, Lehmann, and Stuart [8], without considering the user retention cost and acquisition cost, C L V k = t = 0 6 C F k × r k t ( 1 + d ) t , where r k is the retention rate. Furthermore, C E k = N k × C L V k , where N k is the total number of users in category k. Therefore, the short-term customer equity for innovators, early adopters, early majorities, and the late majorities were respectively calculated as RMB 2719.85, RMB 149,312.65, RMB 414,933.86, and RMB 7310.15.
Third step, estimate the lifetime customer equity for each category. The lifetime customer equity for each category was calculated according to Equation (9). The result shows that the lifetime customer equity of innovators, early adopters, early majorities, and the late majorities were respectively calculated as RMB 4186.79, RMB 768,935.77, RMB 22,828,279.03, and RMB 36,489.05.
Fourth step, calculate the customer equity sustainability ratio for each category. According to Equation (11), we took the short-time customer equity as the numerator and the lifetime customer equity as the denominator in calculating the customer equity sustainability ratio. The result shows that the customer equity sustainability ratios of innovators, early adopters, early majorities, and late majorities were respectively 35.04, 98.06, 98.18, and 79.97%. We can see that the early adopters and the early majorities had greater room for future profit growth, while the growth potential of innovators was relatively low.

5.4.2. Calculating Customer Equity of Potential Users

According to the parameter estimation of the Bass model, the future market size is expected to be 182,343. Subtracting the number of current users (108,512) gives the number of potential users (73,831) in the future. Most potential users should be classified into the late majorities, with the remainder being laggards. Assuming that potential users have the same usage behavior as most of the late majorities, the estimation of the lifetime customer equity for the potential users is RMB 145,512.73.
Furthermore, the ratio of the current customer equity to the total customer equity, i.e., C C E C E , was calculated. Define R = 1 C C E C E , and it is obvious that the value of R lies between 0 and 1. The larger the value is, the greater the future potential. Here, the calculation result was 0.47%. The small percentage indicates that the profit margins brought by new users after October 2018 were quite limited.

6. Managerial Relevance and Conclusions

As the marketing theory and practice becoming more and more customer-centered, customers and relationships with customers are treated as vital intangible firm assets, which should be measured and managed. Customer equity (CE) is an essential metric to measure customer based assets and it can further provide a new tool for firm valuation instead of financial-based valuation. Compared with traditional financial-valuation, the customer-based firm valuation method is more precise and more accountable especially for today’s loyalty economy. The reason is that customer equity is a forward-looking metric, which means that it not only considers the profit that has been already generated by the customers but also takes customer’s future profit potential into consideration. Besides being a metric to assess firm’s underlying value, customer equity also works as an important base for customer-centric marketing practice. According to customer equity, managers are able to identify their most profitable customers and those unprofitable ones. Therefore, calculating customer equity provides managers a reference standard to allocate marketing resource and make strategic marketing decisions in order to increase future profits.
With the managerial importance, the calculation of customer equity and its derivative concept, customer equity sustainability ratio, is being discussed more than ever before. In this paper, we focused on the calculation of customer equity of a mobile payments aggregator. With the rapid development of mobile payment in China, mobile payments aggregator, as a new business pattern, helps to connect the retailers with different third-party payment firms, thus providing one-stop payment solutions for retailers. Calculating customer equity of these mobile payments aggregators is very important due to two reasons. The first reason is that customer equity helps to assess the future development potential of these aggregators that are emerging business patterns with the recent development of mobile payment. The second reason is that customer equity helps the retailers, i.e., clients of these mobile payments aggregators, to better understand the buying behavior and the value generated from the customers who are using mobile payment. Therefore the mobile payments aggregators are able to provide their clients with value added services and help the retailers make customer-centered marketing and promotion decisions. Generating a service fee from the retailers has gradually become an importance source of income besides the commission fee. Measuring customer equity of the mobile payments aggregator generated from a specific retailer is of great importance since it not only helps the aggregator evaluate its future business development but also provide value-added service and generate a service fee from the retailer. The main purpose of this paper was to calculate customer equity of a mobile payments aggregator generated from a specific retailer from the perspective of technology diffusion. The proposed method could contribute to the literature in two ways.
First, we used the Pareto/NBD model to estimate the retention rate. In the current literature, customer equity measurement using diffusion models usually adopts an aggregate-level approach, which means the retention rate is regarded as an exogenous variable and can be obtained from annual reports, related literature, or industry experts. Compared with taking the retention rate as an exogenous variable, estimating retention using a Pareto/NBD model based on individual transaction data is more appropriate in measuring customer equity in noncontractual settings such as retailing.
Second, unlike the aggregate-level approaches of modeling customers as a whole, this paper proposed an operable customer equity measurement model based on customer segmentation, thus reducing the measurement error caused by the heterogeneity of customer groups. Although some scholars have proposed that customer equity should be calculated according to different customer segmentations, there is still relatively little discussion on specific implementation methods. In this paper, customers are segmented into five categories, i.e., innovators, early adopters, early majorities, late majorities, and laggards, according to their adoption time of mobile payment. Customer segmentation is usually based on demographic or psychographic characteristics. However, in this paper, we proposed using the adoption time of mobile payment as customer segmentation criteria. This is more appropriate because customer equity of this mobile payments aggregator generated from the specific retailer comes from the commission fee of each transaction, which is directly connected with customers’ mobile payment behavior, meaning that customers with different adoption time of mobile payment will contribute differently to customer equity. The result shows that customer equity of the early adopters and the early majorities are more than those of the other three categories and the customer equity sustainability ratio of these two categories are respectively 98.06 and 98.18%, indicating much room for future profit growth. The customer equity sustainability ratio of innovators was only 35.04%, indicating limited room for future profit growth, despite their early adoption of new technologies. Firms should increase marketing efforts to maintain relations with early adopters and early majorities. Our method helps the firm to identify and target these customers in marketing, such as distributing coupons, giving more shopping points or higher discounts. In the meanwhile, firms should reduce marketing investments for the innovators and late majorities since their growth potential is relatively lower. By doing this, firms are able to allocate their marketing resources more appropriately and make their marketing investment more effective. Besides, our study also helps the mobile payments aggregator to choose the most valuable market to target when promoting a new technology-based service, such as face-scan payment, E-card, or electronic discount coupon. Our study segmented customers according to their new technology acceptance degree and this segmentation criteria is becoming more and more important when new technologies are emerging in an endless stream. The empirical research shows that although innovators accept a new technology very quickly, their future profit potential is quite limited. According to our study, it is the early adopters and the early majorities that are the most valuable customer segments the payment aggregator should really target when promoting new technology-based services.
Although our study focuses on the customer equity measurement of a mobile payments aggregator, this calculation method also works for other aggregators with similar business logic and profit model, such as health care and medical aggregator Apps like Apple Healthkit, smart home aggregator Apps like Apple Homekit, and cloud service aggregator like Tencent Cloud. These aggregator apps act as platforms connecting the product or service providers on the one side and their clients on the other. Like mobile payments aggregators, these aggregators also have direct access to consumer data. Based on consumer data, our study provided a method to segment customers according to their technology adoption and then further calculated customer equity generated by each segment. This helps the aggregator to target the most profitable customers when promoting a new technology-based service. In future research, we could apply the proposed method to segment customers and calculate customer equity and customer equity sustainability ratio based on technology diffusion model for these aggregators, verifying that early adopters and early majorities are the categories that will generate most profit in the future.
Our study developed a method to calculate customer equity of a mobile payments aggregator based on the technology diffusion model. However, the customer equity we calculated was only a small part of a whole picture, which means in this study we only focused on the customer equity generated from one specific retailer. The adoption time of mobile payment and customer segmentation were subject to the payment data of this retailer. Although the research could help this specific retailer to better understand its customers and making relevant marketing strategies based on customer future potentials, it was not enough to get a whole picture of the development potentials of the mobile payments aggregator since it had many other retailers as its clients. In order to overcome this limitation and calculate total customer equity, in future research, the customer payment data of this aggregator could be restructured as customer-centered instead of retailer-centered, which means merging an individual customer’s payment records in different retailers according to his or her payment ID. Then we can identify innovators, early adopters, early majorities, and late majorities in a more general level. We can thus not only calculate the total customer equity of the payment aggregator but also provide its clients, i.e., the retailers, with more customer information by comparing customer equity generated from one specific retailer and total customer equity generated from all the retailers.

Author Contributions

Conceptualization, D.C.; methodology, W.X.; software, W.X.; validation, S.B.; formal analysis, D.C., W.X.; investigation, S.B.; resources, Y.S.; data curation, W.X.; writing—original draft preparation, Y.S., W.X.; writing—review and editing, Y.S., S.B.; visualization, W.X.; supervision, D.C.; project administration, D.C. All authors have read and agreed to the published version of the manuscript.

Funding

This study is supported by the fund for building world-class universities (disciplines) of Renmin University of China, and the Byron Root Foundation, USA.

Acknowledgments

We would like to sincerely thank the support of Dehong Yang from Miya Information Technology Inc.

Conflicts of Interest

The authors declared that they have no conflicts of interest to this work.

Appendix A

Table A1. List of major concepts and abbreviations.
ConceptDefinitionAbbreviation
Customer lifetime valueThe net present value of profits that a customer can bring to a firm during his or her entire life of transactions with the firmCLV
Customer equityThe sum of the lifetime value for all customers of the firmCE
Customer equity sustainability ratioThe ratio of a customer’s (or all customers’) future CLV (or CE) to the customer’s (or their) total CLV (or CE)CESR

References

  1. Blattberg, R.; Getz, G.; Thomas, J.S. Customer Equity: Building and Managing Relationships as Valuable Assets; Harvard Business School Press: Boston, MA, USA, 2001. [Google Scholar]
  2. Estrella-Ramón, A.M.; Sánchez-Pérez, M.; Swinnen, G.; Vanhoof, K. A Marketing View of the Customer Value: Customer Lifetime Value and Customer Equity. South Afr. J. Bus. Manag. 2013, 44, 47–64. [Google Scholar] [CrossRef] [Green Version]
  3. Gupta, S.; Lehmann, D.R. Customers as Assets. J. Interact. Mark. 2003, 17, 9–24. [Google Scholar] [CrossRef]
  4. Kumar, V. A Theory of Customer Valuation: Concepts, Metrics, Strategy, and Implementation. J. Mark. 2018, 82, 1–19. [Google Scholar] [CrossRef] [Green Version]
  5. Gupta, S.; Zeithaml, V. Customer Metrics and Their Impact on Financial Performance. Mark. Sci. 2006, 25, 718–739. [Google Scholar] [CrossRef] [Green Version]
  6. Wiesel, T.; Skiera, B.; Villanueva, J. Customer Equity: An Integral Part of Financial Reporting. J. Mark. 2008, 72, 1–14. [Google Scholar] [CrossRef] [Green Version]
  7. Blattberg, R.C.; Deighton, J. Manage Marketing by the Customer Equity Test. Harv. Bus. Rev. 1996, 74, 136–144. [Google Scholar]
  8. Gupta, S.; Lehmann, D.R.; Stuart, J.A. Valuing Customers. J. Mark. Res. 2004, 41, 7–18. [Google Scholar] [CrossRef]
  9. Rust, R.T.; Lemon, K.N.; Zeithaml, V.A. Return on Marketing: Using Customer Equity to Focus Marketing Strategy. J. Mark. 2004, 68, 109–127. [Google Scholar] [CrossRef] [Green Version]
  10. Gupta, S.; Hanssens, D.; Hardie, B.; Kahn, W.; Kumar, V.; Lin, N.; Ravishanker, N.; Sriram, S. Modeling Customer Lifetime Value. J. Serv. Res. 2006, 9, 139–155. [Google Scholar] [CrossRef]
  11. Reinartz, W.J.; Kumar, V. The Impact of Customer Relationship Characteristics on Profitable Lifetime Duration. J. Mark. 2003, 67, 77–99. [Google Scholar] [CrossRef]
  12. Kumar, V.; Shah, D. Building and Sustaining Profitable Customer Loyalty for the 21st Century. J. Retail. 2004, 80, 317–329. [Google Scholar] [CrossRef]
  13. Skiera, B.; Bermes, M.; Horn, L. Customer Equity Sustainability Ratio: A New Metric for Assessing a Firm’s Future Orientation. J. Mark. 2011, 75, 118–131. [Google Scholar] [CrossRef] [Green Version]
  14. Tuli, K.R.; Bharadwaj, S.G.; Kohli, A.K. Ties that Bind: The Impact of Multiple Types of Ties with a Customeron Sales Growth and Sales Volatility. J. Mark. Res. 2010, 47, 36–50. [Google Scholar] [CrossRef]
  15. Bass, F.M. A New Product Growth for Model Consumer Durables. Manag. Sci. 1969, 15, 215–227. [Google Scholar] [CrossRef]
  16. Schmittlein, D.C.; Morrison, D.G.; Colombo, R. Counting Your Customers: Who-Are They and What Will They Do Next? Manag. Sci. 1987, 33, 1–24. [Google Scholar] [CrossRef]
  17. McCarthy, D.M.; Fader, P.S. How to Value a Company by Analyzing Its Customers. Harv. Bus. Rev. 2020, 91, 51–55. [Google Scholar]
  18. McCarthy, D.M.; Fader, P.S. Customer-Based Corporate Valuation for Publicly Traded Non-Contractual Firms. J. Mark. Res. 2018, 55, 617–635. [Google Scholar] [CrossRef]
  19. Kumar, V.; Shah, D. Introduction: The Evolution of Customer Equity. In Handbook of Research on Customer Equity in Marketing; Edward Elgar Publishing: Cheltenham, UK, 2015; pp. 1–14. [Google Scholar]
  20. Kumar, V.; Shah, D. Handbook of Research on Customer Equity in Marketing; Edward Elgar Publishing: Cheltenham, UK, 2015; pp. 283–305. [Google Scholar]
  21. Dwye, F.R. Customer Lifetime Valuation to Support Marketing Decision Making. J. Direct Mark. 1997, 11, 7–13. [Google Scholar]
  22. Reinartz, W.J.; Kumar, V. On the Profitability of Long-Life Customers in a Non-Contractual Setting: An Empirical Investigation and Implications for Marketing. J. Mark. 2000, 64, 17–35. [Google Scholar] [CrossRef]
  23. Venkatesan, R.; Kumar, V. A Customer Lifetime Value Framework for Customer Selection and Resource Allocation Strategy. J. Mark. 2004, 68, 106–125. [Google Scholar] [CrossRef]
  24. Kumar, V.; George, M. Measuring and Maximizing Customer Equity: A Critical Analysis. J. Acad. Mark. Sci. 2007, 35, 157–171. [Google Scholar] [CrossRef]
  25. Calciu, M. Deterministic and Stochastic Customer Lifetime Value Models. Evaluating the Impact of Ignored Heterogeneity in Non-Contractual Contexts. J. Target. Meas. Anal. Mark. 2009, 17, 257–271. [Google Scholar] [CrossRef] [Green Version]
  26. Berger, P.D.; Nasr, N.I. Customer Lifetime Value: Marketing Models and Applications. J. Interact. Mark. 1998, 12, 17–30. [Google Scholar] [CrossRef] [Green Version]
  27. Bandyopadhyay, S.; Martell, M. Does Attitudinal Loyalty Influence behavioral Loyalty: A Theoretical and Empirical Study. J. Retail. Consum. Serv. 2007, 14, 35–44. [Google Scholar] [CrossRef]
  28. Fader, P.S.; Hardie, B.G.S.; Lee, K.L. Counting Your Customers the Easy Way: An Alternative to the Pareto/NBD Model. Mark. Sci. 2005, 24, 275–284. [Google Scholar] [CrossRef] [Green Version]
  29. Schmittlein, D.C.; Peterson, R.A. Customer Base Analysis: An Industrial Purchase Process Application. Mark. Sci. 1994, 13, 41–67. [Google Scholar] [CrossRef]
  30. Colombo, R.; Jiang, W. A Stochastic RFM Model. J. Interact. Mark. 1999, 13, 2–12. [Google Scholar] [CrossRef]
  31. Boatwright, P.; Borle, S.; Kadane, J.B. A Model of the Joint Distribution of Purchase Quantity and Timing. J. Am. Stat. Assoc. 2003, 98, 564–572. [Google Scholar] [CrossRef]
  32. Thomas, J.S. A Methodology for Linking Customer Acquisition to Customer Retention. J. Mark. Res. 2001, 38, 262–268. [Google Scholar] [CrossRef]
  33. Thomas, J.S.; Blattberg, R.C.; Fox, E.J. Recapturing Lost Customers. J. Mark. Res. 2004, 41, 31–45. [Google Scholar] [CrossRef]
  34. Meyer-Waarden, L. The Effects of Loyalty Programs on Customer Lifetime Duration and Share of Wallet. J. Retail. 2007, 83, 223–236. [Google Scholar] [CrossRef]
  35. Yoo, S.; Hanssens, D.M. Modeling the Sales and Customer Equity Effects of the Marketing MIX. UCLA Anderson Sch. Manag. 2005, 2, 1–42. [Google Scholar]
  36. Bandyopadhyay, S. A Dynamic Model of Cross-Category Competition: Theory, Tests, and Application. J. Retail. 2009, 85, 468–479. [Google Scholar] [CrossRef]
  37. Chen, Z.-Y.; Fan, Z.-P. Dynamic Customer Lifetime Value Prediction Using Longitudinal Data: An Improved Multiple Kernel SVR Approach. Knowl. Based Syst. 2013, 43, 123–134. [Google Scholar] [CrossRef]
  38. Ying, W. The Research on Random Forests and the Application in Customer Churn Prediction. Manag. Rev. 2012, 24, 140–145. [Google Scholar]
  39. Coussement, K.; Benoit, D.F.; Poel, D.V.D. Improved Marketing Decision Making in a Customer Churn Prediction Context Using Generalized Additive Models. Expert Syst. Appl. 2010, 37, 2132–2143. [Google Scholar] [CrossRef]
  40. Schumpeter, J. The Instability of Capitalism. Econ. J. 1928, 38, 361. [Google Scholar] [CrossRef]
  41. Mansfield, E. Technical Change and the Rate of Innovation. Econometrica 1961, 29, 741–766. [Google Scholar] [CrossRef] [Green Version]
  42. Libai, B.; Muller, E.; Peres, R. The Diffusion of Services. J. Mark. Res. 2009, 46, 163–175. [Google Scholar] [CrossRef] [Green Version]
  43. Hogan, J.E.; Lemon, K.N.; Libai, B. What Is the True Value of a Lost Customer? J. Serv. Res. 2003, 5, 196–208. [Google Scholar] [CrossRef]
  44. Silveira, C.S.; De Oliveira, M.O.R.; Luce, F.B.; Alejandro, T.B. Comparing Alternative Approaches to Estimate Customer Equity. Mark. Intell. Plan. 2017, 35, 611–625. [Google Scholar] [CrossRef]
  45. Rogers, E.M. Diffusion of Innovations; The Free Press: New York, NY, USA, 1983. [Google Scholar]
  46. Mahajan, V.; Muller, E.; Srivastava, R.K. Determination of Adopter Categories by Using Innovation Diffusion Models. J. Mark. Res. 1990, 27, 37–50. [Google Scholar] [CrossRef]
  47. Pfeifer, P.E. On Estimating Current-Customer Equity Using Company Summary Data. J. Interact. Mark. 2011, 25, 1–14. [Google Scholar] [CrossRef]
  48. Venkatesan, R.; Kumar, V. A Genetic Algorithms Approach to Growth Phase Forecasting of Wireless Subscribers. Int. J. Forecast. 2002, 18, 625–646. [Google Scholar] [CrossRef]
Figure 1. (a): Cumulative distribution function curve of the Bass model. (b): Probability density function curve of the Bass model.
Jtaer 16 00026 g001
Figure 2. Research framework.
Jtaer 16 00026 g002
Figure 3. (a): Change in the number of users. (b): Change in the composition of users.
Jtaer 16 00026 g003aJtaer 16 00026 g003b
Figure 4. (a): Distribution of the length of use in the first stage (in months). (b): Distribution of the length of use in the second stage (in months).
Jtaer 16 00026 g004
Figure 5. (a): Distribution of use frequency (first stage). (b): Distribution of use frequency (second stage).
Jtaer 16 00026 g005
Figure 6. Comparison between the actual cumulative number of new users and fitted values of the models.
Jtaer 16 00026 g006
Figure 7. User segmentation.
Jtaer 16 00026 g007
Table 1. Examples of customer equity (CE) measurements.
ReferenceCustomer-Firm RelationshipData SourceModel TypeModeling Approach
[7]contractualfirm-leveldeterministiceconometric
[25]contractual/noncontractualfirm-leveldeterministiceconometric
[22]noncontractualindividual-levelstochasticprobability
[3]contractualfirm-leveldeterministiceconometric
[11]noncontractualindividual-levelstochasticprobability
[8]contractualfirm-leveldeterministicdiffusion/growth
[23]noncontractualindividual-levelstochasticprobability/econometric
[9]noncontractualfirm-levelstochasticeconometric
[42]contractualfirm-leveldeterministicdiffusion/growth
[35]contractualindividual-levelstochasticpersistence
[38]contractualindividual-levelstochasticcomputer science
[37]noncontractualindividual-levelstochasticcomputer science
Table 2. Estimation results using Pareto/NBD.
User CategoriesNumber of Uses per MonthChurn Rate
Innovators1.280.011
Early adopters0.410.0003
Early majorities0.520.00012
Late majorities and laggards0.560.028
Publisher’s Note: MDPI stays neutral with regard to jurisdictional claims in published maps and institutional affiliations.

