
How to Engage Consumers through Effective Social Media Use—Guidelines for Consumer Goods Companies from an Emerging Market


Abstract
:1. Introduction
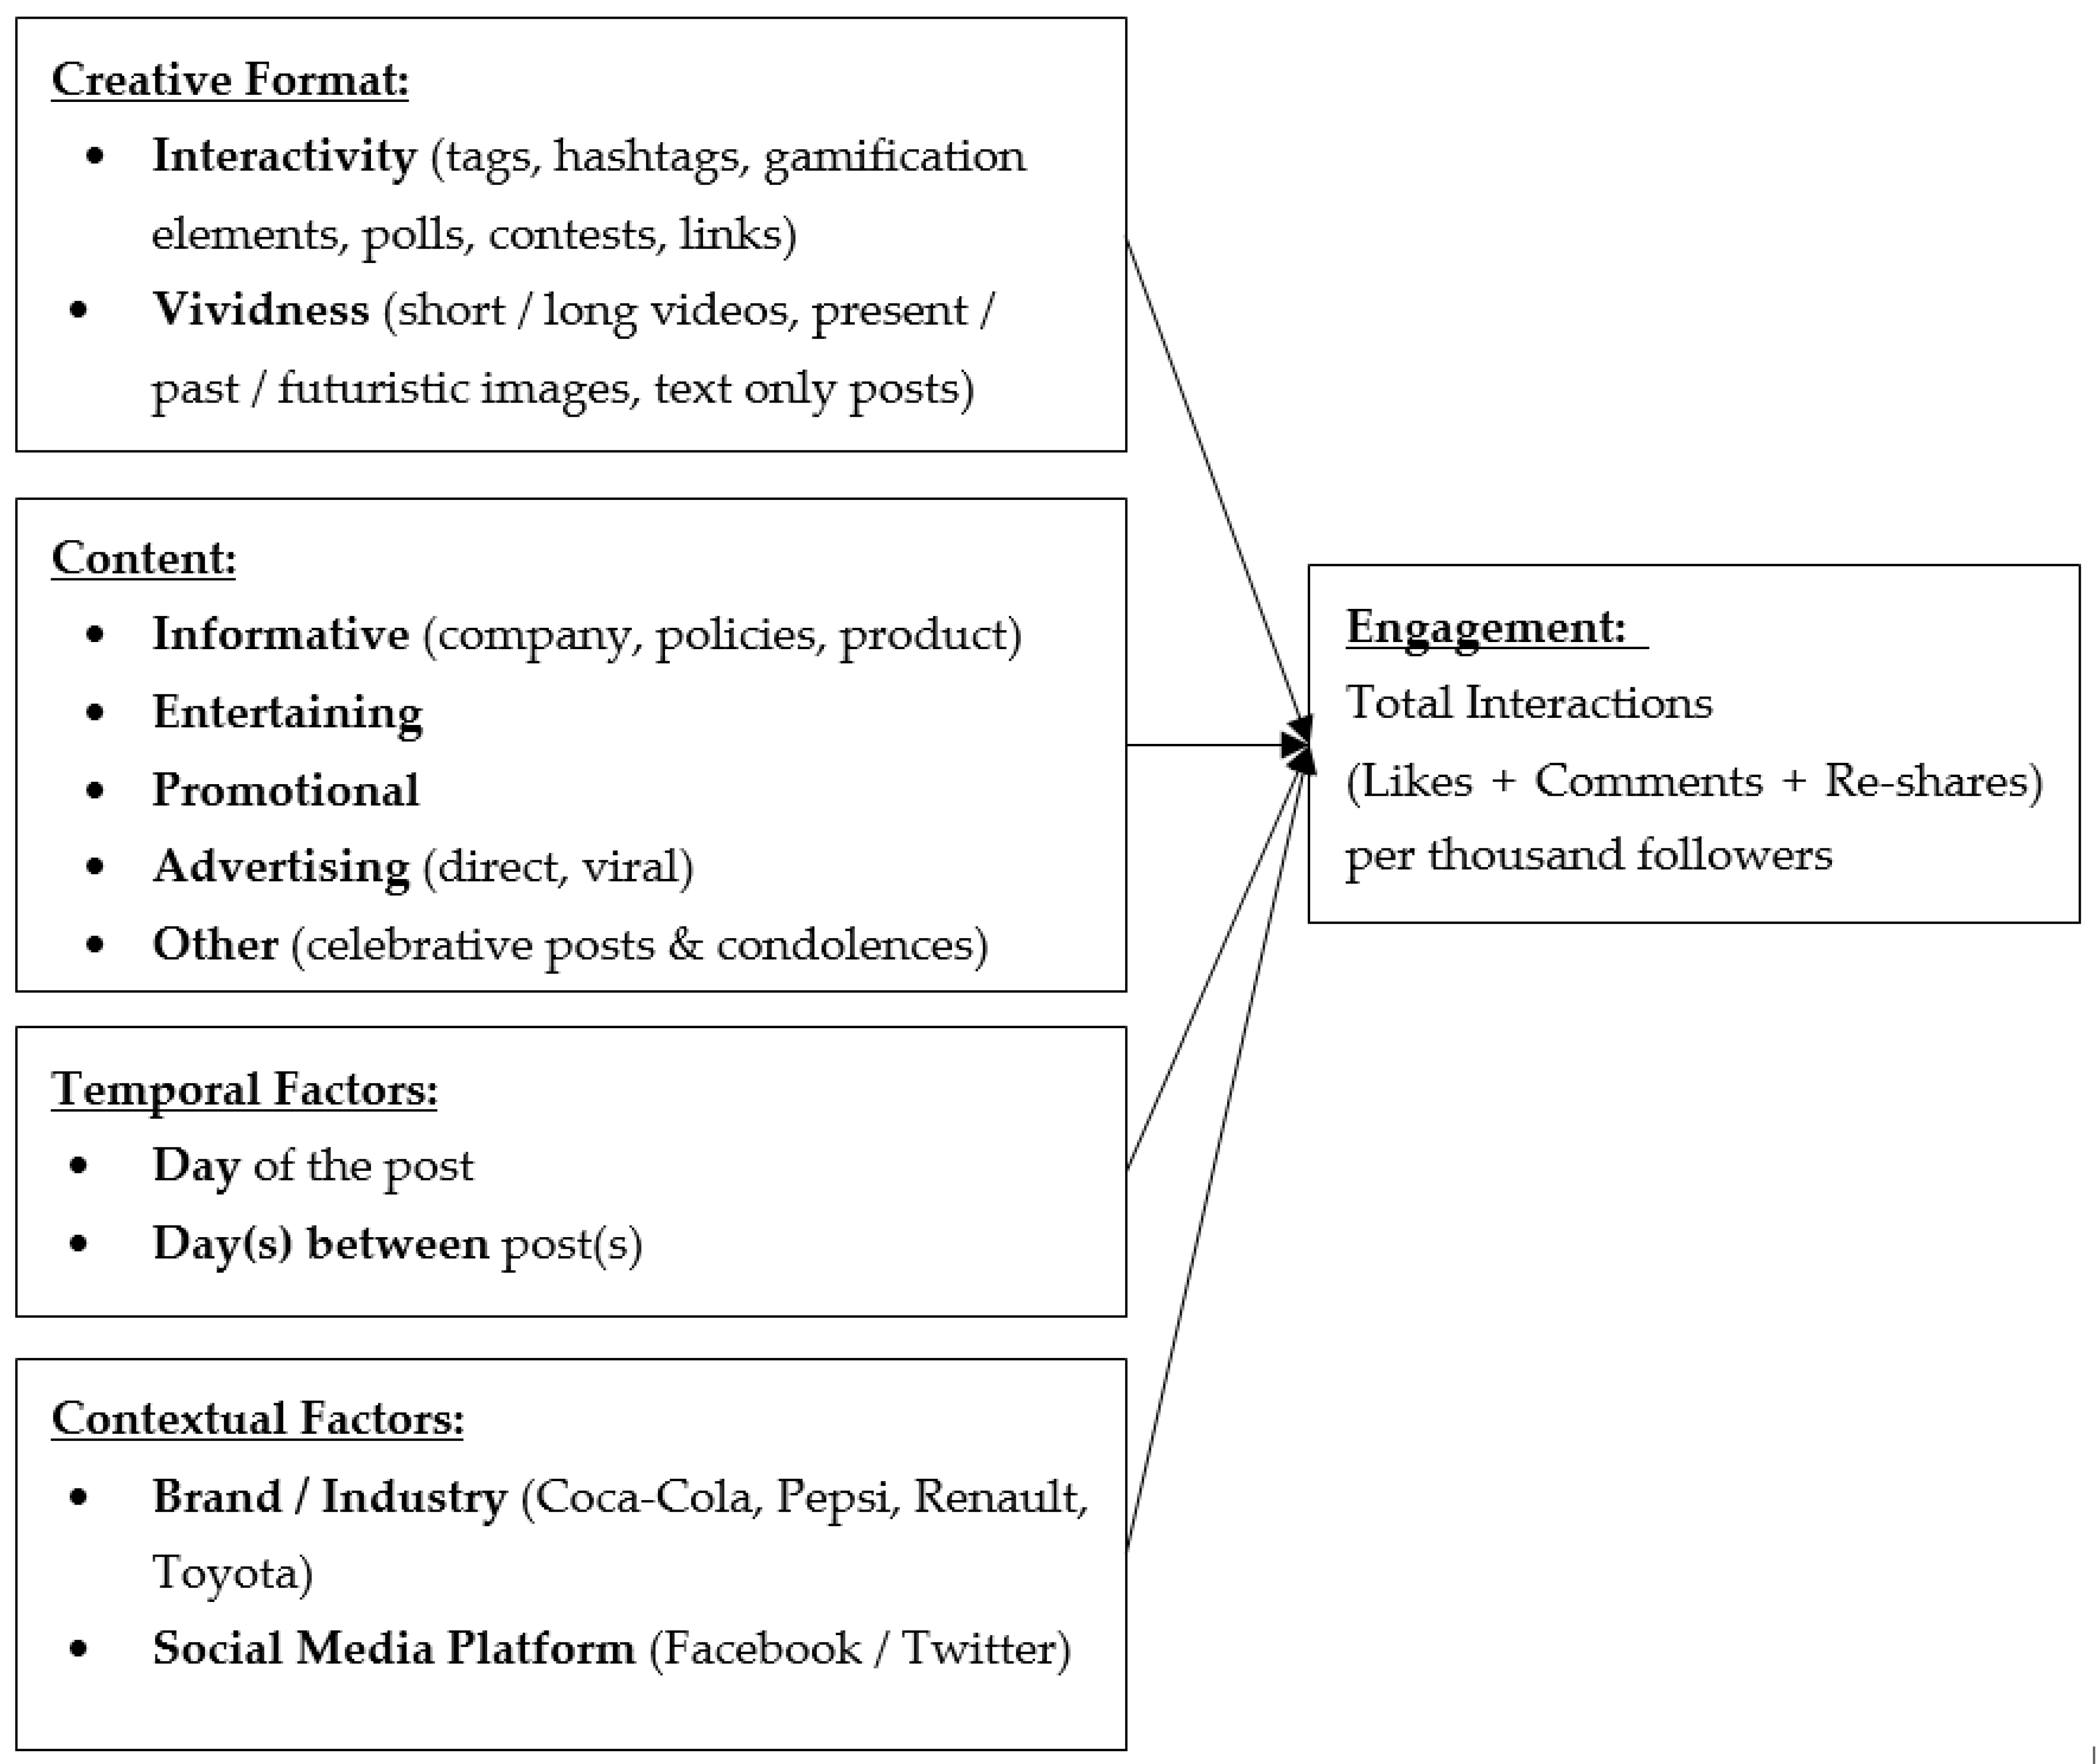
- Analyze the impacts of the creative format of posts in terms of the multiple subcategories of interactivity and vividness on engagement;
- Examine the various types of post content with regard to whether they are informative, entertaining, promotional or advertising-oriented and analyze the impacts of each type on engagement;
- Investigate the effects of temporal factors such as the days when posts are made and the number of days between posts, in addition to contextual factors such as industry and platform, on engagement;
- Determine the most effective factors for increasing engagement by coming up with a strategic and actionable guide (using decision trees and sensitivity analysis) for social media managers.
2. Background and Related Work
2.1. Brand Communication on BFPs and Consumer Engagement
2.2. Factors Affecting Communication Effectiveness on BFPs
2.2.1. The Creative Format of Posts (Vividness & Interactivity)
2.2.2. Post Content (Informative, Entertaining, Promotional)
2.2.3. Temporal Factors
2.2.4. Contextual Factors
2.3. Research Model
3. Methodology
3.1. Setting: Consumer Goods Industry and Turkey
3.2. Designing and Unitizing
3.3. Sampling, Coding and Validation
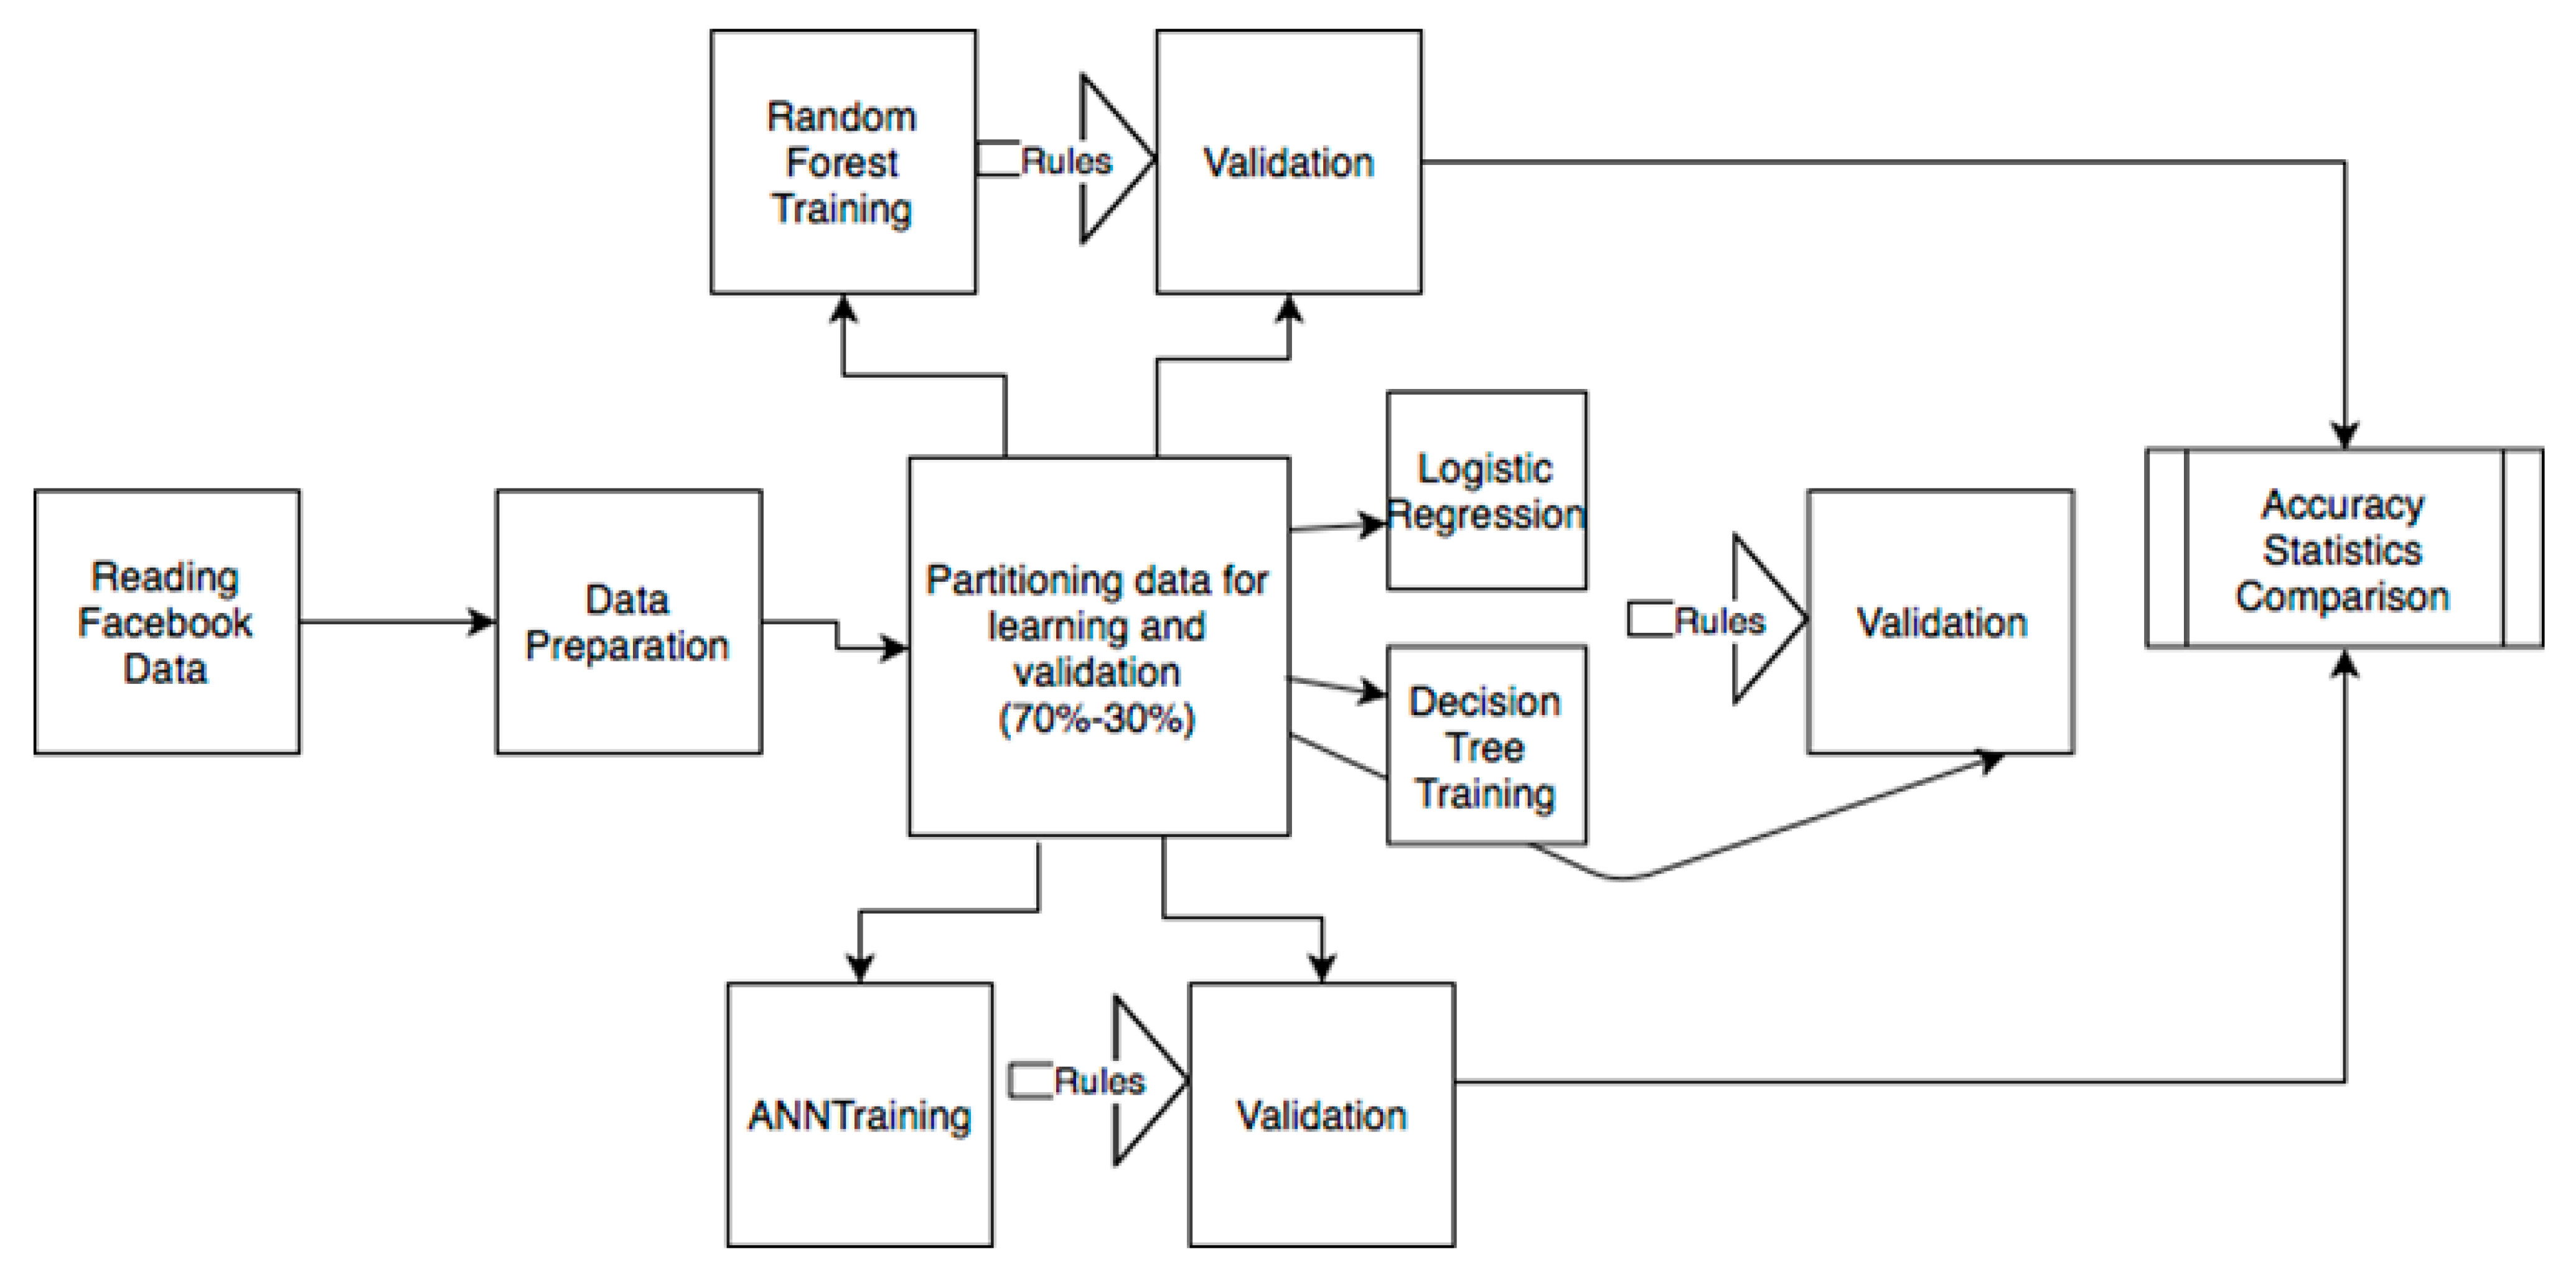
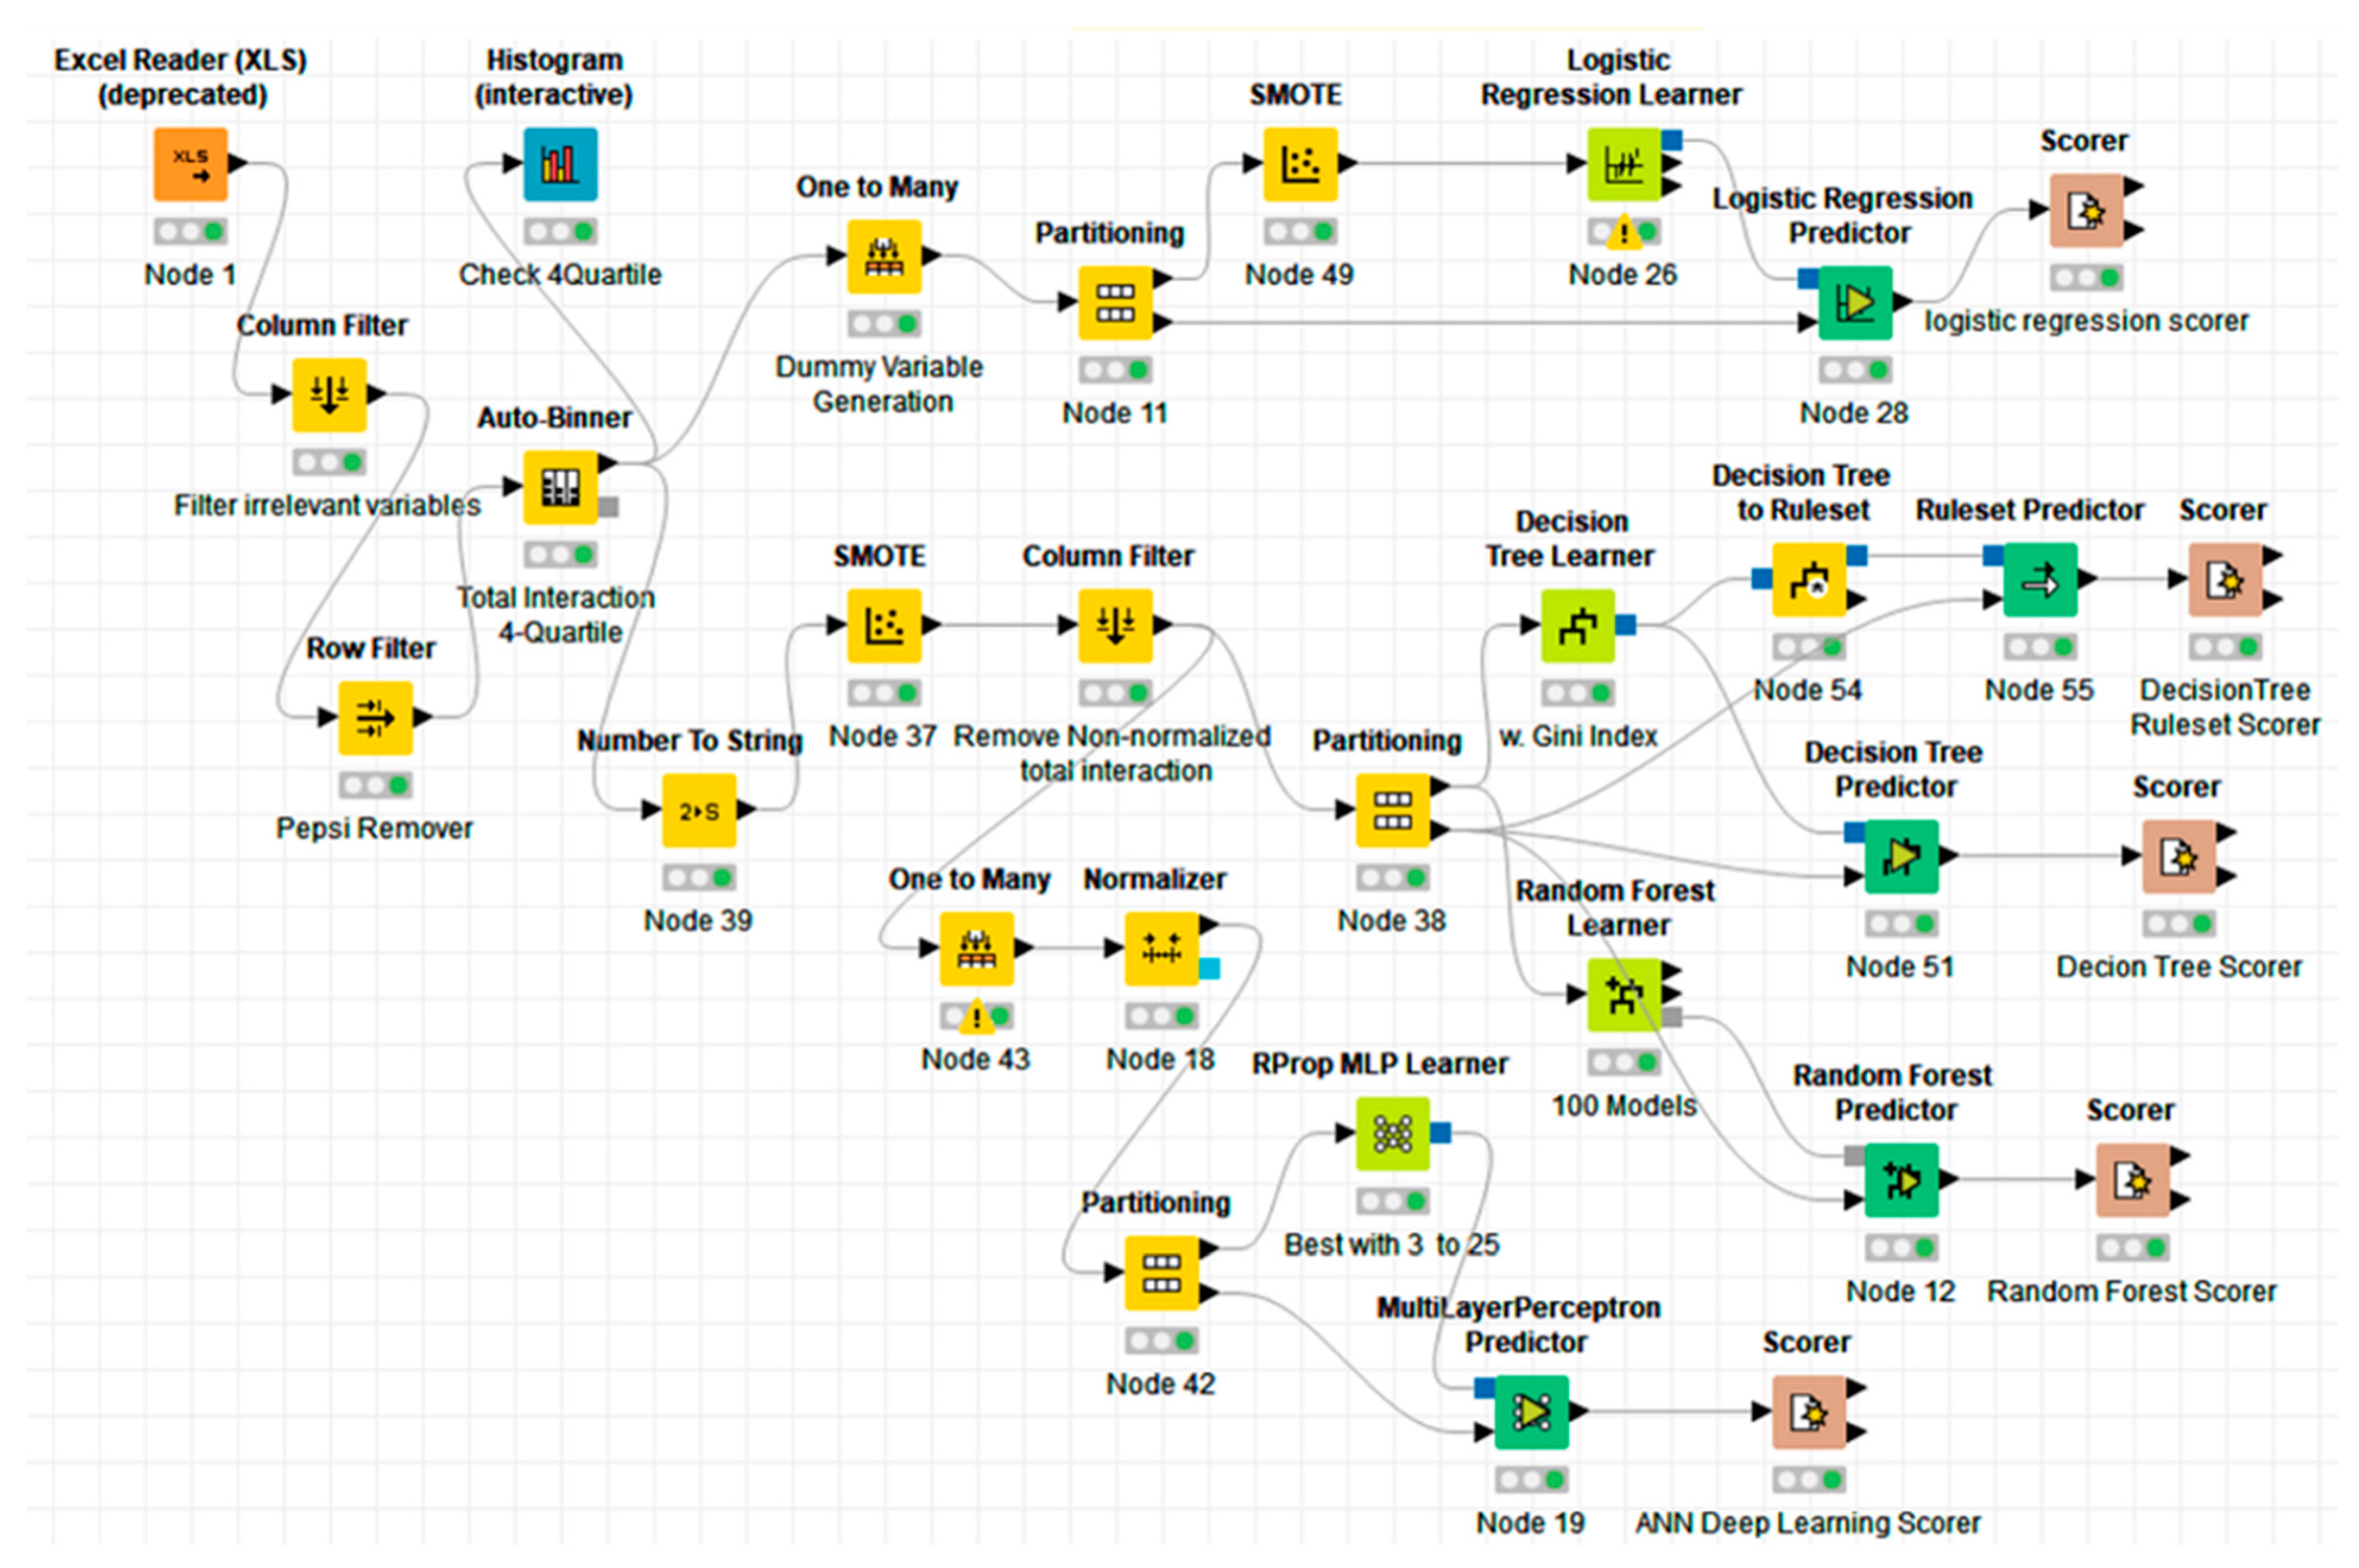
3.4. Analysis Algorithms
- 5.
- Logistic regression algorithm: the stochastic average gradient was used as the solver.
- 6.
- Decision tree algorithm: the quality measure was selected as the Gini index and reduced error pruning was preferred while selecting the minimum number of records per node as three.
- 7.
- Random forest decision tree algorithm: the number of levels was set as 10 and the minimum node size was set as 9. The static random seed was used to come up with 100 models, five-fold sampling (without replacement) was done along with stratified sampling.
- 8.
- ANN: the sigmoid activation function was preferred and z-score normalization was applied to the dataset. The stochastic depth and early stopping were used to prevent possible overfitting. The best performing model was obtained via 3 layers and 25 nodes.
- 9.
- The synthetic minority over-sampling technique (SMOTE) algorithm was used to overcome class imbalance problems and biases towards certain categories with relatively large observations. The data was oversampled two times for regression and four times for the decision tree, ANN and random forest algorithms.
4. Results
5. Discussion
Limitations
6. Conclusions
Author Contributions
Funding
Institutional Review Board Statement
Informed Consent Statement
Data Availability Statement
Conflicts of Interest
Appendix A

Appendix B

References
- Clement, J. Social Media-Statistics & Facts. Available online: https://0-www-statista-com.brum.beds.ac.uk/topics/1164/social-networks/ (accessed on 10 January 2020).
- Moorman, C. The CMO Survey: Highlights and Insights Report-August 2018, Deloitte & American Marketing Association; 2018; Available online: https://cmosurvey.org/results/august-2018/ (accessed on 6 February 2020).
- Godey, B.; Manthiou, A.; Pederzoli, D.; Rokka, J.; Aiello, G.; Donvito, R.; Singh, R. Social media marketing efforts of luxury brands: Influence on brand equity and consumer behavior. J. Bus. Res. 2016, 69, 5833–5841. [Google Scholar] [CrossRef]
- Kim, W.-H.; Chae, B. Understanding the relationship among resources, social media use and hotel performance. Int. J. Contemp. Hosp. Manag. 2018, 30, 2888–2907. [Google Scholar] [CrossRef]
- Yoon, G.; Li, C.; Ji, Y.; North, M.; Hong, C.; Liu, J. Attracting Comments: Digital Engagement Metrics on Facebook and Financial Performance. J. Advert. 2018, 47, 24–37. [Google Scholar] [CrossRef]
- Bagozzi, R.P.; Dholakia, U.M. Antecedents and purchase consequences of customer participation in small group brand communities. Int. J. Res. Mark. 2006, 23, 45–61. [Google Scholar] [CrossRef]
- Ruiz-Mafe, C.; Martí-Parreño, J.; Sanz-Blas, S. Key drivers of consumer loyalty to Facebook fan pages. Online Inf. Rev. 2014, 38, 362–380. [Google Scholar] [CrossRef]
- Xu, Y.C.; Yang, Y.; Cheng, Z.; Lim, J. Retaining and attracting users in social networking services: An empirical investigation of cyber migration. J. Strateg. Inf. Syst. 2014, 23, 239–253. [Google Scholar] [CrossRef]
- Ryan, K.S.; Zabin, J. Gleansight: Social Media Marketing. Gleanster LCC 2010, 1–21. Available online: https://www.slideshare.net/crowdfactory/leanstercomimagespdfgleansightsocialmediamarketingq42010rpdf (accessed on 8 January 2020).
- de Vries, L.; Gensler, S.; Leeflang, P.S.H. Popularity of Brand Posts on Brand Fan Pages: An Investigation of the Effects of Social Media Marketing. J. Interact. Mark. 2012, 26, 83–91. [Google Scholar] [CrossRef]
- Luarn, P.; Lin, Y.-F.; Chiu, Y.-P. Influence of Facebook brand-page posts on online engagement. Online Inf. Rev. 2015, 39, 505–519. [Google Scholar] [CrossRef]
- Schultz, C.D. Proposing to your fans: Which brand post characteristics drive consumer engagement activities on social media brand pages? Electron. Commer. Res. Appl. 2017, 26, 23–34. [Google Scholar] [CrossRef]
- Gutiérrez-Cillán, J.; Camarero-Izquierdo, C.; San José-Cabezudo, R. How brand post content contributes to user’s Facebook brand-page engagement. The experiential route of active participation. BRQ Bus. Res. Q. 2017, 20, 258–274. [Google Scholar] [CrossRef]
- Antoniadis, I.; Paltsoglou, S.; Patoulidis, V. Post popularity and reactions in retail brand pages on Facebook. Int. J. Retail Distrib. Manag. 2019, 47, 957–973. [Google Scholar] [CrossRef]
- Sabate, F.; Berbegal-Mirabent, J.; Cañabate, A.; Lebherz, P.R. Factors influencing popularity of branded content in Facebook fan pages. Eur. Manag. J. 2014, 32, 1001–1011. [Google Scholar] [CrossRef]
- Pletikosa Cvijikj, I.; Michahelles, F. Online engagement factors on Facebook brand pages. Soc. Netw. Anal. Min. 2013, 3, 843–861. [Google Scholar] [CrossRef]
- Kwon, E.S.; King, K.W.; Nyilasy, G.; Reid, L.N. Impact of media context on advertising memory a meta-analysis of advertising effectiveness. J. Advert. Res. 2019, 59, 99–128. [Google Scholar] [CrossRef]
- Voorveld, H.A.M.; van Noort, G.; Muntinga, D.G.; Bronner, F. Engagement with Social Media and Social Media Advertising: The Differentiating Role of Platform Type. J. Advert. 2018, 47, 38–54. [Google Scholar] [CrossRef] [Green Version]
- Felix, R.; Rauschnabel, P.A.; Hinsch, C. Elements of strategic social media marketing: A holistic framework. J. Bus. Res. 2017, 70, 118–126. [Google Scholar] [CrossRef]
- Trefzger, T.F.; Baccarella, C.V.; Voigt, K.-I. Antecedents of brand post popularity in Facebook: The influence of images, videos, and text. In Proceedings of the 15th International Marketing Trends Conference, Madrid, Spain, 21–23 January 2016; pp. 1–8. [Google Scholar]
- Chiu, Y.-P. Social Recommendations for Facebook Brand Pages. J. Theor. Appl. Electron. Commer. Res. 2021, 16, 71–84. [Google Scholar] [CrossRef]
- Mochon, D.; Johnson, K.; Schwartz, J.; Ariely, D. What are likes worth? A facebook page field experiment. J. Mark. Res. 2017, 54, 306–317. [Google Scholar] [CrossRef]
- Kozinets, R.V. E-tribalized marketing?: The strategic implications of virtual communities of consumption. Eur. Manag. J. 1999, 17, 252–264. [Google Scholar] [CrossRef]
- Dholakia, U.M.; Bagozzi, R.P.; Pearo, L.K. A social influence model of consumer participation in network- and small-group-based virtual communities. Int. J. Res. Mark. 2004, 21, 241–263. [Google Scholar] [CrossRef]
- Gummerus, J.; Liljander, V.; Weman, E.; Pihlström, M.; Pihlstro, M. Customer engagement in a Facebook brand community. Manag. Res. Rev. 2013, 35, 857–877. [Google Scholar] [CrossRef] [Green Version]
- van Doorn, J.; Lemon, K.N.; Mittal, V.; Nass, S.; Pick, D.; Pirner, P.; Verhoef, P.C. Customer engagement behavior: Theoretical foundations and research directions. J. Serv. Res. 2010, 13, 253–266. [Google Scholar] [CrossRef]
- Dolan, R.; Conduit, J.; Fahy, J.; Goodman, S. Social media engagement behaviour: A uses and gratifications perspective. J. Strateg. Mark. 2016, 24, 261–277. [Google Scholar] [CrossRef] [Green Version]
- Pino, G.; Peluso, A.M.; Del Vecchio, P.; Ndou, V.; Passiante, G.; Guido, G. A methodological framework to assess social media strategies of event and destination management organizations. J. Hosp. Mark. Manag. 2019, 28, 189–216. [Google Scholar] [CrossRef]
- Bonsón, E.; Ratkai, M. A set of metrics to assess stakeholder engagement and social legitimacy on a corporate Facebook page. Online Inf. Rev. 2013, 37, 787–803. [Google Scholar] [CrossRef]
- Kim, A.J.; Ko, E. Do social media marketing activities enhance customer equity? An empirical study of luxury fashion brand. J. Bus. Res. 2012, 65, 1480–1486. [Google Scholar] [CrossRef]
- Schulze, C.; Schöler, L.; Skiera, B. Not All Fun and Games: Viral Marketing for Utilitarian Products. J. Mark. 2013, 78, 1–19. [Google Scholar] [CrossRef]
- Hutter, K.; Hautz, J.; Dennhardt, S.; Füller, J. The impact of user interactions in social media on brand awareness and purchase intention: The case of MINI on Facebook. J. Prod. Brand Manag. 2013, 22, 342–351. [Google Scholar] [CrossRef] [Green Version]
- Goh, K.-Y.; Heng, C.-S.; Lin, Z. Social Media Brand Community and Consumer Behavior: Quantifying the Relative Impact of User- and Marketer-Generated Content. Inf. Syst. Res. 2013, 24, 88–107. [Google Scholar] [CrossRef]
- Brettel, M.; Reich, J.-C.; Gavilanes, J.M.; Flatten, T.C. What Drives Advertising Success on Facebook? An Advertising-Effectiveness Model. J. Advert. Res. 2015, 55, 162–175. [Google Scholar] [CrossRef]
- Fennis, B.M.; Stroebe, W. The Psychology of Advertising, 1st ed.; Psychology Press: New York, NY, USA, 2010; ISBN 978-0415442732. [Google Scholar]
- Tafesse, W. Content strategies and audience response on Facebook brand pages. Mark. Intell. Plan. 2015, 33, 927–943. [Google Scholar] [CrossRef]
- Moro, S.; Rita, P.; Vala, B. Predicting social media performance metrics and evaluation of the impact on brand building: A data mining approach. J. Bus. Res. 2016, 69, 3341–3351. [Google Scholar] [CrossRef]
- Chua, A.Y.K.; Banerjee, S. Marketing via social networking sites: A study of brand-post popularity for brands in Singapore. In Proceedings of the International MultiConference of Engineers and Computer Scientists, Hong Kong, China, 18–20 March 2015; Volume 1, pp. 363–368. [Google Scholar]
- Bruce, N.I.; Murthi, B.P.S.; Rao, R.C. A Dynamic Model for Digital Advertising: The Effects of Creative Format, Message Content, and Targeting on Engagement. J. Mark. Res. 2017, 54, 202–218. [Google Scholar] [CrossRef]
- Cacioppo, J.T.; Petty, R.E. the Elaboration Likelihood Model of Persuasion. Adv. Consum. Res. 1984, 11, 673–675. [Google Scholar]
- Lohtia, R.; Donthu, N.; Hershberger, E.K. The impact of content and design elements on banner advertising click-through rates. J. Advert. Res. 2003, 43, 410–418. [Google Scholar]
- Drèze, X.; Hussherr, F.-X. Internet advertising: Is anybody watching? J. Interact. Mark. 2003, 17, 8–23. [Google Scholar] [CrossRef] [Green Version]
- Steuer, J. Defining Virtual Reality-Dimensions Determining Telepresence. J. Commun. 1992, 42, 73–93. [Google Scholar] [CrossRef]
- Coyle, J.R.; Thorson, E. The Effects of Progressive Levels of Interactivity and Vividness in Web Marketing Sites. J. Advert. 2001, 30, 65–77. [Google Scholar] [CrossRef]
- Fortin, D.R.; Dholakia, R.R. Interactivity and vividness effects on social presence and involvement with a web-based advertisement. J. Bus. Res. 2005, 58, 387–396. [Google Scholar] [CrossRef]
- Namin, A.; Hamilton, M.L.; Rohm, A.J. Impact of message design on banner advertising involvement and effectiveness: An empirical investigation. J. Mark. Commun. 2017, 1–15. [Google Scholar] [CrossRef]
- Joo, S.; Lu, K.; Lee, T. Analysis of content topics, user engagement and library factors in public library social media based on text mining. Online Inf. Rev. 2020, 44, 258–277. [Google Scholar] [CrossRef]
- Aydin, G. Social media engagement and organic post effectiveness: A roadmap for increasing the effectiveness of social media use in hospitality industry. J. Hosp. Mark. Manag. 2020, 29, 1–21. [Google Scholar] [CrossRef]
- Brookes, E.J. The Anatomy of a Facebook Post. Study on Post Performance by Type, Day Ofweek, and Time of Day; Vitrue Inc.: Atlanta, GA, USA, 2010. [Google Scholar]
- Robinson, H.; Wysocka, A.; Hand, C. Internet advertising effectiveness: The effect of design on click-through rates for banner ads. Int. J. Advert. 2007, 26, 527–541. [Google Scholar] [CrossRef]
- Lee, J.; Ahn, J.-H. Attention to Banner Ads and Their Effectiveness: An Eye-Tracking Approach. Int. J. Electron. Commer. 2012, 17, 119–137. [Google Scholar] [CrossRef] [Green Version]
- Kaplan, A.M.; Haenlein, M. Users of the world, unite! The challenges and opportunities of Social Media. Bus. Horiz. 2010, 53, 59–68. [Google Scholar] [CrossRef]
- Liu, Y.; Shrum, L.J. What is interactivity and is it always such a good thing? J. Advert. 2002, 31, 53–64. [Google Scholar] [CrossRef]
- Gavilanes, J.M.; Flatten, T.C.; Brettel, M. Content Strategies for Digital Consumer Engagement in Social Networks: Why Advertising Is an Antecedent of Engagement. J. Advert. 2018, 47, 4–23. [Google Scholar] [CrossRef]
- Wu, J.; Chen, J.; Chen, H.; Dou, W.; Shao, D. What to say on social media and how: Effects of communication style and function on online customer engagement in China. J. Serv. Theory Pract. 2019, 29, 691–707. [Google Scholar] [CrossRef]
- Lin, K.-Y.; Lu, H.-P. Why people use social networking sites: An empirical study integrating network externalities and motivation theory. Comput. Hum. Behav. 2011, 27, 1152–1161. [Google Scholar] [CrossRef]
- Park, N.; Kee, K.F.; Valenzuela, S. Being Immersed in Social Networking Environment: Facebook Groups, Uses and Gratifications, and Social Outcomes. CyberPsychol. Behav. 2009, 12, 729–733. [Google Scholar] [CrossRef] [Green Version]
- Meire, M.; Hewett, K.; Ballings, M.; Kumar, V.; Van den Poel, D. The Role of Marketer-Generated Content in Customer Engagement Marketing. J. Mark. 2019, 83, 21–42. [Google Scholar] [CrossRef]
- Muntinga, D.G.; Moorman, M.; Smit, E.G. Introducting COBRAs: Exploring motivations for brand-related social media use. Int. J. Advert. 2011, 30, 13. [Google Scholar] [CrossRef]
- Dolan, R.; Conduit, J.; Frethey-Bentham, C.; Fahy, J.; Goodman, S. Social media engagement behavior: A framework for engaging customers through social media content. Eur. J. Mark. 2019, 53, 2213–2243. [Google Scholar] [CrossRef]
- Hausman, A.V.; Siekpe, J.S. The effect of web interface features on consumer online purchase intentions. J. Bus. Res. 2009, 62, 5–13. [Google Scholar] [CrossRef]
- Luo, X. Uses and gratifications theory and e-consumer behaviors: A structural equation modeling study. J. Interact. Advert. 2002, 2, 34–41. [Google Scholar] [CrossRef]
- Taylor, D.G.; Lewin, J.E.; Strutton, D. Friends, Fans, and Followers: Do Ads Work on Social Networks? J. Advert. Res. 2011, 51, 258–275. [Google Scholar] [CrossRef]
- Wai Lai, I.K.; Liu, Y. The Effects of Content Likeability, Content Credibility, and Social Media Engagement on Users Acceptance of Product Placement in Mobile Social Networks. J. Theor. Appl. Electron. Commer. Res. 2020, 15, 1–19. [Google Scholar] [CrossRef]
- Men, L.R.; Tsai, W.H.S. How companies cultivate relationships with publics on social network sites: Evidence from China and the United States. Public Relat. Rev. 2012, 38, 723–730. [Google Scholar] [CrossRef]
- Kim, Y.J.; Han, J. Why smartphone advertising attracts customers: A model of Web advertising, flow, and personalization. Comput. Hum. Behav. 2014, 33, 256–269. [Google Scholar] [CrossRef]
- Lee, D.; Hosanagar, K.; Nair, H.S. Advertising Content and Consumer Engagement on Social Media: Evidence from Facebook. Manag. Sci. 2018, 64, 5105–5131. [Google Scholar] [CrossRef] [Green Version]
- Shimp, T.A.; Andrews, J.C. Advertising, Promotion, and Other Aspects of Integrated Marketing Communications, 9th ed.; South-Western, Cengage Learning: Mason, OH, USA, 2015; ISBN 0273676458. [Google Scholar]
- Jaakonmäki, R.; Müller, O.; vom Brocke, J. The Impact of Content, Context, and Creator on User Engagement in Social Media Marketing. In Proceedings of the 50th Hawaii International Conference on System Sciences, Hilton Waikoloa Village, HI, USA, 4–7 January 2017; pp. 1152–1160. [Google Scholar]
- Villamediana, J.; Küster, I.; Vila, N. Destination engagement on Facebook: Time and seasonality. Ann. Tour. Res. 2019, 79, 102747. [Google Scholar] [CrossRef]
- Kanuri, V.K.; Chen, Y.; Sridhar, S.H. Scheduling content on social media: Theory, evidence, and application. J. Mark. 2018, 82, 89–108. [Google Scholar] [CrossRef]
- Iqbal Khan, S.; Bilal, A.R.; Ahmad, B. Who will land and stay? Page-specific antecedents of news engagement on social media. Online Inf. Rev. 2020, 44, 1013–1025. [Google Scholar] [CrossRef]
- Srivastava, J.; Saks, J.; Weed, A.J.; Atkins, A. Engaging audiences on social media: Identifying relationships between message factors and user engagement on the American Cancer Society’s Facebook page. Telemat. Inform. 2018, 35, 1832–1844. [Google Scholar] [CrossRef]
- Corstjens, M.; Umblijs, A. The Power of Evil: The Damage of Negative Social Media Strongly Outweigh Positive Contributions. J. Advert. Res. 2012, 52, 433–449. [Google Scholar] [CrossRef]
- Li, Y.; Wu, R.; Li, D. The influence of subjective characteristics of social network sites on consumers’ word-of-mouth sharing. Online Inf. Rev. 2020, 44, 977–994. [Google Scholar] [CrossRef]
- IBISWorld. Global Advertising Agencies Industry-Market Research Report. Available online: https://www.ibisworld.com/global/market-research-reports/global-advertising-agencies-industry/ (accessed on 10 October 2019).
- Johnson, B. Samsung Overtakes P&G as World’s Largest Advertiser. AdAge. Available online: https://adage.com/article/news/global-marketers-2018-tktk/315743 (accessed on 10 October 2019).
- Uşaklı, A.; Koç, B.; Sönmez, S. How ‘social’ are destinations? Examining European DMO social media usage. J. Destin. Mark. Manag. 2017, 6, 136–149. [Google Scholar] [CrossRef]
- Interactive Advertising Bureau. IAB Turkey 2019 1H Digital Ad Spend. IAB AdEx-TR. Available online: https://www.iabturkiye.org/iab-turkey-released-2018-digital-ad-spend (accessed on 2 February 2020).
- Turkish Statistical Institute. Household Information Technologies (IT) Use Research; Turkish Statistical Institute: Ankara, Turkey, 2019.
- We Are Social. Digital in 2019. Available online: https://wearesocial.com/global-digital-report-2019 (accessed on 1 August 2019).
- We Are Social, Hootsuite. Digital in 2020. Available online: https://wearesocial.com/digital-2020 (accessed on 8 January 2020).
- Krippendorff, K. Content Analysis. In International Encyclopedia of Communication; Barnouw, E., Ed.; Oxford University Press: New York, NY, USA, 1989; pp. 403–407. [Google Scholar]
- Rust, R.T.; Cooil, B. Reliability Measures for Qualitative Data: Theory and Implications. J. Mark. Res. 1994, 31, 1. [Google Scholar] [CrossRef]
- Han, T.; Jiang, D.; Zhao, Q.; Wang, L.; Yin, K. Comparison of random forest, artificial neural networks and support vector machine for intelligent diagnosis of rotating machinery. Trans. Inst. Meas. Control 2018, 40, 2681–2693. [Google Scholar] [CrossRef]
- Jiawei, H.; Kamber, M.; Pei, J. Datamining Concepts and Techniques, 3rd ed.; Morgan Kaufmann: Waltham, MA, USA, 2012; ISBN 9780123814791. [Google Scholar]
- Samarasinghe, S. Neural Networks for Applied Sciences and Engineering: From Fundamentals to Complex Pattern Recognition, 1st ed.; Auerbach Publications: New York, NY, USA, 2006; ISBN 978-0-8493-3375-0. [Google Scholar]
- Breiman, L. Random forests. Mach. Learn. 2001, 45, 5–32. [Google Scholar] [CrossRef] [Green Version]
- Green, D. Facebook is Cracking down on Businesses that Lie to Customers in Their Ads. Business Insider. Available online: https://www.businessinsider.com/facebook-fights-misleading-ads-2018-6 (accessed on 9 September 2019).
- Hudson, S.; Huang, L.; Roth, M.S.; Madden, T.J. The influence of social media interactions on consumer-brand relationships: A three-country study of brand perceptions and marketing behaviors. Int. J. Res. Mark. 2016, 33, 27–41. [Google Scholar] [CrossRef]
- Lin, H.-C.; Swarna, H.; Bruning, P.F. Taking a global view on brand post popularity: Six social media brand post practices for global markets. Bus. Horiz. 2017, 60, 621–633. [Google Scholar] [CrossRef]


| Variable | Definition | Coding/Recoding | n | % |
|---|---|---|---|---|
| Contextual & Temporal Factors | ||||
| Industry (String) | Industry of the Brand | Automotive | 774 | 68% |
| Beverages | 336 | 30% | ||
| Brand (String) | Brand Name | Coca-Cola | 261 | 23% |
| Pepsi | 95 | 8% | ||
| Toyota | 301 | 27% | ||
| Renault | 473 | 42% | ||
| Post Day (String) | Day of the week -> recoded into weekday and weekend | Weekday | 999 | 88% |
| Weekend | 131 | 12% | ||
| Last Post Day (Number) | Number of days between the last post (0–26 days) -> recoded into four categories | 0: Same day | 165 | 15% |
| 1: One day, | 480 | 42% | ||
| 2: 2–3 days; | 290 | 26% | ||
| 3: 4+ days | 195 | 17% | ||
| Social Media Platform (String) | 613 | 54% | ||
| 517 | 46% | |||
| Video & Image Use (Vividness) | ||||
| Short Video 0–10 sec (Number) | Video 0–10 s | No (0) | 1028 | 91% |
| Yes (1) | 102 | 9% | ||
| Long Video 10+ sec (Number) | Video 10+ s | No (0) | 853 | 75% |
| Yes (1) | 277 | 25% | ||
| Historical Image (Number) | Images depicting past, historical things, people or places | No (0) | 1082 | 96% |
| Yes (1) | 48 | 4% | ||
| Futuristic Image (Number) | Images depicting futuristic, things, people or places | No (0) | 1121 | 99% |
| Yes (1) | 9 | 1% | ||
| Contemporary Image (Number) | Images from current things, people or places | No (0) | 587 | 52% |
| Yes (1) | 543 | 48% | ||
| GIF (Number) | Short animations made of pictures | No (0) | 1060 | 94% |
| Yes (1) | 70 | 6% | ||
| Interactivity of Content Shared | ||||
| Link to web site (Number) | Links to websites | No (0) | 808 | 72% |
| Yes (1) | 322 | 28% | ||
| Link or post of other social media (Number) | Links to other social media posts | No (0) | 1102 | 98% |
| Yes (1) | 28 | 2% | ||
| Gamification (Number) | Gamification applications such as point earning, mini-games leader-boards and so forth. | No (0) | 1098 | 97% |
| Yes (1) | 32 | 3% | ||
| With Hashtag (Number) | Use of hashtags in posts | No (0) | 390 | 35% |
| Yes (1) | 740 | 65% | ||
| With Tag (Number) | Use of tags in posts | No (0) | 1056 | 93% |
| Yes (1) | 74 | 7% | ||
| Question (Number) | Asking questions in posts | No (0) | 1027 | 91% |
| Yes (1) | 103 | 9% | ||
| Contests (Number) | Sweepstakes users participate by commenting or liking | No (0) | 1106 | 98% |
| Yes (1) | 24 | 2% | ||
| Event (Number) | Event announcements | No (0) | 1036 | 92% |
| Yes (1) | 94 | 8% | ||
| Informative Content (Information on……) | ||||
| Background Company (Number) | Informative content on the company | No (0) | 1053 | 93% |
| Yes (1) | 77 | 7% | ||
| Company Policy (Number) | Informative content on company policies | No (0) | 1085 | 96% |
| Yes (1) | 45 | 4% | ||
| Specific Product(s) (Number) | Informative content on existing or new products | No (0) | 407 | 36% |
| Yes (1) | 723 | 64% | ||
| Non-Commercial Information (Number) | Other Informative content (not on company or products) | No (0) | 806 | 71% |
| Yes (1) | 324 | 29% | ||
| The celebrative posts & Condolences (Number) | Observance of days of significance (e.g., national & religious holidays) | No (0) | 1031 | 91% |
| Yes (1) | 99 | 9% | ||
| Yes (1) | 187 | 17% | ||
| Advertising Content | ||||
| Direct (Number) | Ads (usually from mass-media) directly posted on social media | No (0) | 451 | 40% |
| Yes (1) | 479 | 42% | ||
| Indirect (Number) | Indirect, viral content; not adopted form mass media ad content | No (0) | 699 | 62% |
| Yes (1) | 431 | 38% | ||
| Promotional Content (Number) | Posts on promotions, trials, coupons and special offers | No (0) | 1107 | 98% |
| Yes (1) | 23 | 2% | ||
| Entertainment (Number) | Posts with entertaining content | No (0) | 943 | 83% |
| Yes (1) | 187 | 17% | ||
| Total Interaction (Number) | All post interaction created | Number of Likes + Comments + Reposts | 1130 | 100% |
| Engagement (Number) | All post interaction per one thousand followers | (Likes + Comments + Reposts)/(Total followers/1000) | 1130 | 100% |
| Algorithm | Accuracy | Error Rate | Cohen’s Kappa | Recall | Specificity | F1 Score |
|---|---|---|---|---|---|---|
| Decision Tree | 0.8094 | 0.1906 | 0.7459 | 0.8094 | 0.9365 | 0.8094 |
| Artificial Neural Networks | 0.7791 | 0.2209 | 0.6750 | 0.7797 | 0.9264 | 0.7785 |
| Random Forest Decision Tree | 0.6613 | 0.3387 | 0.5230 | 0.6612 | 0.8871 | 0.6607 |
| Logistic Regression | 0.4403 | 0.5597 | 0.2539 | 0.4403 | 0.8135 | 0.4385 |
| Variable * | #Splits Level 0 | Splits Level 1 | Splits Level 2 | Candidates Level 0 | Candidates Level 1 | Candidates Level 2 |
|---|---|---|---|---|---|---|
| Brand | 14 | 27 | 46 | 14 | 33 | 74 |
| Weekday/Weekend Post | 0 | 5 | 14 | 23 | 37 | 68 |
| Post Frequency | 18 | 23 | 40 | 20 | 43 | 81 |
| Social Media Platform | 21 | 22 | 27 | 22 | 38 | 72 |
| Short Video 0–10 s | 1 | 5 | 8 | 12 | 41 | 75 |
| Long Video 10+ s | 0 | 13 | 14 | 11 | 39 | 71 |
| Historical Image | 8 | 11 | 13 | 19 | 34 | 60 |
| Futuristic Image | 1 | 1 | 2 | 16 | 38 | 71 |
| Present Image | 1 | 8 | 22 | 18 | 38 | 76 |
| GIF | 2 | 7 | 4 | 21 | 41 | 79 |
| Link to web site | 6 | 4 | 18 | 18 | 33 | 62 |
| Link to or post of other social media | 5 | 3 | 5 | 21 | 42 | 66 |
| Gamification elements | 0 | 4 | 8 | 20 | 36 | 75 |
| Hashtag Use | 7 | 9 | 16 | 19 | 36 | 65 |
| Tag Use | 3 | 2 | 8 | 17 | 28 | 77 |
| Questions | 0 | 1 | 4 | 13 | 32 | 67 |
| Contests | 0 | 1 | 2 | 25 | 40 | 67 |
| Events | 2 | 6 | 18 | 19 | 46 | 85 |
| Entertainment | 0 | 4 | 13 | 14 | 42 | 73 |
| Info on Company | 6 | 6 | 10 | 14 | 32 | 73 |
| Info on Company Policies & Procedures | 1 | 11 | 9 | 21 | 49 | 76 |
| Info on Product(s) | 1 | 4 | 21 | 16 | 31 | 82 |
| Non-Commercial Info | 0 | 5 | 21 | 20 | 34 | 80 |
| Celebrative content & condolences | 3 | 8 | 14 | 15 | 39 | 76 |
| Direct ad content | 0 | 5 | 8 | 24 | 35 | 81 |
| Indirect (viral) ad content | 0 | 4 | 15 | 27 | 38 | 83 |
| Promotional Content | 0 | 1 | 2 | 21 | 25 | 85 |
| Category | Sensitivity | Sub-Category | Sensitivity |
|---|---|---|---|
| Interactivity | 27.08% | Last Post Day | 13.58% |
| Last Post Day | 13.58% | Brand | 9.08% |
| Information | 12.11% | Social Media Platform | 4.43% |
| Image | 11.46% | Gamification | 4.05% |
| Brand | 9.08% | With Tag | 3.73% |
| Video | 6.61% | Event | 3.59% |
| Social Media Platform | 4.43% | Link or post of other social media | 3.52% |
| Advertising Posts | 3.74% | GIF | 3.51% |
| Weekday/Weekend post | 3.17% | Long Video | 3.48% |
| Entertainment | 3.13% | Info on Specific Product(s) | 3.46% |
| Celebrative content & condolences | 2.93% | Question | 3.36% |
| Promotional Content | 2.67% | Contests | 3.29% |
| Info on Background Company | 3.26% | ||
| Post Weekday/Weekend | 3.17% | ||
| Short Video | 3.13% | ||
| Entertainment | 3.13% | ||
| Present Image | 3.06% | ||
| Celebrative content & condolences | 2.93% | ||
| Link to web site | 2.88% | ||
| Non-Commercial Information | 2.75% | ||
| Promotional Content | 2.67% | ||
| With Hashtag | 2.66% | ||
| Info on Company Policy | 2.64% | ||
| Historical Image | 2.61% | ||
| Futuristic Image | 2.29% | ||
| Indirect ad content (viral) | 1.88% | ||
| Direct ad content | 1.86% |
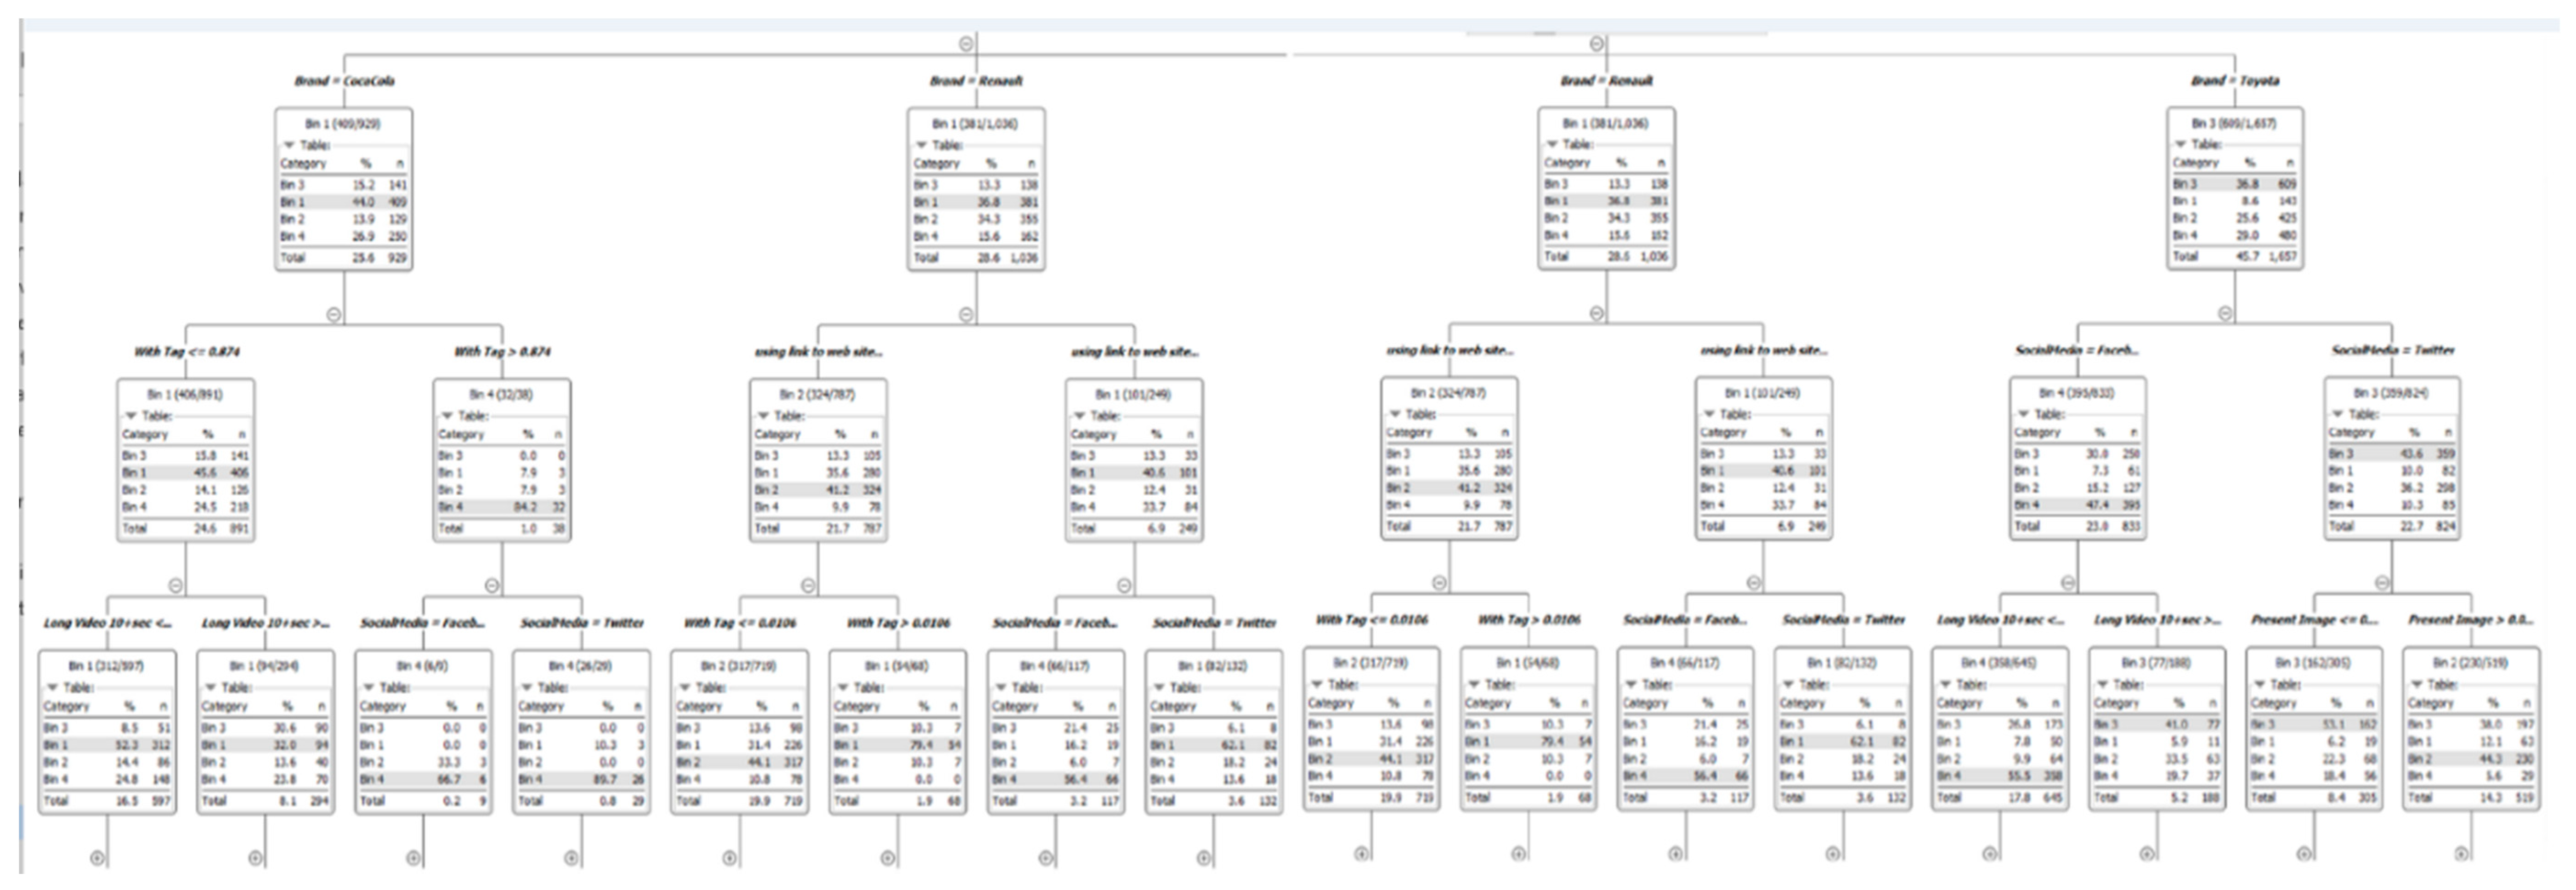
| Brand | ||
|---|---|---|
| Toyota | Avoid posting more than once daily | Post daily or once every 2–3 days; avoid posting more than once daily or posting less frequently than once every four or more days |
| Use short videos | Use long videos | |
| If not using videos, use hashtags | Use hashtags if you are posting more than once daily | |
| If not using videos or hashtags, post once every 1–3 days and ask questions and avoid giving direct links to other pages or posts | Use viral videos if posting daily | |
| If posting long videos, post on weekdays not on weekends | If not posting long videos, use tags with GIFs | |
| Renault | Better engagement if posting once every 1–3 days | If you are not posting specific product information on Twitter, use hashtags (preferably on weekdays) |
| Don’t post more than once daily; If posting more than once daily, use short videos | If you are posting specific product information on Twitter, use entertaining posts or questions | |
| Use links to websites or other posts if you are posting every 2 + days | Using indirect advertising content is better than using advertising content if using images. | |
| Avoid posting informative posts that have non-commercial information content | If not using hashtags, use long videos. | |
| If you are rarely posting (4+ days between posts) informative posts regarding company perform better | ||
| If you are rarely posting (4+ days between posts), providing links in post content performs better on Facebook than Twitter | ||
| Coca-Cola | On weekends, use links | Gamification performs better |
| Long videos perform better | ||
| On both platforms, use tags | ||
| On both platforms, if not using tags, use gamification | ||
| On both platforms, if not using tags or gamification and posting rarely (once every 4+ days), use entertaining posts | ||
| On both platforms, use images instead of short videos if posting daily | ||
| On both platforms, if posting more than once each day, post short videos on weekends. | ||
Publisher’s Note: MDPI stays neutral with regard to jurisdictional claims in published maps and institutional affiliations. |
© 2021 by the authors. Licensee MDPI, Basel, Switzerland. This article is an open access article distributed under the terms and conditions of the Creative Commons Attribution (CC BY) license (http://creativecommons.org/licenses/by/4.0/).
Share and Cite
Aydin, G.; Uray, N.; Silahtaroglu, G. How to Engage Consumers through Effective Social Media Use—Guidelines for Consumer Goods Companies from an Emerging Market. J. Theor. Appl. Electron. Commer. Res. 2021, 16, 768-790. https://0-doi-org.brum.beds.ac.uk/10.3390/jtaer16040044
Aydin G, Uray N, Silahtaroglu G. How to Engage Consumers through Effective Social Media Use—Guidelines for Consumer Goods Companies from an Emerging Market. Journal of Theoretical and Applied Electronic Commerce Research. 2021; 16(4):768-790. https://0-doi-org.brum.beds.ac.uk/10.3390/jtaer16040044
Chicago/Turabian StyleAydin, Gokhan, Nimet Uray, and Gokhan Silahtaroglu. 2021. "How to Engage Consumers through Effective Social Media Use—Guidelines for Consumer Goods Companies from an Emerging Market" Journal of Theoretical and Applied Electronic Commerce Research 16, no. 4: 768-790. https://0-doi-org.brum.beds.ac.uk/10.3390/jtaer16040044