
Effect of Interactivity Level and Price on Online Purchase Intention

Tilburg School of Humanities and Digital Sciences, 5037 AB Tilburg, The Netherlands
*
Author to whom correspondence should be addressed.
J. Theor. Appl. Electron. Commer. Res. 2022, 17(2), 652-668; https://0-doi-org.brum.beds.ac.uk/10.3390/jtaer17020034
Submission received: 15 February 2022
/
Revised: 30 April 2022
/
Accepted: 2 May 2022
/
Published: 10 May 2022
(This article belongs to the Section Digital Marketing and the Connected Consumer)
Abstract
:As e-commerce approaches 17% of total retail sales companies are looking for opportunities to increase customer purchase conversion. In a competitive marketplace it becomes increasingly important to consider the effects of display techniques on purchase intention. Limited research has been conducted into interactivity, product display and their effect on purchase intentions on real-world retail websites, predominantly choosing to use random or student samples. This study investigates whether interactivity within retail websites positively correlates with purchase intentions for both low-cost and high-cost products and whether this effect is proportionally higher in high-cost products. It considers whether this purchase intention in high-cost products is influenced by higher levels of supplementary information. 405 participants experienced a simulated environment within a real-world retail website they had previously shopped at. Questionnaire results were analysed using ANCOVA and principal components analysis with three new components (purchase intention, attitude towards products and repeat product enjoyment) emerging. Results showed a higher purchase intention for more interactive products particularly more expensive ones. Interactive products produced a 54% higher purchase intention overall. In this paper, a new three-component solution to assess purchase intention for online home décor products is presented along with results which indicate that interactivity levels positively affect purchase intention for this particular product segment, particularly higher-cost products.
1. Introduction
It is anticipated that by 2022, e-commerce will account for 17 percent of total global retail sales [1]. The UK has a developed internet retail sector with more than 30% of all retail sales in 2020 being online, having risen sharply due to the Coronavirus pandemic [2,3], before returning to 27.9% in 2021 [4]. The UK has one of the highest penetrations of homeware and furniture online sales among all the major Western markets, and homewares significantly outperformed the UK average [3]. Online retail revenue is expected to continue to grow from USD 5 bn in 2015 to USD 9.6 bn in 2020 [5], with home décor projected to outperform all other UK home sectors [6]. In Western Europe, consumers make an average of 18.9 online transactions a year, with home décor being one of the few categories demonstrating real growth potential [7]. Major research opportunities exist around examining which media design variables found in interactive environments most strongly influence perceptions of usefulness, enjoyment and ease of use in this category [8].
Thorough understanding of consumer needs and expectations are crucial for companies to be able to develop the right tools to enhance their display, which in turn should result in increased profits [9]. For many businesses, given the fact that only 5% of visits result in a conversion on average [10], purchase conversion is a key indicator of the success of their website, and the most important aim of retail websites is to convert awareness to purchases [11].
Online purchase intention is an important predictor of actual purchasing decisions [12]. Purchase intentions and actual purchasing behaviours are generally accepted to be linearly related [13]. In this case, an intention to purchase is a useful proxy for measuring whether a consumer would actually have bought a product had it not been a simulation [14,15] and is widely used by academic researchers as a proxy measure [16]. In a real-world sense, conversion is the key indicator of success in traditional retail since stores assess the effectiveness of their merchandising strategy against physical sales taken.
The majority of studies into online purchasing behaviour use fictitious retail sites set up purely for experimental purposes [17,18,19] to which participants (often students [20]) would have no prior exposure, mainly citing financial constraints but also as researchers generally would not have access to functioning online stores to test with. This study therefore has valuable new data, since it has been conducted with confirmed customers on a real-world live internet store with actual products (albeit the test conditions whilst realistic did not actually allow the ability to purchase, merely for participants to consider if they would purchase). All participants in this study had previously purchased a physical product with no financial incentive at this same website and had a positively confirmed interest in these particular products, which would arguably make the results more reliable for this product segment than a random sample who may have no interest in the sector.
Browsing customers may well convert to a purchasing ones as a direct result of online atmospheric cues received during the site, since goal orientation can be altered somewhere within the search and purchase process by innovative behavioural changes [21]. Many consumers may also change from browsing to purchasing when affected by impulse since it drives 40% of web purchasing [22] and the majority of purchasers are “non-intenders” [23].
When experiencing an online environment, a consumer either elicits an approach (positive) or avoidance (negative) behaviour, which controls the outcome of their visit and indicates whether they will purchase or not [24]. Whilst atmospherics may be thought of as aesthetic in nature, they can have significant effects on purchase intentions. Research has demonstrated that websites with pleasant online environments have a positive effect on the users [24,25,26] where such an effect leads to a “value outcome” [27], which depending on the research conducted would be an increase in “customer satisfaction” [28,29,30,31,32], an “intention to purchase” [33,34] or a “conversion” [10,12,35,36].
The findings of this research can contribute to an explanation about the effect of interactivity on purchase intention for products specifically in the home décor product segment and give consideration to the differential effect of purchase intention between high and low-cost home décor products.
The results of the study indicate that the more interactive a product, the higher the purchase intention in particular for more expensive products, with a 54% increase in overall purchase intention. Higher levels of supplementary information did not affect purchase intention for this particular type of home décor product. This research presents a new three-component solution to assess purchase intention for the specific segment of home décor products and has established not only that that interactivity levels positively affect purchase intention but also that interactivity levels are even more important in establishing purchase intention in higher-cost products. Recommendations and suggestions for further research are included.
1.1. Interactivity
There is little agreement on the definition of interactivity [37,38,39,40] with the word “interactive” often used as a synonym for new media [41]. Taking into account basic assumptions within the literature, it may be viewed as a situation where a user perceives they have control over an environment where a response or feedback is provided from their input and the degree to which communication technology creates mediated environments allowing communication and reciprocal message exchanges [11,40,42]. Developing and strengthening the interactive features of websites may be a possible method for gaining competitive advantage online [43].
It has been established in several studies that the effect of interaction and the method which needs to be used for optimal purchase intention and conversion differs widely by category and type [11,26,44,45]. Very limited research has been conducted, specifically into the home décor segment with the majority centred on apparel retail [14,26,29,46,47,48,49,50,51], electronics [18,34,52,53], sunglasses [54], books [11,55,56], wine [57] and food retail [11,30,47,58]. Office furniture was considered in an earlier study [59], but since this is a potentially utilitarian product by its nature rather than a décor product (which are often categorised as hedonic), the findings are not necessarily comparable and optimal display methods not necessarily aligned [60].
Whilst previous research has found that purchase intentions were increased by the use of 3D models to increase enjoyment in the virtual environment [26,31], subsequent studies have discovered that providing excessive information can cause information overload for customers and actually reduce sales [61]. Researchers concluded that whilst more interactivity could increase engagement (and therefore sales), the actual impact of such interactivity is a promising area of future research.
The majority of internet shoppers feel that they cannot purchase clothing without having tried it on [15], which is one of the biggest problems in online shopping [13]. Issues with the lack of tangibility could reasonably be expected to permeate to other product categories in addition to apparel, so the importance of interactive techniques for demonstrating virtual products should not be underestimated. Whereas in a physical shop a shopper may touch and feel a product as part of a critical appraisal prior to purchase, such tactile cues are unavailable on the internet, so the lack of such experience when compensated with a realistic representation may elicit the same purchase behaviours. Previous research with apparel products found that altering display functions and presenting dummy modifications to personal measures had a positive effect on purchasing decisions [16] and that 3D images can increase purchase intentions as customer satisfaction increases [62].
Much of the literature points towards interactivity prompting users to interpret sites as more attractive [63], higher quality [11,64,65,66], encouraging higher purchase intentions overall but without consideration of price [52,66], greater satisfaction [67,68] and customer conversion [29]. However, limited research has been undertaken regarding the impact of interactivity on purchase intention within the home décor product segment and the implications for products at different price points.
Hypothesis 1 (H1).
Interactivity level will positively correlate with purchase intentions for both low-cost and high-cost home décor products.
1.2. The Effect of Price on Purchase Conversion
Whilst much research has been conducted into the role of product price in a bricks-and-mortar context, price consideration is a relatively new area of research in terms of online products. Price sensitivity may be lower when nonprice attributes (which would include display) are taken into account [69]. Price is a key component of websites and is therefore integral to the shopping experience [17,70].
The average price point of these types of home décor products is around the average online retail basket spending figure of GBP 35 [71]. This could make the research broadly applicable to similar categories of products with similar price points. Despite price being identified as a key component affecting online shopping motives, the sale price of products in relation to display methods used has not been a key consideration in the majority of the studies in this area to date. Research conducted into interactive display of garments on female mannequins actually excluded price completely from the selection process [72]. Other studies have picked products with price points not necessarily representative of a common purchase of their participant group—for example asking a student sample to imagine shopping for a laptop priced in the range of USD 1400–USD 2400 [66], which would arguably be beyond the financial means of many students. Likewise, other studies considered the niche category of specialist wine using a student and staff sample from a university [57] who may not have been typical consumers of this product.
Clearly, the definition of high- and low-priced products varies per category (for example a cheap dress might cost GBP 30, whereas a cheap car might cost GBP 5000, although both remain subjective to the individual). When considering any given category and the differential effect of price in relation to interactivity and purchase intention, a full market analysis would be conducted ensuring that a realistic split had been obtained between high- or low-cost products.
Hypothesis 2 (H2).
More Interactive displays will produce a proportionally higher purchase intention effect in high-cost home décor products.
1.3. Use of Textual Supplementary Information
Purchase intentions were increased by the use of 3D models to increase enjoyment in the virtual environment [26], with increased interactivity in product videos increasing engagement and therefore sales [61]. Developing and strengthening the interactive features of websites may be a possible method for gaining competitive advantage online [43]. However, research conducted considering computer desks with 3D displays had mixed results, with further research being required showing that the novelty of 3D displays increased purchase decisions but that 3D display combined with textual information actually slightly decreased, with the authors citing information overload as a possible explanation—i.e., that the combination of 3D display with textual information reduced participant enjoyment as it reminded them of the utilitarian nature of their potential purchase [59]. Notwithstanding this, a conclusion was drawn that the combination of 3D presentations and textual information work in combination to assist consumers in making decisions and that participants reported a desire to use 3D presentations in the future should they be available for a product being purchased.
Textual information in studies considered books when “extensive and higher-quality” may affect consumer satisfaction [55,56] and increase purchase intention. The research indicates that for some products the use of textual information increases purchase intention, whereas for others it reduces it due to information overload. Since purchases which are more expensive would arguably require a higher level of commitment to buy, this may be affected by the amount of information available to make the decision. Limited research has been conducted regarding home décor products and the effect that supplementary information has on purchase intentions.
Hypothesis 3 (H3).
Higher levels of supplementary information will produce a higher purchase intention effect in high-cost home décor products.
2. Methods
The focus of this study was to ascertain whether interactivity within retail websites positively correlates with purchase intentions for both low-cost and high-cost products and whether this effect is proportionally higher for high-cost products. It also set out to confirm whether purchase intention in high-cost products is influenced by higher levels of supplementary information provided alongside products.
Participants were selected via an opted-in mailing list of an existing UK real-world retail website consisting of customers who had previously purchased a physical product. Participation was encouraged with the incentive of a discount voucher for use on the site in the future on completion of the study. A series of pre-tests were run using 15 participants with varying degrees of online shopping experience to consider the layout for the more interactive display and to ensure that the controls were easy enough to navigate and understand. After considering participant feedback the layout below was shown.
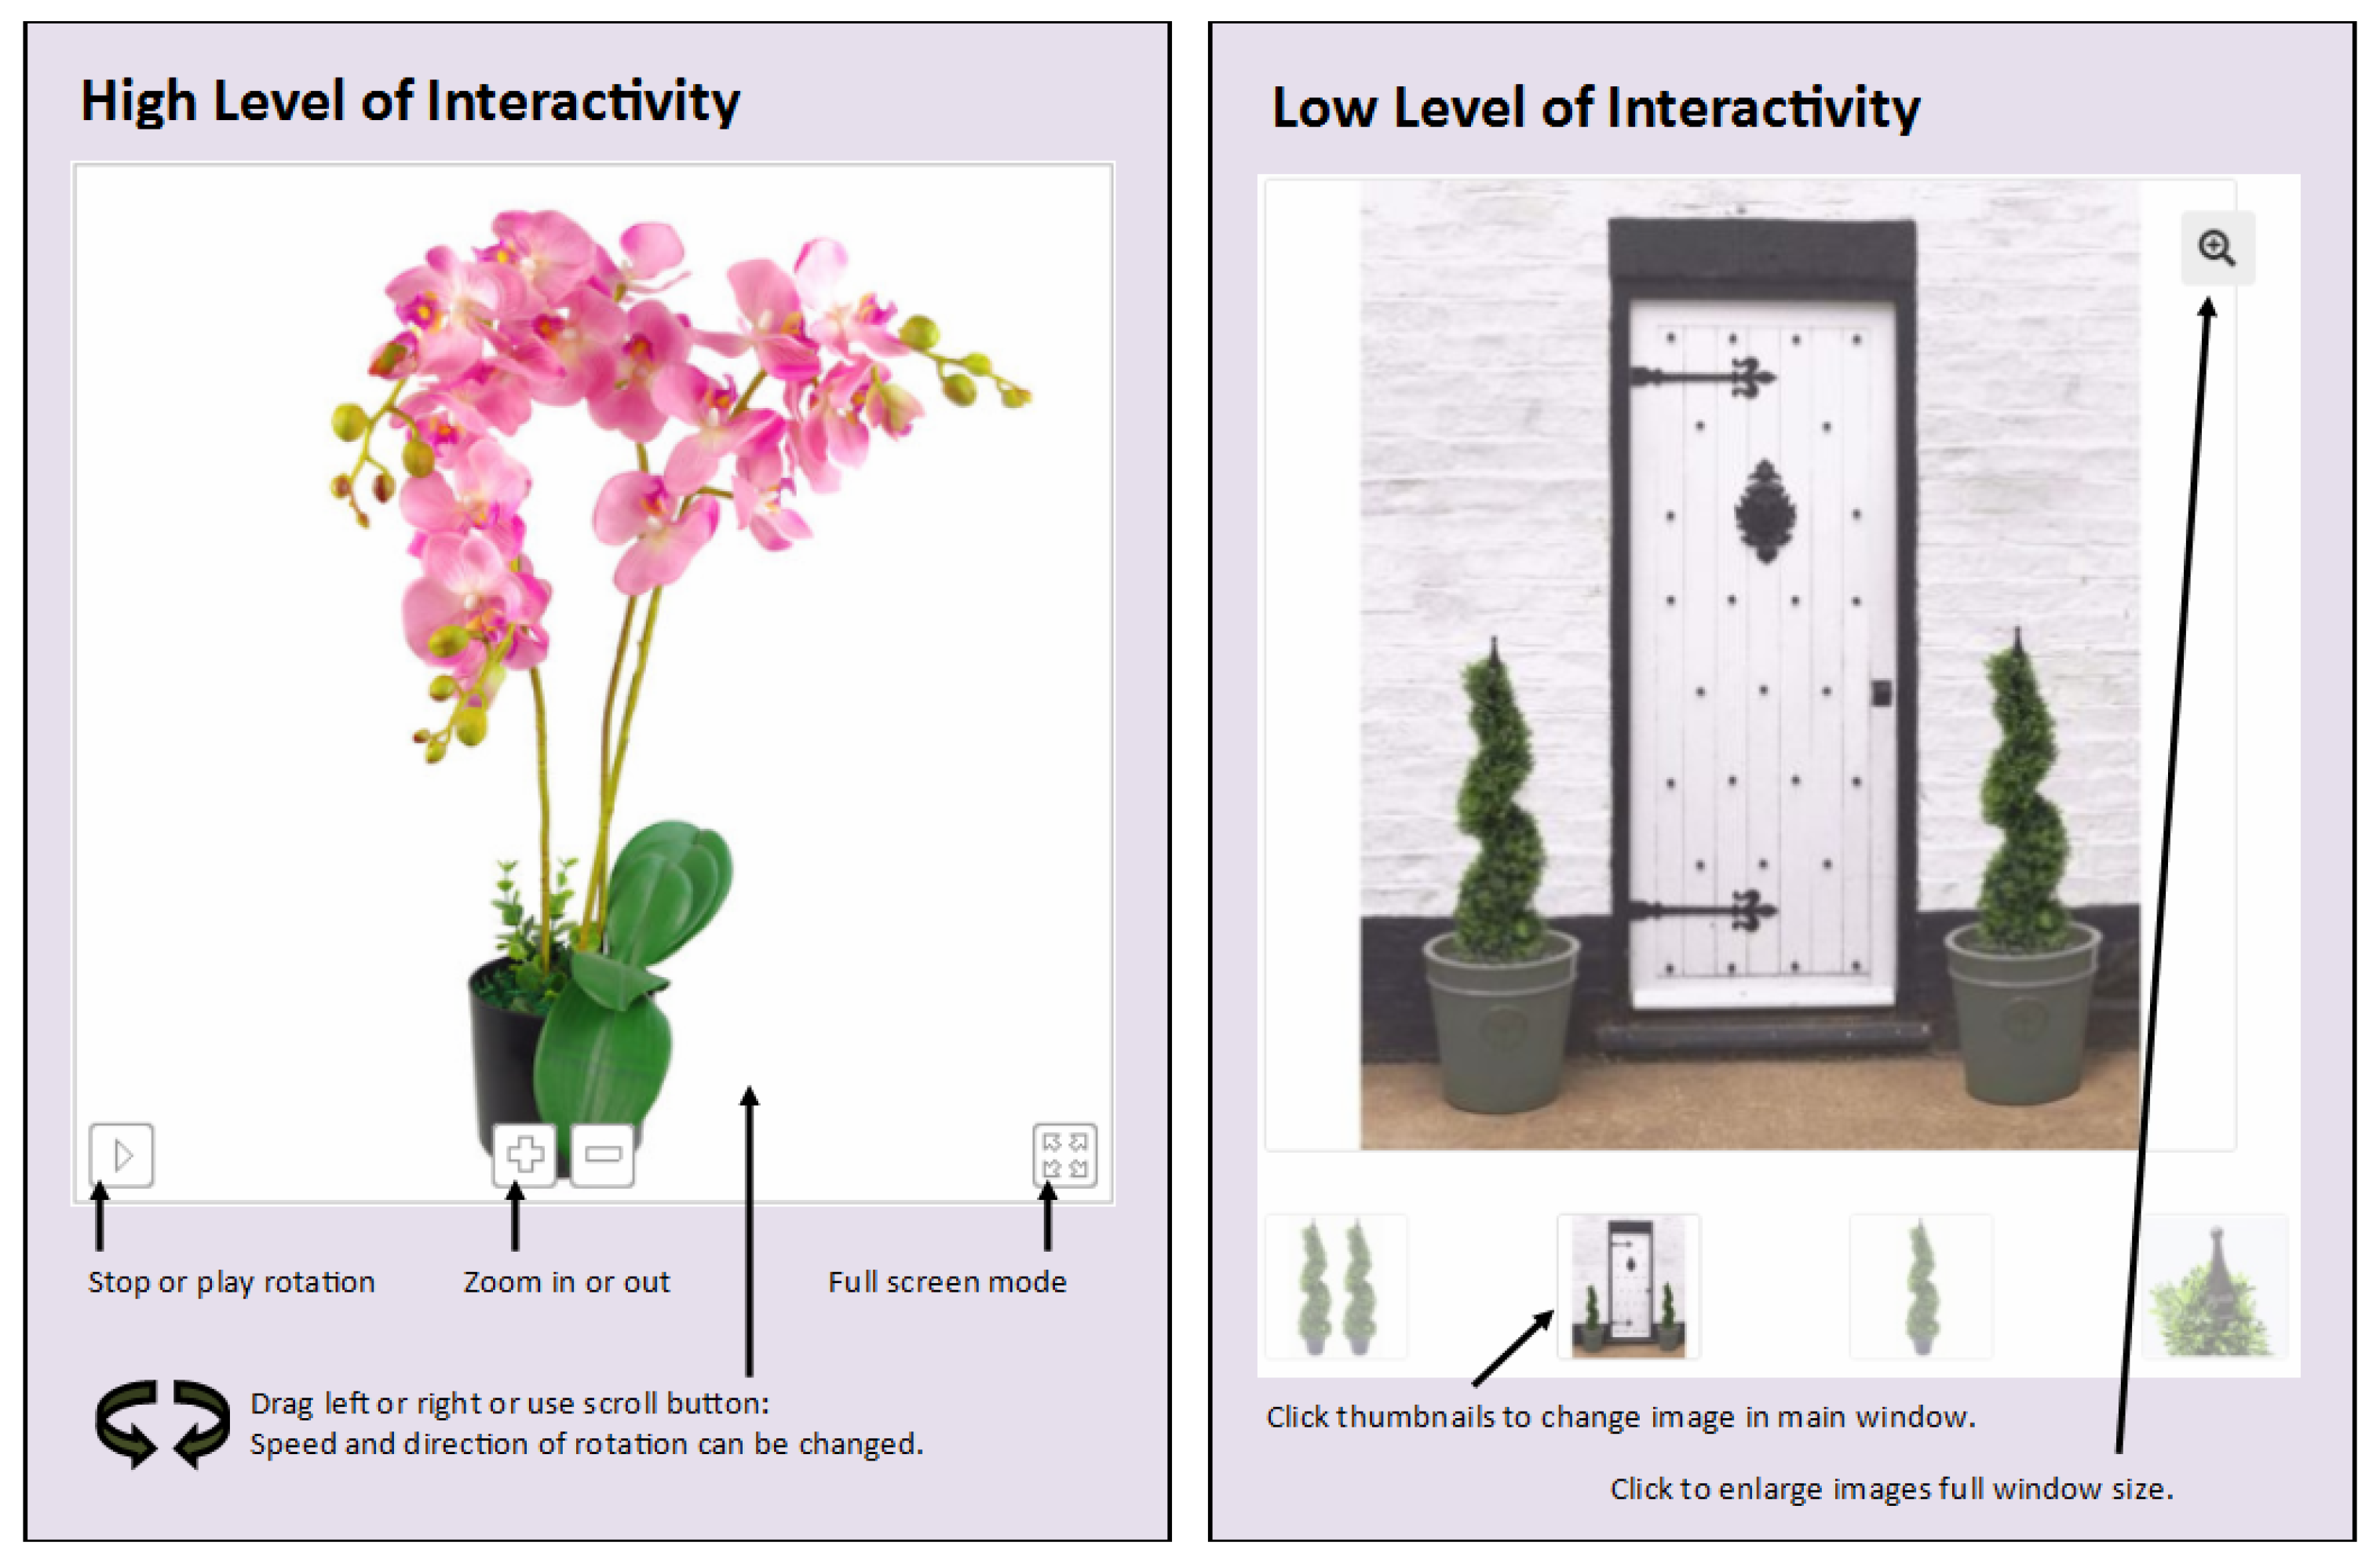
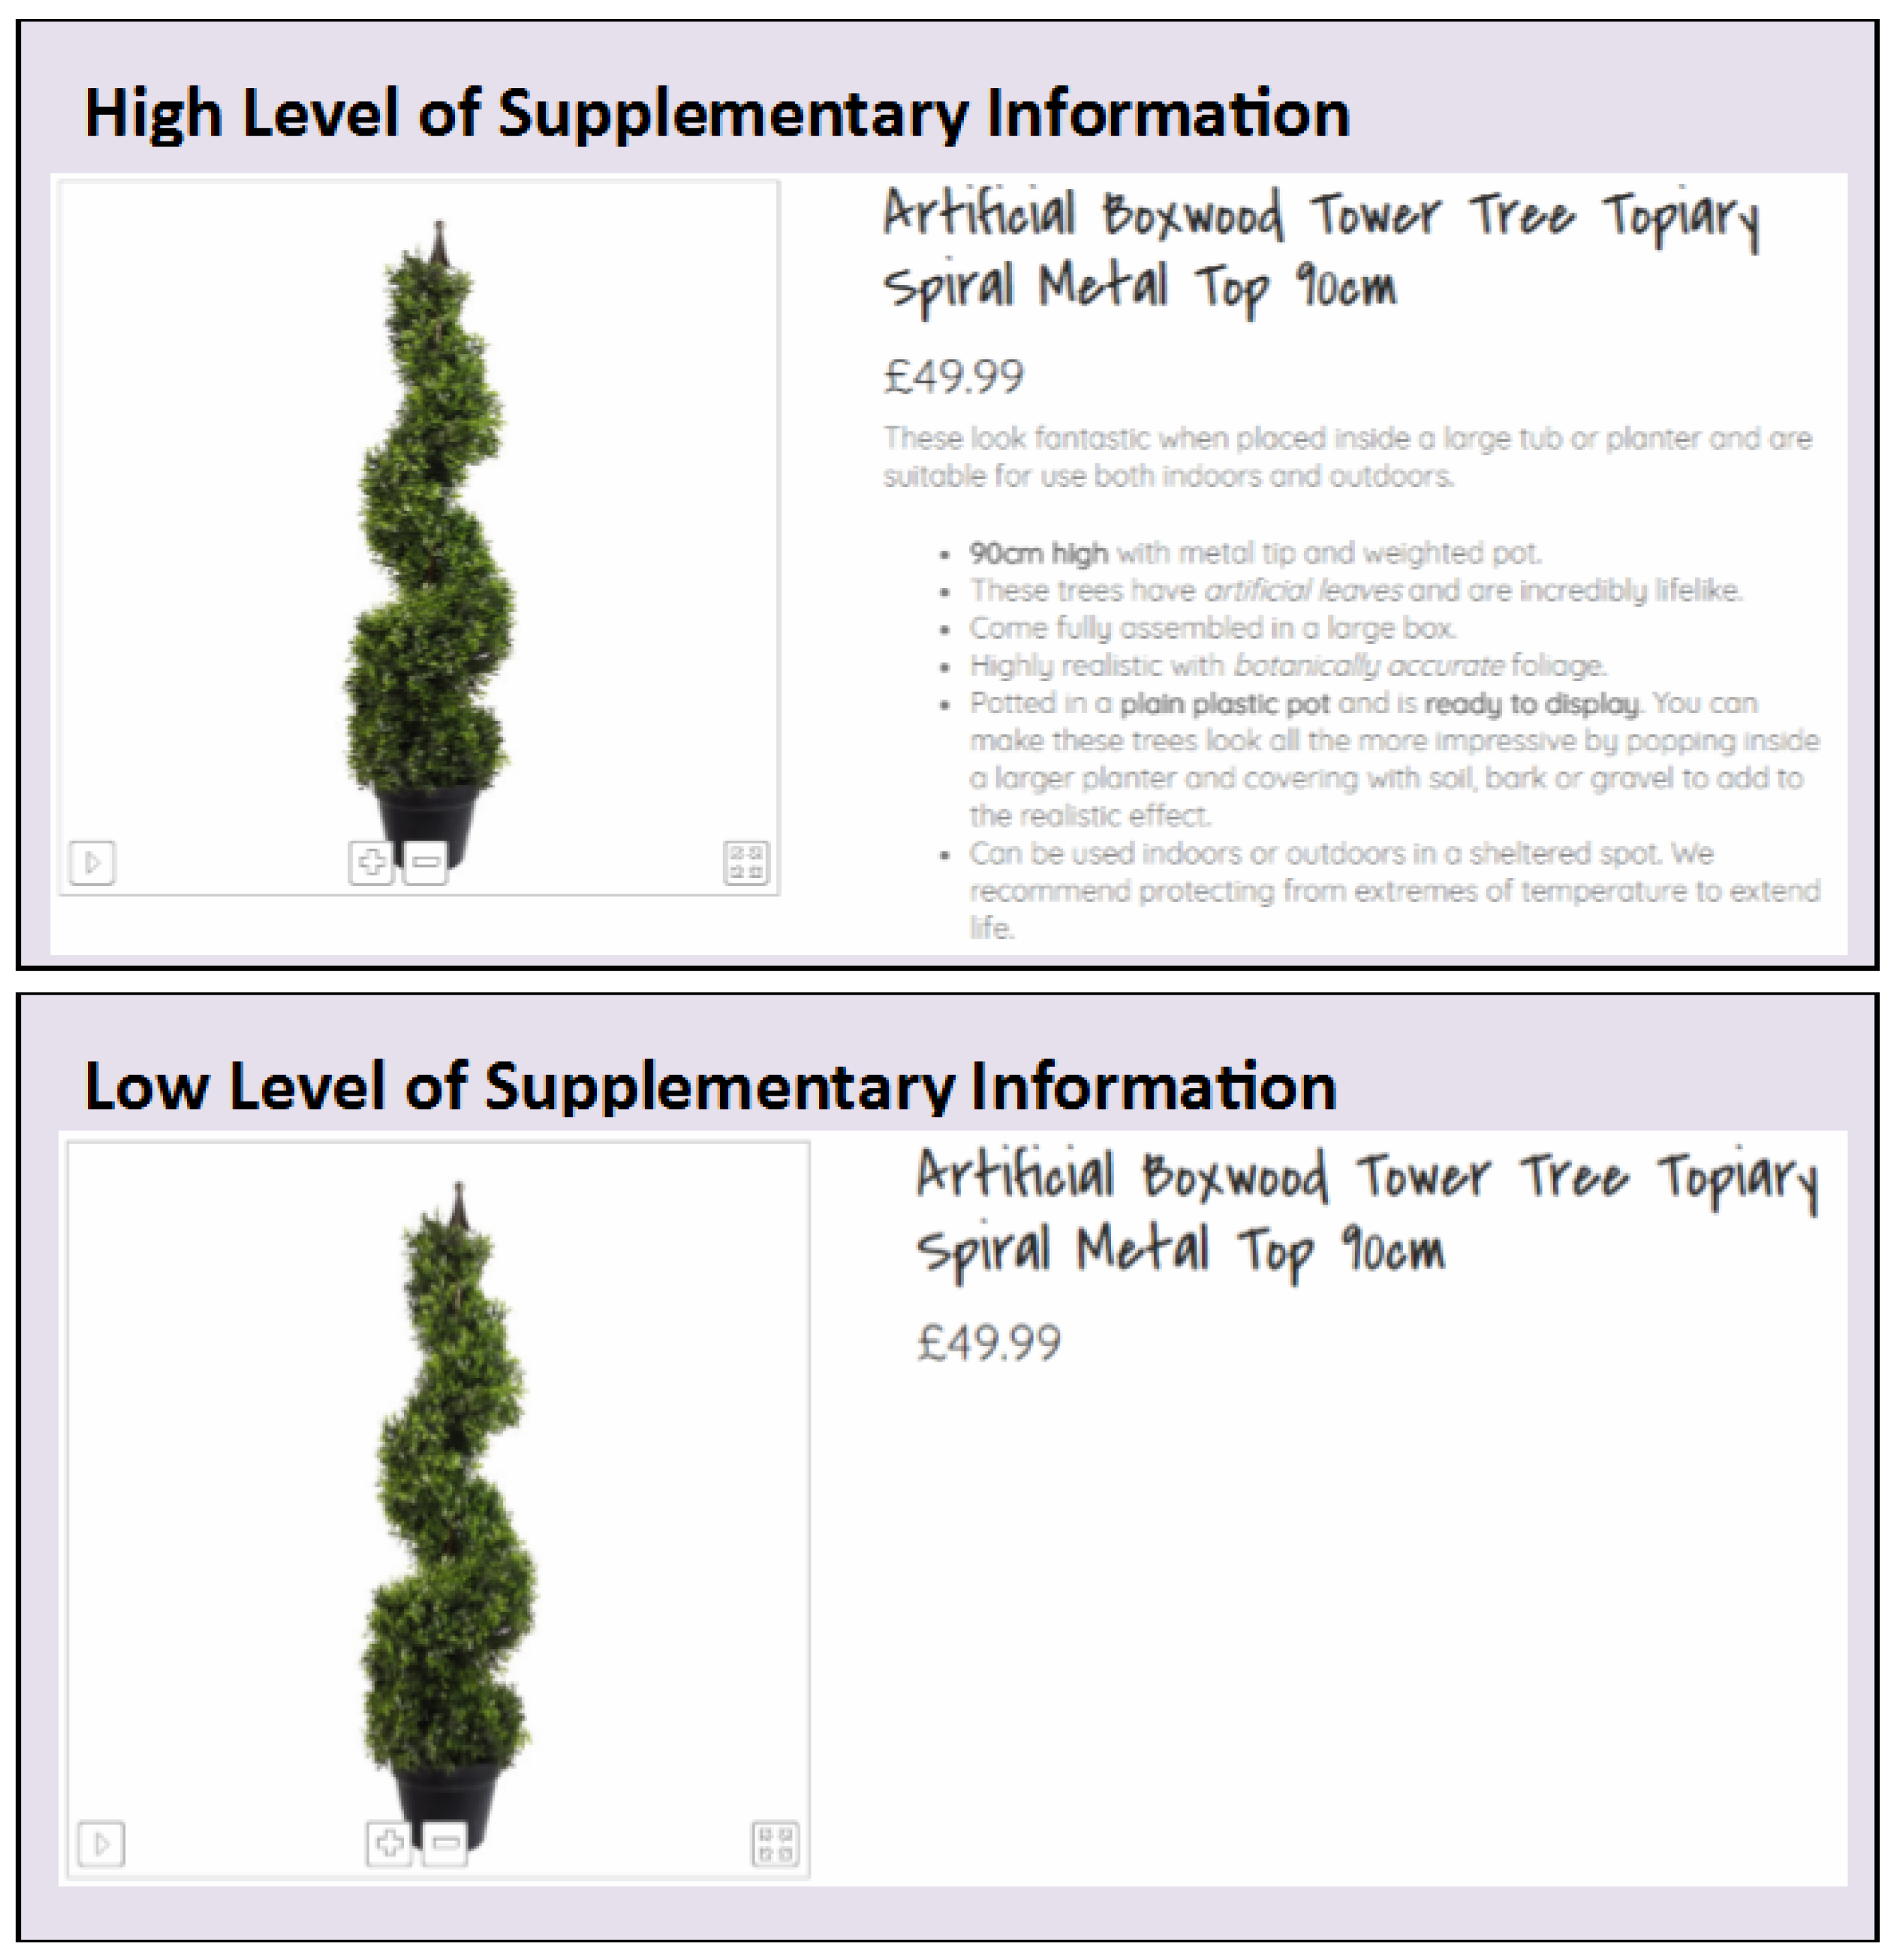
Participants were randomly assigned to one of eight experimental conditions, with a simulated internet shopping page displaying three products with a three-way factorial design with varying degrees of interactivity: high (3D controllable view) or low (simple multiview pictures—Figure 1); supplementary information: high (with supplementary descriptive text) or low (with basic information only—Figure 2) and variance in product cost (high or low), products for which were selected following an analysis of three major online retailers selling similar products to ascertain average selling prices and ensure the products were correctly categorised.
This was a between-subject design, with each participant being exposed to a single experimental condition to avoid order effects [24,73,74]. An initial collection of demographic data such as age, gender, years of internet experience [60], online shopping frequency and spending [29] was conducted to assess levels of prior experience, whether demographics correlate with those found in the general internet population similar to that used in previous studies [31,55,59] and facilitate the removal of outliers if appropriate.
The imposition of limits on observation times for product study were previously found to be detrimental to results as it reduced the reality of the simulation [75], therefore, for the purposes of this study, there was no restriction placed on the amount of time participants could take [59]. A series of pre-tests were run using 15 participants with varying degrees of online shopping experience to consider the layout for the more-interactive display and to ensure that the controls were easy enough to navigate and understand. Once participants had viewed the products, they proceeded to the questionnaire section of the study.
The independent variables considered in the study were active control (degree of interactivity), product cost (low-cost/high-cost) and level of information (high/low), with a single dependent variable which was purchase intention/conversion.
Questionnaire
Quantifiable responses, generally collected via questionnaires using Likert scales, are widely used to measure website success as much research is conducted via trials on fictitious websites with no actual real products to buy [33,34]. In this case, an intention to purchase is as close as they can come to measuring whether a consumer would actually have bought a product had it not been a simulation.
A questionnaire broken into four sections was provided: attitude towards products, attitude towards websites using similar displays of products, likelihood of purchase (purchase intention—the “outcome of attitude which refers to the customer’s willingness to buy from a particular e-retailer” [76]) and intention to view interactive products in the future. All questions had been used reliably in previous studies [59,77,78].
Since purchase intentions are directly affected by customer satisfaction [69,79], the questions relating to attitude towards the products and intention to view interactive products online in the future were retained to allow customer satisfaction to be interpreted in relation to the direct questions about likelihood of purchase.
With four questions per section, the threshold for evaluation of internal consistency was met [80]. The five-point Likert scale selected allowed a neutral answer for each question. Each Likert item had named categorisation, as it has been found to promote levels of reliability and is user-friendly [81]. The spacing between the responses was also equidistant, as when accompanied by a visual scale where there is an equal spacing of response levels they can be considered interval data [82,83,84]. Some scales were reversed to discourage acquiescent responses. All submissions were complete as omitting an answer to any question prevented the questionnaire being submitted and the missing information highlighted as an error.
Previous research in this specific area has used a combination of semantic pairs [48,59,77,78] and Likert scales (composed of a number of “Likert-type items” [83,84]) to give a more accurate data set [85], since the semantic pairs can measure attitude and the emotional responses to situations, whereas the Likert items obtain a direct response to a question and measure intention.
3. Results
The study was sufficiently powered with 405 completed responses received (above the recommended sample of 308 from the power calculation with alpha = 0.05 and power = 0.8) split between the conditions. The Likert scale used had a high level of internal consistency as determined by a Cronbach’s alpha of 0.84 [86].
Results of the demographic questions demonstrated a gender imbalance in respondents with 65.2% of the sample being female, and this split was broadly similar in all test conditions. Participants considered themselves to be predominantly regular or frequent online shoppers.
The data from the study was then assessed using ANCOVA. There were three outlying results in the data when studentised residuals were assessed which had greater than ±3 standard deviations. At 3.00, 3.01 and 3.04, these were only slightly above the threshold. As the deviance could not be attributed to data entry error (as participants supplied their own responses to the questions which were recorded electronically), and no obvious cause could be assigned to them being considered outliers, it was decided to retain these values within the data. There was homoscedasticity within each combination of groups of the independent variables, as assessed by visual inspection of the scatter plots and visual inspection of the studentised residuals plotted against the predicted values for each group. A log transformation was applied to the data and it was determined that there was homogeneity of regression slopes, as determined by a comparison between the two-way ANCOVA model with and without interaction terms, F(7389) = 1.99 and p = 0.56. There was homogeneity of variances, as assessed by Levene’s test of homogeneity of variance p = 0.117. All leverage points were ≤0.1, which is acceptable, and there were no Cook’s distance values above 0.3 [87]. Studentised residuals were not normally distributed as assessed by a Shapiro–Wilk’s test where p < 0.05. However, the decision was made to proceed with the analysis as ANCOVA is robust provided sample sizes are sufficiently large and equal or nearly equal, as they were in this study.
3.1. Principle Components Analysis Results
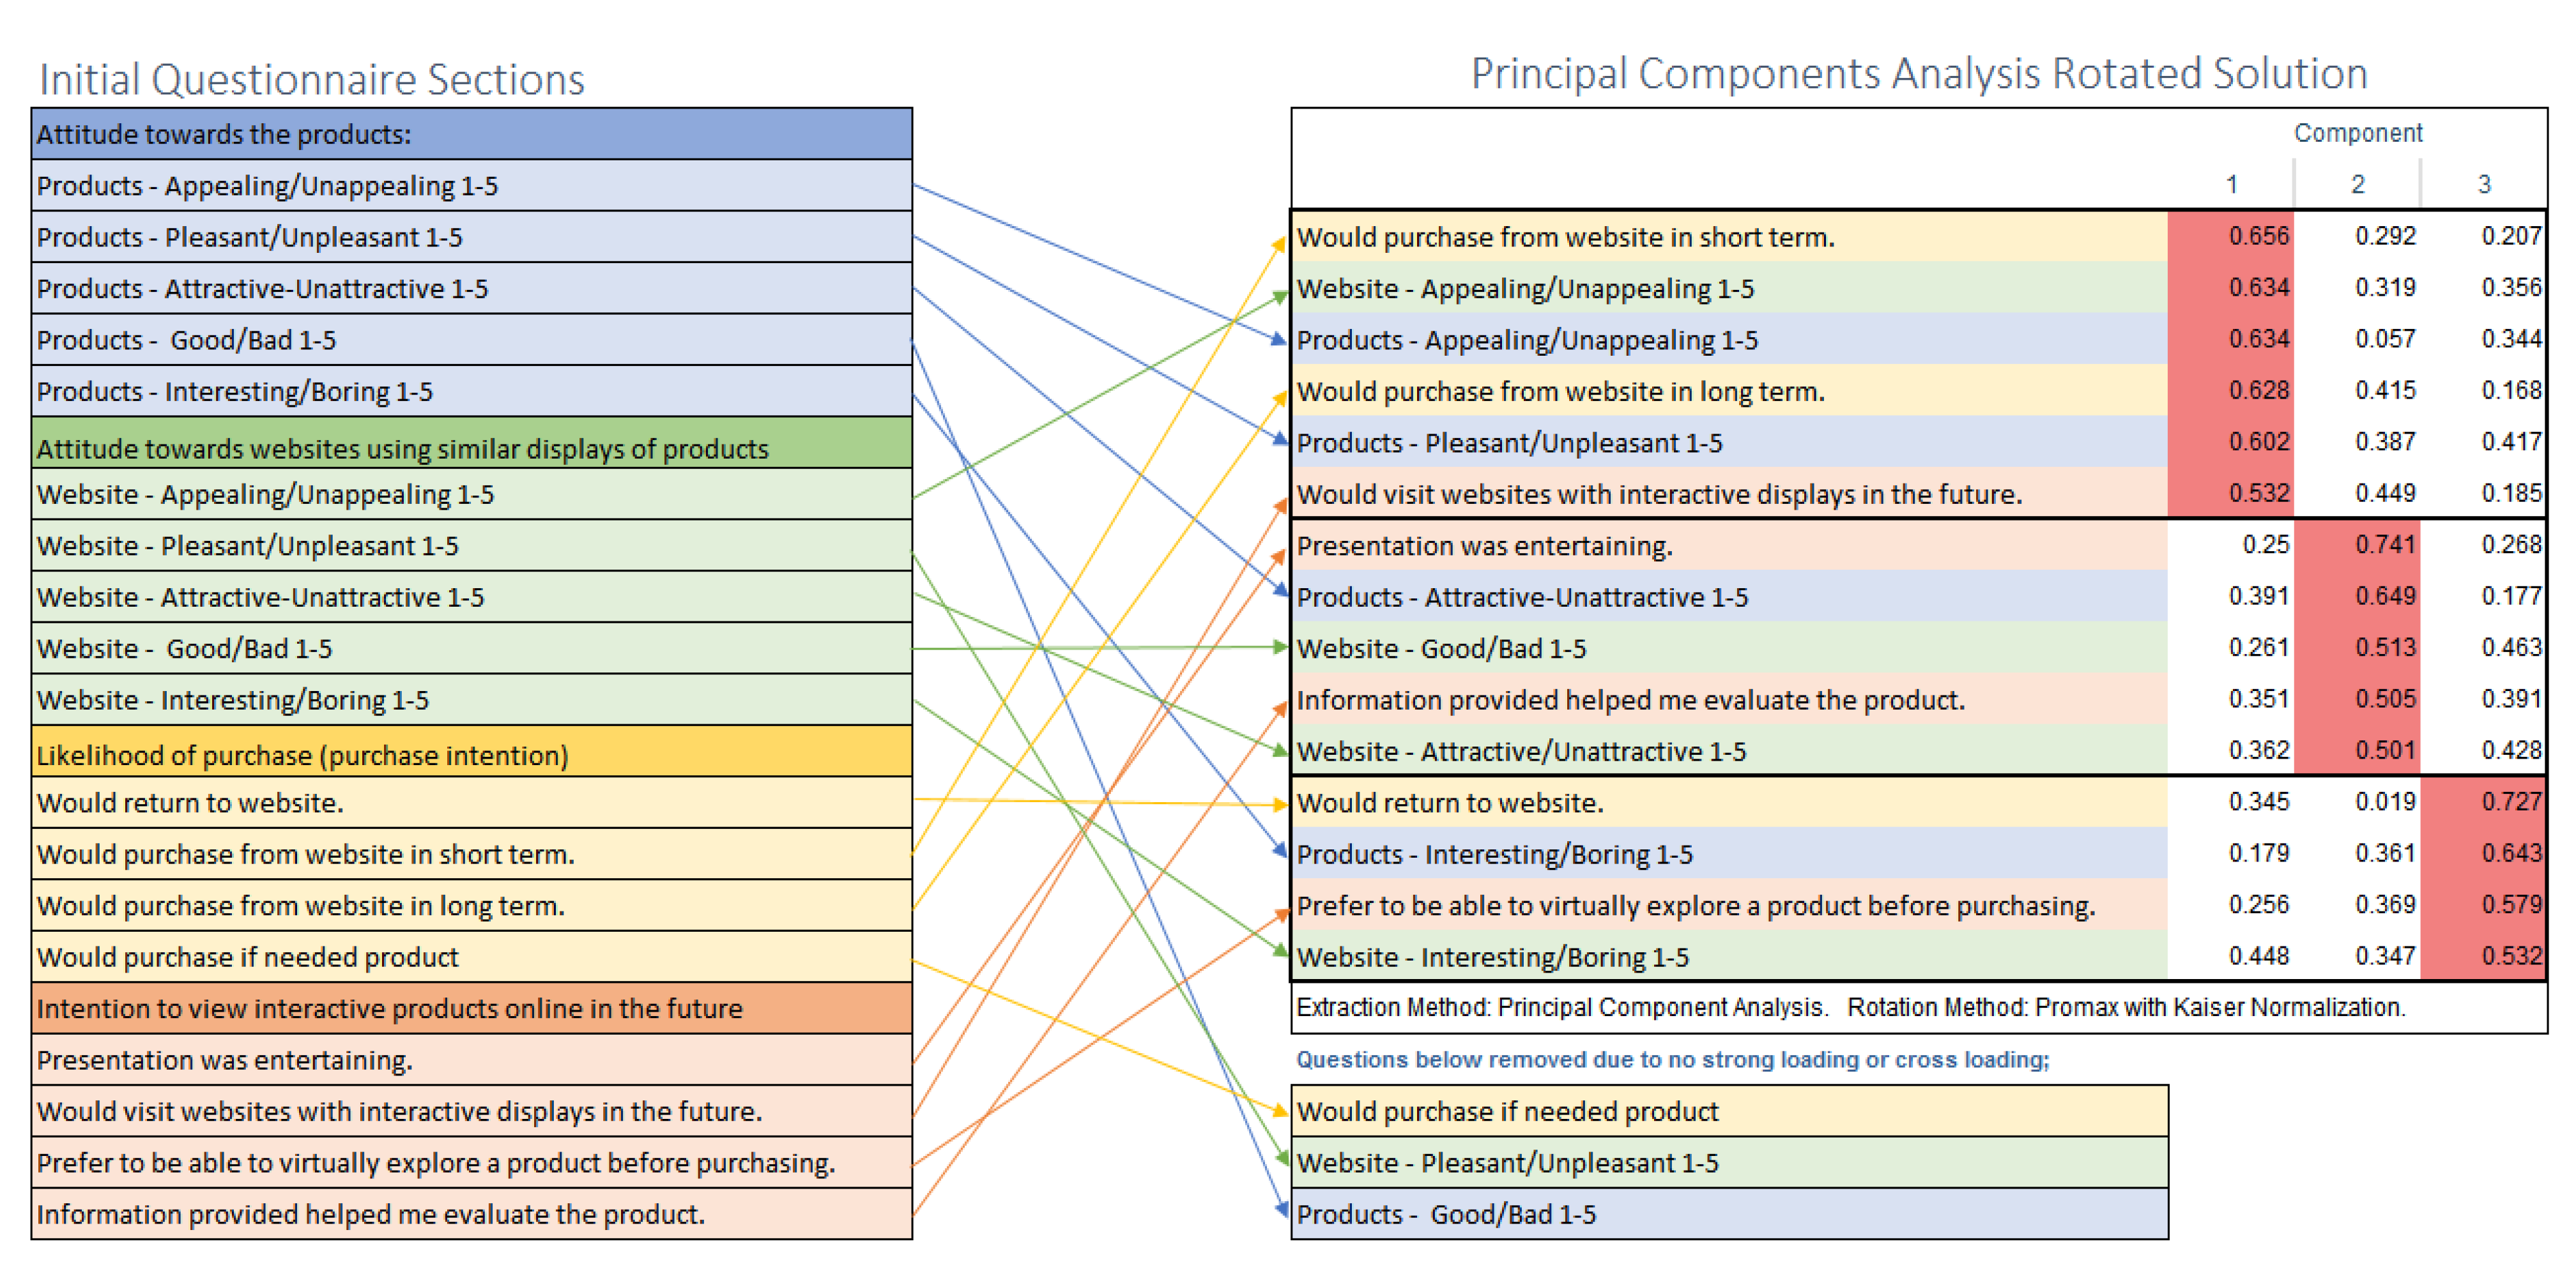
Principal components analysis (PCA) was run on the entire dataset of the 18-question questionnaire to ascertain whether responses were assessing a single attitude dimension. The overall Kaiser–Meyer–Olkin (KMO) measure was 0.878, classified as “meritorious”. Bartlett’s test of sphericity was significant (p < 0.0005), indicating that the data was likely factorisable. Questions on which the preliminary pattern matrix showed no strong loading or cross loading of were removed. All other items showed factor loading of at least 0.35 or greater onto one component, with at least three items per component indicating reliability [88,89]. Three components emerged from the factor analysis with eigenvalues greater than one and which explained 28.1%, 7.4% and 6.7% of total variance, respectively. A visual inspection of the scree plot indicated that three components should be retained. The three-component solution explained 42.2% of the total variance. A Promax oblique rotation was employed to aid interpretability. The rotated solution exhibited “simple structure”. Component loadings, transformation from the original questionnaire and communalities of the rotated solution are presented in Appendix A.
3.2. Analysis
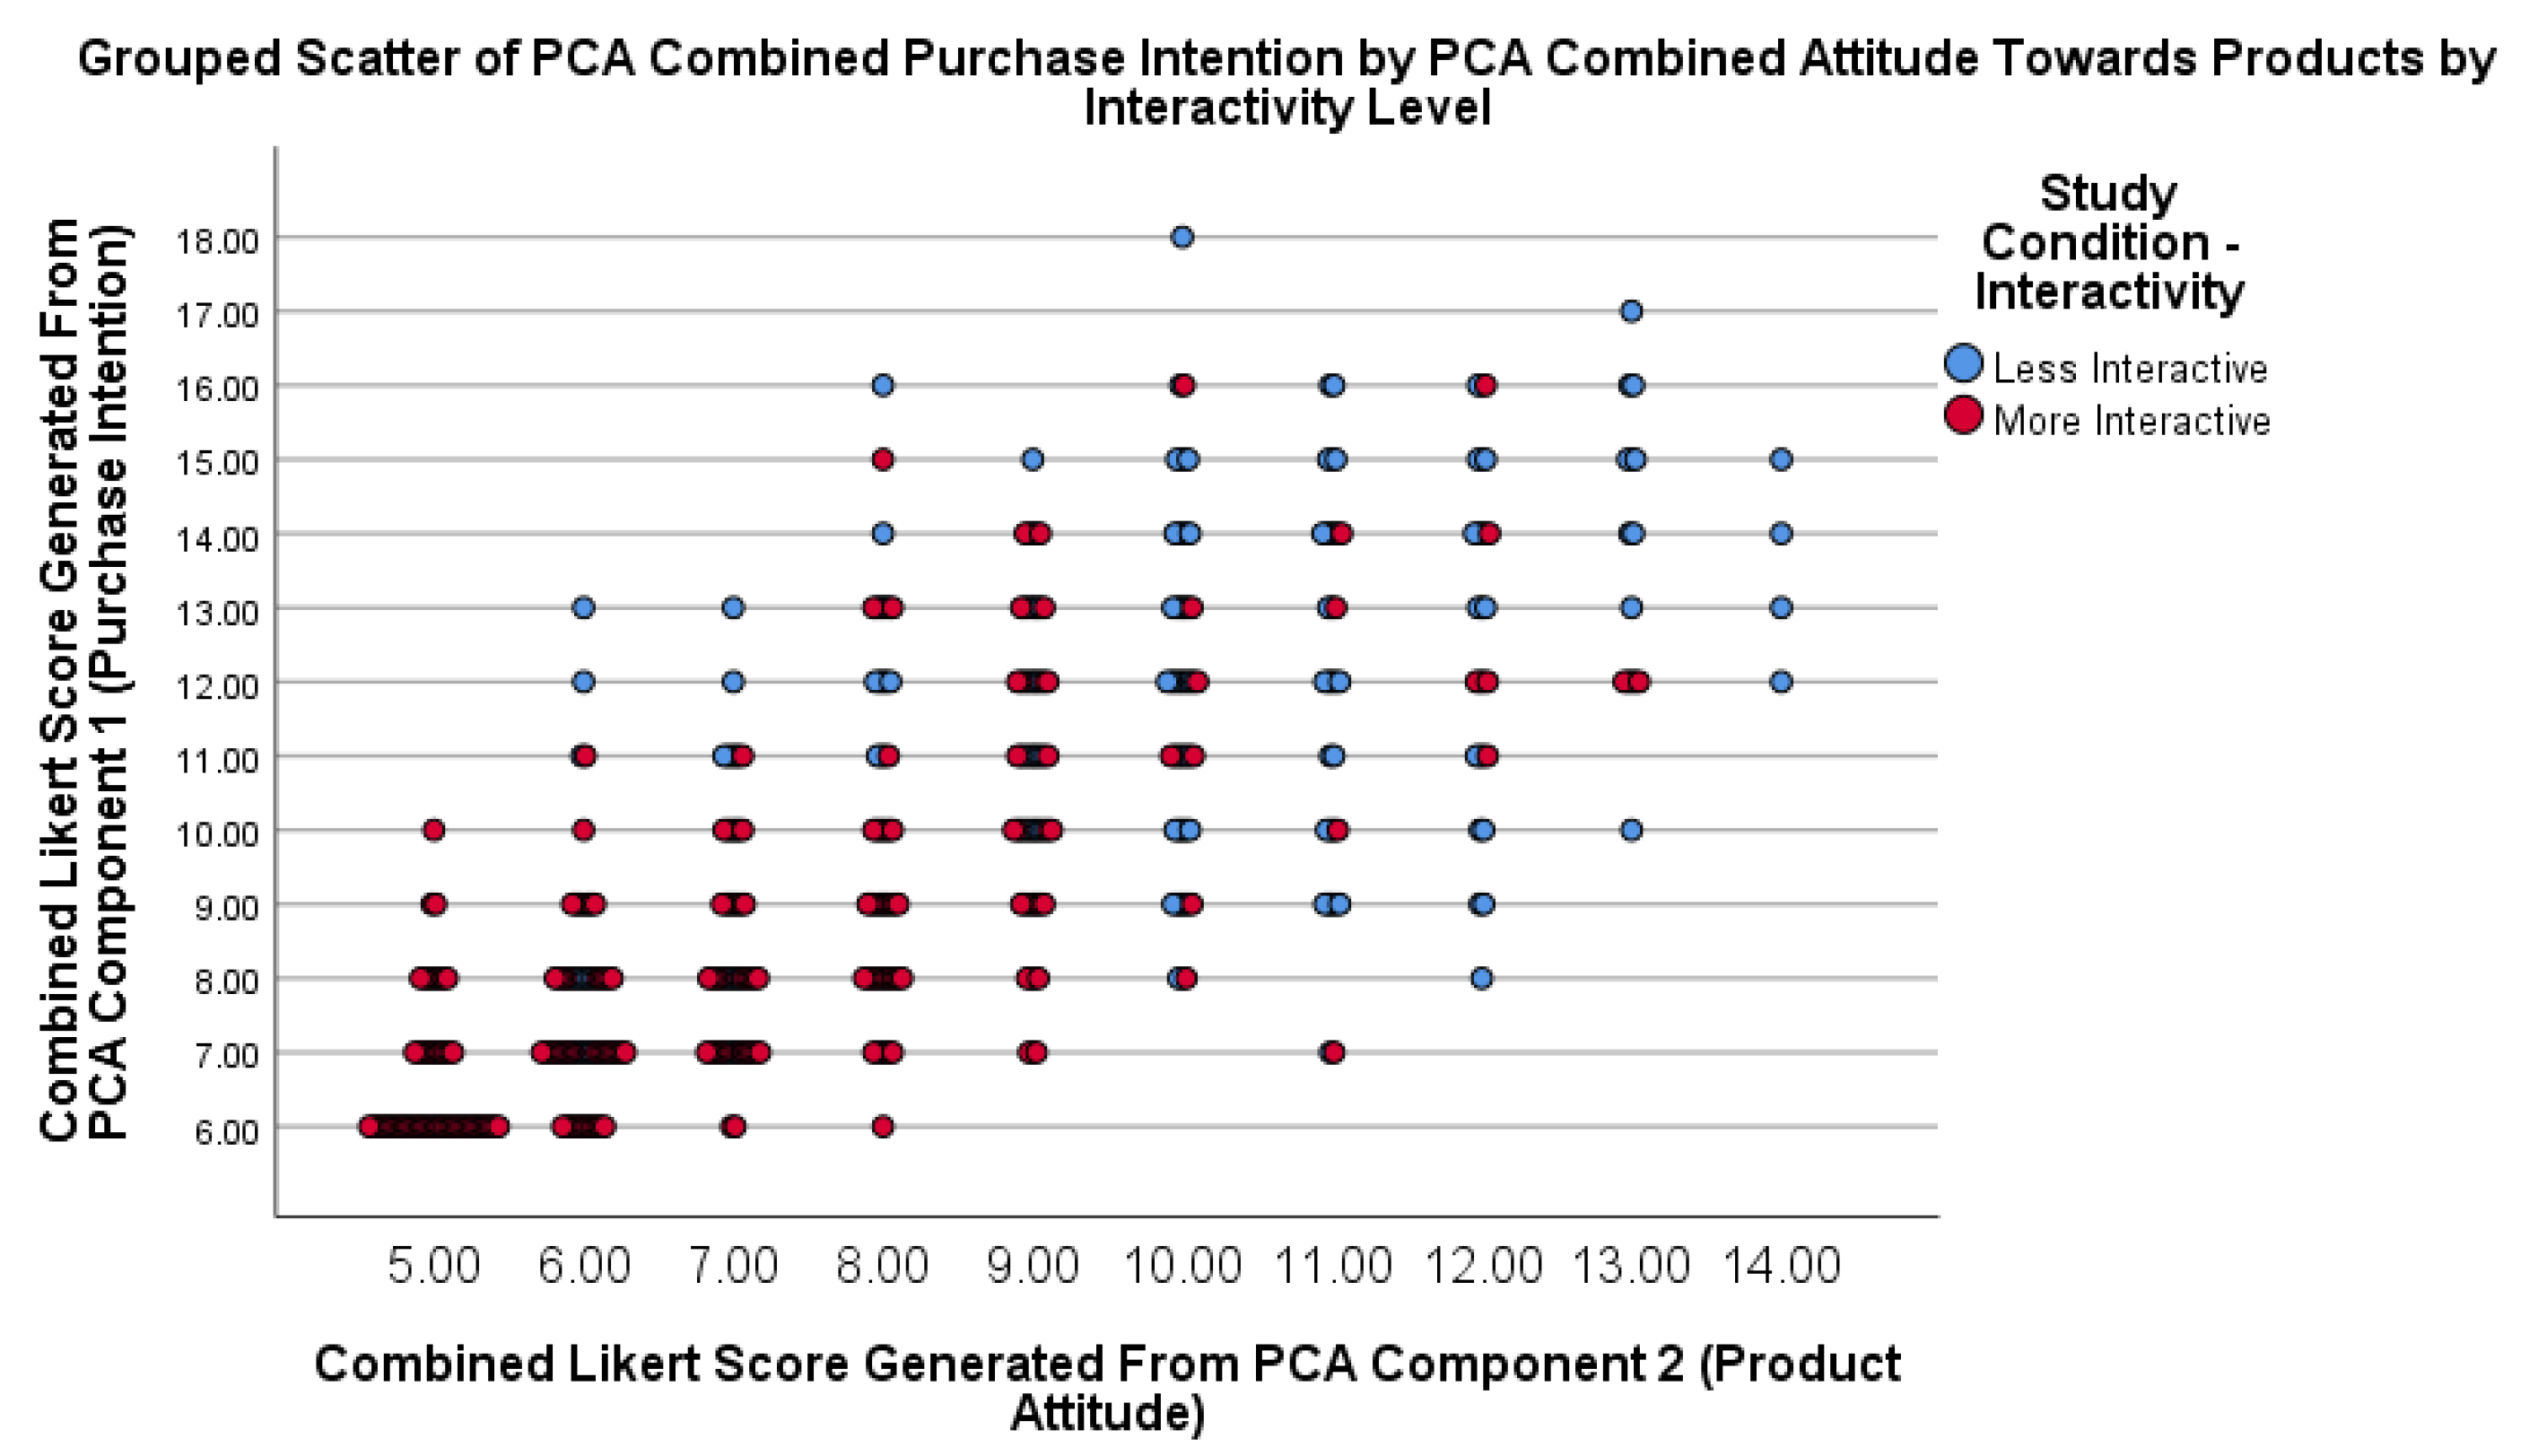
When analysing the entire dataset with outliers included, there was a significant effect of interactivity level after controlling for the effect of cost and supplementary information, F(1401) = 151.88 and p = 0.000. When outliers were removed, there was still a significant effect of F(1398) = 153.32 and p = 0.000. Given the fact that the significance persisted even with outliers included, a decision was made to retain these within the data. In a large sample of 405 participants, having three slight outliers did not appear to affect the reliability of the data (Figure 3).
Tests of between-subjects effects were performed with a 0.05 criterion of statistical significance employed for all tests. Pairwise comparisons were run for significant simple main effects with reported 95% confidence intervals.
As presented in Table 1, both interactivity and cost had an effect on purchase intention [90]. There was no significant effect of information level on purchase intention. The effect of interaction on purchase intention had a medium effect size of 0.107—the highest effect size recorded across all the investigations and indicated that participants had a 54% higher [91] purchase intention when exposed to more interactive test conditions.
There were some significant differences in experimental conditions (Table 2), with more interactive products generating the most significant difference in purchase intentions for high-cost, high-information products.
Furthermore, there was a significant effect of interactivity level × information level on purchase intention (F(1397) = 5.867 and p = 0.016), though this was a weak effect (partial η2 of 0.015). Likewise, there was a weak effect recorded for the effect of interactivity level × cost × information level (partial η2 of 0.013) alongside a significant result of (F(1397) = 5.318 and p = 0.022). There was also no statistically significant difference (0.521 (95% CI, −0.758 to 1.309) and p = 0.598.) when pairwise comparisons were run on less-interactive high-information products comparing both low cost and high cost.
4. Discussion
This study was conducted using a participant pool who had a specific interest in this product segment on a real-world e-commerce website where they had previously purchased products.
The main effects of interactivity level were significant in that the more interactive a product was the more likely a consumer was to purchase. Results show that interactivity level positively correlates with purchase intentions for both low-cost and high-cost products with a medium effect size, and that more interactive displays produce a proportionally higher purchase intention effect in high-cost products, confirming both H1 and H2. There was a clear, although weak, significant difference between the purchase intentions of higher-cost products versus lower-cost products. This contradicts an earlier research study which found that interactivity is not all positive for the consumer, since the user has to manage and process the information flow [92]. This could be due to the difference in product segment (computers vs. home décor), with the latter being far more suited to interactive product displays and the former requiring more textual information to make a considered selection.
Results from the study indicate that interactivity increases the likelihood of a purchase, and that adding interactive elements has a greater effect on purchase intention when the products are higher-cost, supporting H2. The simple main effects of ost on purchase intention were significant, with interactivity level increasing purchase intention in higher-cost products. This was a more significant result than in low-cost products, which indicates interactivity level being more important in generating purchase intentions in higher-cost products. This could be due to higher quality visual information from the enhanced interactivity (in this case the additional information provided by having an interactive product to examine) reducing price sensitivity and encouraging purchases [57].
The research supports the previous findings that interactivity leads to higher purchase intentions whether users are browsing or buying [52], that interactivity produced by visual aspects provokes higher purchase intentions [18] and that interactive displays are related to purchase intentions [93].
This research indicates that in the home décor market increasing the interactivity of online product displays is likely to lead to increased purchase intention, particularly in higher-value products. The effect of interactivity level on purchase intention had the highest effect size recorded across all the investigations and indicated that participants had a 54% higher [91] purchase intention when exposed to more-interactive test conditions, therefore higher value products in this segment would benefit most from having interactive displays utilised.
Results did not support the hypothesis that higher levels of supplementary information would produce a higher purchase intention effect in high-cost products, contradicting the results of earlier studies [57] and leading to the rejection of H3. There was no significant effect of information level on purchase intention and the supplementary amount of information available did not appear to affect the purchase intention on its own. This could have been due to the product type being suited to purchase without the need for detailed external information (i.e., the images would have conveyed most of the appropriate information to the participant), which may not have been true for other product segments (e.g., more technical products such as electronics). This finding contradicts earlier studies which found that higher quality information encouraged more purchases [57], and that consumers prefer rich visual information and text to more complex displays [18,34]. The results of this study are also contrary to earlier studies which indicated that textual information, when “extensive and higher-quality” and used in conjunction with other HTRE elements (such as 2D/3D view), may affect consumer satisfaction when shopping and increase purchase intention [55], [56].
Research into 3D displays of computer desks did, however, return a similar result to this study in that a 3D display increased purchase intention but a 3D display combined with textual information actually decreased purchase intention [59]—a situation attributed to reduced enjoyment as the text reminded participants of the utilitarian nature of the purchase. Clearly, the product categories studied are different, but it is an interesting observation that textual information seems to reduce purchase intention when combined with an interactive product in this particular product category, but this could have been due to the product segment or demographic of the participant selection.
The data contributes a clearer understanding of the benefits that higher-cost home décor products are more likely to receive from investment in applying interactive features to encourage purchase intention.
Online retailers who have products effectively displayed to encourage purchase engagement will have a financial and reputational return on investment from changes made in this area, since the most important aim of retail websites is to convert awareness to purchases [11].
A key factor of online retail success is to obtain the correct balance between visual and textual information, but this needs to be based on product type [18]. For example, whilst a dress may benefit from multiple images of different angles, the same could not be said for a box of cereal. The results of this study indicate that greater interactivity in home décor products, particularly those which are higher-cost, correlates with increased purchase intention.
It is critical that development focuses on creative solutions to customer problems rather than technical innovation [94]—i.e., improving rather than innovating and assisting customers in the decision-making process through interactive product development.
Price is a key component of websites and is therefore integral to the shopping experience [17,70], so to exclude it entirely would potentially make the data less reliable. The research may be broadly applicable to similar categories of products with similar price points. It may not, however, be applicable to much higher priced items. In this study, using representative consumers and real-world pricing, interactivity has been shown to have a higher effect on the purchase intention of high-cost products.
Development of New Three-Component Solution
Prior to analysis of the data, it was intended to combine responses into a single composite score as a quantitative measure [83] since parametric tests of analysis of variance may be applied where responses to several Likert items are summed into a scale with the assumption that all are using the same scale [82,84]. A Likert scale developed from multiple items is expected to be more reliable and consistent than single item responses. Such an index is more “reliable, valid and discriminatory” than using single items [80,84]. However, following a principal components analysis, three new components emerged from the rotated solution with eigenvalues greater than one containing items with a factor loading of at least 0.35 or greater onto a single component, indicating reliability [88,89] and explaining 42.22% of the total variance. Given that these showed a clear loading onto components, they were adopted as a means of assessing purchase intention rather than the original questionnaire sections.
Component 1 (28.1% of variance)—Purchase Intention—This was the strongest indicator of purchase intention with both short- and long-term purchase intentions loading onto it together with intention to visit website with interactive displays in the future. Both products and website were found to be appealing. This was the strongest component, explaining 28% of total variance.
Component 2 (7.4% of variance)—Positive Attitude Towards Interactive Products and Website—Participants found the presentation entertaining and found the information helped them evaluate the products. No confirmed purchase intention.
Component 3 (6.7% of variance)—Repeat Interactive Product Enjoyment—Participants found the website and products to be interesting. They preferred to virtually explore products before purchasing and intended to return to the website. No confirmed purchase intention.
This three-component solution may have a commercial application for retail as it provides an indication of what proportion of the questionnaire responses related to particular factors and which elements of the customer experiences had the greatest bearing on purchase intention.
5. Conclusions
This study was conducted using a participant pool of existing customers of an online store, and the study itself was hosted at the same domain using familiar branding with participants completing a questionnaire following viewing of various interactive displays to assess purchase intention. Customers all had an interest in the product segment and were confirmed internet shoppers. This arguably makes the results more reliable than a random sample within a simulated setting where the participants may not have an interest in the product segment and therefore no genuine intention to purchase.
Whilst there was a gender imbalance in the participant pool, with 65.2% being female, this may be particularly relevant to this product area. Given that women make the decision in the purchase of 94% of home furnishings, and account for USD 20 trillion globally in annual consumer spending [95], this could be considered a useful consumer sample for this product category.
Limitations and Recommendations
We wish to point out limitations for this study—namely (1) data only explaining 42.2% of the total variance with some cross loading during PCA analysis, (2) a self-selected gender-imbalanced participant pool having a potential bias and confusion effect, (3) lack of split between nature of purchasing (business/consumer) and (4) potential for participants to have different rationales for purchase decisions (utilitarian vs hedonic). These are discussed in detail below.
The three-component solution only explained 42.2% of the total variance. The proportion of the total variance explained by the retained factors should ideally be at least 50% [88], which potentially makes the results less reliable as 57.8% of the variance cannot be explained by the factors analysed.
The preliminary pattern matrix showed no strong loading or cross-loading of the following items: product—good/bad, website—pleasant/unpleasant and would purchase if needed product, despite these being used reliably in previous studies [59,96]. These items were therefore removed and the analysis repeated, but this may have affected the overall result by removing those questions. Studentised residuals were also not normally distributed.
Whilst this study was conducted at an online store using previous customers, it was not an actual shopping experience. The majority of the literature uses questionnaires to evaluate websites and indicate intention rather than conduct a physical transaction. This is an inherently less reliable method than an actual purchase (conversion), since no money is changing hands and no risk is involved. Several studies have attempted to circumvent this and introduce some realism on varying scales from creating test websites with single products [18], increasing involvement by giving an imaginary “budget” to certain participants and filling in a fictitious order form [44], providing real spending money to purchase items [22] or offering the chance to win a free workshop [52].
The generalisability of the results is limited by the self-selected sample and potential resultant bias [97,98,99,100,101]. All participants had previous transactions with the website used for the study with none selecting “inexperienced” or “very inexperienced” in terms of online shopping experience in the questionnaire; therefore, the applicability of the results of the study might vary if the same questions were posed to inexperienced participants. That said, it might be difficult to calculate purchase intention for very inexperienced users as their lack of exposure to online shopping, and thus their purchase intention, could simply be due to technological aversion or security concerns, which interactive products are unlikely to remedy.
Only a niche sector of the home décor market was used for the study, so results may not be applicable to all product segments. It is also worth considering any potential confusion effect resulting from participants having previously made a purchase being asked questions during the study, such as “How likely is it that you would return to this website? How likely is it that you would consider the purchase of a product at this website if you needed the product?”, when the same participants had all previously been customers, purchased similar items and have commenced the study knowing they will be rewarded with a promotional code to return to the site at a future date to place a discounted order. Whilst the questions were posed directly regarding the products presented in the study, it is likely that some customers would answer in a more general sense with a response potentially skewed by past experience or future intention relating to the issues above.
No distinction was made between any of the participants as to the nature of their prior purchasing, and invitations to participate were sent to all customers registered on the mailing list (which was split 80/20 consumer/business). This in itself could have skewed the results, as purchasing behaviour would be different for individuals or corporate buyers, not least in the reduced level of price sensitivity as companies purchasing these sorts of products generally have a much higher budget. Employees purchasing on behalf of a company would find it easier to spend company funds rather than individual funds, as the decision to purchase carries less personal weight.
There are different rationales applied for purchase decisions made for utilitarian vs. hedonic products [74]. In the case of corporate buyers, these products could arguably be categorised as utilitarian if purchased for a functioning workplace (purchased following rational decision making, information collection and comparison), but products of this type being purchased in a personal capacity are more likely to be classified as hedonic and be chosen based purely on personal subjective criteria. This difference in purpose for the purchase of an identical product could also give rise to some discrepancies in the data. Future research should consider other distinct product segments such as electronics or clothing. Consideration should be given to utilitarian/hedonic products and participant type (business/individual), the effects of loyalty and familiarity on purchase intention and optimum levels of interactivity before it becomes too cumbersome and mentally taxing for the average user to navigate.
Additional research is needed to establish the viability and applicability of the three-component solution generated during this study in terms of accuracy in predicting future purchase intentions and whether this particular component solution is valid for other product segments.
Despite using a reliable consumer segment to test the products, the study only assessed purchase intention rather than purchase conversion. Future studies could consider A/B testing—presenting various products on live retail websites with different layouts and levels of interactivity to see which produces the most actual conversions.
Existing research has shown that interactive features (both active control and actual product interactivity regardless of the quality of such interactivity) cause users to interpret sites as being of higher quality [11,64,65,66]. This raises the question of whether interactive products would influence consumers to interpret the products themselves as being of higher quality. Some online store attributes directly affect the satisfaction of the users [28] and modify the influence of other parameters—for example, “perceived information quality” directly correlated with “anticipated entertainment value, and it would be interesting to ascertain whether the entertainment value provided by interactive products would cause users to perceive them as being higher quality, and if so, which particular feature or aspect of interactive products affect perception.
As a result of the conclusions drawn from this research, some recommendations can be made for product display in this particular product category. In particular, the highest effect on purchase intention was generated from more-interactive products. Therefore, where possible, online products should include an interactive element allowing for virtual exploration prior to purchase. Given the cost implications involved in applying this to a full set of retail products, particular attention should be given to higher-value products, as the data demonstrated these achieved proportionally higher purchase intention than lower-value products and create a faster ROI to cover the cost of the initial display costs.
Author Contributions
All authors have contributed substantially to the entire work reported. Conceptualisation, R.S.; methodology, R.S.; writing, R.S.; writing—review and editing and supervision, W.P. All authors have read and agreed to the published version of the manuscript.
Funding
This research received no external funding.
Institutional Review Board Statement
The ethics committee of Portsmouth University approved this study ref: FCCI 2018-018.
Informed Consent Statement
Informed consent was obtained from all subjects involved in the study.
Data Availability Statement
The data presented in this study are available on request from the corresponding author. The data are not publicly available due to being located on the secure server of the company whose site was used for the research.
Conflicts of Interest
The author of this study is a shareholder and employee of the company which has provided the website and mailing list used in the research. The company provided discount codes to encourage participation in the study valid against future purchases. The funding source had no influence on the study design, collection, analysis, interpretation of data, writing of report or decision to submit for publication.
Appendix A. PCA Analysis
Figure A1.
PCA Analysis.

References
- Breuer, P.; Francis, T.; Henrich, J.; Kelly, G.; Kohli, S.; Küpper, J.; Magnin, C.; McInerney, P.; Wachinger, T. (Eds.) Perspectives on Retail and Consumer Goods; Number 7; McKinsey & Company: Atlanta, GA, USA, 2019; Available online: https://www.mckinsey.com/~/media/mckinsey/industries/retail/our%20insights/whos%20shopping%20where%20the%20power%20of%20geospatial%20analytics%20in%20omnichannel%20retail/perspectives-on-retail-and-consumer-goods-number-7-january-2019-vf.pdf (accessed on 22 March 2022).
- Rhodes, C.; Hutton, G. Retail sector in the UK. In Briefing Paper; Number SN06186; House of Commons Library: London, UK, 2021; p. 14. Available online: https://commonslibrary.parliament.uk/research-briefings/sn06186/ (accessed on 15 February 2022).
- Savills. Shopping Centre and High Street Spotlight UK Retail Consumer and Occupational Trends. UK Commercial Spotlight. 2020. Available online: https://pdf.euro.savills.co.uk/uk/commercial-retail-uk/shopping-centre-high-street-spotlight---q3-2021.pdf (accessed on 15 February 2022).
- Office for National Statistics (ONS). Retail Sales, Great Britain: July 2021. Available online: https://www.ons.gov.uk/businessindustryandtrade/retailindustry/bulletins/retailsales/july2021 (accessed on 15 February 2022).
- Weinswig, D. DEEP Dive: Global Furniture and Homewares E-Commerce; Fung Global Retail & Technology: New York, NY, USA, 2016; pp. 1–18. [Google Scholar]
- Fernando, R.; Marshall, C. Market Snapshot UK Home Market 2016. Available online: https://www.pragmauk.com/ (accessed on 15 February 2022).
- KPMG International. The Truth about Online Consumers. 2017. Available online: https://assets.kpmg/content/dam/kpmg/xx/pdf/2017/01/the-truth-about-online-consumers.pdf (accessed on 15 February 2022).
- Childers, T.L.; Carr, C.L.; Peck, J.; Carson, S. Hedonic and utilitarian motivations for online retail shopping behavior. J. Retail. 2001, 77, 511–535. [Google Scholar] [CrossRef]
- Dziewanowska, K. Dimensions of Real and Virtual Consumer Experiences. UW Fac. Manag. Work. Pap. 2015, 9, 1–55. [Google Scholar]
- Moe, W.W.; Fader, P.S. Dynamic Conversion Behavior at E-Commerce Sites. Manage Sci. 2004, 50, 326–335. [Google Scholar] [CrossRef] [Green Version]
- Chua, W.S.; Jiang, Z.; Tan, B. Effects of Website Interactivity on Consumer Involvement and Purchase Intention. 2007. Available online: http://0-www-scopus-com.brum.beds.ac.uk/inward/record.url?eid=2-s2.0-84870962251&partnerID=40&md5=5b81795dd2a76f9abcee727e683c5218 (accessed on 15 February 2022).
- Eroglu, S.A.; Machleit, K.A.; Davis, L.M. Empirical testing of a model of online store atmospherics and shopper responses. Psychol. Mark. 2003, 20, 139–150. [Google Scholar] [CrossRef]
- Blanco, C.F.; Sarasa, R.G.; Sanclemente, C.O. Effects of visual and textual information in online product presentations: Looking for the best combination in website design. Eur. J. Inf. Syst. 2010, 19, 668–686. [Google Scholar] [CrossRef]
- Jang, J.; Baek, Y.E.; Yoon, S.Y.; Choo, H.J. Store design: Visual complexity and consumer responses. Int. J. Des. 2018, 12, 105–118. [Google Scholar]
- Wodehouse, A.; Abba, M. 3D visualisation for online retail Factors in consumer behaviour. Int. J. Mark. Res. 2016, 58, 451–472. [Google Scholar] [CrossRef]
- Limayem, M.; Khalifa, M.; Frini, A. What makes consumers buy from Internet? A longitudinal study of online shopping. IEEE Trans. Syst. Man Cybern. Part A Syst. Humans 2000, 30, 421–432. [Google Scholar] [CrossRef]
- Spool, J. What Causes Customers to Buy on Impulse? 2001. Available online: http://www.uie.com/publications/whitepapers/ImpulseBuying.pdf (accessed on 15 February 2022).
- Wright, M.; Macrae, M. Bias and variability in purchase intention scales. J. Acad. Mark. Sci. 2007, 35, 617–624. [Google Scholar] [CrossRef]
- Hunter, R.; Mukerji, B. The Role of Atmospherics in Influencing Consumer Behaviour in the Online Environment. Int. J. Bus. Soc. Sci. 2011, 2, 118–125. [Google Scholar]
- Dailey, L. Navigational web atmospherics: Explaining the influence of restrictive navigation cues. J. Bus. Res. 2004, 57, 795–803. [Google Scholar] [CrossRef]
- Ha, Y.; Kwon, W.-S.; Lennon, S.J. Online visual merchandising (VMD) of apparel web sites. J. Fash. Mark. Manag. 2007, 11, 477–493. [Google Scholar] [CrossRef]
- Yadav, M.S.; Varadarajan, P.R. Understanding product migration to the electronic marketplace: A conceptual framework. J. Retail. 2005, 81, 125–140. [Google Scholar] [CrossRef]
- Kim, S.Y.; Lim, Y.J. Consumers’ Perceived Importance of and Satisfaction with Internet Shopping. Electron. Mark. 2001, 11, 148–154. [Google Scholar] [CrossRef]
- Yoo, W.S.; Lee, Y.; Park, J. The role of interactivity in e-tailing: Creating value and increasing satisfaction. J. Retail. Consum. Serv. 2010, 17, 89–96. [Google Scholar] [CrossRef]
- Koivumäki, T. Customer Satisfaction and Purchasing Behaviour in a Web-based Shopping. Electron. Mark. 2001, 11, 186–192. [Google Scholar] [CrossRef]
- Szymanski, D.M.; Hise, R.T. E-satisfaction: An initial examination. J. Retail. 2000, 76, 309–322. [Google Scholar] [CrossRef]
- Dholakia, R.R.; Zhao, M. Retail web site interactivity: How does it influence customer satisfaction and behavioral intentions? Int. J. Retail. Distrib. Manag. 2009, 37, 821–838. [Google Scholar] [CrossRef]
- Richard, M.O. Modeling the impact of internet atmospherics on surfer behavior. J. Bus. Res. 2005, 58, 1632–1642. [Google Scholar] [CrossRef]
- Jahng, J.J.; Jain, H.; Ramamurthy, K. Personality traits and effectiveness of presentation of product information in e-business systems. Eur. J. Inf. Syst. 2002, 11, 15. [Google Scholar] [CrossRef]
- Lee, J.; Podlaseck, M.; Schonberg, E.; Hoch, R. Visualization and Analysis of Clickstream Data of Online Stores for Understanding Web Merchandising. Data Min. Knowl. Discov. 2001, 5, 59–84. [Google Scholar] [CrossRef]
- Bansal, H.S.; McDougall, G.H.G.; Dikolli, S.S.; Sedatole, K.L. Relating e-satisfaction to behavioral outcomes: An empirical study. J. Serv. Mark. 2004, 18, 290–302. [Google Scholar] [CrossRef]
- Islam, S.M. Consumers Online Purchase Intention Towards Cosmetic Products in Karachi. J. Soc. Sci. Media Stud. 2018, 2, 20–34. [Google Scholar]
- Klein, L.R. Creating virtual product experiences: The role of telepresence. J. Interact. Mark. 2003, 17, 41–55. [Google Scholar] [CrossRef]
- Heeter, C. Interactivity in the context of designed experiences. J. Interact. Advert. 2000, 1, 4–15. [Google Scholar] [CrossRef]
- Smuts, A. What Is Interactivity? J. Aesthetic Educ. 2009, 43, 53–73. [Google Scholar] [CrossRef]
- Kiousis, S. Interactivity: A Concept Explication. New Media Soc. 2002, 4, 355–383. [Google Scholar] [CrossRef]
- McMillan, S.; Hwang, J.-S. Measures of Percieved Interactivity. J. Advert. 2002, XXXI, 29–42. [Google Scholar] [CrossRef]
- Downes, E.J.; McMillan, S.J. Defining interactivity. New Media Soc. 2000, 2, 157–179. [Google Scholar] [CrossRef]
- Hood, K.M.; Shanahan, K.J.; Hopkins, C.D.; Lindsey, K.K. The influence of interactivity on visit and purchase frequency: The moderating role of website informational features. J. Internet Commer. 2015, 14, 294–315. [Google Scholar] [CrossRef]
- Ha, Y.; Lennon, S.J. Online visual merchandising (VMD) cues and consumer pleasure and arousal: Purchasing versus browsing situation. Psychol. Mark. 2010, 27, 141–165. [Google Scholar] [CrossRef]
- Hong, W.; Thong, J.Y.L.; Tam, K.Y. Designing product listing pages on e-commerce websites: An examination of presentation mode and information format. Int. J. Hum. Comput. Stud. 2004, 61, 481–503. [Google Scholar] [CrossRef] [Green Version]
- Coyle, J.R.; Thorson, E. The Effects of Progressive Levels of Interactivity and Vividness in Web Marketing Sites. J. Advert. 2001, 30, 65–77. [Google Scholar] [CrossRef]
- Fiore, A.M.; Jin, H.J.; Kim, J. For fun and profit: Hedonic value from image interactivity and responses toward an online store. Psychol. Mark. 2005, 22, 669–694. [Google Scholar] [CrossRef]
- Jang, E.; Burns, L.D. Components of apparel retailing Web sites. J. Fash. Mark. Manag. 2004, 8, 375–388. [Google Scholar] [CrossRef]
- Katrandjiev, H. Investigation of Online Visual Merchandising (OVM) Elements of Apparel Web Stores. Econ. Altern. 2014. Available online: https://www.unwe.bg/uploads/Alternatives/8.pdf (accessed on 15 February 2022).
- Khakimdjanova, L.; Park, J. Online visual merchandising practice of apparel e-merchants. J. Retail. Consum. Serv. 2005, 12, 307–318. [Google Scholar] [CrossRef]
- Kim, J.; Fiore, A.M.; Lee, H.H. Influences of online store perception, shopping enjoyment, and shopping involvement on consumer patronage behavior towards an online retailer. J. Retail. Consum. Serv. 2007, 14, 95–107. [Google Scholar] [CrossRef]
- Law, D.; Wong, C.; Yip, J. How does visual merchandising affect consumer affective response?: An intimate apparel experience. Eur. J. Mark. 2012, 46, 112–133. [Google Scholar] [CrossRef]
- Schlosser, A.E. Experiencing Products in the Virtual World: The Role of Goal and Imagery in Influencing Attitudes versus Purchase Intentions. J. Consum. Res. 2003, 30, 184–198. [Google Scholar] [CrossRef]
- Algharabat, R.; Dennis, C. 3D product authenticity model for online retail: An invariance analysis. Int. J. Bus. Sci. Appl. Manag. 2010, 5, 14–30. [Google Scholar]
- Pantano, E.; Rese, A.; Baier, D. Enhancing the online decision-making process by using augmented reality: A two country comparison of youth markets. J. Retail. Consum. Serv. 2017, 38, 81–95. [Google Scholar] [CrossRef]
- Evanschitzky, H.; Iyer, G.R.; Hesse, J.; Ahlert, D. E-satisfaction: A re-examination. J. Retail. 2004, 80, 239–247. [Google Scholar] [CrossRef]
- Lin, H.-F. The Impact of Website Quality Dimensions on Customer Satisfaction in the B2C E-commerce Context. Total Qual. Manag. Bus. Excell. 2007, 18, 363–378. [Google Scholar] [CrossRef]
- Lynch, J.G.; Ariely, D. Wine Online: Search Costs Affect Competition on Price, Quality, and Distribution. Mark. Sci. 2000, 19, 83–103. [Google Scholar] [CrossRef] [Green Version]
- Vrechopoulos, A.; O’Keefe, R.; Doukidis, G.I.; Siomoks, G.J. Virtual store layout: An experimental comparison in the context of grocery retail. J. Retail. 2004, 80, 13–22. [Google Scholar] [CrossRef]
- Edwards, S.; Gangadharbatla, H. The novelty of 3D product presentations online. J. Interact. Advert. 2001, 2, 10–18. [Google Scholar] [CrossRef]
- Verhagen, T.; Boter, J.; Adelaar, T. The Effect of Product Type on Consumer Preferences for Website Content Elements: An Empirical Study. J. Comput. Commun. 2010, 16, 139–170. [Google Scholar] [CrossRef] [Green Version]
- Kumar, A.; Yinliang, T. Value of IT in Online Visual Merchandising: A Randomized Experiment to Estimate the Value of Online Product Video. 2012. Available online: http://www.krannert.purdue.edu/faculty/kkarthik/wise12/papers%5Cwise12_submission_63.pdf (accessed on 15 February 2022).
- Liu, X.H.; Wu, Y.W. A 3D display system for cloth online virtual fitting room. In Proceedings of the 2009 WRI World Congress on Computer Science and Information Engineering, Los Angeles, CA, USA, 31 March–2 April 2009; Volume 7, pp. 14–18. [Google Scholar] [CrossRef]
- Katrandjiev, H.; Velinov, I. Optimization of Online Visual Merchandising Elements (OVME) on the Basis of Consumer Preferences. Econ. Altern. 2014, 2, 76. [Google Scholar]
- Then, N.; DeLong, M. Apparel Shopping on the Web. J. Fam. Consum. Sci. 1999, 91, 65. [Google Scholar]
- Halepete, J.; Park, J. Competitive e-tailing strategies for fair trade organizations: Benchmarking against successful commercial organizations. J. Fash. Mark. Manag. Int. J. 2006, 10, 491–507. [Google Scholar] [CrossRef]
- Ghose, S.; Dou, W. Interactive functions and their impacts on the appeal of internet presence sites. J. Advert. Res. 1998, 38, 29–43. [Google Scholar]
- Palmer, J.W. Web site usability, design, and performance metrics. Inf. Syst. Res. 2002, 13, 151–167. [Google Scholar] [CrossRef]
- Saeed, K.A.; Hwang, Y.; Mun, Y.Y. Toward an integrative framework for online consumer behavior research: A meta-analysis approach. J. Organ. End User Comput. 2003, 15, 1–26. [Google Scholar] [CrossRef] [Green Version]
- Jee, J.; Lee, W. Antecedents and Consequences of Perceived Interactivity: An Exploratory Study. J. Interact. Advert. 2002, 3, 34–45. [Google Scholar] [CrossRef]
- Teo, H.H.; Oh, L.B.; Liu, C.; Wei, K.K. An empirical study of the effects of interactivity on web user attitude. Int. J. Hum. Comput. Stud. 2003, 58, 281–305. [Google Scholar] [CrossRef]
- Turban, E.; Lee, J.K.; King, D.; McKay, J.; Marshall, P. Electronic Commerce: A managerial Perspective; Prentice Hall: Hoboken, NJ, USA, 2008. [Google Scholar]
- Reibstein, D.J. What Attracts Customers to Online Stores, and What Keeps Them Coming Back? J. Acad. Mark. Sci. 2002, 30, 465–473. [Google Scholar] [CrossRef]
- Sautter, P.; Hyman, M.R.; Lukošius, V. E-Tail Atmospherics: A Critique of the Literature and Model Extension. J. Electron. Commer. Res. 2004, 5, 14–24. [Google Scholar] [CrossRef]
- Savills Commercial Research. Retail Revolutions Exploring the Impact of E-commerce on Local Physical Retailing. Introduction Hot Issues in 2018. Available online: https://pdf.euro.savills.co.uk/uk/commercial-retail-uk/retail-revolutions---ecommerce-and-local-physical-retailing.pdf (accessed on 15 February 2022).
- Lee, H.-H.; Kim, J.; Fiore, A.M. Affective and Cognitive Online Shopping Experience: Effects of Image Interactivity Technology and Experimenting with Appearance. Cloth. Text. Res. J. 2010, 28, 140–154. [Google Scholar] [CrossRef]
- Wu, G. Perceived interactivity and attitude toward web sites. In Proceedings of the Conference-American Academy of Advertising; Roberts, M.S., Ed.; University of Florida: Gainseville, FL, USA, 1999; Volume 512, pp. 254–262. [Google Scholar]
- Verhagen, T.; Boter, J. The Importance of Website Content in Online Purchasing across Different Types of Products. Researchgate; Vrije Universiteit, Faculteit der Economische Wetenschappen en Bedrijskunde: Amsterdam, The Netherlands, 2005; pp. 1–28. Available online: https://research.vu.nl/ws/portalfiles/portal/2091381/20050010.pdf (accessed on 15 February 2022).
- Park, J.; Lennon, S.J.; Stoel, L. On-line product presentation: Effects on mood, perceived risk, and purchase intention. Psychol. Mark. 2005, 22, 695–719. [Google Scholar] [CrossRef]
- Jiradilok, T.; Malisuwan, S.; Madan, N.; Sivaraks, J. The Impact of Customer Satisfaction on Online Purchasing: A Case Study Analysis in Thailand. J. Econ. Bus. Manag. 2014, 2, 5–11. [Google Scholar] [CrossRef] [Green Version]
- Van der Heijden, H.; Verhagen, T. Online store image: Conceptual foundations and empirical measurement. Inf. Manag. 2004, 41, 609–617. [Google Scholar] [CrossRef]
- Jeong, S.W.; Fiore, A.M.; Niehm, L.S.; Lorenz, F.O. The role of experiential value in online shopping: The impacts of product presentation on consumer responses towards an apparel web site. Internet Res. 2009, 19, 105–124. [Google Scholar] [CrossRef]
- Wan, H.A. Opportunities to enhance a commercial website. Inf. Manag. 2000, 38, 15–21. [Google Scholar] [CrossRef]
- Diamantopoulos, A.; Sarstedt, M.; Fuchs, C.; Wilczynski, P.; Kaiser, S. Guidelines for choosing between multi-item and single-item scales for construct measurement: A predictive validity perspective. J. Acad. Mark. Sci. 2012, 40, 434–449. [Google Scholar] [CrossRef] [Green Version]
- Dillman, D. Mail and Other Self-Administered Questionaires. In Handbook of Survey Research; Academic Press: Cambridge, MA, USA, 1983; pp. 359–377. [Google Scholar]
- Pimentel, J.L. A note on the usage of Likert Scaling for research data analysis. USM R&D J. 2010, 18, 109–112. [Google Scholar]
- Boone, H.N.; Boone, D.A. Analyzing Likert Data. J. Ext. 2012, 50, 2TOT2. [Google Scholar]
- Willits, F.; Theodori, G. Another look at Likert scales. J. Rural. Soc. Sci. 2016, 31, 126–139. [Google Scholar]
- Eroglu, S.A.; Machleit, K.A.; Davis, L.M. Atmospheric qualities of online retailing. J. Bus. Res. 2001, 54, 177–184. [Google Scholar] [CrossRef]
- Hair, J.F.; Black, W.C.; Babin, B.J.; Anderson, R.E. Multivariate Data Analysis; Pearson Education: London, UK, 2010. [Google Scholar]
- Garson, G.D. Testing Statistical Assumptions; Blue Book Series; Statistical Associates Publishing: Acheboro, NC, USA, 2012; pp. 1–54. Available online: http://www.statisticalassociates.com/assumptions.pdf (accessed on 15 February 2022).
- Samuels, P. Advice on Exploratory Factor Analysis; Centre for Academic Success, Birmingham City University: Birmingham, UK, 2016. [Google Scholar] [CrossRef]
- Raubenheimer, J. An item selection procedure to maximise scale reliability and validity. SA J. Ind. Psychol. 2004, 30, 59–64. [Google Scholar] [CrossRef]
- Richardson, J.T.E. Eta squared and partial eta squared as measures of effect size in educational research. Educ. Res. Rev. 2011, 6, 135–147. [Google Scholar] [CrossRef]
- Coe, R. It’s the effect size, stupid—What effect size is and why it is important. Annu. Conf. Br. Educ. Res. Assoc. 2002, 12, 1–16. Available online: https://dradamvolungis.files.wordpress.com/2012/01/its-the-effect-size-stupid-what-effect-size-is-why-it-is-important-coe-2002.pdf (accessed on 15 February 2022).
- Burke, R.R. Technology and the Customer Interface: What Consumers Want in the Physical and Virtual Store. J. Acad. Mark. Sci. 2002, 30, 411–432. [Google Scholar] [CrossRef]
- Sicilia, M.; Ruiz, S.; Munuera, J.L. Effects of Interactivity in a Web Site: The Moderating Effect of Need for Cognition. J. Advert. 2005, 34, 31–44. [Google Scholar] [CrossRef]
- Stoyanova, J.; Brito, P.Q.; Georgieva, P.; Milanova, M. Comparison of consumer purchase intention between interactive and augmented reality shopping platforms through statistical analyses. In Proceedings of the International Symposium on Innovations in Intelligent SysTems and Applications (INISTA), Madrid, Spain, 2–4 September 2015; Volume 30, pp. 411–432. [Google Scholar] [CrossRef]
- Silverstein, M.; Sayre, K.; The Female Economy. Harvard Business Review, September 2009. Available online: https://hbr.org/2009/09/the-female-economy (accessed on 3 February 2020).
- Donovan, R.J.; Rossiter, J.R. Store Atmosphere: An Environmental Psychology Approach. J. Retail. 1982, 58, 34. [Google Scholar]
- Ballantine, P.W.; Fortin, D.R. The effects of interactivity and product information on consumers’ emotional responses to an online retail setting. Int. J. Internet Mark. Advert. 2009, 5, 260. [Google Scholar] [CrossRef]
- Bhatnagar, A.; Ghose, S. A latent class segmentation analysis of e-shoppers. J. Bus. Res. 2004, 57, 758–767. [Google Scholar] [CrossRef]
- Fang, Y.H. Does online interactivity matter? Exploring the role of interactivity strategies in consumer decision making. Comput. Hum. Behav. 2012, 28, 1790–1804. [Google Scholar] [CrossRef]
- Lohse, G.L. Consumer buying behavior on the Internet: Findings from panel data Consumer buying behavior on the Internet: Findings from panel data. J. Interact. Mark. 1999, 14, 15–29. [Google Scholar] [CrossRef] [Green Version]
- Zhou, L.; Dai, L.; Zhang, D. Online Shopping Acceptance Model: Critical Survey of Consumer Factors in Online Shopping. J. Electron. Commer. Res. 2007, 8, 41–62. [Google Scholar] [CrossRef]
Figure 1.
Interactivity level high/low.

Figure 2.
Supplementary information high/low.

Figure 3.
Marginal means of purchase intention—lower- and higher-cost products.


Table 1.
Effects on Purchase Intention.
| Effect on Purchase Intention | df | F | p-Value | Effect Size |
|---|---|---|---|---|
| Interactivity Level | 1397 | 47.599 | <0.001 | 0.107 1 |
| Cost | 1397 | 12.113 | 0.001 | 0.030 2 |
1 Medium effect size. 2 Weak effect size.
Table 2.
Significant Differences—More Interactive/Less Interactive Products.
| Products | Sig. Difference | 95% CI | p-Value | |
|---|---|---|---|---|
| More Interactive | High-Cost, High-Information | 3.941 | 3.083–4.799 | <0.001 |
| High-Cost, Low-Information | 3.392 | 2.548–4.237 | <0.001 | |
| Low-Cost, Low-Information | 3.216 | 2.235–4.106 | <0.001 | |
| High-Information | 2.059 | 1.118–2.999 | <0.001 | |
| Low-Information | 1.235 | 0.540–1.930 | <0.001 | |
| Less Interactive | High-Cost, Low-Information | 1.059 | 0.047–2.070 | 0.040 |
| Low-Cost, High-Information | 1.607 | 0.499–2.714 | 0.005 |
Publisher’s Note: MDPI stays neutral with regard to jurisdictional claims in published maps and institutional affiliations. |
© 2022 by the authors. Licensee MDPI, Basel, Switzerland. This article is an open access article distributed under the terms and conditions of the Creative Commons Attribution (CC BY) license (https://creativecommons.org/licenses/by/4.0/).
Share and Cite
MDPI and ACS Style
Summerlin, R.; Powell, W. Effect of Interactivity Level and Price on Online Purchase Intention. J. Theor. Appl. Electron. Commer. Res. 2022, 17, 652-668. https://0-doi-org.brum.beds.ac.uk/10.3390/jtaer17020034
AMA Style
Summerlin R, Powell W. Effect of Interactivity Level and Price on Online Purchase Intention. Journal of Theoretical and Applied Electronic Commerce Research. 2022; 17(2):652-668. https://0-doi-org.brum.beds.ac.uk/10.3390/jtaer17020034
Chicago/Turabian StyleSummerlin, Rowena, and Wendy Powell. 2022. "Effect of Interactivity Level and Price on Online Purchase Intention" Journal of Theoretical and Applied Electronic Commerce Research 17, no. 2: 652-668. https://0-doi-org.brum.beds.ac.uk/10.3390/jtaer17020034