Article

Measuring Online Sensory Consumer Experience: Introducing the Online Sensory Marketing Index (OSMI) as a Structural Modeling Approach

by
Kevin Hamacher
1,* and
Rüdiger Buchkremer
2
1
Faculty of Legal and Business Sciences, Universidad Católica San Antonio de Murcia, Guadalupe, 30107 Murcia, Spain
2
Institute of IT Management and Digitization Research (IFID), FOM University of Applied Sciences, 40476 Dusseldorf, Germany
*
Author to whom correspondence should be addressed.
J. Theor. Appl. Electron. Commer. Res. 2022, 17(2), 751-772; https://0-doi-org.brum.beds.ac.uk/10.3390/jtaer17020039
Submission received: 21 April 2022 / Revised: 19 May 2022 / Accepted: 30 May 2022 / Published: 1 June 2022

Abstract

:
We present a novel quantitative approach to assessing sensory components on e-commerce websites. The Online Sensory Marketing Index (OSMI) provides a valuable measure of the sensory output exhibited by text, images, and other media. The OSMI enables website creators and marketers to communicate about sensory marketing elements and related components. Accordingly, websites could be designed to achieve better sensory appeal and mitigate weaknesses. Our index allows for the creation of sensory templates for various industries. Utilizing a field study of 16 websites in the tech, automotive, fashion, and food industries, we present sensory measures for websites’ acoustical and visionary elements that are easy to comprehend. Additionally, we introduce a score to quantify haptic, olfactory, and gustatory components to assess the online sensory consumer experience. We conclude and propose weighting offline and online sensory parameters per industry. Accordingly, we study quantitative parameters for online sensory overload and deprivation. Our assessment offers a comfortable determination of websites’ OSMI.

1. Introduction

Consumers’ and marketers’ interest in online consumption and buying has grown remarkably as demand has grown due to technological advancement and environmental and social changes resulting from the current COVID-19 crisis [1]. However, the growth is not solely quantitative because consumers also want to encounter a more pleasant shopping atmosphere that is similar to how they have previously experienced it. This includes the sensory perception of goods and services. This gradual evolution of attitudes toward online sensory media has not been sufficiently captured in most published literature. People are increasingly buying and consuming online, and the COVID-19 crisis has further augmented competitive pressure. The growing intensity of competition and homogeneous corporate services are making it more difficult for suppliers to attract consumer attention in online environments, where sensory interaction is traditionally limited to mainly visual and auditory input [2]. Therefore, success depends on sellers’ ability to combine textual and visual stimuli on e-commerce websites to effectively convert visitors into buyers [3,4]. Consequently, we focus on and argue that the sensory appeal [5] within the online customer experience process is crucial to an economically successful e-commerce platform. Customers often consider that the information and visualizations of the product do not align with reality [6] and entail a degree of uncertainty [7]. To reduce the perceived risk of buying online, consumers strive to experience diverse components of e-commerce websites, predominantly sensory communication (e.g., high-quality pictures).
Website creators and marketers, on the other hand, can utilize numerous models and measurement methods that address the websites’ quality from a holistic perspective. For instance, Aladwani and Palvia have developed an instrument for measuring user-perceived web quality [8]. Furthermore, Fernandez Cavia et al. have presented a web quality index (WQI) for official tourist destination websites [9] and Abdallah and Jaleel are focusing on website appeal by developing an evaluation framework [10]. In their study, they compared a total of 15 other website assessment models covering different industries and perspectives. Several additional studies have proposed evaluation frameworks and criteria in the field of websites, e.g., Chiou, Lin, and Perng 2010 [11] for a literature review as well as Bleier et al. [3]. However, with regard to online sensory marketing, there is no methodology to comprehensively analyze specific e-commerce websites for sensory components. Simultaneously, a need is emerging to turn the e-commerce shopping experience into an online sensory shopping experience [2].
There is currently no sensory marketing model present that incorporates digitization trends and focuses on sensory aspects of communication in online environments. A need is emerging to turn the e-commerce shopping experience into an online sensory shopping experience. Although marketing research strives for sensorily designing e-commerce websites to help online retailers enrich the online shopping experience, guidelines, and an appropriate measurement model for choosing and evaluating these design options are lacking, revealing an important research gap. Therefore, two research objectives are derived for this work. First, we focus on whether sensory elements can be measured in the context of e-commerce platforms by creating an assessment proposal for sensory content in digital settings. Second, we address the question of whether similarities or differences between industries can be identified by applying the developed index.
Following these two objectives, the work is structured as follows: Section 2 reviews the scientific literature and deals with the theoretical background of sensory marketing, in particular referring to sensory imagination, sensory deprivation, and sensory overload as theoretical foundations for the index. Section 3 deals with the development of the Online Sensory Marketing Index (OSMI), its parameters and indicators, and a proposal for weighting and measurement with a subsequent interpretation of the sensory measurement values. Section 4 presents and compares sensory measurements of websites within a field study of 16 websites from the technology, automotive, fashion, and food industries. Section 5 highlights and discusses the results’ main advantages and disadvantages. The manuscript ends with Section 6, which presents conclusions, limitations, practical relevance for marketers, and approaches for future research.

2. Theoretical Background

2.1. Online Sensory Marketing

The internet has become the main driver for presenting and selling products in an increasingly digitized world [2]. The time spent online continues to rise [12]. Thus, sensory marketing comprises the targeted, strategic generation of advertising potential for all five human sensory stimuli [13]. Krishna defines sensory marketing as “marketing that engages the consumers’ senses and affects their perception, judgment, and behavior” [13]. Additionally, based on the predominance of bisensory marketing [14], stationary and online awareness of a sensory consumer approach is rapidly growing [2,15,16]. According to Zajonc [17], sensory-level processing and retrieval seem to be automated and can affect preferences.
Furthermore, specific sensory information on products and services can influence people’s attitudes, purchasing intentions, and consumption [18]. Imagine the sound of opening and closing a car door, the smell and taste of freshly brewed coffee, or the feel of the textile structure of a new dress. All these sensory stimuli offer valuable information about the value of products and can significantly influence the purchasing decision process [13]. Consequently, advertising messages always have a more substantial effect if they affect the consumer through more than one sense [19]. As a result of changing buyer behavior, sensory marketing has increasingly become part of scientific discourse [13,19]. However, what strategy should be chosen if products are marketed via the internet on e-commerce websites? The fundamental problem of selling marketing goods via e-commerce is that some human stimuli cannot be directly addressed. Although numerous scientific contributions focus on implementing sensory elements in online environments [2,20,21], no holistic evaluation initiatives of these individually addressed sensory stimuli exist. Therefore, we address this previously described research gap through the theoretical foundations of sensory imagination, sensory deprivation, and sensory overload to develop an assessment proposal to capture and evaluate sensory elements. Figure 1 briefly illustrates the research model used for the study’s exploratory nature.

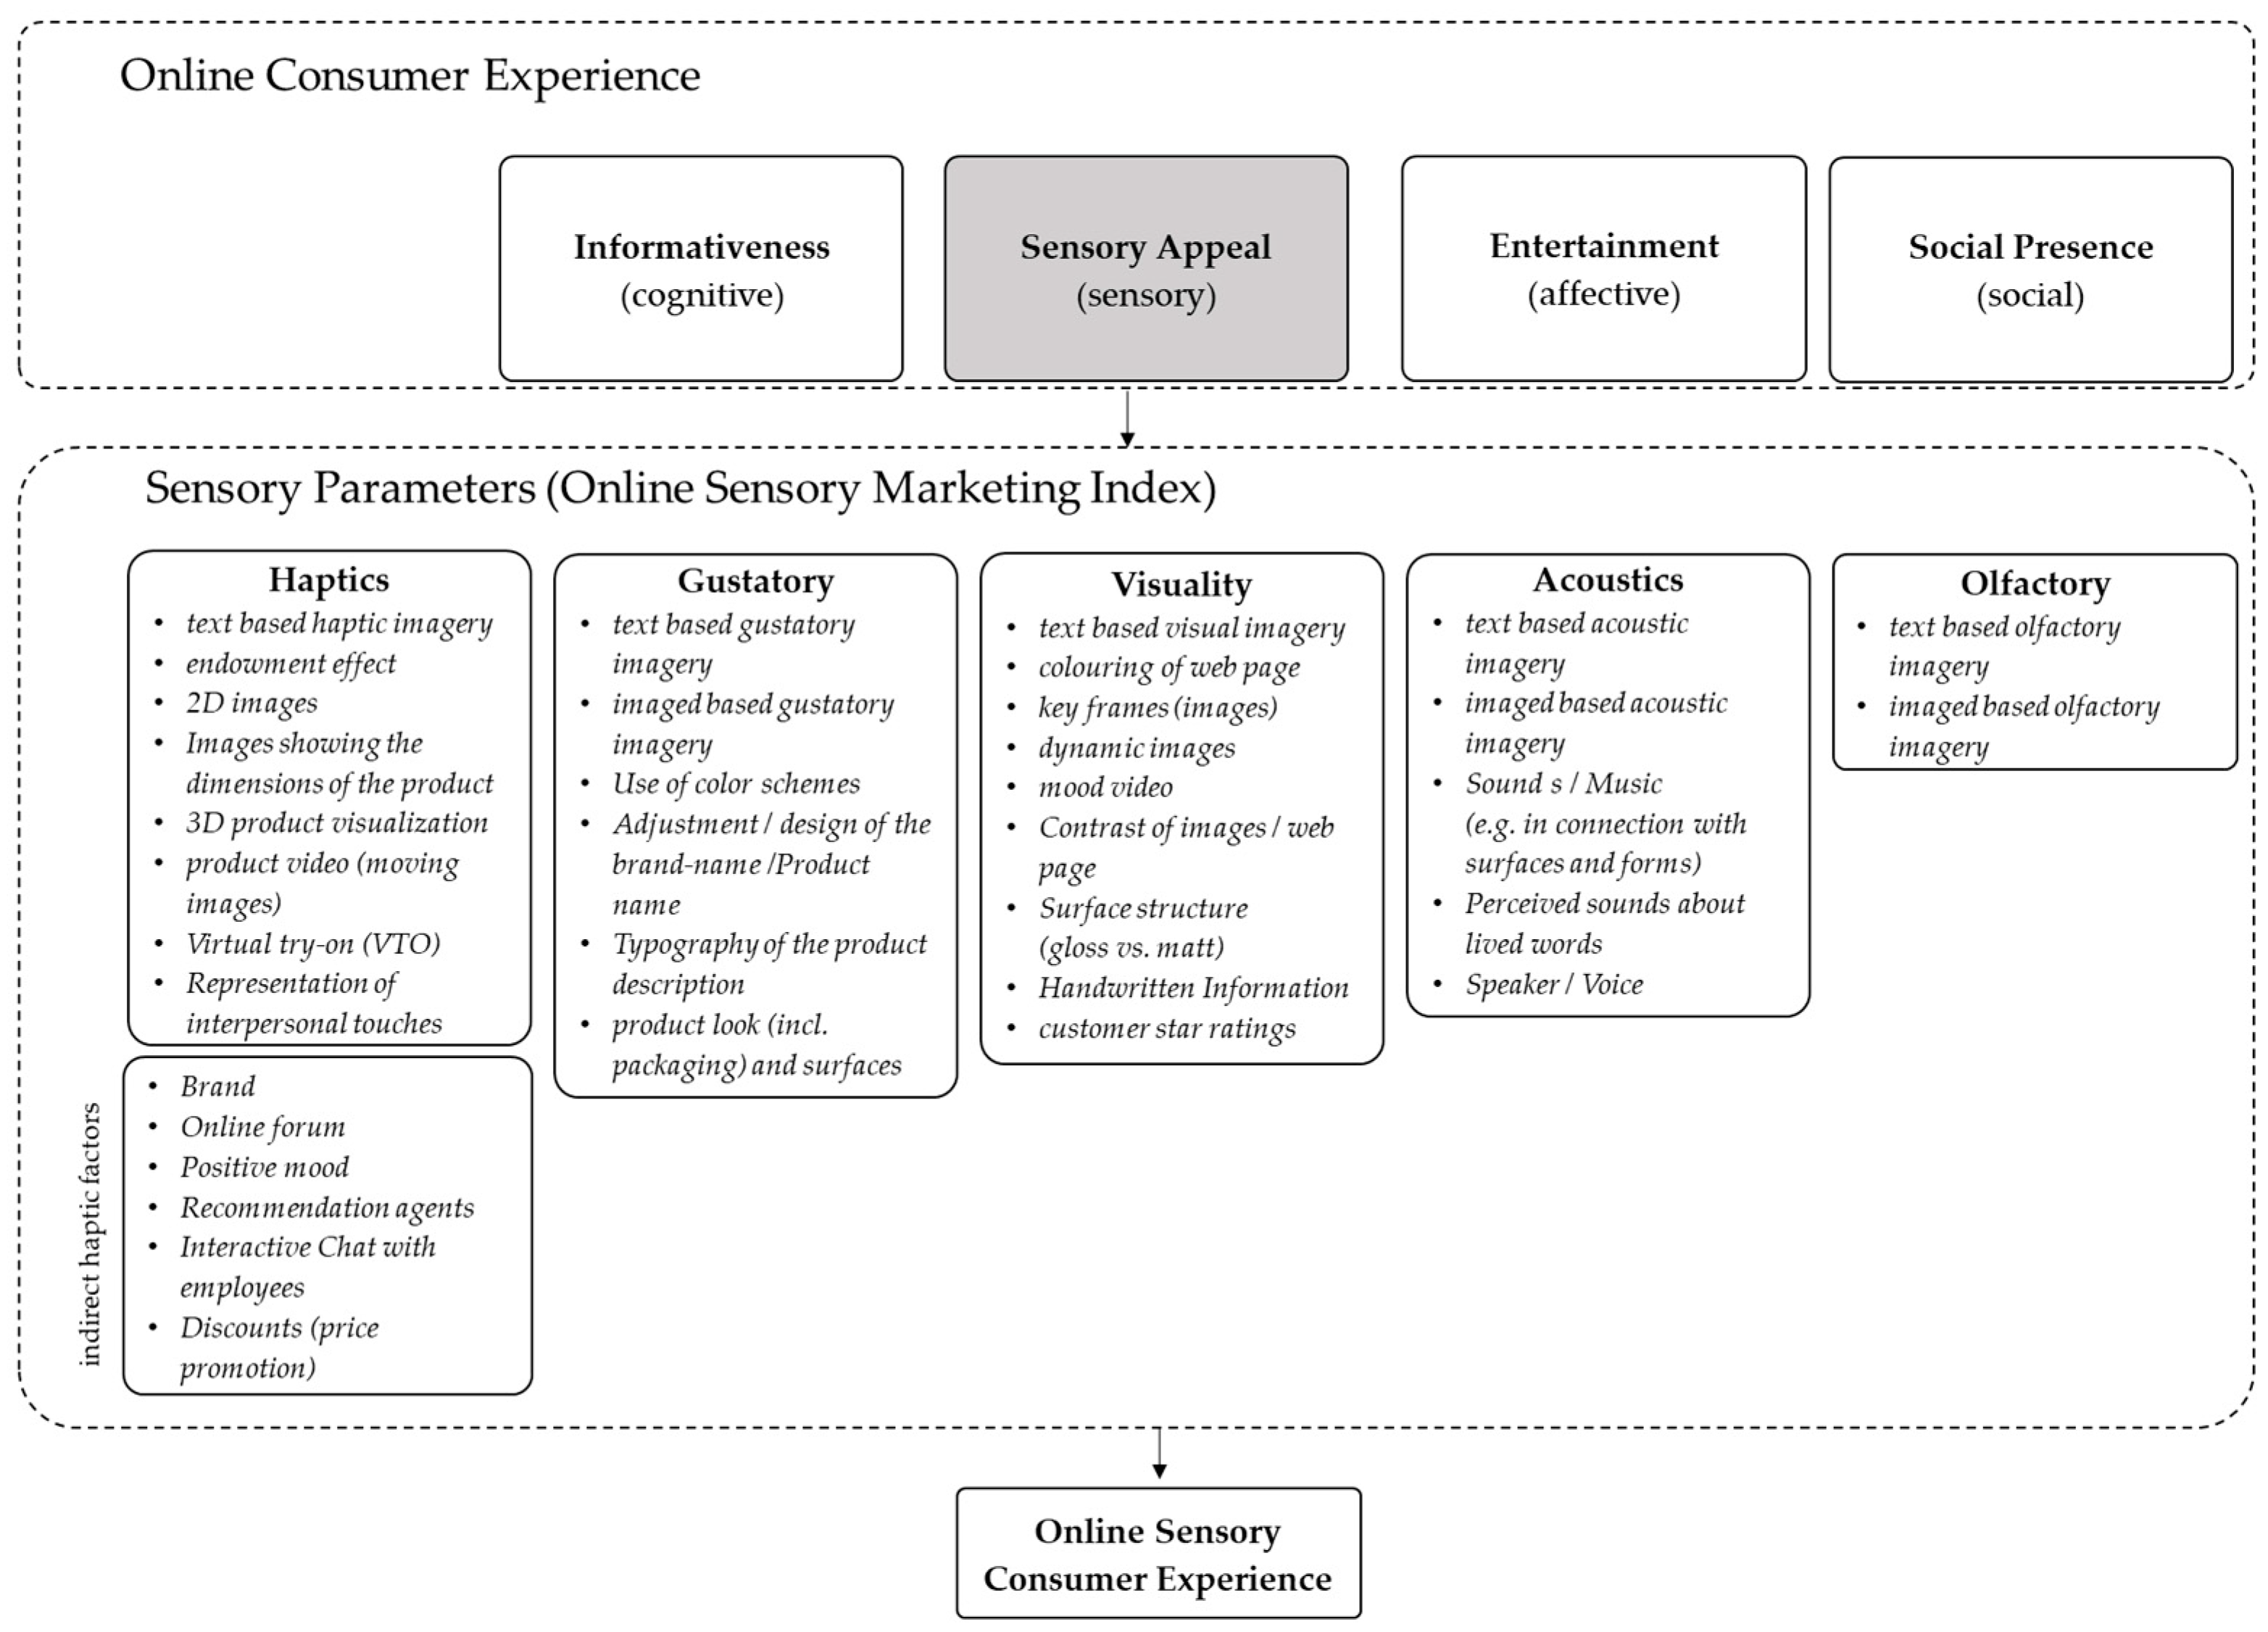
2.2. Sensory Imagery as a Catalyst for Online Consumer Experience

Current research underpins the ongoing trend in focusing on sensory imagery as a bridge to new technologies in the digital marketing context [2,22,23]. Research on the phenomenon of sensory imagery, which refers to the experience of one of the human senses via the activation of another human sense, has been scarce [23,24]. According to Macinnis and Price, “imagery processes are evoked as sensory experiences in working memory” [25], and sensory imagery can appear in any sensory modality [26]. By generating images for each sense, sensory information can be retrieved in the form in which it is perceived and processed [23]. However, when shopping via e-commerce websites, haptic, olfactory, and gustatory sensory stimuli are limited. However, as Chao and Martin [27] indicate, viewing a product can lead to the same neuronal activities as actual contact or use, proving that mental contact and handling a product can be simulated. We consider that this finding is also valid for e-commerce websites under the assumption of mental simulation [2,18,21]. These repetitions can activate some of the same brain areas that were engaged during the initial experience, which can evoke comparable sensations [28,29]. Hence, owing to sensory imagery, these senses can be addressed indirectly via the visual and auditory senses [23,30].
However, several studies in the field of neuroscience have used functional magnetic resonance imaging (fMRI) to prove that the level of sensory stimulation caused via sensory imagery is generally weaker than the actual perception caused by addressing a certain sense directly [23,31,32]. Although sensory imagery can be enhanced by reenacting sensorimotor processes [32], there is no evidence that imagination can be equated with direct perception. Furthermore, imagery depends on several variables, such as the vividness of mental images [33] and the likelihood of the individual evoking them [34,35]. The disparity between perception and imagery is further supported by an earlier study from Unnava, Agarwal, and Haugtvedt [36], who found that imagery in one modality is reduced when perceptual resources are used in the same modality. Lastly, Elder and Krishna state that “As sensory imagery formation requires perceptual resources, occupying these resources leads to weakened imagery” [23]. Elder and Krishna [37] also proved that humans mentally simulate the movements that can be performed with a visually shown product, implying that companies should present products online as realistically and tangibly as possible [2,21]. Nevertheless, imagery can compensate for the actual sensory stimulus [30,38]. Peck, Barger, and Webb [39] addressed whether imagining the touching of a product can generate and strengthen the feeling of ownership. Their findings show that imagining the touching products can lead to an equally high feeling of possession. The result generally connotes that the more realistically the viewer can imagine the product in his own hands, the more significant the endowment effect becomes. Therefore, the imagining of an action can increase the advertised product’s attractiveness and the consumer’s willingness to buy [40]. Krishna and Morrin [41] also demonstrated that haptic information in the form of texts could affect the consumer’s perception that an actual touch is not essential. Reading can evoke sensory imagination and lead to neuronal activation in corresponding brain regions [42]. For example, the primary olfactory cortex is activated when strong smells are read [43] and the taste buds in the mouth are activated when prepared food is described [28]. The linguistic style in which verbal content is conveyed or the characteristics of the text—including the choice of words and the use of questions, specific pronouns (you, your), and adjectives—can influence product conversions and consumers’ perception of website effectiveness [44,45].

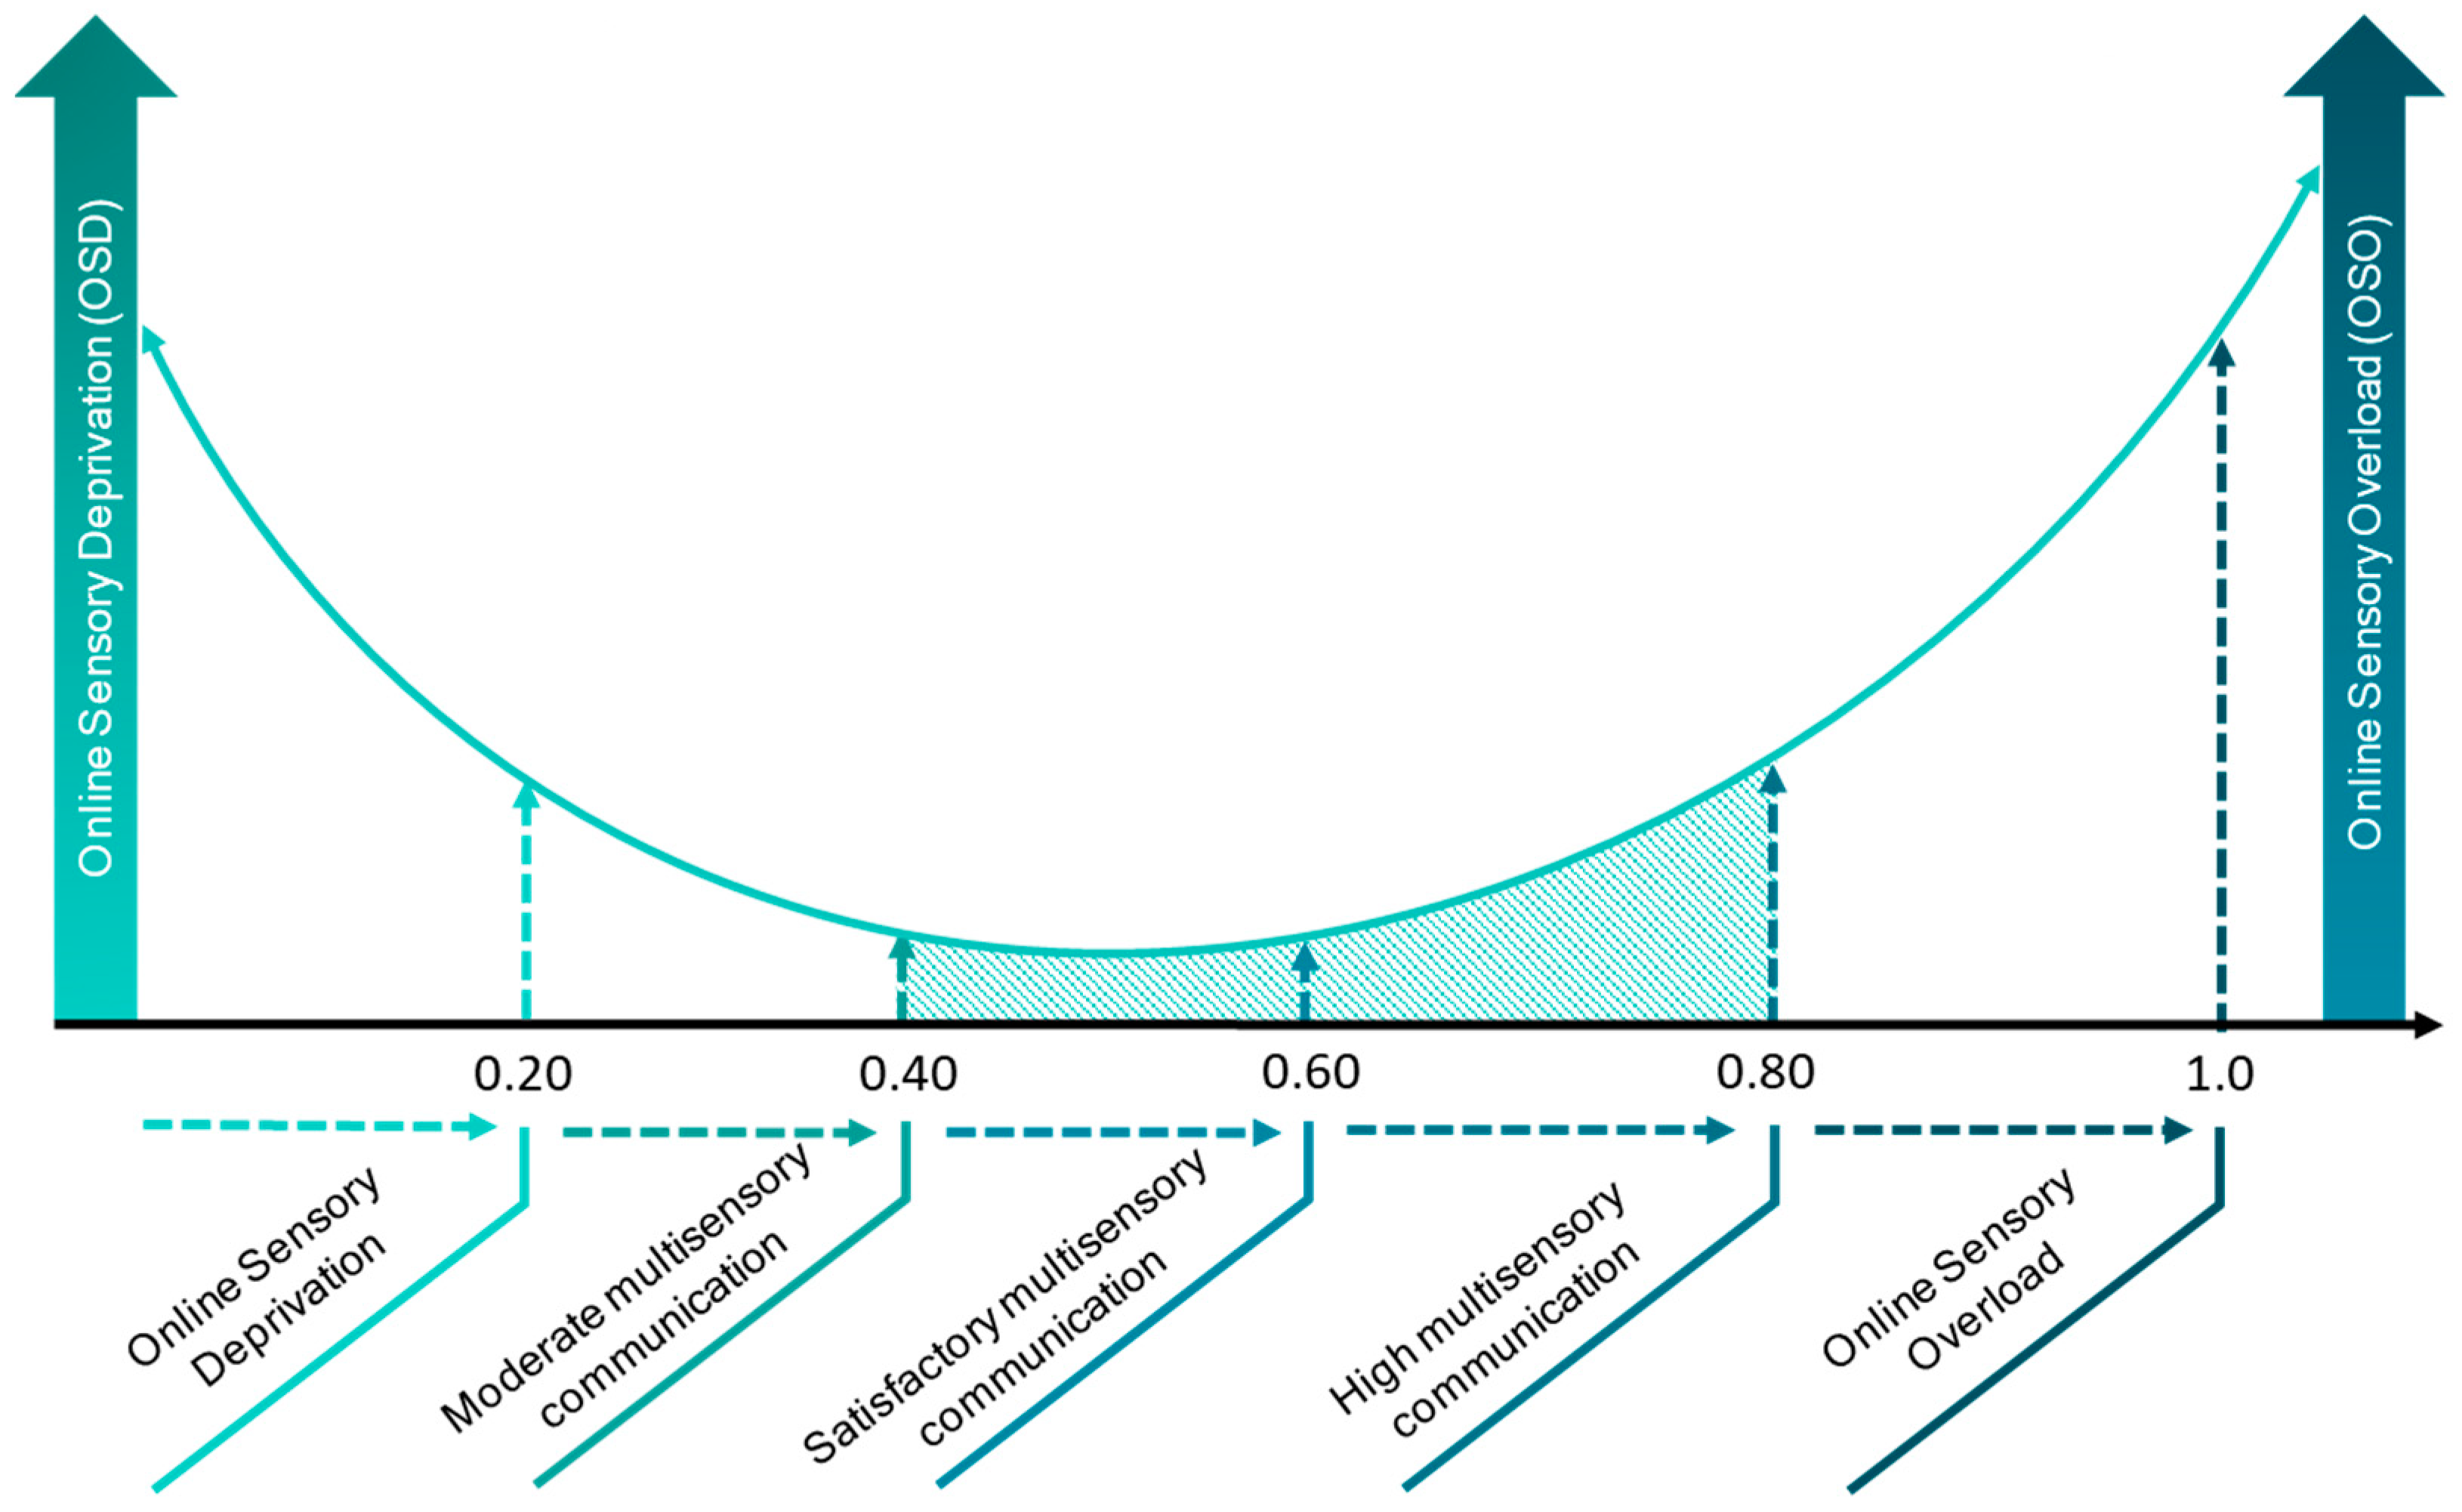
2.3. Sensory Deprivation in Online Environments

Based on numerous scientific studies from which we collected the OSMI, less or no sensory communication on e-commerce websites can be detrimental to the online sensory consumer experience. We call this effect online sensory deprivation (OSD) and define it according to the definition of Solomon et al. [46]: Online sensory deprivation is a process by which the consumer is deprived of an extensive lack of sensory stimulus perception in the online environment, leading to a disorienting and frustrating customer journey. A lack of external stimuli (e.g., colors, sounds, people, conversations) can contribute to thought disorders and malaise. In extreme cases, this occurs when certain essential sensory stimuli are deprived, such as gustatory texts and images on food websites. Lastly, the absence of such sensory modalities in online environments can cause consumers to become bored and short dwelling time on the viewed website. The early beginnings of the internet reflect this in that the text-heavy pages quickly demotivated people from continuing to browse and caused users to not see internet browsing as enjoyable. Additionally, the need for touch (NFT) [47] is a mediating factor that makes conveying haptic sensory impressions on the internet more essential. Yazdanparast and Spears [21], for example, conclude that a good mood can compensate for the frustration caused by a lack of haptics for people with a high NFT and provide findings to overcome OSD.

2.4. Sensory Overload in Online Environments
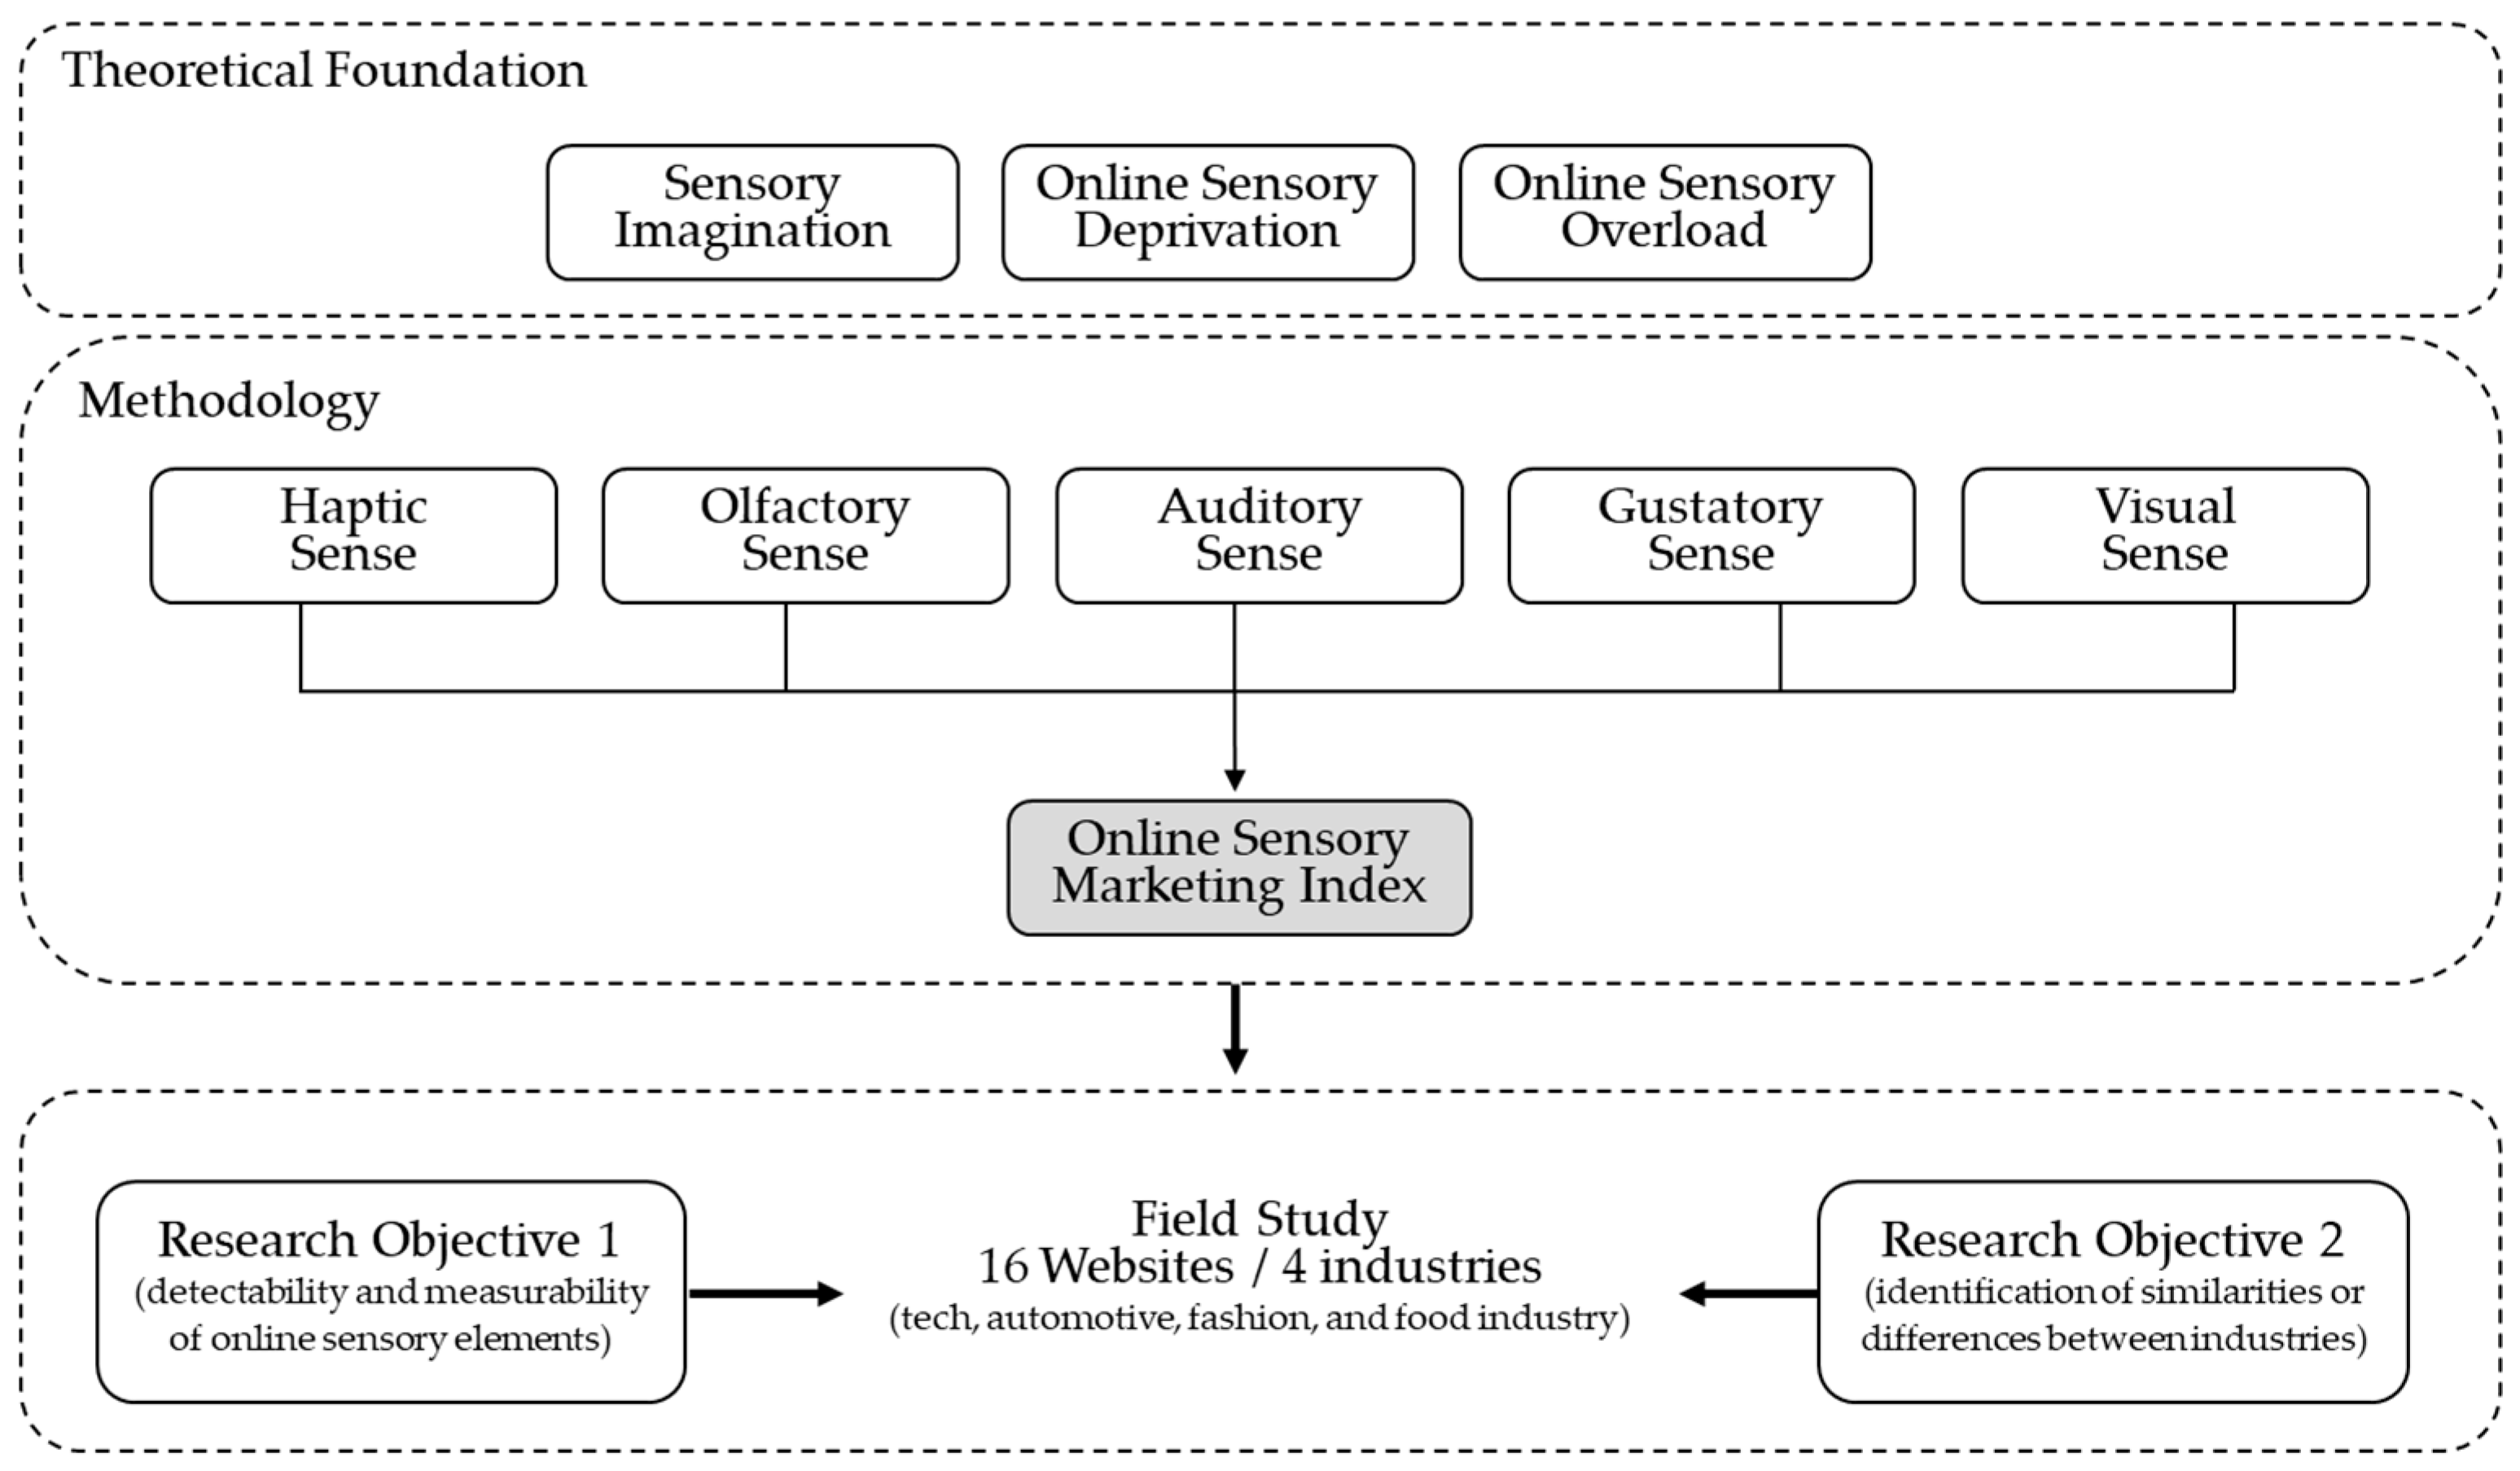
Given the complexity of sensory processing, as projected on the sensory communication quality of e-commerce websites, a “more-is-better approach” [3] is not necessarily the best option to choose. Exaggerating the sensory appeal to consumers can negatively affect purchase decisions [48], and one should always ask, as Riedel and Mulcahy suggest, “Does more sense make sense?” [49]. From a sensory marketing perspective, the possibility of addressing all five senses in a targeted manner must not lead to the five senses being entirely addressed. Addressing two to three senses might be sufficient. Homburg, Imschloß, and Kühnl [48] conducted a study about sensory overload and presented test persons with different sensory influences and excitation levels. They found that excitation congruence combinations of these stimuli contribute to a higher willingness to pay and more favorable product evaluations. First, this supports the importance of sensory congruence in responding to consumers. Second, the study demonstrates that when three sensory stimuli are used in a retail environment, one stimulus should have a lower excitation level. If three strong sensory stimuli are used, the willingness to purchase a product may decrease and result in a less positive product evaluation. In the field of digital sensory marketing, we can assume that sensory overload can lead to an aversion to the visited website. However, as Krishna [13] stated, sensory overload is as easy to achieve as information overload, even if scientific research is still greatly needed.

3. Methodology

Our subsequent measurement approach evaluates sensory marketing efforts in online environments based on findings obtained directly from the increasing number of sensory marketing research initiatives. Several studies have proposed evaluation frameworks and criteria in the field of websites (e.g., Chiou, Lin, and Perng 2010 for a literature review). However, in regard to online sensory marketing, there is no methodology to comprehensively analyze specific e-commerce websites for sensory components. Therefore, we adapt the index for evaluating tourism websites developed by Fernandez-Cavia et al. [9], called the web quality index (WQI), to match our purpose. Moreover, the same methodology is applied to assess the feasibility of the derived OSMI through a field study consisting of 16 websites from four different industries. The results are presented in the next Section 4.
Additionally, the past two decades in scientific literature have shown that researchers’ interest in improving consumers’ sensory experiences in online environments is steadily increasing [2,20]. Therefore, the purpose of the derived Online Sensory Marketing Index (OSMI) as a conceptual framework is to help practitioners obtain a shared sense of what is needed to create a sensory “webmosphere” [2] that can engage online shoppers’ senses properly via online sensory marketing possibilities. It will show which parameters and indicators may be helpful for sensory staging online.

3.1. OSMI Parameters

To establish the OSMI framework, we focus on the dimensions of online customer experience presented by Bleier, Harmeling, and Palmatier [3] (informativeness, entertainment, social presence, and sensory appeal) and build the OSMI in particular based on the sensory appeal dimension and expand it towards the five human senses.
We summarize this approach in the OSMI design in Figure 2. Beginning with haptics, a dominant quantity and expression of haptic elements over all other parameters becomes apparent. In total, there are 14 indicators for the parameter haptics (of which six are indirect), two indicators for olfactory, four for acoustics, five for the gustatory sense, and lastly, six indicators for sight. In addition, text-based indicators are assigned to each parameter, and other sensory elements, such as images, videos, or 3D data, are enriched.

3.2. OSMI Indicators

In Table 1, a uniform structure is chosen for all tables, which in the left column includes the abbreviations (e.g., H for haptics) and the possible numerical values for each indicator. These options are described in more detail in the middle column of the indices.
Similar to the study by Fernandez-Cavia et al. [9], the OSMI is characterized by indicators that use different scales: The scale is 0–1 in case a specific indicator is present or absent. On the other hand, if more factual statements can be made about the quality of the sensory characteristic, a 0–2 or 0–3 scale is used, e.g., Weak (0); Standard (1); Good (2); Excellent (3). The indicators were developed based on peer-reviewed journals with appropriate validations and the references are included in Table 1. Across the OSMI parameters, text-based indicators provide the basis for the assessment. Applying sensory information via a story format can be particularly useful [88]. Additionally, Elder and Krishna [19] showed that advertising texts and product descriptions could enhance the product experience if they are designed to be sensually congruent. In this context, the use of active verbs instead of nouns is advantageous [50]. In particular, Raposo et al. state that “Action words appear to activate motor regions only when they occur in isolation or in sentences that emphasize body movements.” [52]. Therefore, we include within the OSMI framework that an influence on the senses can occur at least indirectly on the basis of active verbs or sensorily formulated sentences.
Finally, McCabe and Nowlis [89] proved that product descriptions and advertising messages are perceived more strongly if they contain a pictorial illustration of the sensory experience. Indirect formulations, such as, “The taste of this freshly brewed coffee in the morning is a pleasure for every palate”, create a sensory imagination and can lead to increased product perception as well as purchase intention [90]. In contrast, a written, direct request about how the taste could be perceived is considered even more effective and is therefore assigned the highest evaluation level (3). This corresponds to a formulation such as, “Imagine how the freshly brewed coffee touches your palate in the morning and that you can taste the fine roasted aromas.”. In addition to sensory texts, (2D) images are included in the OSMI evaluation. Images are often standard in e-commerce but differ qualitatively regarding resolution and content, even if they can drastically increase purchase intention [55]. Presenting products from different angles should be as natural as high-resolution images using (2D) superzoom images [37]. In contrast, 3D images or animations generate interactivity by allowing consumers to zoom in on every angle of the product while rotating the item [58,59]. This creates more vivid visualizations of using products, leading to higher purchase intentions than when the same information is presented only statically [56]. Furthermore, a virtual try-on (H7) can reduce perceived product risk and increase the entertainment of online customer experiences [57,58]. For example, an online store’s appealing design, positive product descriptions or ratings, chats with friendly consultants, plenty of humor, and compelling images can attract people to online shopping. Therefore, the OSMI includes indirect haptic indicators (H9-H14) that can have a situational influence on the haptic sense when direct touch is not possible [3,21,67].

3.3. OSMI Weighting

An essential step toward evaluating the sensory appeal of e-commerce websites is to operationalize the content to be quantitatively measured using standardized scale in the range from 0 to 1. After the analysis, the indicators are usually weighted; each indicator is assigned a relative weight according to its significance within the analyzed parameter. Weighting higher-level parameters as such are also conceivable in this context. The weighting of each parameter or indicator is performed chiefly by discussion and negotiation of the value. In their research, Fernandez-Cavia et al. [9] suggest including expert opinions within a research team and existing literature, considering the importance of the indicator in each parameter and the extent of its scale. In the case of the OSMI, Petit et al. [2] highlight that the influence of sensory marketing on consumer behavior online is not limited but does not occur via the same channels as in the physical environment. Many scientific studies propose that, for example, parameter haptics should be weighted twice or higher in general [91]. However, the requirement after touch varies from person to person according to the NFT and the product category [47,92]. Due to these additional dimensions, sensory weighting is required to perform a differentiated analysis. For this purpose, the industries specified by Kilian [93] were adopted. He distinguishes between vehicles, electronics, households, furnishings, fashion, office supplies, hygiene, food, and service industries. This list of industries can be easily expanded. A rating of one to five represents the relevance of the different senses. One means that addressing the corresponding sense is unimportant, and five means that addressing the senses is extremely important in this industry. A rating below one is deliberately omitted since supposedly insignificant senses can influence other senses or fundamentally improve the well-being of a consumer. Therefore, a gradation of senses is to be created in which directly addressed sensory modalities of a particular industry receive the highest rating, and accompanying sensory perceptions are rated depending on the strength of their influence. Appending the weighting of the five sensory modalities directly and following the calculation of the OSMI, a distribution of the ratings by industry is depicted in Table 2. According to Kilian [93], the overview shows that three to four sensory modalities are of medium to high importance in nearly every industry, underscoring multisensory customer appeal. While visual perception plays a vital role in all industries, taste is of great importance only in the food sector. In other industries, the gustatory sense could only be used to improve well-being or stimulate memories. In contrast, the sense of touch is of at least medium importance across all industries. The factor of a haptic quality check, especially in the fashion, furnishing, and electronics industries, is highly relevant. Whether one imagines the feelings of a sweater’s material or the weight and comfort of holding a smartphone, haptic perception is omnipresent in these industries.
The senses of hearing and smell vary considerably in their importance in different industries. Lastly, only by considering the OSO and OSD does achieving higher OSMI ratings become a worthwhile goal.

3.4. OSMI Measurement and Interpretation

After evaluating the individual indicators, a standardized index is prepared for each parameter and rounded to two decimal places. Therefore, the result is always between 0 and 1 for each of the five parameters and the analyzed websites. The combined OSMI assesses the sensory quality. We define the OSMI by the following Equations:
OSMI = 1 5   ( x ¯ H + x ¯ O + x ¯ A + x ¯ G + x ¯ V )
or alternatively as follows:
OSMI = 1 5   i = 1 5 x i .
Before interpreting the OSMI values, we must consider the effects of sensory deprivation and overload. Therefore, OSMIw includes a weighting proposal via the weighted arithmetic mean and can be subsumed as follows:
OSMI W = i = 1 5 w i   x i   i = 1 5 x i
Adding the weighting enables the possibility of a plausible and realistic interpretation of different OSMIw values. Table 3, therefore, shows an example application of the OSMI, including the calculations of the parameter values and the OSMIw. Figure 3 shows different intervals of possible OSMIw calculations, each containing a quality description of the measured sensory communication quality. Contrary to the unweighted OSMI, even a very high OSMIw value is disadvantageous and undesirable to achieve. In this way, examples of pleasant and dissatisfactory sensory designs can be distinguished. An analysis of the improvement potential is easily possible by using specific details. The results can be used fundamentally for specifying sensory optimizations and even for the direct comparison of different industries with one another. We recommend that an OSMIw of >0.80 be considered an online sensory overload (OSO).
Thus, the preferred range is between 0.41 and 0.60 (“good” rating) or 0.61 and 0.80 (“high” rating). We set the value range of the OSMIw for such cases from 0.00 to 0.20.
Lastly, the OSMI becomes a curve that rises steeply toward the OSO since the probability of overload increases firmly with each additional sense addressed [48]. The general advantage of the method chosen is that these indicators allow general comparisons between the websites analyzed. Those who have been positively rated can be compared based on individual indicators.

4. Results

The test of the OSMI analysis approach was conducted based on 16 websites from four different industries. We chose the automotive, fashion, food, and technology industries, whose OSMI results per parameter are summarized in Table 4. Next, we will address each industry separately and explain the findings.

4.1. OSMI Evaluation of the Automobile Industry

Our investigation of the automotive industry has focused on international corporations like VW, Tesla, Ford, and GMC. We deliberately chose this mix to examine relatively new companies in addition to established companies with a long history. Likewise, the sales figures of the four companies are sometimes very different. While analyzing the websites, we focused exclusively on the subpages of the respective electric models since this trend toward electromobility is increasing worldwide, and the advertising measures of the companies are thus greatly focused on. It can be assumed that the websites are updated. However, our analysis reveals a divided picture of sensory communication elements among the four websites studied. The best weighted OSMI score was achieved by GMC at 0.44, followed by VW at 0.28, and lastly by Tesla and Ford with an identical score of 0.23 (Ø OSMIw 0.30). A closer examination of the use of the five senses’ indicators shows that neither the olfactory nor the gustatory sense is affected. On the other hand, there is a strong focus on haptic and visual stimuli, while the auditory sense is addressed sporadically. The haptic consumer approach is mainly textual and pictorial. The haptic imagination of advertised electric vehicles and their features are described extensively in narrative form. In addition, GMC and VW write requests for haptic imagery and receive the highest rating of indicator H1. For instance, GMC uses the phrase “Let the world in by removing the four panels and the front I-Bar and lowering the power Rear Drop Glass” and, to haptically promote features of their new ID.4 vehicle, VW writes, “Get your fingers warmed up”. Both are formulated as imperatives and involve the consumer’s sense of touch with a call for haptic imagination. However, the endowment effect (indicator H2) is only forced by Ford, e.g., by formulating and simultaneously combining the following sentences with pictures from a first-person perspective showing the cockpit of the vehicle: “Get to know your vehicle on your terms”. The word “your” evokes the image of taking possession of the advertised vehicle and simultaneously increases the desire for it. Peck, Barger, and Webb [39] have already confirmed that haptic imagery can have the same impact on the endowment effect as actual touch, and the endowment effect ultimately reinforces the desire for the advertised product. This could be supported by 3D product visualization, product videos, or virtual try-ons (H5-H7). However, these content variants are not used universally across all websites. VW offers a virtual try-on to project the vehicle into the room with one’s cellphone camera. In addition, except for Ford, every website studied implemented an interactive chat option, which is essential for interpersonal and haptic imagery. Such interactive content is, as it was, the highest density of indicator H13 across all four industries studied.
Furthermore, the sight is addressed well across all manufacturers, due mainly to the balanced design of sensory texts combined with corresponding visuals, as reflected by good to excellent ratings. In contrast, only GMC and VW address the auditory sense well by providing sensory information about the vehicle’s sound system. However, Tesla and Ford do not focus on acoustic-style elements.

4.2. OSMI Evaluation of the Fashion Industry

To analyze web pages from the fashion industry, we select well-known, high-quality brands such as Tommy Hilfiger, Hugo Boss, Levi’s, and Nike with somewhat different target groups and purposes. To simplify the analysis of fashion websites, we focus on constantly examining one to two websites. Following this strategy, Nike’s best-performing website had an OSMIw of 0.39, followed by Hugo Boss with 0.36. Levi’s had an OSMIw of 0.33, and Tommy Hilfiger had a score of 0.25 (Ø OSMIw 0.33). As in the automotive industry, none of the websites studied in the fashion sector addresses the olfactory or gustatory senses. In contrast, since clothing is traditionally a good that is experienced [92], the haptic sense plays a unique role and is emphasized by all websites. However, the haptic parameter shows that Hugo Boss achieves the best partial score of 0.60 because it is the only fashion company with ratings of H5 (3D content) and H13 (interactive chat with employees). In this context, 3D sensory content is related only to the virtual store tour and not individual products. Nevertheless, virtually entering a showroom generates a haptic imagination. Additionally, text-based haptic imagery is at a reasonable level. Both Tommy Hilfiger and Levi’s obtained the best score on H3 by using imperatives and active verbs such as “Accentuate your waist with the belt on this gender-neutral pinstripe blazer that perfectly accentuates your figure”. Based on the examples examined, the fashion industry shows an excellent positive mood (H11), which promotes social presence and thus indirectly promotes haptic imagery [21]. Discounts (H14) also contributed to this effect and were found at all four companies. In contrast, the interactive chat function with employees (H13) is implemented by only Hugo Boss. The visual parameter is strongly addressed within this industry so that every website scores above 0.50. Specifically, Levi’s and Nike stand out with scores of 0.73 and 0.80, respectively. Indicator V1—text-based visual imagery—is also used in indirect formulations on all four websites studied. Both Levi’s and Tommy Hilfiger have additionally formulated written prompts to cause visual imagery. For example, Levi’s writes the following written request: “Close your eyes. Think ‘‘jeans.’ Now open. They were 501 s®, right?” and strongly pushed the visual imagery of the promoted product. In addition, the color design (V2) of all four fashion websites is sensually congruent with the respective products within the framework of the visual parameter. Interestingly, Levi’s and Nike are the only companies in the fashion industry that have implemented customer star ratings on their e-commerce platforms (V9) and handwritten information (V8).

4.3. OSMI Evaluation of the Food Industry

Since the food industry is highly horizontally diversified, we select websites from the ice cream, coffee, and soft drinks industries to obtain a different perspective on the overarching industry. Nespresso leads the OSMI calculations for this industry with an OSMIw of 0.32, followed by Ben & Jerry’s scoring 0.28, Haagen-Dazs scoring 0.23, and Coca-Cola scoring 0.16. Due to the weighting of the OSMI, a decreasing correction of the unweighted OSMI values by −0.08 on average is shown for the first time in this industry. The weighting caused both the automotive and fashion industries to have slightly improved OSMI values. In contrast, the largest change is observed in Ben & Jerry’s, whose OSMIw is approximately −0.11 lower than the unweighted OSMI. For Nespresso, the OSMIw decreases by −0.09, Coca-Cola’s OSMI decreases by −0.07, and Haagen-Dazs’ OSMI decreases by −0.04. The reason for this gradation is obvious based on the industry-specific weighting of individual senses, according to which haptics are weighted with only three of five possible points. In addition, 40% is deducted due to the limited imaginative ability. Ambitions in the gustatory sensory appeal were also reduced by 40%. The generally low weighting of the parameter haptics is also reflected in the findings, which represent the lowest average values for haptic consumer appeal across all four industries. Nevertheless, haptics play an important role in sensory communication, even if haptics may be secondary in the food industry. This is shown by the fact that the websites studied address the haptic and visual senses online, in addition to the expected taste senses. A closer look at the haptics parameter shows that Nespresso and Ben & Jerry’s use text-based haptic imagery, including written requests (H1). For instance, phrases such as, “But this combined batch of brownie batter & cookie dough won’t last forever, so spoon in while you can!” (Ben & Jerry´s) or “Take your coffee enjoyment to a new level” (Nespresso) foster haptic imagery. Other haptic indicators of the OSMI framework are used less frequently and sometimes at a lower quality on the websites. For instance, most of the pictures placed throughout the websites are small. There is no possibility of zooming in to see more detailed images. The 3D content is not available (H5). In addition, Ben & Jerry’s, for example, places a spoon beside the ice cream to foster haptic and gustatory imagination. In contrast, within most pictures, Häagen-Dazs places a spoon on the left-hand side, which is expected to be less effective [37]. However, only Häagen-Dazs uses images from a first-person perspective (H3), which strongly reinforces the imagined haptic experience of the product. On the other hand, product videos (H6) are used by only Ben & Jerry’s, which show the product in action and while being explained by a spokesperson. Additionally, Nespresso’s overall score of 0.31 comes primarily from the fact that the website is the only one that has implemented an interactive chat with employees (H13) in addition to a standardized recommendation system (H12). Discounts, in turn, (H14) are mainly used by Coca-Cola and Nespresso. Expectedly, the taste of the advertised products is strongly emphasized on all four websites. Except for Häagen-Dazs, all websites have excellent text-based gustatory imagery (G1), including written requests combined with appropriate taste-stimulating images. A strong example is a formulation such as, “Make every coffee moment an unforgettable experience!” (Nespresso) combined with a picture of a woman enjoying a freshly brewed coffee. Other professional examples of utilizing G1 are given by formulations such as, “Sweeten Up Your Inbox” (Ben & Jerry’s) or “Discover more chocolate” (Häagen-Dazs). A closer examination of the use of visual indicators uncovers interesting insights. For example, text-based visual imagery is absent from Ben & Jerry’s website but is given with indirect formulations on Häagen-Dazs’ and Nespresso’s websites. Häagen-Dazs describes how they create their flavors by choosing phrases such as the following for different products: “We blend spoonful after spoonful of buttery roasted pecans […]” and “[…] swirl in ribbons of creamy, smooth peanut butter.”. Using these indirect descriptions, they refer not only to the taste but also to the production process of the ice cream, which generates a visual image of the ice cream. In this context, the proximity of the text-based indicators V1 and G1 becomes clear, and further connections to A1 and O1 would be equally conceivable. At Nespresso, V1 has a restriction that applies to only the promotion of technical products, such as coffee machines. For example, they use the description of the product: “With its chrome accents, it will certainly fit any kitchen”. The other visual indicators of the OSMI framework are partially implemented just as well, including the color scheme of the web pages (V2), which mostly matches the product and brand except on Coca-Cola’s website. To a certain extent, Nespresso enlarges the product, especially the color of the coffee capsules, on the general background and creates an enhanced visual sensory experience. Additionally, Nespresso is the only company that uses handwritten information (V8) to communicate the product names to emphasize product quality. In contrast, Nespresso does not have customer star ratings (V9), which could increase the positive feeling caused by this visual indicator. However, Ben & Jerry´s and Häagen-Dazs implemented and opened this tool to anyone who wanted to share his or her product experience.

4.4. OSMI Evaluation of the Technology Industry

Similar to the food industry, the technology sector can be divided into various subsectors. However, to keep our investigation practical, we have focused on the smartphone and laptop sectors. The OSMI results demonstrate the best overall scores of all four industries studied. For example, in the smartphone industry, Apple achieved an OSMIw of 0.51 for their subpage about the brand-new iPhone 13 Pro, and Samsung scored 0.50 for their multisensory content about the Samsung Galaxy S21 Ultra. Likewise, Microsoft and Hewlett-Packard achieved an OSMIw of 0.43, ranking third among the best results from all 16 websites. Only GMC from the automotive sector achieved this value, while the remaining OSMIw values were at least −0.05 and much less. Furthermore, the most significant positive change in OSMI results is with OSMIw values of +0.10 for Apple and Hewlett-Packard. This is mainly since acoustics play a vital role in the industry, and the achieved values of this parameter are unaffected by our reducing the score by 40% due to sensory imagery. In contrast, many other websites did not integrate acoustic elements. Another fascinating insight is that the four technology websites examined are the only ones to achieve the best score for text-based imagery in both H1 and V1. For example, Hewlett-Packard uses phrases such as, “Enjoy greater responsiveness from our scissor mechanism […]” to foster haptic imagery (H1) and “Explore the Zbook Studio—power to free the creative mind.” to enhance visual imagery (V1). Apple, on the other hand, communicates, “Customize your camera to lock in your look” for H1 and “Get right to the good stuff”/“Use AR to see them from every angle” for V1. Moreover, the endowment effect is most strongly addressed in the technology sector, starting with Hewlett-Packard using single keywords such as “your”, followed by Apple and Samsung, who (1) supplement endowment-related texts with (high-resolution) emotional images. Microsoft obtained the best score for H2 due to its additional integration of first-person perspective images. Thus, it stands out by using formulations such as “Personalize Surface Pro X and make it yours with next-gen tools and accessories.” combined with a bird’s eye view of some accessories. Acoustic sensory design is also most intensively pursued in the technology sector. All four websites use indirect formulations, including keywords such as “sound” or “hear”, to foster text-based acoustic imagery. Additionally, Microsoft uses written requests for better imagery regarding A1, such as, “Enjoy movies, music, and virtual meetings with amazing detail, richness, and depth thanks to Dolby Atmos® sound.” However, image-based acoustic imagery (A2) needs improvement in the other companies. Furthermore, due to the audio included in videos, the rating of A3 is suitable for all four companies; the music used is tuned to match the senses and playable with a click. The video elements include speakers (A5) who explain the products. Moreover, their voices congruently fit the senses and spread positivity (except for Microsoft). Gustation hardly affects the technology sector. Nevertheless, (imagined) gustatory stimuli can promote a multisensory consumer approach. Of the websites, only Samsung used a picture of a sushi dish that was zoomed in on to explain the zoom function of the advertised product. This promotes image-based gustatory imagination, even though this will not be the focus of sensory consumer targeting. On the other hand, the visual parameter is crucial in the technology industry. This is particularly evident in the top scores for text-based visual imagery (V1) for all four websites examined. Furthermore, the purely graphic web page design is sensorily defined, employing color (V2) and contrast (V6). Likewise, images are widely and effectively used. This means both keyframes (V3) and dynamic images (V5). Mood videos (V5), which are not product-specific but should embed keyframes and dynamic images, are used by only Apple and Hewlett-Packard. Glossy surfaces (V7)—especially about water—are interestingly utilized by Apple and Samsung to explain features by highlighting the tightness of the smartphones implementing dynamic water backgrounds. Interestingly, handwritten information (V8) and customer star ratings (V9) are not utilized.

5. Discussion

The 16 examined e-commerce websites generally show a discernible focus on the sensory modalities typical of their industries. Based on the study conducted, the first research objective can be confirmed. We can confirm the question that sensory elements can be measured in the context of e-commerce platforms by creating an evaluation proposal for sensory content in digital environments.
Interestingly, the calculations of the weighted OSMI are heavily influenced by our weighting proposal. Only haptics is weighted at −40%, which generally leads to an average OSMI value correction of 0.03, ranging from 0.10 (Apple, HP) to −0.11 (Ben & Jerry’s). However, we compare the absolute value adjustments with the percentage adjustments due to the weighting. On average, an increase in the unweighted OSMI of 20.45% was achieved, with ranges of only 1.17% (Hugo Boss) to 30.01% (Hewlett-Packard). This does not include the food sector, which was reduced by an average of 22.57%. Comparing the average OSMIw values per industry shows that the technology industry communicates best from a multisensory perspective with an average score of 0.47, followed by the fashion industry with an average score of 0.33, the automotive industry with an average score of 0.30, and lastly, the food industry with an average score of 0.25. These results confirm the second research objective: similarities and differences between industries can be identified by applying the developed OSMI measurement proposal.
In addition, the achieved OSMI scores for haptics, olfaction, and gustation are subject to a predefined weighting across industries of −40%. However, only the average OSMIw values per industry are not conclusive enough. The individual parameters and, subsequently, the indicators must be more closely examined. Regarding the parameters, both the haptic and visual senses are the best-addressed senses across all industries and websites. Only then comes the acoustic parameter and then the gustatory parameter, addressed almost by exclusively the food industry. On the other hand, the olfactory sense was primarily unaddressed in our sample.
By examining the individual indicators, we can conclude, according to our analysis, that text-based imagery is essential on nearly all websites studied. Text-based haptic and visual imagery are used professionally by integrating indirect formulations (e.g., narrative delivery of content) and written requests (imperative or similar) to foster imagination. For example, in the text-based haptic imagery, 10 web pages had a top score of H1. For the visual sense, seven of 16 web pages had a top score of V1. Surprisingly, the companies in the food industry performed the worst on average for both indicators (two websites, each with no rating or the lowest rating). However, the focus is clearly on text-based gustatory imagery, where three out of four companies achieved the best G1 score. This conciseness of text-based sensory stimulation will be of particular interest in the following automatic approach. High-quality images show the products from multiple angles, can be declared necessary for multisensory consumer engagement on e-commerce websites, and are used well on nearly all 16 websites. Nevertheless, there are subtle differences in the higher ratings of H3, as the first-person perspective on images is used on only 3 out of 16 websites. Consequently, this feature can potentially increase haptic imagery based on static images. Moreover, the examples show that the endowment effect (H2) is most strongly addressed in the technology sector using images from a first-person perspective, combined with appropriately stimulating text. However, indicators H5-H7 are used in a mixed way. Three-dimensional product visualization is used on five out of 16 websites, and product videos are used on nine out of 16 (only three of which show the product in action and explained by a spokesperson). In contrast, virtual try-on is implemented on only three websites, of which only two have personalized VTO. However, these findings are not surprising because this content is among the most expensive and is therefore used relatively rarely throughout all industries. This may also be related to the widespread use of acoustic indicators, apart from the technology sector. The auditory sense is seldom touched, even if it is the only sense besides sight that can be directly addressed via the standard functions of most devices. By examining the visual indicators of the OSMI, however, the potential for improvement in the multisensory consumer approach can be determined. Mood videos (V5), which are primarily intended to immerse consumers into the product world, are used by only half of all websites. Only 6 out of 16 websites provide mood videos with a quality of at least 1080p (full HD). Furthermore, handwritten information (3/16) and customer star ratings (4/16) are rarely used but offer the potential for social presence in sensory communication. A variety of optimization potential becomes visible using the OSMI and by identifying industry-specific peculiarities.

6. Conclusions

The purpose of this study was to provide simple recommendations to create an optimized online shopping design in terms of sensory communication, which can contribute to customer acquisition, increased attractiveness, sales, and customer retention [2,3]. The OSMI is intended, on the one hand, to show compensation possibilities for limited, direct sensory communication possibilities such as visual and acoustic elements. We then tested the OSMI with 36 indicators for the five senses selectively on 16 existing international e-commerce websites from various industries as part of the field test. The field study shows that by implementing the OSMI, weak points and highlights of the sensory communication quality can be exposed, from which conclusions and improvements can be derived and applied. Our in-depth analysis of the individual parameters and the specific indicators substantiated that the OSMI offers various starting points for optimizing sensory communication quality in the digital world. Via its application to e-commerce websites, the evaluation framework shows best-practice examples designated by high scores for indicators that perform outstandingly. Therefore, the application of the OSMI reveals strengths, weaknesses, and opportunities for the sensory communication quality of an e-commerce website. These can be evaluated in the context of one’s subjective relevance and other e-commerce websites of other industries’ direct and indirect competition. The OSMI unveils the potential for improvement in sensory communication; therefore, online marketing managers can quickly understand how future online content must be designed to more successfully use sensory communication, e.g., to convert website visitors into buyers [3]. Nevertheless, the fact that some of the sensory indicators presented, such as videos, 3D content, and virtual reality, are relatively costly should not be ignored. Other aspects, such as the text-based indicators of OSMI, are nearly free of charge. Therefore, the mix of multisensory communication should always be considered in the context of the available marketing budget and the company’s size. The weighting can and should be individually adapted to the company and respective industries. However, our evaluation approach offers a practical and convenient way for every firm to interpret the OSMI targets achieved. Our OSMI proposal is primarily designed to evaluate e-commerce platforms. However, it could also be used in customer touchpoints such as newsletters and apps, to test and evaluate those touchpoints according to sensory communication aspects. Accordingly, the OSMI offers high potential for retailers in the context of versatile applicability to a wide variety of marketing tools.
Even though we demonstrate the importance of sensory communication on e-commerce websites via the application of the OSMI, this work has limitations. Since we first present the OSMI as a concept based on scientific findings and test it as an example in this paper, we have not yet measured its validity. For accurate validation, each OSMI score would need to be validated for each sense individually. This requires revenue and sales figures, which we did not collect in this paper. However, this may be an important consideration for future studies that use the OSMI scores as a foundation for further measurements.
Generally, the OSMI can be understood as a living framework that should be continuously adapted to its evaluation purpose (e.g., in e-commerce websites, newsletters, and apps) and new practices and findings from marketing science. Therefore, the OSMI is incomplete but functions as an evaluation proposal for multisensory communication quality. We have deliberately made some assumptions to present a simple methodology for the OSMI calculation. However, the OSMI should always be considered individually and adapted under certain circumstances based on an individual’s priorities (e.g., individual senses). This includes our heuristic weighting approach, which is based on a study by Kilian [93] in offline marketing. To simplify matters and due to a lack of research, we have adopted the auditory and visual senses unchanged to evaluate online presence. However, we have given the senses of haptics, gustation, and olfaction, which cannot be addressed directly, an additional negative weighting of 40% to the standard weighting per industry based on available studies, especially from psychology studies about imagery. In this respect, the weighting is a not insignificant lever for determining the OSMIw values and clarifies that we can only evaluate sensory communication quality, which creates an opportunity for inevitable subjectivity. In addition, the OSMI could be enriched by weighting the 36 individual indicators of online sensory communication for each industry individually. However, this requires further research, which more closely examines the significance and can refine the calculation of the indicators for different industries. Furthermore, an interesting future research focus could be to make efforts to automate the OSMI using big-data methods to make the analysis faster and possibly even more effective. Another limitation of our work is the focus on the desktop version of all e-commerce websites. To holistically evaluate the OSMI, the mobile version of each website should be analyzed as well, as mobile usage is becoming increasingly important. Additionally, the research suggests continual further development in the digitalization of the senses; see also Petit, Velasco, and Spence [2] and Velasco et al. [20] for an overview. Physical and virtual experiences are increasingly merging. The content optimization previously shown by the evaluation model and its potential for multisensory consumer appeal will be further strengthened by specialized additional products or features called “sensory enabling technologies” (SET). SETs include virtual/augmented reality tools such as 3D glasses or odor stimulation gadgets [94]. However, as implied previously, creating a suitable evaluation tool that summarizes the criteria for the sensory design of e-commerce websites is highly relevant. With the OSMI, we provide a comfortable and holistic overview to assess sensory components and indicate the potential for improvement.

Author Contributions

Conceptualization, K.H.; methodology, K.H.; assistant in conceptualization and validation, R.B.; investigation, K.H.; resources, K.H. and R.B.; writing—original draft preparation, K.H. and R.B.; writing—review and editing, K.H. and R.B.; supervision, K.H. All authors have read and agreed to the published version of the manuscript.

Funding

This research received no external funding.

Institutional Review Board Statement

Not applicable.

Informed Consent Statement

Not applicable.

Data Availability Statement

Not applicable.

Conflicts of Interest

The authors declare no conflict of interest.

References

  1. Roggeveen, A.L.; Sethuraman, R. How the COVID-19 Pandemic May Change the World of Retailing. J. Retail. 2020, 96, 169–171. [Google Scholar] [CrossRef]
  2. Petit, O.; Velasco, C.; Spence, C. Digital Sensory Marketing: Integrating New Technologies Into Multisensory Online Experience. J. Interact. Mark. 2019, 45, 42–61. [Google Scholar] [CrossRef] [Green Version]
  3. Bleier, A.; Harmeling, C.M.; Palmatier, R.W. Creating Effective Online Customer Experiences. J. Mark. 2019, 83, 98–119. [Google Scholar] [CrossRef]
  4. Schlosser, A.E.; White, T.B.; Lloyd, S.M. Converting Web Site Visitors into Buyers: How Web Site Investment Increases Consumer Trusting Beliefs and Online Purchase Intentions. J. Mark. 2006, 70, 133–148. [Google Scholar] [CrossRef]
  5. Sugawara, E.; Nikaido, H. Properties of AdeABC and AdeIJK Efflux Systems of Acinetobacter Baumannii Compared with Those of the AcrAB-TolC System of Escherichia Coli. Antimicrob. Agents Chemother. 2014, 58, 7250–7257. [Google Scholar] [CrossRef] [PubMed] [Green Version]
  6. Pavlou, P.A.; Huigang, L.; Yajiong, X. Understanding and Mitigating Uncertainty in Online Exchange Relationships: A Principal-Agent Perspective. MIS Q. Manag. Inf. Syst. 2007, 31, 105–135. [Google Scholar] [CrossRef] [Green Version]
  7. Hong, Y.; Pavlou, P.A. Product Fit Uncertainty in Online Markets: Nature, Effects, and Antecedents. Inf. Syst. Res. 2014, 25, 328–344. [Google Scholar] [CrossRef]
  8. Aladwani, A.M. Developing and Validating an Instrument for Measuring User-Perceived Web Quality. Inf. Manag. 2002, 39, 467–476. [Google Scholar] [CrossRef] [Green Version]
  9. Fernández-Cavia, J.; Rovira, C.; Díaz-Luque, P.; Cavaller, V. Web Quality Index (WQI) for Official Tourist Destination Websites. Proposal for an Assessment System. Tour. Manag. Perspect. 2014, 9, 5–13. [Google Scholar] [CrossRef] [Green Version]
  10. Abdallah, S.; Jaleel, B. Website Appeal: Development of an Assessment Tool and Evaluation Framework of e-Marketing. J. Theor. Appl. Electron. Commer. Res. 2015, 10, 46–62. [Google Scholar] [CrossRef] [Green Version]
  11. Chiou, W.C.; Lin, C.C.; Perng, C. A Strategic Framework for Website Evaluation Based on a Review of the Literature from 1995–2006. Inf. Manag. 2010, 47, 282–290. [Google Scholar] [CrossRef]
  12. Statista Average Daily Time Spent per Capita with the Internet in North America from 2011 to 2021. Available online: https://0-www-statista-com.brum.beds.ac.uk/statistics/645644/north-america-daily-time-per-capita-internet/ (accessed on 23 December 2021).
  13. Krishna, A. An Integrative Review of Sensory Marketing: Engaging the Senses to Affect Perception, Judgment and Behavior. J. Consum. Psychol. 2012, 22, 332–351. [Google Scholar] [CrossRef] [Green Version]
  14. Podoshen, J. Brand Sense: How to Build Powerful Brands Through Touch, Taste, Smell, Sight and Sound; Free Press: New York, NY, USA, 2005; Volume 14, ISBN 9780749443719. [Google Scholar]
  15. Krishna, A.; Schwarz, N. Sensory Marketing, Embodiment, and Grounded Cognition: A Review and Introduction. J. Consum. Psychol. 2014, 24, 159–168. [Google Scholar] [CrossRef]
  16. Krishna, A.; Cian, L.; Sokolova, T. The Power of Sensory Marketing in Advertising. Curr. Opin. Psychol. 2016, 10, 142–147. [Google Scholar] [CrossRef]
  17. Zajonc, R.B. Feeling and Thinking: Preferences Need No Inferences. Am. Psychol. 1980, 35, 151–175. [Google Scholar] [CrossRef]
  18. Petit, O.; Cheok, A.D.; Spence, C.; Velasco, C.; Karunanayaka, K.T. Sensory Marketing in Light of New Technologies. In Proceedings of the 12th International Conference on Advances in Computer Entertainment Technology, ACE 2015, Iskandar, Malaysia, 16–19 November 2015; pp. 1–4. [Google Scholar]
  19. Elder, R.S.; Krishna, A. The Effects of Advertising Copy on Sensory Thoughts and Perceived Taste. J. Consum. Res. 2010, 36, 748–756. [Google Scholar] [CrossRef]
  20. Velasco, C.; Sunaga, T.; Narumi, T.; Motoki, K.; Spence, C.; Petit, O. Multisensory Consumer-Computer Interaction. J. Bus. Res. 2021, 134, 716–719. [Google Scholar] [CrossRef]
  21. Yazdanparast, A.; Spears, N. Can Consumers Forgo the Need to Touch Products? An Investigation of Nonhaptic Situational Factors in an Online Context. Psychol. Mark. 2013, 30, 46–61. [Google Scholar] [CrossRef]
  22. Kim, M.; Kim, J.H.; Park, M.; Yoo, J. The Roles of Sensory Perceptions and Mental Imagery in Consumer Decision-Making. J. Retail. Consum. Serv. 2021, 61, 102517. [Google Scholar] [CrossRef]
  23. Elder, R.S.; Krishna, A. A Review of Sensory Imagery for Consumer Psychology. J. Consum. Psychol. 2022, 32, 293–315. [Google Scholar] [CrossRef]
  24. Madzharov, A.V.; Block, L.G.; Morrin, M. The Cool Scent of Power: Effects of Ambient Scent on Consumer Preferences and Choice Behavior. J. Mark. 2015, 79, 83–96. [Google Scholar] [CrossRef] [Green Version]
  25. MacInnis, D.J.; Price, L.L. The Role of Imagery in Information Processing: Review and Extensions. J. Consum. Res. 1987, 13, 473. [Google Scholar] [CrossRef]
  26. Spence, C.; Deroy, O. Crossmodal Mental Imagery. In Multisensory Imagery; Lacey, S., Lawson, R., Eds.; Springer: New York, NY, USA, 2013; Volume 9781461458, pp. 157–183. ISBN 9781461458791. [Google Scholar]
  27. Chao, L.L.; Martin, A. Representation of Manipulable Man-Made Objects in the Dorsal Stream. Neuroimage 2000, 12, 478–484. [Google Scholar] [CrossRef] [PubMed] [Green Version]
  28. Simmons, W.K.; Martin, A.; Barsalou, L.W. Pictures of Appetizing Foods Activate Gustatory Cortices for Taste and Reward. Cereb. Cortex 2005, 15, 1602–1608. [Google Scholar] [CrossRef]
  29. Spence, C.; Okajima, K.; Cheok, A.D.; Petit, O.; Michel, C. Eating with Our Eyes: From Visual Hunger to Digital Satiation. Brain Cogn. 2016, 110, 53–63. [Google Scholar] [CrossRef] [Green Version]
  30. Elder, R.S.; Schlosser, A.E.; Poor, M.; Xu, L. So Close i Can Almost Sense It: The Interplay between Sensory Imagery and Psychological Distance. J. Consum. Res. 2017, 44, 877–894. [Google Scholar] [CrossRef] [Green Version]
  31. Pearson, J.; Naselaris, T.; Holmes, E.A.; Kosslyn, S.M. Mental Imagery: Functional Mechanisms and Clinical Applications. Trends Cogn. Sci. 2015, 19, 590–602. [Google Scholar] [CrossRef] [Green Version]
  32. Bensafi, M.; Porter, J.; Pouliot, S.; Mainland, J.; Johnson, B.; Zelano, C.; Young, N.; Bremner, E.; Aframian, D.; Khan, R.; et al. Olfactomotor Activity during Imagery Mimics That during Perception. Nat. Neurosci. 2003, 6, 1142–1144. [Google Scholar] [CrossRef]
  33. Dijkstra, N.; Bosch, S.E.; van Gerven, M.A.J. Vividness of Visual Imagery Depends on the Neural Overlap with Perception in Visual Areas. J. Neurosci. 2017, 37, 1367–1373. [Google Scholar] [CrossRef] [Green Version]
  34. Olivetti Belardinelli, M.; Palmiero, M.; Sestieri, C.; Nardo, D.; Di Matteo, R.; Londei, A.; D’Ausilio, A.; Ferretti, A.; Del Gratta, C.; Romani, G.L. An FMRI Investigation on Image Generation in Different Sensory Modalities: The Influence of Vividness. Acta Psychol. 2009, 132, 190–200. [Google Scholar] [CrossRef]
  35. Cui, X.; Jeter, C.B.; Yang, D.; Montague, P.R.; Eagleman, D.M. Vividness of Mental Imagery: Individual Variability Can Be Measured Objectively. Vis. Res. 2007, 47, 474–478. [Google Scholar] [CrossRef] [PubMed] [Green Version]
  36. Rao Unnava, H.; Agarwal, S.; Haugtvedt, C.P. Interactive Effects of Presentation Modality and Message-Generated Imagery on Recall of Advertising Information. J. Consum. Res. 1996, 23, 81–88. [Google Scholar] [CrossRef]
  37. Elder, R.S.; Krishna, A. The “Visual Depiction Effect” in Advertising: Facilitating Embodied Mental Simulation through Product Orientation. J. Consum. Res. 2012, 38, 988–1003. [Google Scholar] [CrossRef]
  38. Silva, S.C.; Rocha, T.V.; De Cicco, R.; Galhanone, R.F.; Manzini Ferreira Mattos, L.T. Need for Touch and Haptic Imagery: An Investigation in Online Fashion Shopping. J. Retail. Consum. Serv. 2021, 59, 102378. [Google Scholar] [CrossRef]
  39. Peck, J.; Barger, V.A.; Webb, A. In Search of a Surrogate for Touch: The Effect of Haptic Imagery on Perceived Ownership. J. Consum. Psychol. 2013, 23, 189–196. [Google Scholar] [CrossRef]
  40. Labroo, A.A.; Nielsen, J.H. Half the Thrill is in the Chase: Twisted Inferences from Embodied Cognitions and Brand Evaluation. J. Consum. Res. 2010, 37, 143–158. [Google Scholar] [CrossRef]
  41. Krishna, A.; Morrin, M. Does Touch Affect Taste? The Perceptual Transfer of Product Container Haptic Cues. J. Consum. Res. 2008, 34, 807–818. [Google Scholar] [CrossRef] [Green Version]
  42. Yorkston, E.; Menon, G. A Sound Idea: Phonetic Effects of Brand Names on Consumer Judgments. J. Consum. Res. 2004, 31, 43–51. [Google Scholar] [CrossRef]
  43. González, J.; Barros-Loscertales, A.; Pulvermüller, F.; Meseguer, V.; Sanjuán, A.; Belloch, V.; Ávila, C. Reading Cinnamon Activates Olfactory Brain Regions. Neuroimage 2006, 32, 906–912. [Google Scholar] [CrossRef]
  44. Ludwig, S.; De Ruyter, K.; Friedman, M.; Brüggen, E.C.; Wetzels, M.; Pfann, G. More than Words: The Influence of Affective Content and Linguistic Style Matches in Online Reviews on Conversion Rates. J. Mark. 2013, 77, 87–103. [Google Scholar] [CrossRef]
  45. Song, J.H.; Zinkhan, G.M. Determinants of Perceived Web Site Interactivity. J. Mark. 2008, 72, 99–113. [Google Scholar] [CrossRef]
  46. SOLOMON, P.; LEIDERMAN, P.H.; MENDELSON, J.; WEXLER, D. Sensory Deprivation; a Review. Am. J. Psychiatry 1957, 114, 357–363. [Google Scholar] [CrossRef] [PubMed]
  47. Peck, J.; Childers, T.L. To Have and to Hold: The Influence of Haptic Information on Product Judgments. J. Mark. 2003, 67, 35–48. [Google Scholar] [CrossRef]
  48. Homburg, C.; Imschloß, M.; Kühnl, C. Of Dollars and Senses—Does Multisensory Marketing Pay Off? Res. Insights Pap. RI009 Inst. Mark.-Oriented Manag. Univ. Mannh. 2012, 9, 14. [Google Scholar]
  49. Riedel, A.; Mulcahy, R.F. Does More Sense Make Sense?An Empirical Test of High Andlow Interactive Retail Technology. J. Serv. Mark. 2019, 33, 331–343. [Google Scholar] [CrossRef]
  50. Bower, B. The Brain’s Word Act. Sci. News 2004, 165, 83. [Google Scholar] [CrossRef]
  51. Chang, C. Imagery Fluency and Narrative Advertising Effects. J. Advert. 2013, 42, 54–68. [Google Scholar] [CrossRef]
  52. Raposo, A.; Moss, H.E.; Stamatakis, E.A.; Tyler, L.K. Neuropsychologia Modulation of Motor and Premotor Cortices by Actions, Action Words and Action Sentences. Neuropsychologia 2009, 47, 388–396. [Google Scholar] [CrossRef]
  53. Shen, H.; Sengupta, J. If You Can’t Grab It, It Won’t Grab You: The Effect of Restricting the Dominant Hand on Target Evaluations. J. Exp. Soc. Psychol. 2012, 48, 525–529. [Google Scholar] [CrossRef]
  54. Shu, S.; Peck, J. To Hold Me is To Love Me: The Role of Touch in the Endowment Effect. NA—Adv. Consum. Res. 2007, 34, 513–514. [Google Scholar]
  55. Park, J.; Lennon, S.J.; Stoel, L. On-Line Product Presentation: Effects on Mood, Perceived Risk, and Purchase Intention. Psychol. Mark. 2005, 22, 695–719. [Google Scholar] [CrossRef]
  56. Choi, Y.K.; Taylor, C.R. How Do 3-Dimensional Images Promote Products on the Internet? J. Bus. Res. 2014, 67, 2164–2170. [Google Scholar] [CrossRef]
  57. Kim, J.; Forsythe, S. Sensory Enabling Technology Acceptance Model (SE-TAM): A Multiple-Group Structural Model Comparison. Psychol. Mark. 2008, 25, 901–922. [Google Scholar] [CrossRef]
  58. Kim, J.; Forsythe, S. Adoption of Virtual Try-on Technology for Online Apparel Shopping. J. Interact. Mark. 2008, 22, 45–59. [Google Scholar] [CrossRef]
  59. Kim, S.; Baek, T.H.; Yoon, S. The Effect of 360-Degree Rotatable Product Images on Purchase Intention. J. Retail. Consum. Serv. 2020, 55, 102062. [Google Scholar] [CrossRef]
  60. Li, H.; Daugherty, T.; Biocca, F. Impact of 3-D Advertising on Product Knowledge, Brand Attitude, and Purchase Intention: The Mediating Role of Presence. J. Advert. 2002, 31, 43–57. [Google Scholar] [CrossRef]
  61. Nah, F.F.H.; Eschenbrenner, B.; DeWester, D. Enhancing Brand Equity through Flow and Telepresence: A Comparison of 2D and 3D Virtual Worlds. MIS Q. Manag. Inf. Syst. 2011, 35, 731–747. [Google Scholar] [CrossRef]
  62. Roggeveen, A.L.; Grewal, D.; Townsend, C.; Krishnan, R. The Impact of Dynamic Presentation Format on Consumer Preferences for Hedonic Products and Services. J. Mark. 2015, 79, 34–49. [Google Scholar] [CrossRef]
  63. San-martín, S.; González-benito, Ó.; Martos-partal, M.; San-martín, S. To What Extent Does Need for Touch Affect Online Perceived Quality ? Int. J. Retail Distrib. Manag. 2017, 45, 950–968. [Google Scholar] [CrossRef]
  64. Cho, H.; Schwarz, N. I Like Your Product When I Like My Photo: Misattribution Using Interactive Virtual Mirrors. J. Interact. Mark. 2012, 26, 235–243. [Google Scholar] [CrossRef]
  65. Merle, A.; Senecal, S.; St-Onge, A. Whether and How Virtual Try-on Influences Consumer Responses to an Apparel Web Site. Int. J. Electron. Commer. 2012, 16, 41–64. [Google Scholar] [CrossRef]
  66. Morhenn, V.B.; Park, J.W.; Piper, E.; Zak, P.J. Monetary Sacrifice among Strangers Is Mediated by Endogenous Oxytocin Release after Physical Contact. Evol. Hum. Behav. 2008, 29, 375–383. [Google Scholar] [CrossRef]
  67. González-Benito, Ó.; Martos-Partal, M.; San Martín, S. Brands as Substitutes for the Need for Touch in Online Shopping. J. Retail. Consum. Serv. 2015, 27, 121–125. [Google Scholar] [CrossRef]
  68. Krishna, A.; Morrin, M.; Sayin, E. Smellizing Cookies and Salivating: A Focus on Olfactory Imagery. J. Consum. Res. 2014, 41, 18–34. [Google Scholar] [CrossRef]
  69. Lin, M.H.; Cross, S.N.N.; Laczniak, R.N.; Childers, T.L. The Sniffing Effect: Olfactory Sensitivity and Olfactory Imagery in Advertising. J. Advert. 2018, 47, 97–111. [Google Scholar] [CrossRef]
  70. Spence, C.; Zampini, M.; Gallace, A.; Etzi, R. When Sandpaper Is ‘Kiki’ and Satin Is ‘Bouba’: An Exploration of the Associations Between Words, Emotional States, and the Tactile Attributes of Everyday Materials. Multisens. Res. 2016, 29, 133–155. [Google Scholar]
  71. Lowrey, T.M.; Shrum, L.J. Phonetic Symbolism and Brand Name Preference. J. Consum. Res. 2007, 34, 406–414. [Google Scholar] [CrossRef]
  72. Spence, C. Managing Sensory Expectations Concerning Products and Brands: Capitalizing on the Potential of Sound and Shape Symbolism. J. Consum. Psychol. 2012, 22, 37–54. [Google Scholar] [CrossRef]
  73. Stewart, M.A.; Ryan, E.B. Attitudes toward Younger and Older Adult Speakers: Effects of Varying Speech Rates. J. Lang. Soc. Psychol. 1982, 1, 91–109. [Google Scholar] [CrossRef]
  74. Stewart, K.; Koh, H.E. Hooked on a Feeling: The Effect of Music Tempo on Attitudes and the Mediating Role of Consumers’ Affective Responses. J. Consum. Behav. 2017, 16, 550–564. [Google Scholar] [CrossRef]
  75. Gvili, Y.; Tal, A.; Amar, M.; Wansink, B. Moving up in Taste: Enhanced Projected Taste and Freshness of Moving Food Products. Psychol. Mark. 2017, 34, 671–683. [Google Scholar] [CrossRef]
  76. Spence, C.; Wan, X.; Woods, A.; Velasco, C.; Deng, J.; Youssef, J.; Deroy, O. On Tasty Colours and Colourful Tastes? Assessing, Explaining, and Utilizing Crossmodal Correspondences between Colours and Basic Tastes. Flavour 2015, 4. [Google Scholar] [CrossRef] [Green Version]
  77. Spence, C.; Levitan, C.A. Explaining Crossmodal Correspondences Between Colours and Tastes. i-Perception 2021, 12. [Google Scholar] [CrossRef] [PubMed]
  78. Woods, A.T.; Marmolejo-Ramos, F.; Velasco, C.; Spence, C. Using Single Colors and Color Pairs to Communicate Basic Tastes II: Foreground-Background Color Combinations. i-Perception 2016, 7, 1–20. [Google Scholar] [CrossRef] [PubMed]
  79. Velasco, C.; Woods, A.T.; Hyndman, S.; Spence, C. The Taste of Typeface. Iperception 2015, 6, 1–10. [Google Scholar] [CrossRef] [Green Version]
  80. Spence, C.; Ngo, M. Assessing the Shape Symbolism of the Taste, Flavour, and Texture of Foods and Beverages. Flavour 2012, 1, 12. [Google Scholar] [CrossRef] [Green Version]
  81. Semin, G.R.; Palma, T.A. Why the Bride Wears White: Grounding Gender with Brightness. J. Consum. Psychol. 2014, 24, 217–225. [Google Scholar] [CrossRef]
  82. Sliburyte, L.; Skeryte, I. What We Know about Consumers’ Color Perception. Procedia—Soc. Behav. Sci. 2014, 156, 468–472. [Google Scholar] [CrossRef] [Green Version]
  83. Cian, L.; Krishna, A.; Elder, R.S. This Logo Moves Me: Dynamic Imagery from Static Images. J. Mark. Res. 2014, 51, 184–197. [Google Scholar] [CrossRef] [Green Version]
  84. Reynolds-McIlnay, R.; Morrin, M.; Nordfält, J. How Product–Environment Brightness Contrast and Product Disarray Impact Consumer Choice in Retail Environments. J. Retail. 2017, 93, 266–282. [Google Scholar] [CrossRef]
  85. Meert, K.; Pandelaere, M.; Patrick, V.M. Taking a Shine to it: How the Preference for Glossy Stems from an Innate Need for Water. J. Consum. Psychol. 2014, 24, 195–206. [Google Scholar] [CrossRef]
  86. Hultén, B. Sensory Marketing: The Multi-sensory Brand-experience Concept. Eur. Bus. Rev. 2011, 23, 256–273. [Google Scholar] [CrossRef]
  87. Chevalier, J.A.; Mayzlin, D. The Effect of Word of Mouth on Sales: Online Book Reviews. J. Mark. Res. 2006, 43, 345–354. [Google Scholar] [CrossRef] [Green Version]
  88. Lee, S.; Jeong, M.; Oh, H. Enhancing Customers’ Positive Responses: Applying Sensory Marketing to the Hotel Website. J. Glob. Sch. Mark. Sci. 2018, 28, 68–85. [Google Scholar] [CrossRef]
  89. Mccabe, D.B.; Nowlis, S.M. The Effect of Examining Actual Products or Product Descriptions on Consumer Preference. J. Consum. Psychol. 2003, 13, 431–439. [Google Scholar] [CrossRef]
  90. Fenko, A.; de Vries, R.; van Rompay, T. How Strong is Your Coffee? The Influence of Visual Metaphors and Textual Claims on Consumers’ Flavor Perception and Product Evaluation. Front. Psychol. 2018, 9, 53. [Google Scholar] [CrossRef] [Green Version]
  91. Heller, M.A.; Clark, A. Touch as a “Reality Sense”. In Blindness and Brain Plasticity in Navigation and Object Perception; Lawrence Erlbaum Associates Publishers: Mahwah, NJ, USA, 2012; pp. 259–280. ISBN 9780203809976. [Google Scholar]
  92. Peck, J.; Childers, T.L. Individual Differences in Haptic Information Processing: The “Need for Touch” Scale. J. Consum. Res. 2003, 30, 430–442. [Google Scholar] [CrossRef]
  93. Kilian, K. Multisensuales Marketing: Marken Mit Allen Sinnen Erlebbar Machen. Transf. Werbeforsch. Prax. 2010, 56, 42–48. [Google Scholar]
  94. Spence, C. Scenting Entertainment: Virtual Reality Storytelling, Theme Park Rides, Gambling, and Video-Gaming. i-Perception. 2021, 12, 1–26. [Google Scholar] [CrossRef]
Figure 1. Research model.
Jtaer 17 00039 g001
Figure 2. Overview of the Online Sensory Marketing Index.
Jtaer 17 00039 g002
Figure 3. Interpretation proposal of the weighted OSMI values.
Jtaer 17 00039 g003
Table 1. Overview of the Online Sensory Marketing Index (OSMI).
Specification
ParameterIndicator(0) Weak(1) Standard(2) Good(3) ExcellentReferences
Direct Haptic IndicatorsH1 (0-3)Text based haptic imageryNot present (N.p.)Available (at least one keyword sensory matching the advertised product) Indirect formulations
(e.g., narrative delivery of content)
Written request (e.g.) use of active verbs (e.g., imperative) [38,39,50,51,52]
H2 (0-3)Endowment effectN.p.Arouse the sense of ownership with textual references(1) Supplemented by (high- resolution) emotional images(2) Supplemented by pictures with I-Perspective and/or 3D images [39,53,54]
H3 (0-3)2D imagesN.p.Super-zoom-images (feature crops)Representation from different anglesUse I-perspective [37,55]
H4 (0-1)Depicted dimensions of the productN.p.Available [37]
H5 (0-3)3D product visualizationN.p.AvailableRotation in online product presentation (automatically)Interactive rotation in online product presentation [55,56,57,58,59,60,61]
H6 (0-2)Product video (moving images)N.p.Product in actionProduct in action and explained by spokesperson [62,63]
H7 (0-3)Virtual try-on (VTO)N.p.AvailableVR including self-locationPersonalized VR [57,58,64,65]
H8 (0-1)Representation of interpersonal touchesN.p.Available [66]
Indirect Haptic IndicatorsH9 (0-2)BrandN.p.AvailableBrand with a high level of awareness [67]
H10 (0-1)Online forumN.p.Available [21]
H11 (0-3)Positive moodBad moodNeutralEnthusiastic pictures of persons/animalsImages from (2) combined with texts and/or sounds [21]
H12 (0-2)Recommendation agentsN.p.Automated/based on other Automated/personalized on own behavior [3]
H13 (0-2)Interactive Chat with employeesN.p.ChatbotInteractive chat with real employees [3,21]
H14 (0-1)Discounts (price promotion)N.p.Available [21]
OlfactoryO1 (0-3)Text based olfactory imageryN.p.Available (at least one keyword sensory matching the advertised product) Indirect formulationsWritten request [43,68,69]
O2 (0-1)Imaged based olfactory imageryN.p.Mood image evoking olfactory imagery
AcousticsA1 (0-3)Text based acoustic imageryN.p.Available (at least one keyword sensory matching the advertised product) Indirect formulationsWritten request [36,50]
A2 (0-1)Imaged based acoustic imageryN.p.Mood image evoking acoustic imagery
A3 (0-3)Sound s/MusicNo acousticsTones available, but not congruent to other sensory impressionsIndividual tones tuned to other sensesMusic tuned to match the senses, playable with a click [70]
A4 0-1Perceived sounds about lived wordsN.p. Words are sensually adapted according to their sound on product (category) [71,72]
A5 0-3Speaker/VoiceN.p.Speaker/voice integratedSpeaker/voice is sensually tunedSpeaker/voice congruently matched to the senses and spreads a positive mood [62,73,74]
GustatoryG1 0-3Text based gustatory imageryN.p.Available (at least one keyword sensory matching the advertised product) Indirect formulationsWritten request [16,19,75]
G2 0-1Imaged based gustatory imageryNot presentMood image evoking gustatory imagery
G3 0-1Use of color schemesNot present or black, white or too many, mixed colorsOne color sensually congruently applied [76,77,78]
G4 0-1Adjustment/design of the brand-name /Product nameBrand and/or product name not sensually adapted to product (category)Product category and name of the brand or product sensually matched [72]
G5 0-1Typography of the product descriptionTypography is not adapted to product tasteTypography is matched to product taste [79]
G6 0-1Product look (incl. packaging) and surfacesProduct layout (total) is not adjusted to product tasteProduct layout (total) is tailored to product taste [79,80]
VisualityV1 0-3Text based visual imageryNot presentAvailable (at least one keyword sensory matching the advertised product) Indirect formulationsWritten request [19]
V2 0-3Coloring of web pageNot tunedAdapted to the productMatched to product/brandGender-specific color schemes [81,82]
V3 0-1Key frames (images)N.p.Available [37]
V4 (0-1)Dynamic imagesN.p.Available [62,83]
V5 (0-3)Mood videoN.p.Available at standard definitionAvailable at high def. (1080p) Available at ultra high def. (>1080p) [62]
V6 (0-1)Contrast of Images/web pageNot tunedStrong contrast (dark products with light background and vice versa) [84]
V7 (0-1)Surface (gloss vs. matt)Not coordinatedAvailable [85]
V8 (0-1)Handwritten informationN.p.Available [86]
V9 (0-2)Customer star ratingsN.p.AvailableIncluding reference [3,87]
Table 2. Sensory weighting per industry offline and online.
Imagery (−40%)
Industry/SectorExample(s)HapticsOlfactoryGustatoryAcousticsVisionSumProduct Categorization
AutomobileCarJtaer 17 00039 i004Jtaer 17 00039 i003Jtaer 17 00039 i001Jtaer 17 00039 i004Jtaer 17 00039 i00517Search Product
Jtaer 17 00039 i007Jtaer 17 00039 i007Jtaer 17 00039 i006Jtaer 17 00039 i009Jtaer 17 00039 i01014
TechnologyTVJtaer 17 00039 i004Jtaer 17 00039 i002Jtaer 17 00039 i001Jtaer 17 00039 i005Jtaer 17 00039 i00517Search Product
Jtaer 17 00039 i007Jtaer 17 00039 i006Jtaer 17 00039 i006Jtaer 17 00039 i010Jtaer 17 00039 i01014
HouseholdMicrowaveJtaer 17 00039 i003Jtaer 17 00039 i003Jtaer 17 00039 i001Jtaer 17 00039 i004Jtaer 17 00039 i00415Search Product
Jtaer 17 00039 i007Jtaer 17 00039 i007Jtaer 17 00039 i006Jtaer 17 00039 i009Jtaer 17 00039 i00913
InteriorCouchJtaer 17 00039 i005Jtaer 17 00039 i003Jtaer 17 00039 i001Jtaer 17 00039 i003Jtaer 17 00039 i00517Experience Product
Jtaer 17 00039 i008Jtaer 17 00039 i009Jtaer 17 00039 i006Jtaer 17 00039 i008Jtaer 17 00039 i01016
FashionT-ShirtJtaer 17 00039 i005Jtaer 17 00039 i003Jtaer 17 00039 i001Jtaer 17 00039 i002Jtaer 17 00039 i00516Experience Product
Jtaer 17 00039 i008Jtaer 17 00039 i007Jtaer 17 00039 i006Jtaer 17 00039 i007Jtaer 17 00039 i01013
Office suppliesPencilJtaer 17 00039 i004Jtaer 17 00039 i003Jtaer 17 00039 i001Jtaer 17 00039 i003Jtaer 17 00039 i00415Search Product
Jtaer 17 00039 i007Jtaer 17 00039 i007Jtaer 17 00039 i006Jtaer 17 00039 i008Jtaer 17 00039 i00913
Hygiene/CosmeticsParfumJtaer 17 00039 i005Jtaer 17 00039 i005Jtaer 17 00039 i001Jtaer 17 00039 i002Jtaer 17 00039 i00417Experience Product
Jtaer 17 00039 i008Jtaer 17 00039 i008Jtaer 17 00039 i006Jtaer 17 00039 i007Jtaer 17 00039 i00914
FoodCandyJtaer 17 00039 i003Jtaer 17 00039 i005Jtaer 17 00039 i005Jtaer 17 00039 i003Jtaer 17 00039 i00521Search Product
Jtaer 17 00039 i007Jtaer 17 00039 i008Jtaer 17 00039 i008Jtaer 17 00039 i008Jtaer 17 00039 i01016
Vacation/TravelFlightJtaer 17 00039 i004Jtaer 17 00039 i004Jtaer 17 00039 i002Jtaer 17 00039 i004Jtaer 17 00039 i00519Experience Product
Jtaer 17 00039 i007Jtaer 17 00039 i007Jtaer 17 00039 i006Jtaer 17 00039 i009Jtaer 17 00039 i01014
Healthcare *VaccineJtaer 17 00039 i003Jtaer 17 00039 i004Jtaer 17 00039 i004Jtaer 17 00039 i003Jtaer 17 00039 i00519Experience Product
Jtaer 17 00039 i007Jtaer 17 00039 i007Jtaer 17 00039 i007Jtaer 17 00039 i008Jtaer 17 00039 i01013
Leisure *StreamingJtaer 17 00039 i004Jtaer 17 00039 i002Jtaer 17 00039 i002Jtaer 17 00039 i004Jtaer 17 00039 i00517Experience Product
Jtaer 17 00039 i007Jtaer 17 00039 i006Jtaer 17 00039 i006Jtaer 17 00039 i009Jtaer 17 00039 i01013
Lifestyle/Juwelry *WatchJtaer 17 00039 i004Jtaer 17 00039 i004Jtaer 17 00039 i002Jtaer 17 00039 i003Jtaer 17 00039 i00518Search Product
Jtaer 17 00039 i007Jtaer 17 00039 i007Jtaer 17 00039 i006Jtaer 17 00039 i008Jtaer 17 00039 i01013
Legend: ●●●●● à extremely important/● à extremely unimportant (basically enclosed)/ Jtaer 17 00039 i001 à original weighting (offline driven)/ Jtaer 17 00039 i006 à adapted weighting to online-environment/* additional Industry (not included at Kilian (2010).
Table 3. Example of OSMI measurement.
Ø-HapticsØ-OlfactoryØ-AcousticsØ-GustatoryØ-Visuality
x ¯ 0–3H130–3O100–3A130–3G100–3V13
0–3H230–1O200–1A210–1G200–3V22
0–3H33 0–3A330–1G300–1V31
0–1H40 0–1A400–1G400–1V41
0–3H53 0–3A500–1G500–3V50
0–2H61 0–1G600–1V61
0–3H70 0–1V70
0–1H80 0–1V80
0–2H92 0–2V90
0–1H100
0–3H111
0–2H121
0–2H132
0–1H141
30 204 011 78 016 8
20 30   ≈ 0.67 0 4   ≈ 0.00 7 11   ≈ 0.64 0 8   ≈ 0.00 8 16   ≈ 0.50
  OSMI = 1 5   i = 1 5 x i =   1 5   (0.67 + 0.00 + 0.64 + 0.00 + 0.50)   OSMI = 0.36
OSMI W = i = 1 5 w i   x i   i = 1 5 x i = ( 4 17 ) 0.60 0.67 + ( 2 17 ) 0.60 0.00 + ( 5 17 ) 0.64 + ( 1 17 ) 0.60 0.00 + ( 5 17 ) 0.50   OSMI W = 0.43
Note: Weighting Example belongs to Technology-industry.
Table 4. OSMI results of the field test.
BrancheCompaniesØ-HapticsØ-OlfactoryØ-GustatoryØ-AcousticsØ-VisualityOS-MIOSMIwØ OSMIwURLAbs. Var.Rat. Var.
AutomobileVW0.470.000.000.270.470.24
0.28
0.30(1) https://www.vw.com/en/models/id-4.html 0.0417.65%
0.080.000.000.060.14
AutomobileTesla0.330.000.000.000.600.19
0.23
(1) https://www.tesla.com/modely0.0426.19%
0.060.000.000.000.18
AutomobileFord0.430.000.000.000.530.19
0.23
(1) https://www.ford.com/trucks/f150/f150-lightning/2022/0.0420.71%
0.080.000.000.000.16
AutomobileGMC0.500.000.000.640.670.36
0.44
(1) https://www.gmc.com/electric/hummer-ev0.0820.41%
0.090.000.000.150.20
FashionTommy Hilfiger0.470.000.000.000.530.20
0.25
0.33(1) https://www.us.tommy.com/man-suits0.0526.88%
0.090.000.000.000.17
FashionHugo Boss0.600.000.000.640.530.35
0.36
(1) https://www.hugoboss.com/us/boss-x-nba/
(2) https://www.hugoboss.com/us/boss-experience/
0.011.17%
0.110.000.000.080.17
FashionLevi`s0.530.000.000.000.730.25
0.33
(1) https://www.levi.com/us/shop-all/501-levis-7/8-jeans/p/3620001670.0829.96%
0.100.000.000.000.23
FashionNike0.400.000.000.550.800.35
0.39
(1) https://www.nike.com
(2) https://www.jordan.com/collection/air-jordan
0.0412.50%
0.080.000.000.070.25
FoodBen & Jerrys0.330.000.750.270.600.39
0.28
0.25(1) https://www.benjerry.com/−0.11-28.64%
0.030.000.110.000.14
FoodHäagen-Dazs0.230.000.500.000.600.27
0.23
(1) https://www.haagendazs.us/products/ice-cream−0.04-12.03%
0.020.000.070.000.14
FoodNespresso0.400.250.880.000.530.41
0.32
(1) https://www.espresso.com/de/en/order/machines/vertuo/vertuo-next-dark-grey
(2) https://www.espresso.com/de/en/order/capsules/vertuo
−0.09-21.87%
0.030.040.130.000.13
FoodCoca Cola0.300.000.630.000.200.23
0.16
(1) https://www.us.coca-cola.com/−0.07-27.73%
0.030.000.090.000.05
TechnologyApple0.600.000.000.730.730.41
0.51
0.47(1) https://www.apple.com/iphone-13-pro/0.1024.79%
0.080.000.000.210.21
TechnologySamsung0.700.000.130.730.600.43
0.50
(1) https://www.samsung.com/us/smartphones/ga-laxy-s21-ultra-5g/0.0615.55%
0.100.000.010.210.18
TechnologyMicrosoft0.670.000.000.640.500.36
0.43
(1) https://www.microsoft.com/en-us/surface/devices/surface-pro-x/tech-specs
(2) https://www.microsoft.com/en-us/d/surface-book-3/8xbw9g3z71f1?
0.0718.75%
0.090.000.000.190.15
TechnologyHewlett-Packard0.370.000.000.730.560.33
0.43
(1) https://www.hp.com/ch-en/shop/offer.aspx?p=b-hp-zbook-create-g7
(2) https://www.hp.com/us-en/workstations/zbook-firefly.html
0.1030.01%
0.050.000.000.210.16
0.039.64%
Note: All URLs have been retrieved on 16 July 2021 (Exception: Apple’s URL was visited on 26 September due to product launch).
Publisher’s Note: MDPI stays neutral with regard to jurisdictional claims in published maps and institutional affiliations.

