Next Article in Journal
Entropic Forces in Geophysical Fluid Dynamics
Previous Article in Journal
Imaging Velocimetry Measurements for Entropy Production in a Rotational Magnetic Stirring Tank and Parallel Channel Flow
 
 
Correction published on 7 August 2009, see Entropy 2009, 11(3), 384.
Article

Decimative Multiplication of Entropy Arrays, with Application to Influenza

1
Division of Applied Mathematics and Center for Computational Molecular Biology, Brown University, Providence, RI 02912, USA
2
Department of Physics, Portland State University, Portland, OR 97207, USA
3
Department of Medicine, Alpert Medical School of Brown University, Providence, RI 02912, USA
*
Author to whom correspondence should be addressed.
Submission received: 17 May 2009 / Accepted: 29 July 2009 / Published: 31 July 2009

Abstract

:
The use of the digital signal processing procedure of decimation is introduced as a tool to detect patterns of information entropy distribution and is applied to information entropy in influenza A segment 7. Decimation was able to reveal patterns of entropy accumulation in archival and emerging segment 7 sequences that were not apparent in the complete, undecimated data. The low entropy accumulation along the first 25% of segment 7, revealed by the three frames of decimation, may be a sign of regulation at both protein and RNA levels to conserve important viral functions. Low segment 7 entropy values from the 2009 H1N1 swine flu pandemic suggests either that: (1) the viruses causing the current outbreak have convergently evolved to their low entropy state or (2) more likely, not enough time has yet passed for the entropy to accumulate. Because of its dependence upon the periodicity of the codon, the decimative procedure should be generalizable to any biological system.

1. Introduction

In this study the digital signal processing technique of decimation [1] is introduced as a tool to analyze information entropy accumulation in sequences of nucleic acids. Decimative array multiplication is applied to the entropy of sequences of segment 7, one of the eight RNA segments encoding influenza [2] and is found to reveal patterns of entropy distribution that are otherwise hidden. Because, as it is applied in this study, it is based on the three-position periodicity of the codon, decimative multiplication should be generalizable to any biological system.

2. Results and Discussion

2.1. Results

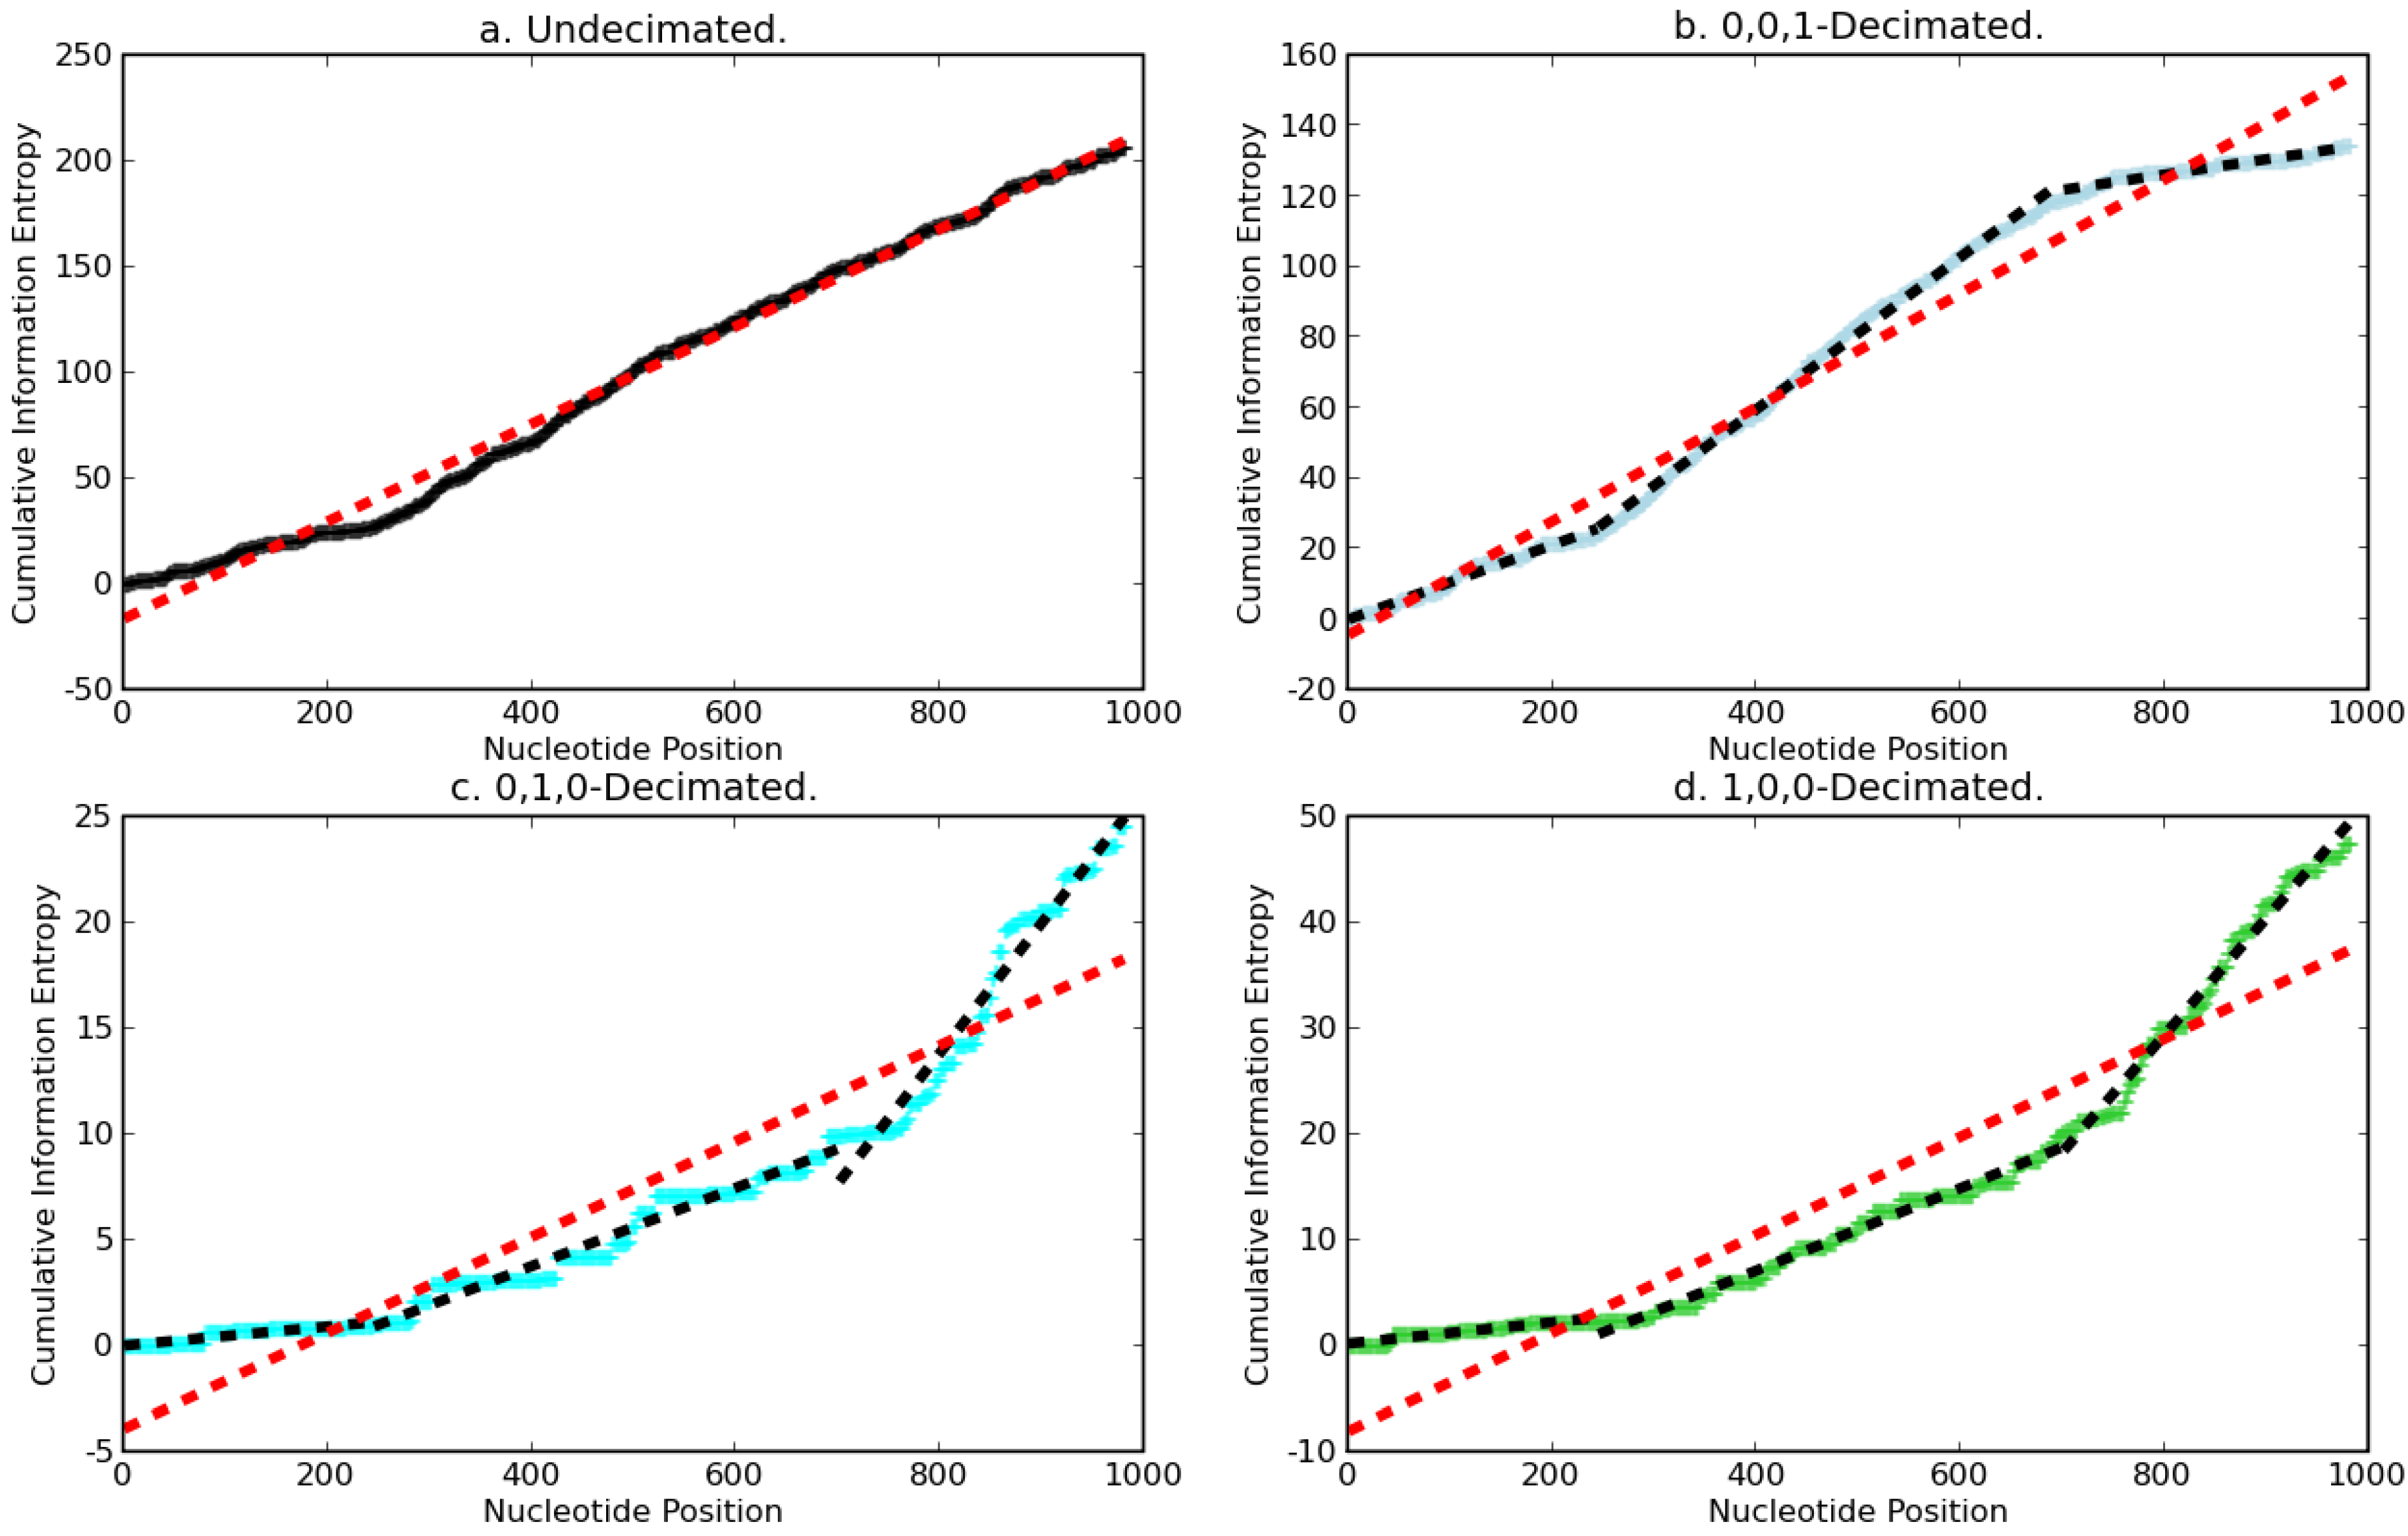
2.1.1. Decimation by a factor of three (3)

Figure 1 shows the fast Fourier transform (FFT) of the vector of entropy values for the 982 nucleotide positions of 5,175 segment 7 sequences from nine combined influenza A subtypes. The FFT of the entropy vector reveals the periodicity of three (3), i.e., the three base periodicity of the codon [3]. This periodicity provides the factor used for the decimation of the sequences of entropy values.
Figure 1. Fast Fourier transform of the segment 7 entropy vector from a combination of nine common influenza subtypes. The periodicity is 1/frequency.
Entropy 11 00351 g001

2.1.2. Decimation of combined subtype entropy

The decimation procedure was performed first on the information entropy obtained for a pool of combined segment 7 sequences obtained for the most common influenza A subtypes in the NCBI database. The Shannon calculation of information entropy [4] is provided in the Experimental Section.
One of three decimative arrays was used individually for each decimation (see Experimental Section) and the entropy was then summed along the segment. The slope of the cumulative sum allows a simple visual comparison of the entropy trends along a segment. As shown in Figure 2a-d, the cumulative entropy distribution was relatively flat in the undecimated vector and in all three of the decimated vectors until nucleotide position 245. The average entropy of all nucleotides taken together is relatively constant. An upward inflection at, or near, nucleotide position 245 can be observed both in the undecimated (Figure 2a) and the decimated data (Figure 2b–d). In contrast, a downward inflection (Figure 2b) and upward inflection (Figure 2c,d) can be observed at position 700 only in the decimated cumulative entropy distributions but not in the undecimated entropy data (Figure 2a). The curvatures at position 700 revealed by decimation reflect a decrease in entropy accumulation (Figure 2b) at the third codon position, i.e. the wobble position [5] of the M1 gene and with increases in entropy accumulation at the first (Figure 2c) and third (Figure 2d) codon positions of the M2 gene.
For all linear regressions reported in this study, Pearson correlation coefficients (r) were greater than 0.90, with p values indistinguishable from zero. The total cumulative sum for the complete, undecimated entropy vector was 206.0391 bits. The total cumulative sums of the decimated entropy vectors were 134.0025 bits (Figure 2b), 24.5651 bits (Figure 2c) and 47.4715 bits (Figure 2d). The sum of the decimated vectors equals that of the undecimated vector.
Figure 2. Cumulative sums of decimated segment 7 information entropy vectors.
Entropy 11 00351 g002
The red dashed lines were fit by linear regression to each vector of cumulative sums of entropy values. The black dashed lines were fit according to Equation 2.

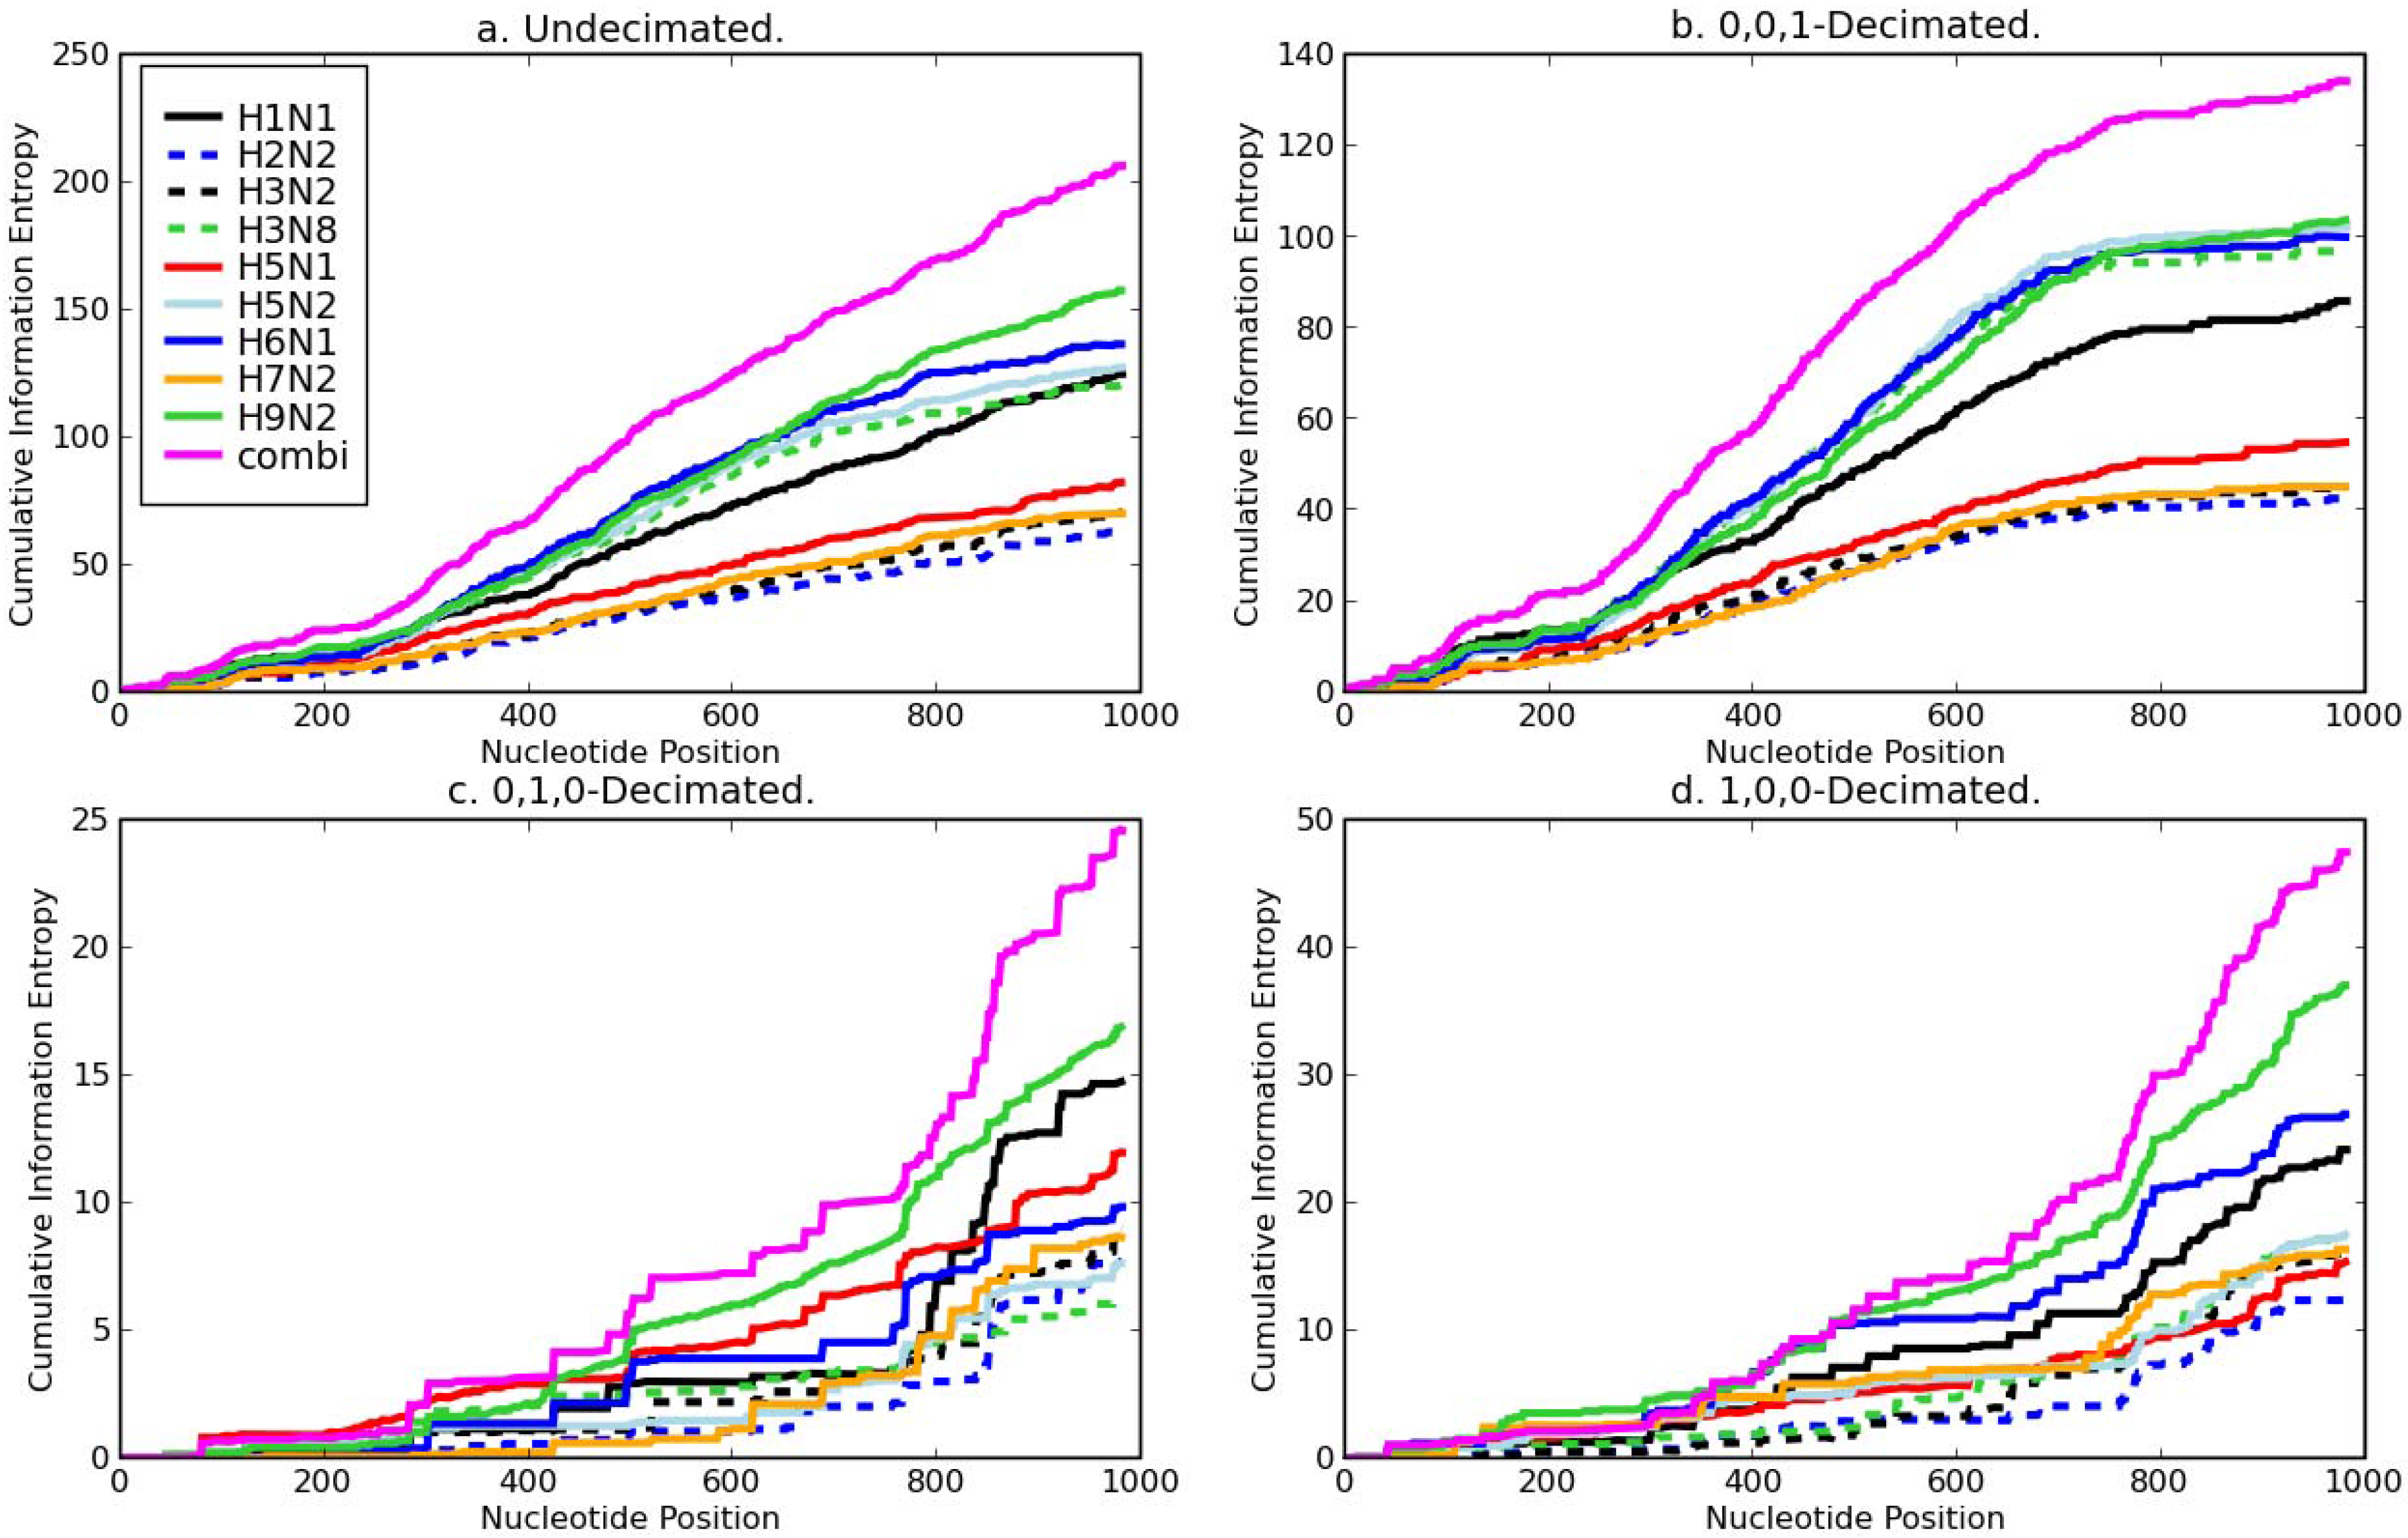
2.1.3. Individual subtype sequences

Data decimation was next applied to segment 7 entropy vectors from the individual subtypes comprising the subtype pool. Decimated and undecimated cumulative entropy distributions computed for segment 7 sequences from individual subtypes (Figure 3) displayed features and inflections similar to those of the pooled subtypes. Importantly, decimation in the 0,1,0-frame revealed a sharp inflection in H1N1 entropy accumulation near position 759 (Figure 3c) that was not apparent in the undecimated data (Figure 3a); Nucleotide position 759 is the end of the M1 gene and overlaps with the M2 gene [6]. Thus, decimation revealed an increase in entropy accumulation in the first codon positions of the M2 gene that was not apparent in the complete, undecimated data.
Figure 3. Decimated distribution of entropy in common influenza a subtype segment 7 sequences.
Entropy 11 00351 g003

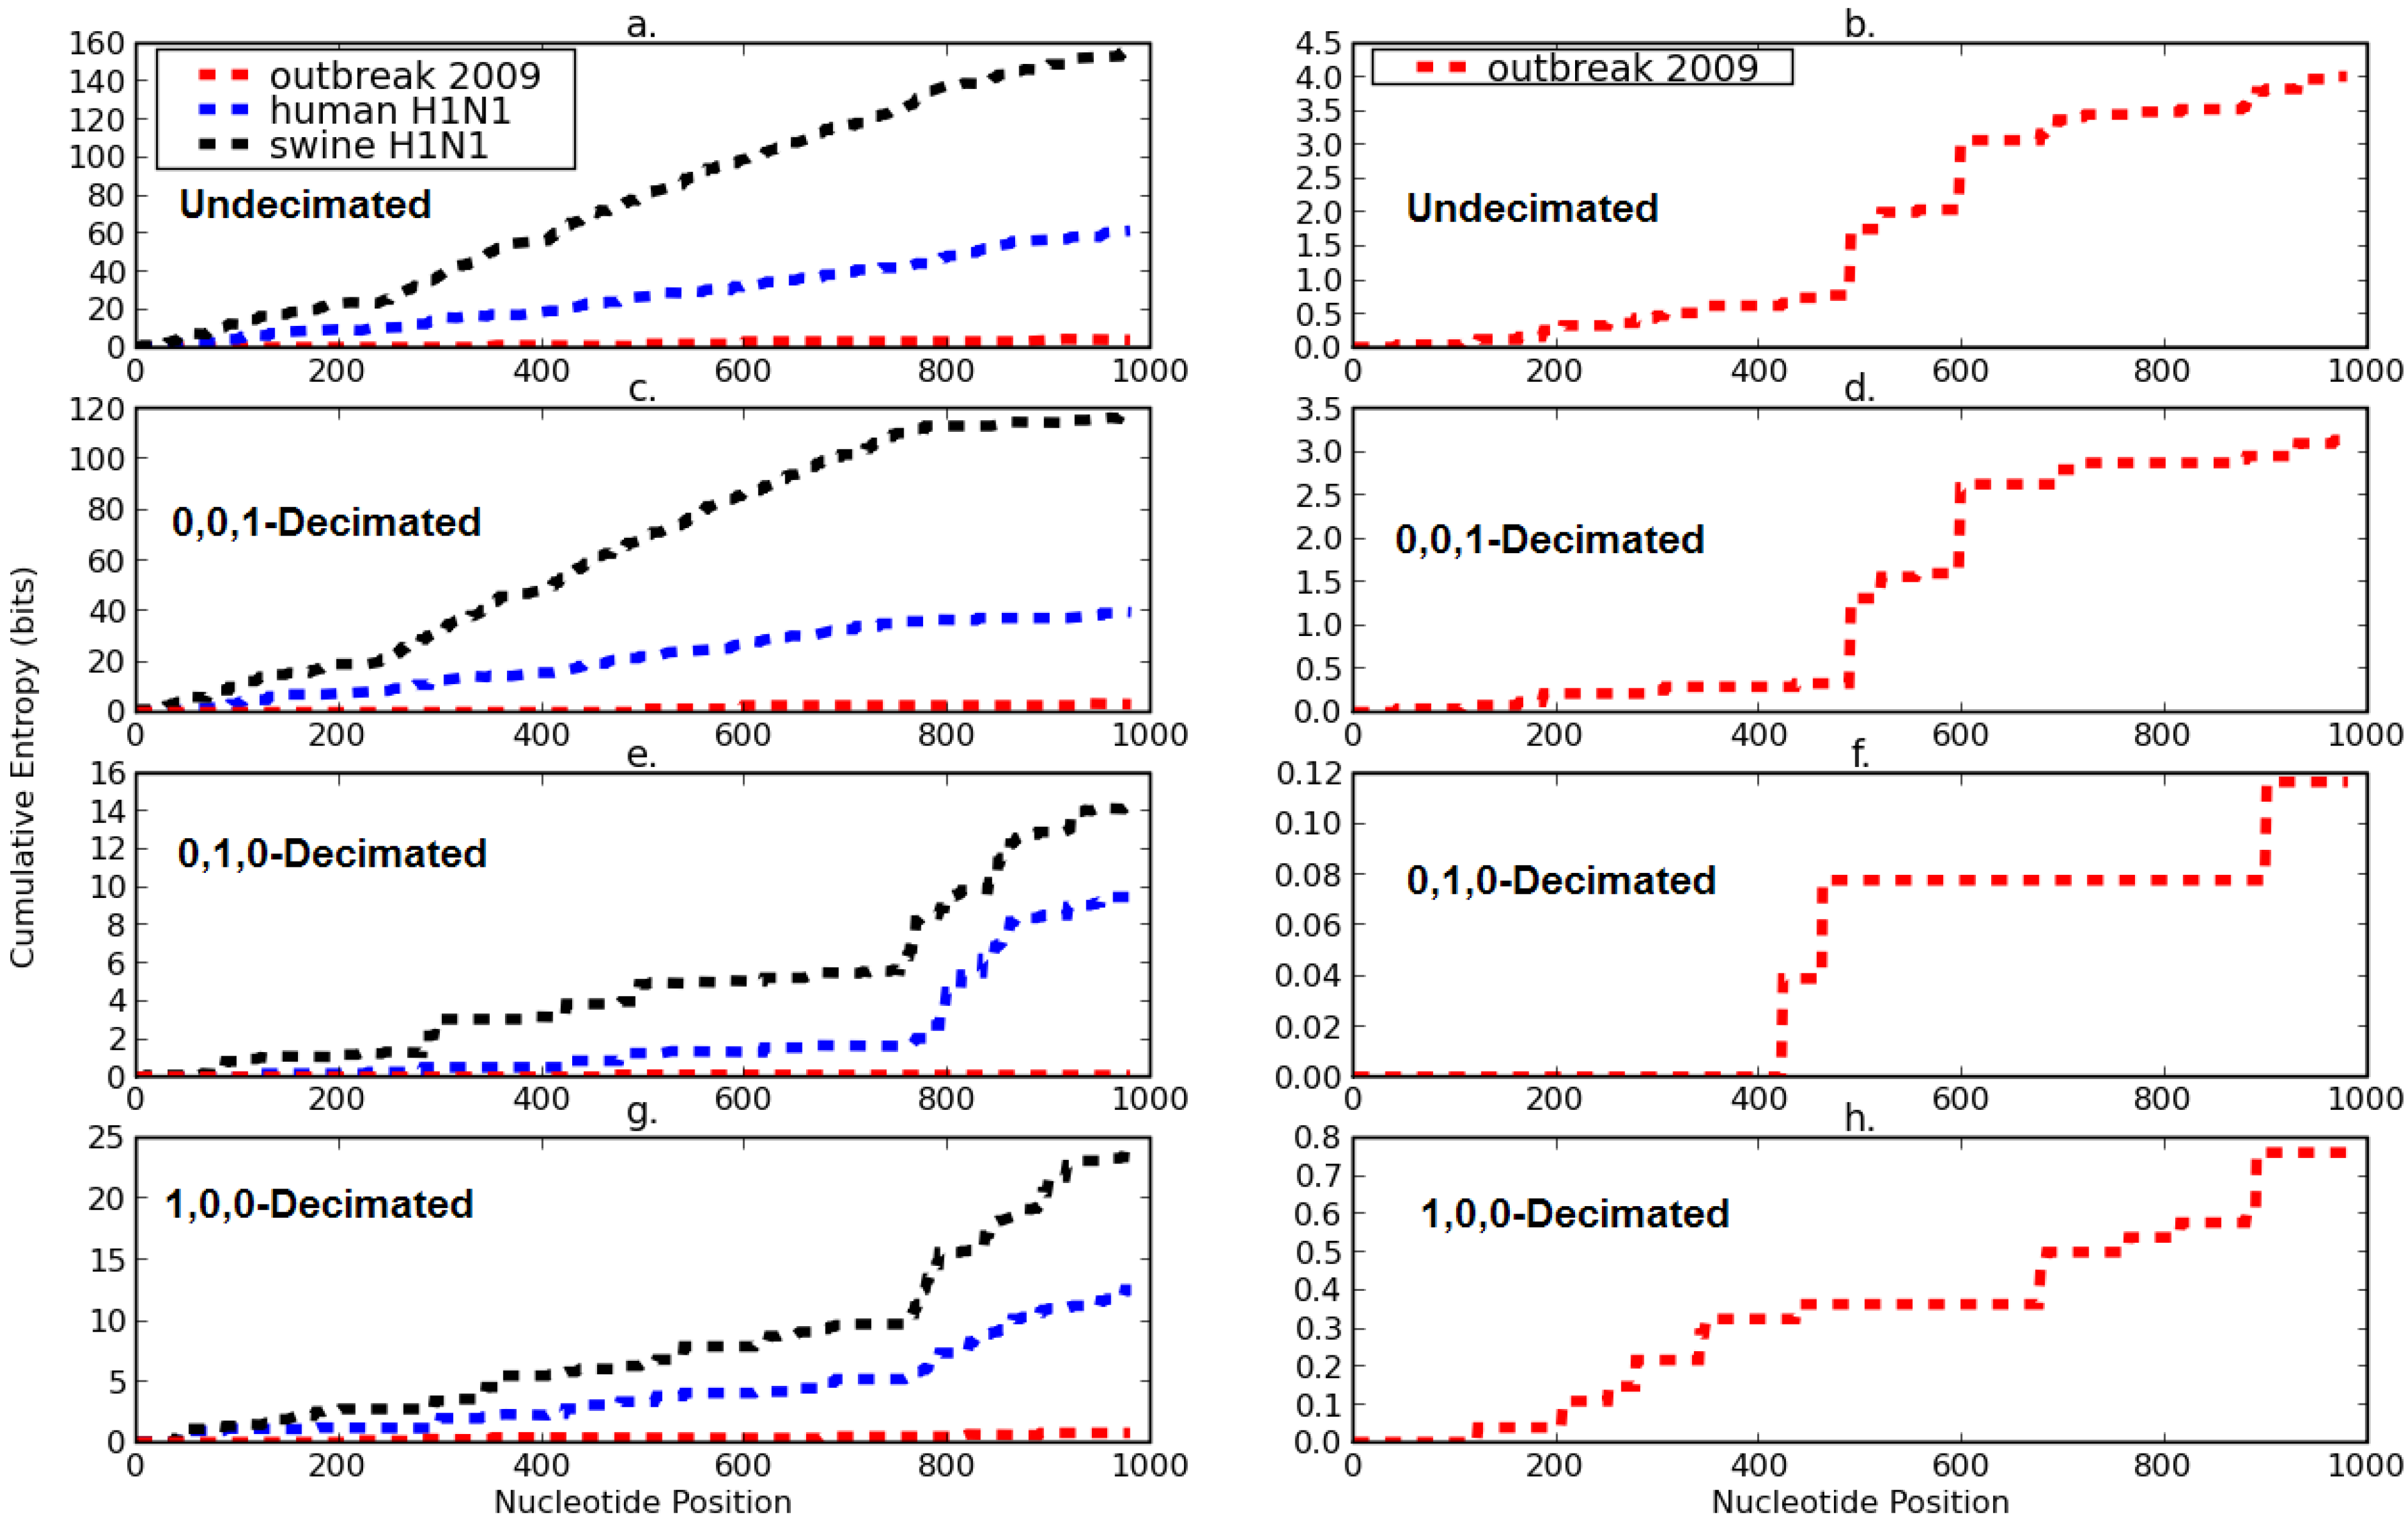
2.1.4. Spring 2009 swine flu pandemic

Decimated and undecimated cumulative entropy distributions for a set of H1N1 segment 7 sequences obtained world-wide from patients during the current swine flu outbreak pandemic were compared with corresponding distributions obtained for archival H1N1 human and swine segment 7 sequences (Figure 4). The total cumulative sum of entropy for the pandemic segment 7 sequences was only 2.6% of the corresponding sum for swine H1N1 and 6.5% of the corresponding sum for human H1N1 sequences. The decimated entropy curves obtained from pandemic sequences differed in magnitude and shape from those obtained for archival human and swine H1N1 (Figure 4c–h).
0,1,0-Decimation revealed two positions of non-synonymmous mutation in the M1 gene of segment 7 from the pandemic sequences (Figure 4f). The first of these mutations was a C=>U transition at nucleotide position 425; the second was a C=>U transition at nucleotide position 464. Each of these mutations, in the second codon position, converts a GCU codon to a GUU, with a corresponding change of encoded amino acid from ALA to VAL. Each non-synonymous mutation occurred only in a single sequence in the dataset and no positve correlation was observed between these mutations. Synonymous mutations, observable only at the nucleotide level, were investigated next. Two positions of synonymous mutation occurred in the 0,0,1-decimation frame of the M1 gene (Figure 4d). The first of these mutations was a G=>A transition at position 492 in 100 of the 241 sequences (41.49%). This transition converted a CAG codon to CAA, with no change in encoded amino acid (GLN). The second synonymous mutation was another G=>A transition at position 600 that converted the CAG codon to CAA, without change of encoded amino acid. Of the 141 sequences with G at position 492, 135 also had G at position 600 (95.74%). Of the 100 sequences with A at position 492, 99 also had A at position 600 (99.00%). Thus, in contrast to the amino acid substitutions detected by 0,1,0-decimation, there was a correlation between these synonymous mutations, with a probability of only 0.0004 for no correlation.
Figure 4. Cumulative sums of H1N1 segment 7 entropy vectors. Data are shown for human H1N1 isolated during the spring 2009 pandemic, for human H1N1 (1918 to 2008) and for H1N1 influenza viruses isolated from swine (1930 to 2009).
Entropy 11 00351 g004

2.2. Discussion

Influenza A virus is not only medically significant, but it provides the opportunity to test the ability of this new approach to help determine rules governing information entropy distribution in a relatively simple and exceptionally well-documented biological system. Decimation of entropy vectors of influenza A segment 7 reveals patterns of organization and distribution that are not apparent in the original, undecimated entropy vector (Figure 2, Figure 3 and Figure 4). Decimation showed that 65% of the total entropy accumulation in segment 7 occurred at wobble positions [5] of M1 gene codons. The sum of the decimated vectors equaled that of the undecimated vector and all linear correlation coefficients obtained for entropy distribution curves in this study were greater than 0.90, with p values that were indistinguishable from zero.
An inflection in the entropy distribution curves, near position 700 and present only in the decimated data (Figure 2, Figure 3 and Figure 4), is probably associated with the frame-shifted M2 gene, which begins at position 715 [6]. Another inflection, near nucleotide position 245 is discernible in both decimated and undecimated vectors. These characteristic distribution patterns of entropy were present in segment 7 sequences from both pooled and from individual influenza subtypes (Figure 2 and Figure 3) but different patterns were obtained for sequences isolated, so far, from patients during the current (2009) outbreak/pandemic of H1N1 swine flu (Figure 4). The total, cumulative entropy of sequences isolated from the outbreak was only a small percentage (3–6%) of that of other H1N1 segment 7 sequence sets (Results and Figure 4). This suggests either that (1) the H1N1 swine flu viruses causing the outbreak have convergently evolved to their current low entropy state or that, more likely, (2) not enough time has yet elapsed for the pattern and magnitude of entropy distribution of the pandemic virus to reach that of the other H1N1 populations.
Information entropy is a computationally convenient parameter for characterization of archival and emerging influenza populations. We have previously reported that influenza A segment 7 entropy is correlated with the biological characteristics of viral subtype and host specificity [7]. The small rate of entropy accumulation in segment 7 between nucleotide positions 1 and 245 in all influenza subtypes studied, in both decimated and undecimated data, (Figure 3), shows a high degree of conservation in the first 25% of segment 7. This region of segment 7 encodes a portion of the M1 protein that functions as an interface for protein-protein interactions [8]. Moreover, synonymous mutations in this region, primarily in the third, wobble, positions, have been shown to be constrained by adverse effects of those mutations on the assembly and packaging of the virus [9]. The low entropy accumulation at all three codon positions along the first 25% of segment 7, revealed by the three frames of decimation, may thus be a sign of regulation at both the protein and RNA levels to conserve important viral functions.
In this paper, decimation of entropy vectors was used to analyze variation at the RNA nucleotide level. Analysis of entropy in the third codon position by 0,0,1-decimation detected correlated synonymous variation of nucleotides (Figure 4d and Results). Correlated synonymous variation of nucleotides reflects genetic organization that is invisible at the amino acid level. These results demonstrate how decimation of entropy can be a useful computational tool for helping to unravel the levels of information encoded in nucleotide sequences [10,11].

3. Experimental Section

3.1. Information Entropy

Information entropy [4] of the segment 7 sequences was computed as:
H = b { Ω } p b l o g 2 ( 1 p b )
where H is the information entropy at each nucleotide position of segment 7 and Ω={A,T,C,G}. All computations were performed with Python 2.5.2 (http://www.python.org) with SciPy 0.6.0 [12]. and Numpy 1.0.4.

3.2. Decimative Array Multiplication

In accord with the periodicity results in Figure 1, the data sampling rate was reduced by a factor of three by sampling every third nucleotide position throughout the entire 982 position length of the segment 7 entropy vector. Decrease in sampling rate is referred to as “decimation” in digital signal processing [1]. The decimation in this study was performed by array multiplication in order to maintain the correct alignment with respect to nucleotide position number. To perform the decimation, entropy vectors were represented as Numpy arrays and array-multiplied, i.e., element-by-element, by one of the following 982 element 1D-arrays:
array001 = [0, 0, 1, 0, 0, 1, 0, 0, 1, 0, 0, 1, … 0]
array010 = [0, 1, 0, 0, 1, 0, 0, 1, 0, 0, 1, 0, … 0]
array100 = [1, 0, 0, 1, 0, 0, 1, 0, 0, 1, 0, 0, … 1]
In the work presented here, decimation produced by multiplication by array001 is designated 0,0,1-decimation, decimation by array010 is designated 0,1,0-decimation and decimation by multiplication by array100 is designated 1, 0, 0-decimation.

3.3. Linear Regression

Straight lines were fit by regression to the 982 values of the entire cumulative entropy vector for the combined, pooled subtypes. In addition, each decimated vector was divided into three segments at inflection points and straight lines were fit by regression to the regions between the inflection points. The resulting system of straight lines used to describe the data is shown below as Equation 2:
σ 001 = m 1 n = 1 245 σ n 001   +   m 2 n = 246 700 σ n 001   +   m 3 n = 701 982 σ n 001
σ 010 = m 4 n = 1 245 σ n 010   +   m 5 n = 246 700 σ n 010   +   m 6 n = 701 982 σ n 010
σ 100 = m 7 n = 1 245 σ n 100   +   m 8 n = 246 700 σ n 100   +   m 9 n = 701 982 σ n 100
where σ is the cumulative sum of the entropy, n = nucleotide position, s → {001, 010, 100} and m1, m2 m3…m9 are the slopes of the regression lines.

3.4. The Influenza Sequences

The entire set of 6,156 influenza A segment 7 full-length sequences in FASTA format was downloaded from the NCBI Influenza Resource database [13] on 01/31/2009. Influenza subtypes were identified in the dataset and segment 7 sequences of those subtypes represented by at least 100 sequences were separated from the rest. The dataset was edited by removing alternatively spliced sequences, sequences with non-synonymous mutations in the MSLLTEVET initial peptide region and sequences with unidentified nucleotides. A total of 5,175 segment 7 sequences from nine subtypes were separated and were pooled by combining into a single file and were also assigned to subtype-specific files. The specific influenza A subtype sequences analyzed and the subtype-specific number of segment 7 sequences (in parenthesis) in the final dataset were: H1N1 (1,122), H2N2 (99), H3N2 (2,199), H3N8 (155), H5N1 (815), H5N2 (117), H6N1 (145), H7N2 (225) and H9N2 (298). In all of these subtypes, more than 98% of the sequences present in the original, unedited download were used.
Segment 7 sequences from H1N1 viruses isolated from 247 human patients between April 27 and June 20 of the 2009 swine flu outbreak were downloaded from the NCBI database. Of the 247 downloaded sequences, 241 (97.57%) were satisfactory for analysis. One hundred seventy four (174) segment 7 sequences from H1N1 viruses isolated from swine between 1930 and 2009 were downloaded on June 20, 2009. All 174 sequences were satisfactory. Nine hundred and fifty five (955) segment 7 sequences from H1N1 viruses isolated from humans between 1918 and December 31, 2008 were downloaded, of which 954 were used in this study.

4. Conclusions

Decimation and cumulative summing of information entropy vectors produce a visually useful and computationally convenient parameter for characterizing genetic nucleotide sequences. To our knowledge, this is the first use of decimation with cumulation in any study of information entropy distribution and is the first use of Fourier transform for the analysis of information entropy distribution in any biological system. As applied here, decimation does not involve a digital filter, i.e., a convolution step and the sum of the decimated vectors equals that of the undecimated vector. In this study, decimation was able to reveal patterns of entropy accumulation in archival and emerging pandemic influenza segment 7 sequences that were not apparent in the complete, undecimated data. The low entropy accumulation along the first 25% of segment 7, revealed by the three frames of decimation, may be a sign of regulation at both the protein and RNA levels to conserve important viral functions. Because of its dependence upon the periodicity of the codon, the decimative procedure should be generalizable to any biological system.

Acknowledgements

This research is supported by the United States National Institutes of Health grant 2P20-RR01-5578-06. The authors thank the Brown University Center for Computation and Visualization for providing ancillary resources.

References

  1. Smith, S.W. Analog-to-Digital Conversion and Digital-to-Analog Conversion. In The Scientist and Engineer’s Guide to Digital Signal Processing; California Technical Publishing: San Diego, CA, USA, 1997; Chapter 3; Available online: http://www.dspguide.com/pdfbook.htm (accessed July 31, 2009).
  2. Murray, P.R.; Rosenthal, K.S.; Pfaller, M.A. Orthomyxoviruses. In Medical Microbiology, 6th ed.; Mosby: Maryland Heights, MO, 2008; pp. 583–592. [Google Scholar]
  3. Garbarine, E.; Rosen, G. The Effects of CG Content and Mutations on the Fourier Transform Method for Periodicity. In Proceedings of IEEE Genomic Signal Processing and Statistics Workshop (GENSIPS), Phoenix, AZ, June 2008.
  4. Shannon, C.E. A Mathematical Theory of Communication. Bell Syst. Techn J. 1948, 27, 379–423, 623–656. [Google Scholar] [CrossRef]
  5. Crick, F.H.C. Codon-Anticodon Pairing: The Wobble Hypothesis. J. Mol. Biol. 1966, 19, 548–555. [Google Scholar] [CrossRef]
  6. Lamb, R.A.; Lai, C.J.; Choppin, P.W. Sequences of mRNAs Derived from Genome RNA Segment 7 of Influenza Virus: Colinear and Interrupted mRNAs Code for Overlapping Proteins. Proc. Natl. Acad. Sci. USA 1981, 78, 4170–4174. [Google Scholar] [CrossRef] [PubMed]
  7. Thompson, W.A.; Fan, S.; Weltman, J.K. Information Entropy of Influenza A Segment 7. Entropy 2008, 10, 736–744. [Google Scholar] [CrossRef]
  8. Harris, A.; Forouhar, F.; Qiu, S.; Sha, B.; Luo, M. The Crystal Structure of the Influenza Matrix Protein M1 at Neutral pH: M1-M1 Protein Interfaces Can Rotate in the Oligomeric Structures of M1. Virology 2001, 289, 34–44. [Google Scholar] [CrossRef] [PubMed]
  9. Gog, J.R.; Santos Afonso, E.D.; Dalton, R.M.; Leclercq, I.; Tiley, L.; Elton, D.; von Kirchbach, J.C.; Naffakh, N.; Escriou, N.; Digard, P. Codon Conservation in the Influenza A Virus Genome Defines RNA Packaging Signals. Nucleic Acids Res. 2007, 35, 1897–1907. [Google Scholar] [CrossRef] [PubMed]
  10. Kudla, G.; Murray, A.W.; Tollervey, D.; Plotkin, J.B. Coding-sequence Determinants of Gene Expression in Escherichia Coli. Science 2009, 324, 255–258. [Google Scholar] [CrossRef] [PubMed]
  11. Wang, Q.; Barr, I.; Guo, F.; Lee, C. Evidence of a Novel RNA Secondary Structure in the Coding Region of HIV-1 Pol Gene. RNA 2008, 14, 2478–2488. [Google Scholar] [CrossRef] [PubMed]
  12. Jones, E.; Oliphant, T.; Peterson, P. SciPy: Open Source Scientific Tools for Python. 2001. Available online: http://www.scipy.org (accessed July 31, 2009).
  13. Bao, Y.; Bolotov, P.; Dernovoy, D.; Kiryutin, B.; Zaslavsky, L.; Tatusova, T.; Ostell, J.; Lipman, D. The Influenza Virus Resource at the National Center for Biotechnology Information. J. Virol. 2008, 82, 596–601. [Google Scholar] [CrossRef] [PubMed]

