Article

Combined Effects of Pipe Diameter, Reynolds Number and Wall Heat Flux and on Flow, Heat Transfer and Second-Law Characteristics of Laminar-Transitional Micro-Pipe Flows

Department of Mechanical Engineering, University of Uludag, 16059 Gorukle, Bursa, Turkey
Submission received: 3 December 2009 / Revised: 16 February 2010 / Accepted: 21 February 2010 / Published: 9 March 2010
(This article belongs to the Special Issue Exergy: Analysis and Applications)

Abstract

:
Fluid flow, heat transfer and entropy generation characteristics of micro-pipes are investigated computationally by considering the simultaneous effects of pipe diameter, wall heat flux and Reynolds number in detail. Variable fluid property continuity, Navier-Stokes and energy equations are numerically handled for wide ranges of pipe diameter (d = 0.50–1.00 mm), wall heat flux ( q = 1000–2000 W/m2) and Reynolds number (Re = 1 – 2000), where the relative roughness is kept constant at ε/d = 0.001 in the complete set of the scenarios considered. Computations indicated slight shifts in velocity profiles from the laminar character at Re = 500 with the corresponding shape factor (H) and intermittency values (γ) of H = 3.293→3.275 and γ = 0.041→0.051 (d = 1.00→0.50 mm). Moreover, the onset of transition was determined to move down to Retra = 1,656, 1,607, 1,491, 1,341 and 1,272 at d = 1.00, 0.90, 0.75, 0.60 and 0.50 mm, respectively. The impacts of pipe diameter on friction mechanism and heat transfer rates are evaluated to become more significant at high Reynolds numbers, resulting in the rise of energy loss data at the identical conditions as well. In cases with low pipe diameter and high Reynolds number, wall heat flux is determined to promote the magnitude of local thermal entropy generation rates. Local Bejan numbers are inspected to rise with wall heat flux at high Reynolds numbers, indicating that the elevating role of wall heat flux on local thermal entropy generation is dominant to the suppressing function of Reynolds number on local thermal entropy generation. Cross-sectional total entropy generation is computed to be most influenced by pipe diameter at high wall heat flux and low Reynolds numbers.

1. Introduction

With the progress of scientific investigations on energy management by developing new power supervision strategies, aiming to increase efficiency values and to suppress power loss amounts, the focus on this research branch is mainly directed towards the design and integration of micro-systems in actual industrial processes. The simultaneous advance of scientific efforts and the related manufacturing technologies recently made it possible for the micro-flow applications to take part in various engineering fields such as heat exchangers [1], fuel cells [2], pumps [3] and even in gas turbines [4]. Showing parallelism, both research outputs and industrial feedback signified the importance of surface roughness in micro-pipe flows by associating the roughness based viscous effects on the development of velocity and temperature profiles, flow-transition activity, entropy generation and power loss rates. Thus, due to these scientific fundamentals and industrial necessities, a research study, focusing on the roles of surface roughness in micro-pipe flows, must be structured on the three main issues: (i) frictional activity and flow characteristics, (ii) heat transfer mechanism and (iii) second-law analysis.
The roles of surface roughness on the friction characteristics, flow behavior and transitional activity in micro-pipe flows have been in the agenda of several researchers and there exist several published experimental and numerical reports. The role of frictional activity on the early transition from laminar to turbulent flow and on the grow of surface friction with surface roughness was reported by Guo and Li [5]. Celata et al. [6] determined, for the micro-pipe diameter range of d < 100 μm with the non-dimensional roughness of ε* < 0.01, that friction factor tends to deviate from the Poiseuille law when Re > 1300, which can be attributed to the acceleration associated with compressibility effect. As energy conversion of near-wall microfluidic transport was numerically investigated for slip-flow conditions, including different channel aspect ratios, pressure coefficients and slip flow conditions, by Ogedengbe et al. [7], Engin et al. [8] studied wall roughness effects in microtube flows and evaluated considerable shifts from the conventional laminar flow theory. Laminar and transitional flow experiments in dimpled tubes were performed by Vicente et al. [9], who reported a relatively low transition Reynolds number of 1,400 where the roughness induced friction factors were 10% higher than those of the smooth tubes. In a similar work, Kandlikar et al. [10] studied surface roughness effects on pressure drop in circular small hydraulic diameter tubes, where the transition onset appeared at Reynolds number values much below 2,300. Wen et al. [11] experimentally investigated the augmentation of pressure drop characteristics due to different strip-type inserts in small tubes. As Koo and Kleinstreuer [12] numerically and experimentally studied the significance of viscous dissipation on the friction factor, the roles of surface roughness on viscous dissipation, increased friction factor values and the corresponding earlier transitional activity was expressed by Celata et al. [13,14]. Morini [15] handled the concept of viscous dissipation for various duct cross-section types, and pointed out the minimum Reynolds number for which viscous dissipation effects can not be neglected. A comprehensive review, on the interaction of surface roughness with frictional activity and momentum rates in microchannels, was carried out by Obot [16]. He reported that a wide collection of available literature identified the definition of microchannels with a hydraulic diameter of dh ≤ 1,000 μm (1 mm), moreover, the limiting Reynolds number for the onset of transition in smooth microchannels was above 1,000.
The role of surface roughness in thermal systems was also taken into consideration in recent studies; some dealt with the roughness definition and others focused on the heat transfer mechanism. Wang et al. [17] investigated the influence of two-dimensional roughness on laminar flow in microchannels between two parallel plates by applying the regular perturbation method. Sheikh et al. [18] developed a model to eliminate the discrepancy in the fouling measurements by characterizing fouling as a correlated random process. In a complementary work, the role of fouling on entropy generation, as compared to that for clean surface tubes, was studied by Sahin et al. [19]. Cao et al. [20] employed non-equilibrium molecular dynamics simulation to investigate the effect of the surface roughness on slip flow of gaseous argon. More comprehensive research comprised both flow and heat transfer characteristics driven by roughness, such as Wu and Cheng [6], who reported on the Nusselt number augmentations with surface roughness, Kandlikar et al. [10] findings on heat transfer manipulation due to roughness, Wen et al. [11] work on the effects of the imposed wall heat flux, mass flux and strip inserts on heat transfer rates in small diameter tubes, Koo and Kleinstreuer’s [12] evaluations on the temperature field with viscous dissipation, a review by Obot [16] indicating the variation of laminar Nusselt numbers with the square root of the Reynolds number and finally Ozalp’s [21,22] numerical compressible flow investigations for aerospace propulsion applications.
Since the essential concern of thermo-fluid based research studies is to generate a complete overview on the schematic efficiency features, second-law analysis recently became prominent due to its potential to describe the overall system performance. Kotas et al. [23] indicated that for calculating loss of exergy, or process irreversibility, an exergy balance or the Gouy-Stodola theorem can be used. Zimparov [24] reviewed passive heat transfer augmentation techniques for single-phase flows. The effects of the spanwise fin tube spacing on the second-law performance of wavy plate fin-and-tube heat exchangers were investigated by Lin and Lee [25]. Ratts and Raut [26] obtained optimal Reynolds numbers for single-phase, convective, fully developed internal laminar and turbulent flows with uniform heat flux, by employing the entropy generation minimization method. Entropy generation for a fully developed laminar viscous flow in a duct subjected to constant wall temperature was analytically studied by Sahin [27]. His computations not only show that temperature dependency of viscosity becomes essentially important in accurately determining the entropy generation, but also indicate that for low heat transfer conditions the entropy generation due to viscous friction becomes dominant. Rakshit and Balaji [28] reported the results of a numerical investigation of conjugate convection from a finned channel, where the vertical rectangular fins were mounted outside the horizontal channel. The effects of streamwise variation of fluid temperature and rib height to diameter ratio on the entropy production of a tubular heat exchanger with enhanced heat transfer surfaces were investigated by Zimparov [29]. In singly connected microchannels with finite temperature differences and fluid friction, Richardson et al. [30] seeked the optimum laminar flow regime based on second-law analysis. Ko [31] computationally carried out the thermal design of plate heat exchanger double-sine ducts, from the point of entropy generation and exergy utilization. Laminar forced convection and entropy generation in a helical coil with constant wall heat flux was also numerically investigated by Ko [32]. He suggested that the optimal Reynolds number is to be chosen according to the flow operating condition, for least thermal irreversibility and best exergy utilization
The past research categorized above clearly indicates the wide scientific prospects and the industrial importance and actuality of the micro-pipe flows with surface roughness. As the available literature designates, real-time operational and structural parameter ranges in micro-pipe flows are broad, which as a consequence significantly promotes the possible process and output scenarios due to the individual and combined parameter influences. Recently, Ozalp [33,34,35] computationally investigated the momentum transfer, heat transfer and second-law characteristics of air flow in a circular micro-pipe with a diameter of d = 1 mm. The analyses were carried out in the Reynolds number and non-dimensional surface roughness ranges of Re = 1–2,000, ε* = 0.001–0.05. The author continued his research by expanding the micro-pipe diameter and non-dimensional surface roughness limits to d = 0.10–1.00 mm and ε* = 0.001–0.1 for water flow; this content is recently supported by the Uludag University Research Fund. In the present article, the author reports the initial finding set of the ongoing project, comprising the first and second-law characteristics of roughness induced laminar-transitional micro-pipe flow, for the diameter range of d = 0.50–1.00 mm with the fixed non-dimensional surface roughness condition of ε* = 0.001. Radial velocity and temperature profiles, boundary layer parameters, friction coefficients, Nusselt numbers, frictional energy loss and temperature rise values are discussed to identify the flow and heat transfer characteristics. Additionally, second-law records are interpreted through radial profiles of thermal and frictional entropy values and cross-sectional total entropy generation rates and local and cross-sectional average Bejan numbers.

2. Theoretical Background

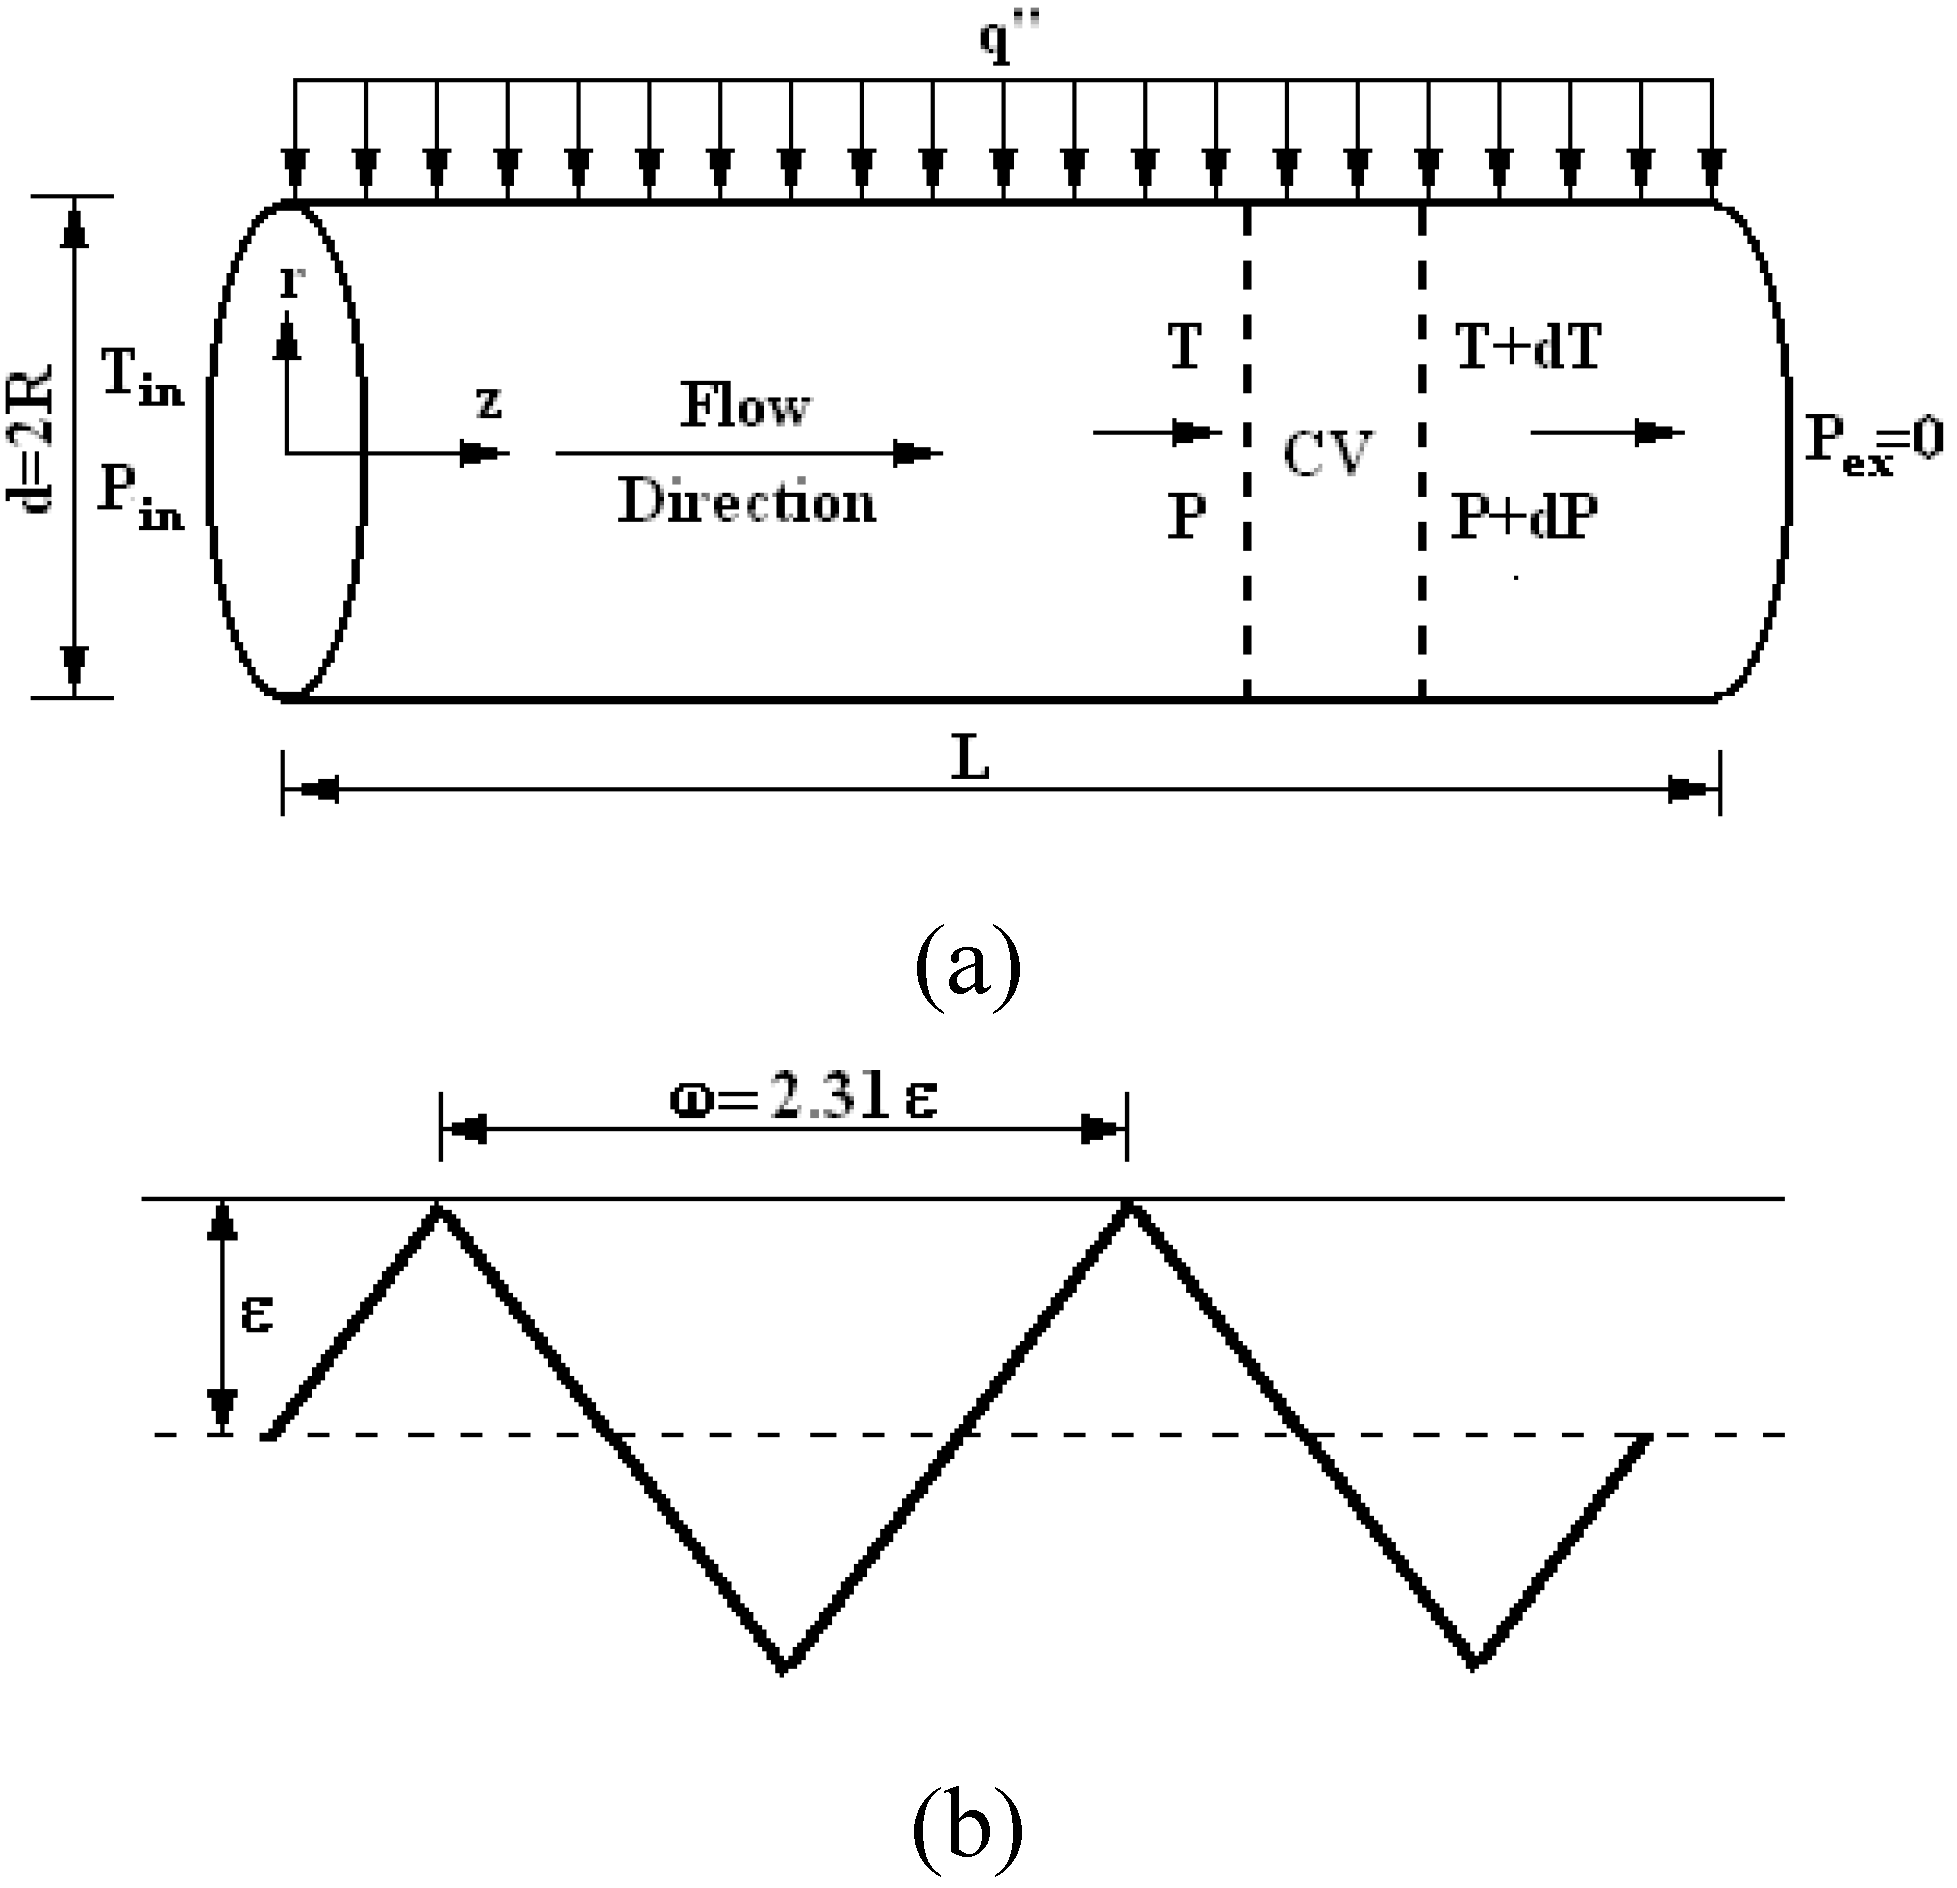
2.1. Micro-Pipe and Roughness

The diameter and length of the micro-pipe (Figure 1a) analyzed in the present paper, are given as d and L, respectively. The present roughness model is based on the triangular structure of Cao et al. [20] (Figure 1b), where the roughness amplitude is characterized by ε and period by ω. In all computations, the roughness periodicity parameter (ω’ = ω/ε) is kept fixed to ω’ = 2.31, which corresponds to the equilateral triangle structure (Cao et al. [20]).
Equation 1 numerically characterizes the model of Cao et al. [20] with the implementation of the amplitude and period. The model function (fε(z)) is repeated in the streamwise direction throughout the pipe length, where the Kronecker unit tensor (δi) attains the values of δI = +1 and –1 for 0 ≤ z ≤ 2.31 2 ε and 2.31 2 ε ≤ z ≤ 2.31 ε respectively.
f ε (z) = δ i ε [ 1 4 2.31 ε z ]
Figure 1. (a) Schematic view of micro-pipe, (b) triangular surface roughness distribution.
Entropy 12 00445 g001

2.2. Governing Equations

The density, dynamic and kinematic viscosity of water are defined with ρ, μ and ν (=μ/ρ); the average velocity of the flow at any cross-section of the duct is denoted by Uo. As the surface and mean flow temperatures are denoted by Ts and To, thermal conductivity and convective heat transfer coefficient are characterized by κf and h. Using these definitions, Reynolds number and Nusselt number are given by Equations 2a-b. Water has been selected as the working fluid in the present study, and it is well known that water properties like specific heat (Cp), kinematic viscosity (ν) and thermal conductivity (κf), are substantially dependent on temperature (Incropera and DeWitt [36]). To sensitively implement the property (ξ) variations with temperature into the calculations, the necessary water data of Incropera and De Witt [36] are fitted into 6th order polynomials, which can be presented in closed form by Equation 2c. The uncertainty of the fitted water data is less than 0.03% and the temperature dependency is indicated by the superscript T throughout the formulation.
Re = U o d ν T ρ U o d μ T   Nu = hd κ f T = T r | r = R d T s T o    ζ T = j = 0 6 a j T j
The problem considered here is steady ( t ) = 0 , fully developed and the flow direction is coaxial with pipe centerline ( U r = U θ = 0 ) , thus the velocity vector simplifies to V = U z ( r ) k ^ , denoting U z z = 0 and U z θ = 0 . These justifications are common in several recent numerical studies on roughness induced flow and heat transfer investigations, like those of Engin et al. [8], Koo and Kleinstreuer [12] and Cao et al. [20]. The flow boundary conditions are based on the facts that on the pipe wall no-slip condition and constant heat flux exist, and flow and thermal values are maximum at the centerline. As given in Figure 1a, , pressure and temperature values are known at the pipe inlet and the exit pressure is atmospheric. Denoting Uz=Uz(r) and T=T(r,z), the boundary conditions can be summarized as follows:
r = R + f ε ( Z )    →    U Z = 0    &   r = 0    →    U z r = 0 r = R + f ε ( Z )    →    T r = q r κ f T    &   r = 0    →    T r = 0 z = 0    →   P = P in , T = T in    &   z = L   →   P = 0 ( Manometric )
Since the viscous stress τzz is characterized by the variation of flow velocity in the axial direction ( U z / z ) , in an incompressible flow application with constant pipe diameter, it vanishes due to the unvarying local and cross-sectional average velocities in the flow direction. Thus, as the components of the viscous stress tensor (τrz) and heat flux terms ( q r , q z ) can be written as Equations 4a-c, internal and kinetic energy terms are defined as e = CpT and k = U z 2 /2, respectively.
τ rz = μ T U z r    q r = κ f T T r    q z = κ f T T z
Application of wall heat flux ( q ) on the lateral surface of the micro-pipe results in the total surface heat transfer of Qs = q πdL. With these problem definitions and above implementations for a laminar incompressible flow with variable fluid properties, continuity, momentum and energy equations are given as:
z ( U z ) = 0
P z = 1 r r ( r τ rz )
ρ U z z ( e + P ρ + k ) + 1 r r (rq r ) + q z z = τ rz U z r + U z [ 1 r r ( r τ rz ) ]
The cross-sectional average fluid velocity and temperature are obtained from
U o = 2 π r = 0 r = R U z (r) rdr π R 2    T o = 2 π r = 0 r = R U z (r)C p (r)T(r) rdr U o ( C p ) o π R 2
and the shear stress and mass flow rate are defined as
τ = C f 1 2 ρ U o 2 = μ T | dU z dr | r = R |    m . = ρ U o A = ρ 2 π r = 0 r = R U z (r) rdr
Gouy-Stodola theorem [23] considers the lost available work to be directly proportional to entropy generation, which results from the non-equilibrium phenomenon of exchange of energy and momentum within the fluid and at the solid boundaries. Due to the existence of the velocity and temperature gradients in the flow volume, the volumetric entropy generation rate is positive and finite. Computation of the temperature and the velocity fields through Equations 5–7 on the problem domain will produce the input data for Equation 10a. Equation 10a defines the local rate of entropy generation per unit volume ( S ) , for a one-dimensional flow and two-dimensional temperature domain for incompressible Newtonian fluid flow in cylindrical coordinates.
S = κ f T T 2 [ ( T r ) 2 + ( T z ) 2 ] + μ T T [ ( U z r ) 2 ]    S = S Δ T + S Δ P
S = 2 π r = 0 r = R S rdr    Be = S Δ T S   Be = 2 π r = 0 r = R Be rdr π R 2
As given in Equation 10b, the entropy generation due to finite temperature differences ( S Δ T ) in axial z and in radial r directions is defined by the first term on the right side of Equation 10a, the second term defines the frictional entropy generation ( S Δ P ) . Equation 11a stands for the cross-sectional total entropy generation rate; local and cross-sectional average values of Bejan numbers can be obtained by Equations 11b-c.

2.3. Computational Method

The author employed the present computational method in his former work [22,33,34,35] and detailed the essentials and the sub-steps of the procedure extensively. Thus, here only the fundamental issues of the methodological structure are defined. To simultaneous handle the continuity, momentum and energy mechanisms of the flow, Equations 5–7 are assembled into the three-dimensional “Transfer Matrix”, consisting of the converted explicit forms of the principle equations. The flow domain of Figure 1a is divided into m axial and n radial cells (m × n), where the fineness of the computational grids is examined to ensure that the obtained solutions are independent of the grid employed. After a series of successive runs the optimum axial and radial cell numbers are determined as m = 500→850 and n = 100→225 respectively, for d = 1.00→0.50 mm. Forward difference discretization is applied in the axial and radial directions in the two-dimensional marching procedure. To sensitively compute the velocity and temperature gradients on the pipe walls, the 20% of the radial region, neighboring solid wall, is employed an adaptive meshing with radial-mesh width aspect ratio of 1.1→1.05 (d = 1.00→0.50 mm). The influences of surface roughness and surface heat flux conditions, over the meshing intervals of the flow domain, are coupled by Direct Simulation Monte Carlo (DSMC) method. The author previously applied DMSC to compressible nozzle flow problems [21,22] and to micro-pipe flow scenarios with surface roughness [33,34,35]. The concept of triple transport conservation is as well incorporated into the DSMC, which makes it possible to sensitively evaluate the balance of heat swept from the micro-pipe walls, the energy transferred in the flow direction and also to perform accurate simulation for inlet/exit pressure boundaries. The “Transfer Matrix” scheme and the DSMC algorithm are supported by cell-by-cell transport tracing technique to guarantee mass conservation, boundary pressure matching and thermal equilibrium within the complete mesh. The resulting nonlinear system of equations is solved by using the Newton-Raphson method and in the case that the Reynolds number does not fit the required value, inlet pressure and temperature are both modified by DSMC, to regulate the Reynolds number of the former iteration step.

3. Results and Discussion

To generate a scientifically detailed and academically enlightening scheme for the combined effects of pipe diameter, Reynolds number and wall heat flux on the flow, heat transfer and second-law characteristics of laminar-transitional micro-pipe flows, computations are carried out in the ranges of d = 0.50–1.00 mm, Re = 1–2,000 and q = 1,000–2,000 W/m2. As the considered micro-pipe diameter range is consistent with the microchannel definition of Obot [16] (d ≤ 1.00 mm), the imposed wall heat flux values are decided in conjunction with the Reynolds number and the accompanying mass flow rate ranges, to bring about applicable and rational heating. The fixed parameters of the analyses are the length of the micro-pipe (L = 0.5 m), inlet temperature (Tin = 278 K) and exit pressure (Pex = 0 Pa) of water and the non-dimensional surface roughness (ε* = 0.001), which is in harmony with those of Engin et al. [8] (ε* ≤ 0.08), Sahin et al. [19] (ε* ≤ 0.25), Ozalp [33,34,35] (ε* = 0.001–0.05) and Vijayalakshmi et al. [37] (ε* = 0.0004–0.0018). Flow and heat transfer characteristics are presented in terms of radial velocity and temperature profiles, boundary layer parameters, friction coefficients, Nusselt numbers, frictional energy loss and temperature rise values. Radial profiles of thermal and frictional entropy values, cross-sectional total entropy generation rates and Bejan numbers are discussed and identified to interpret the second-law records.

3.1. Analyses of Flow and Heat Transfer Characteristics

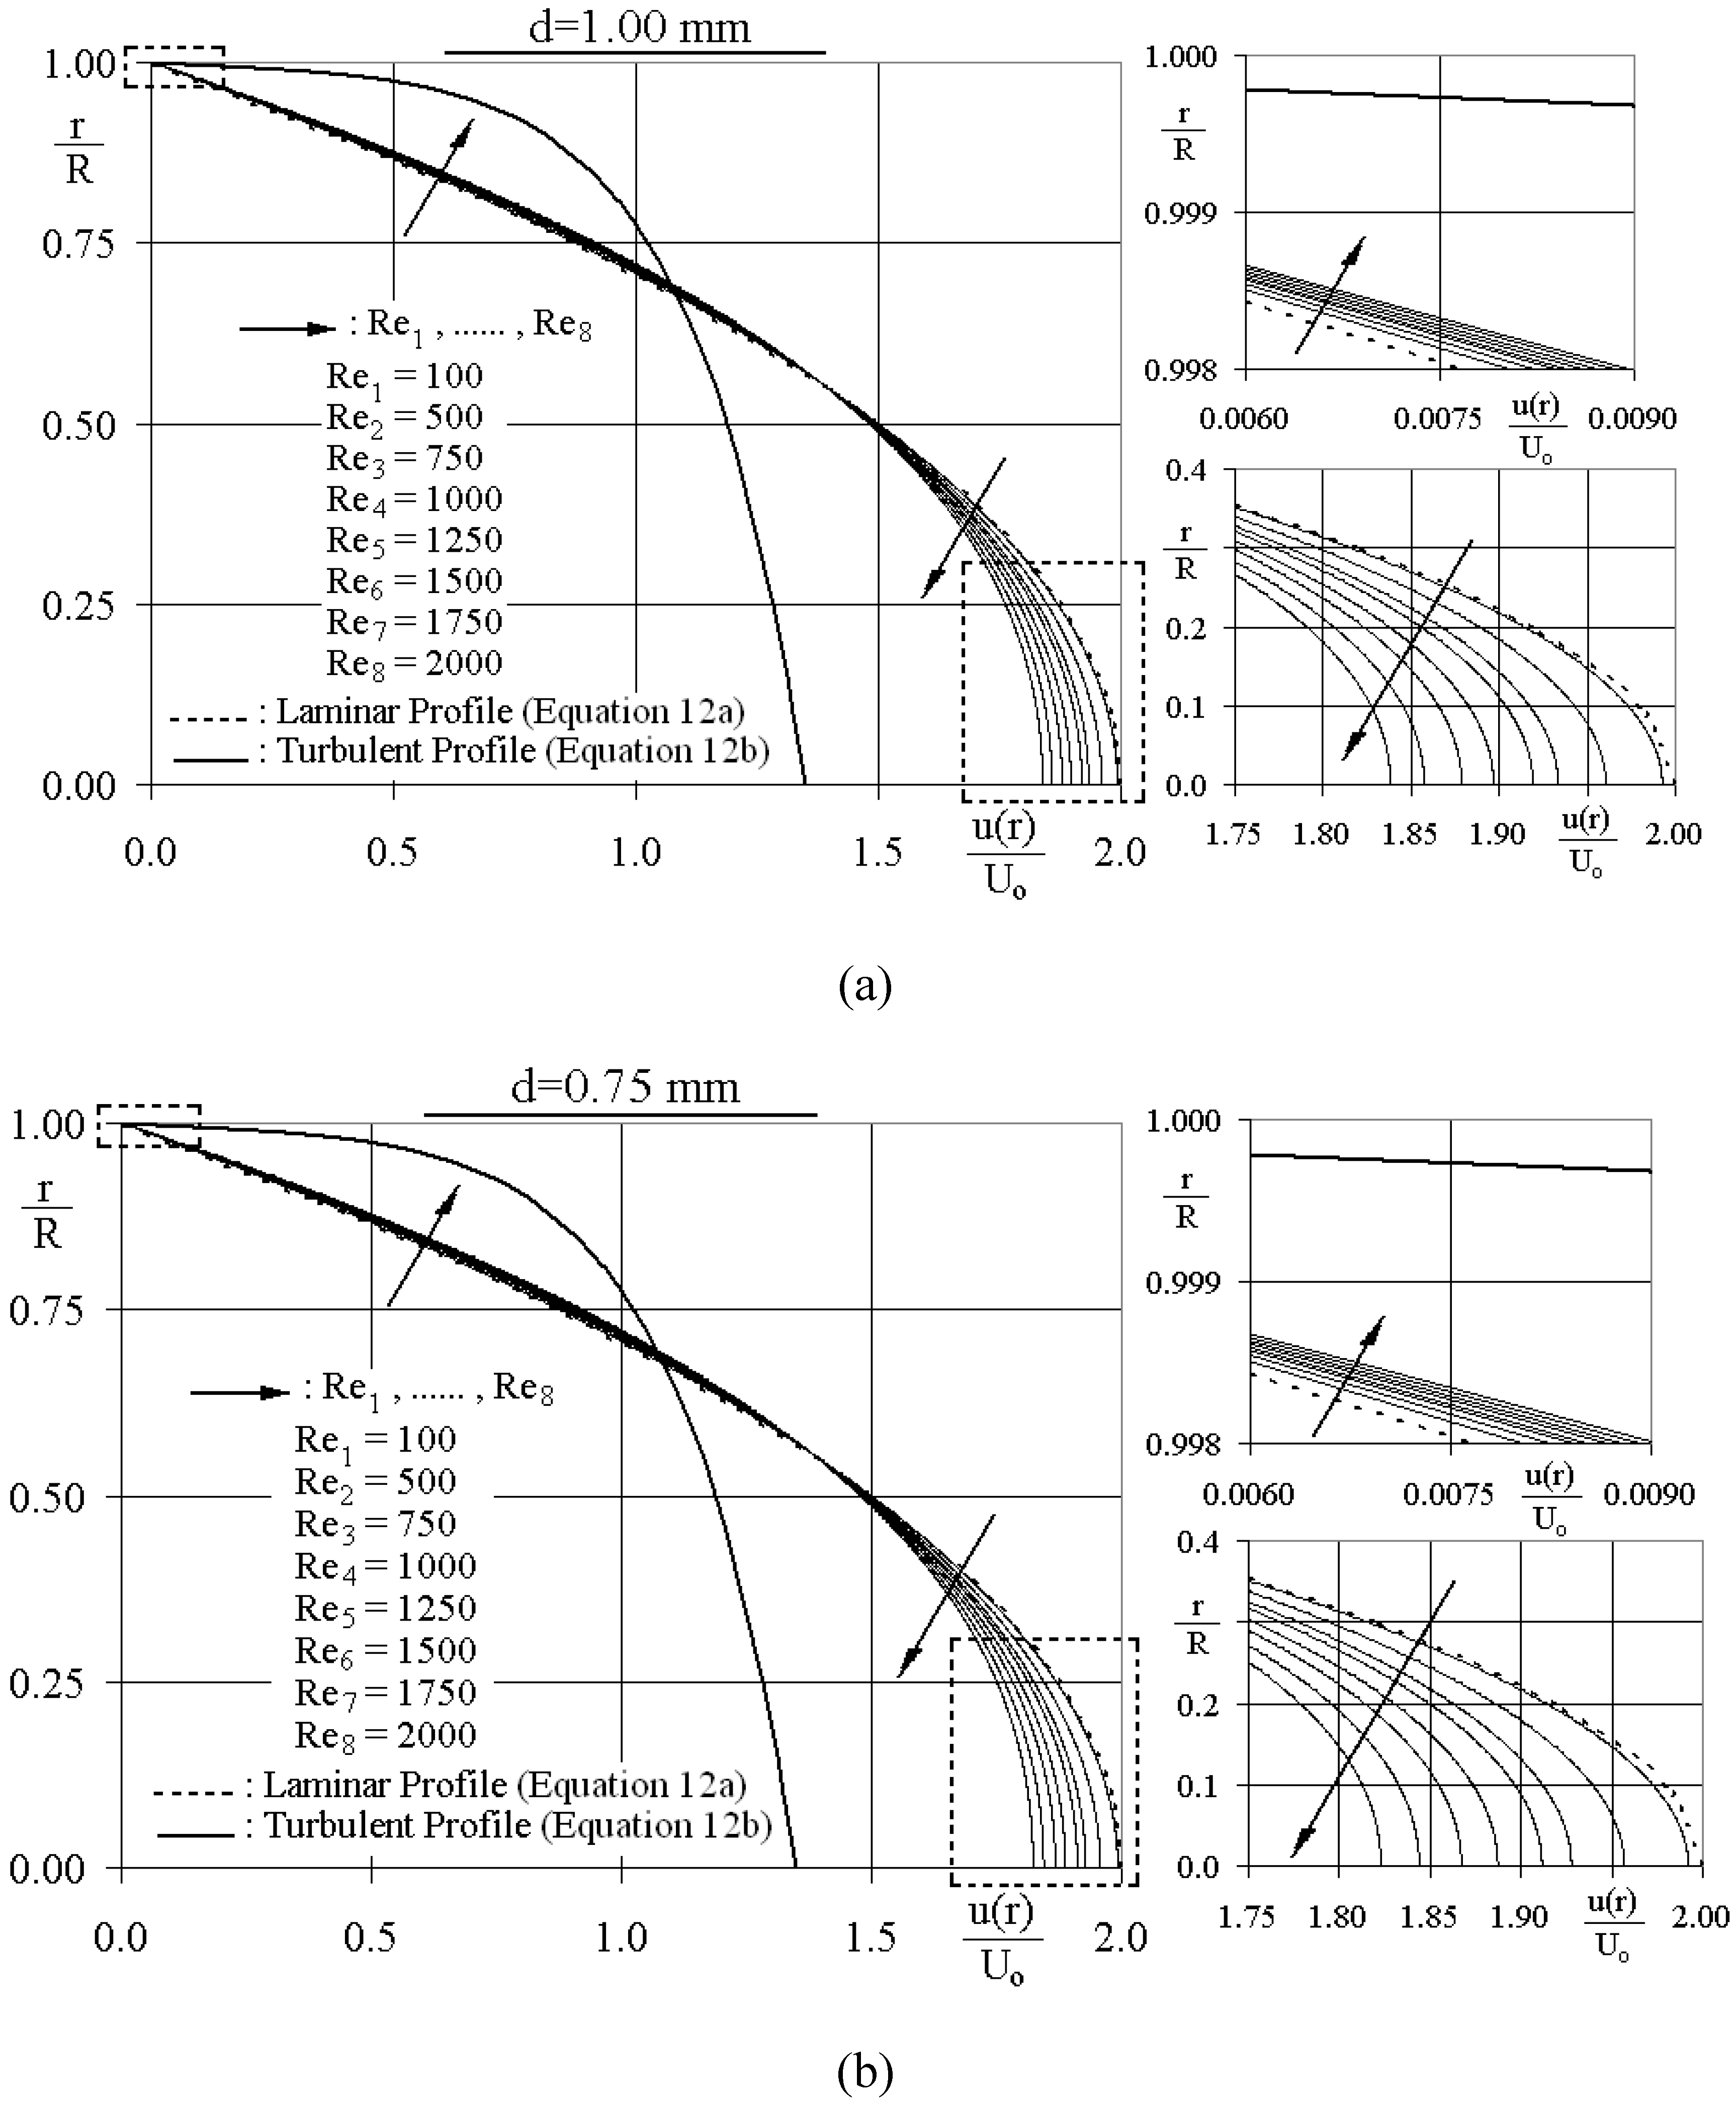
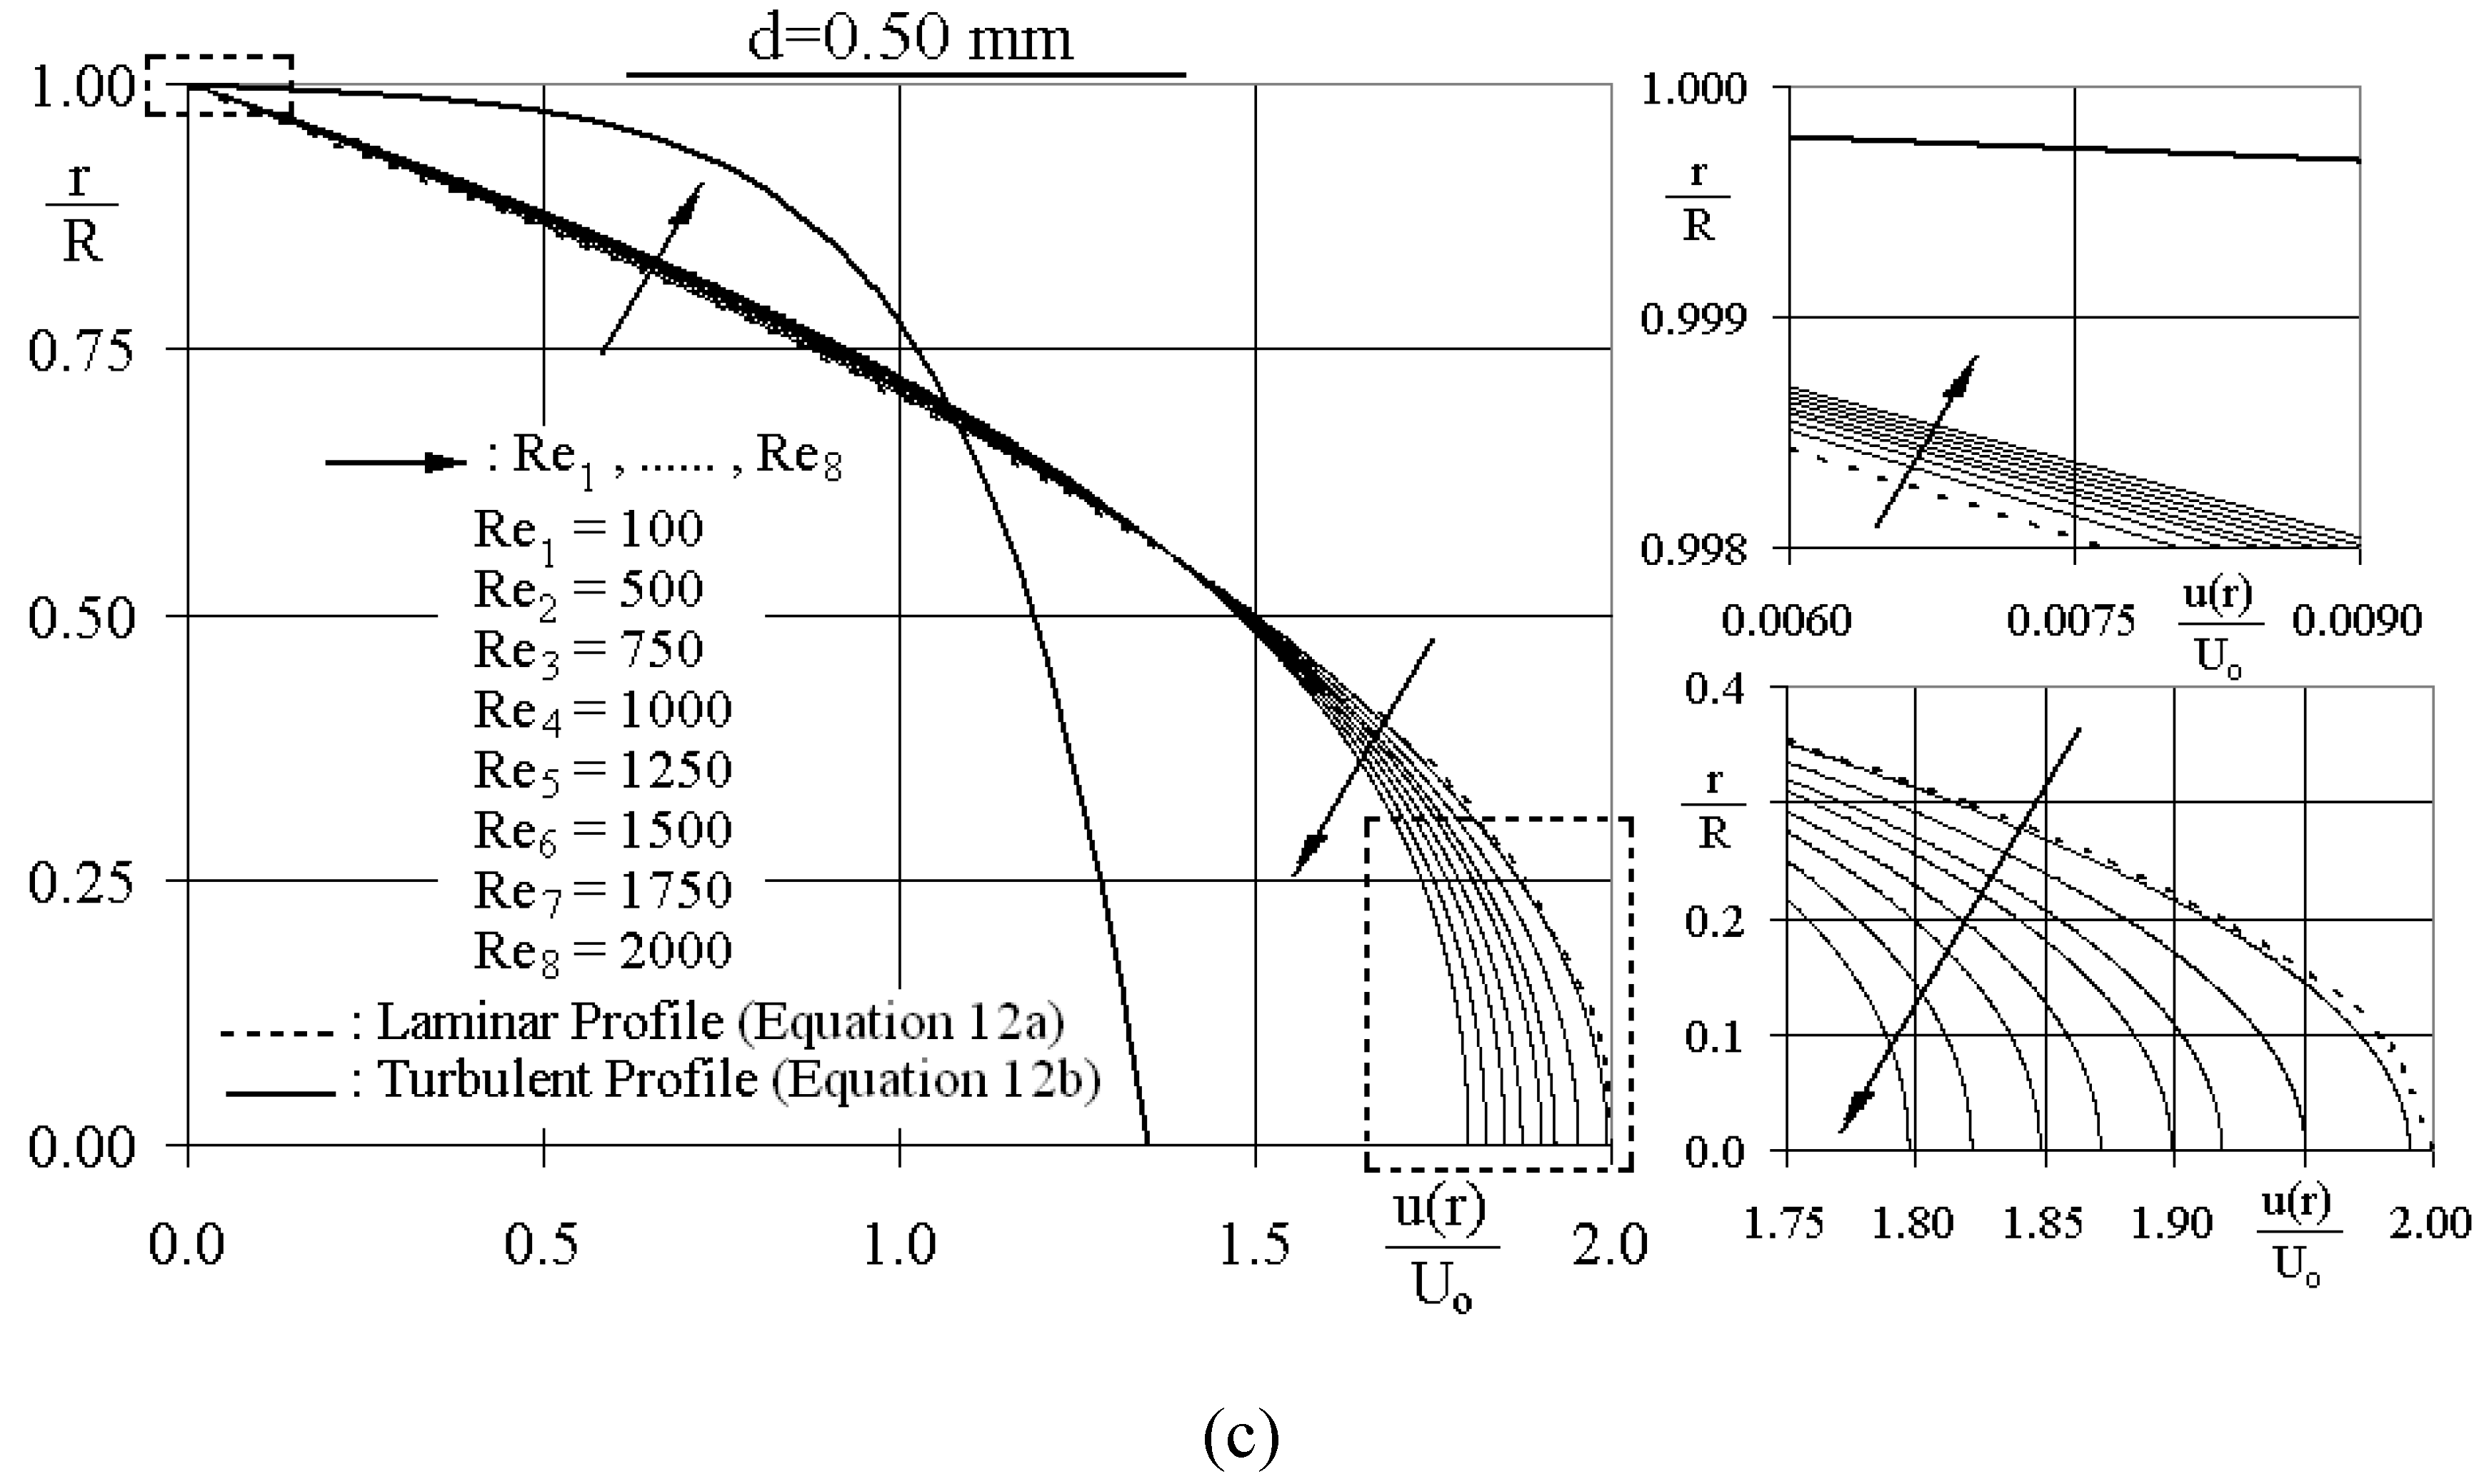
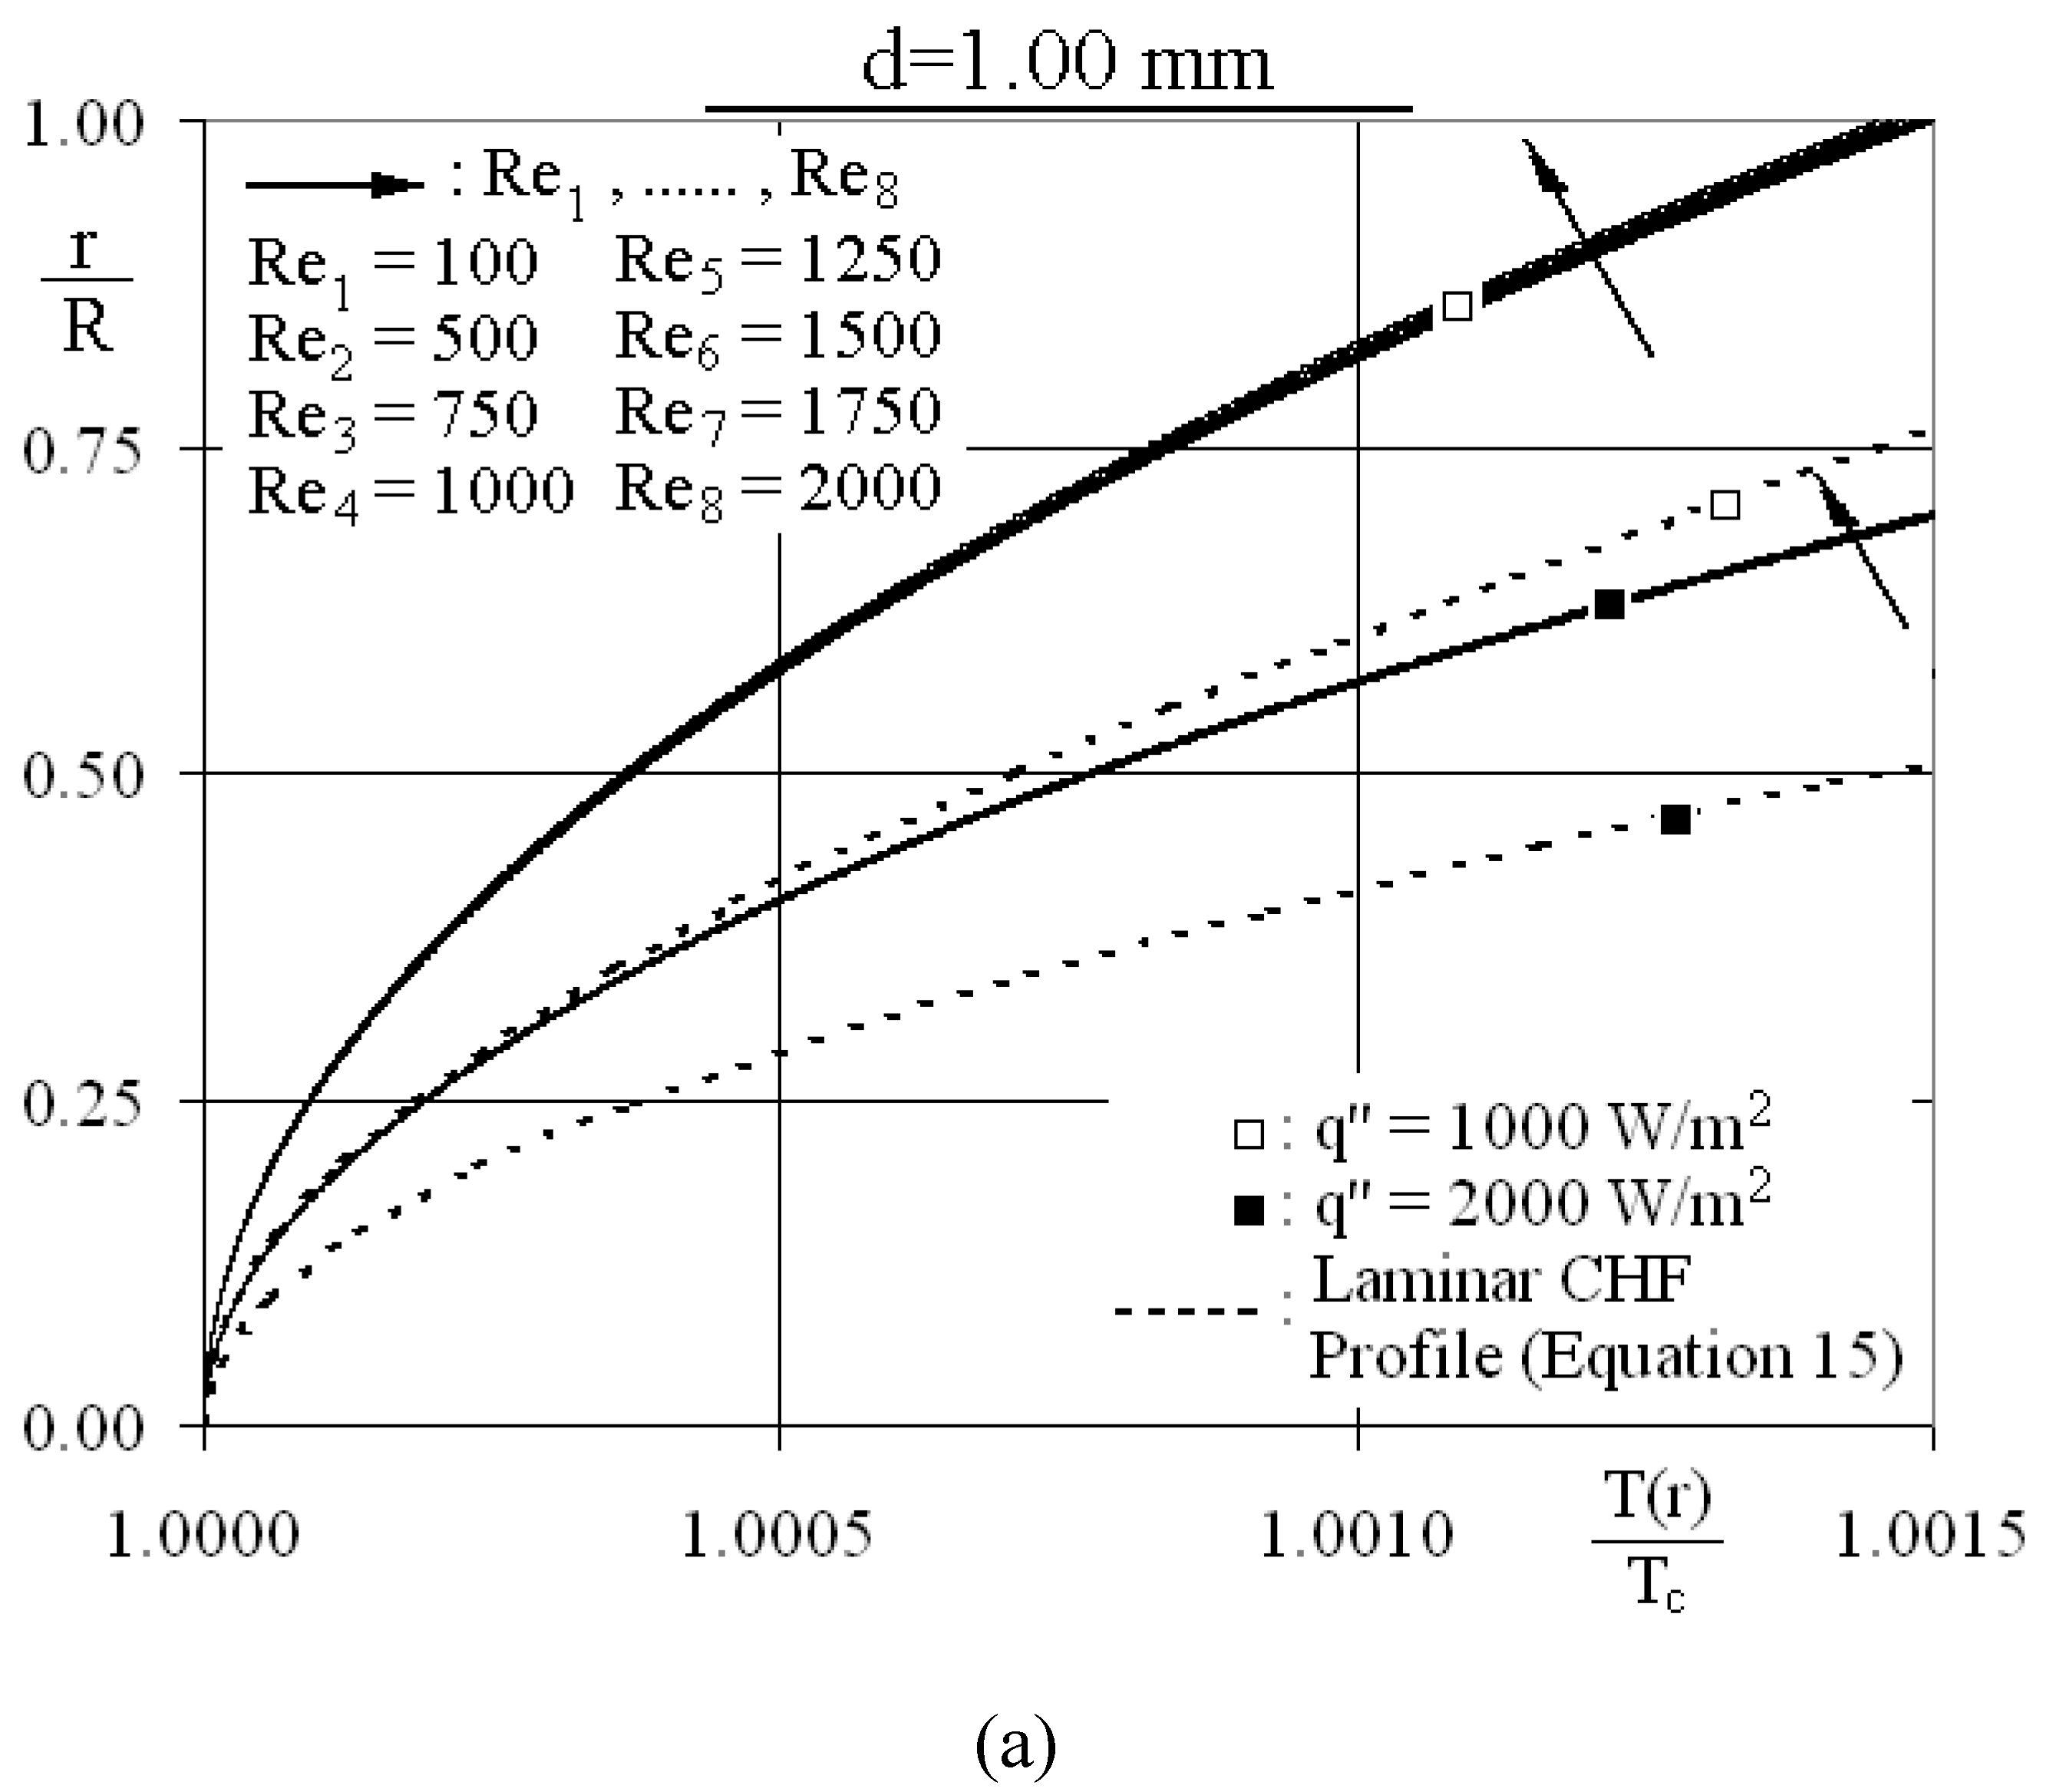
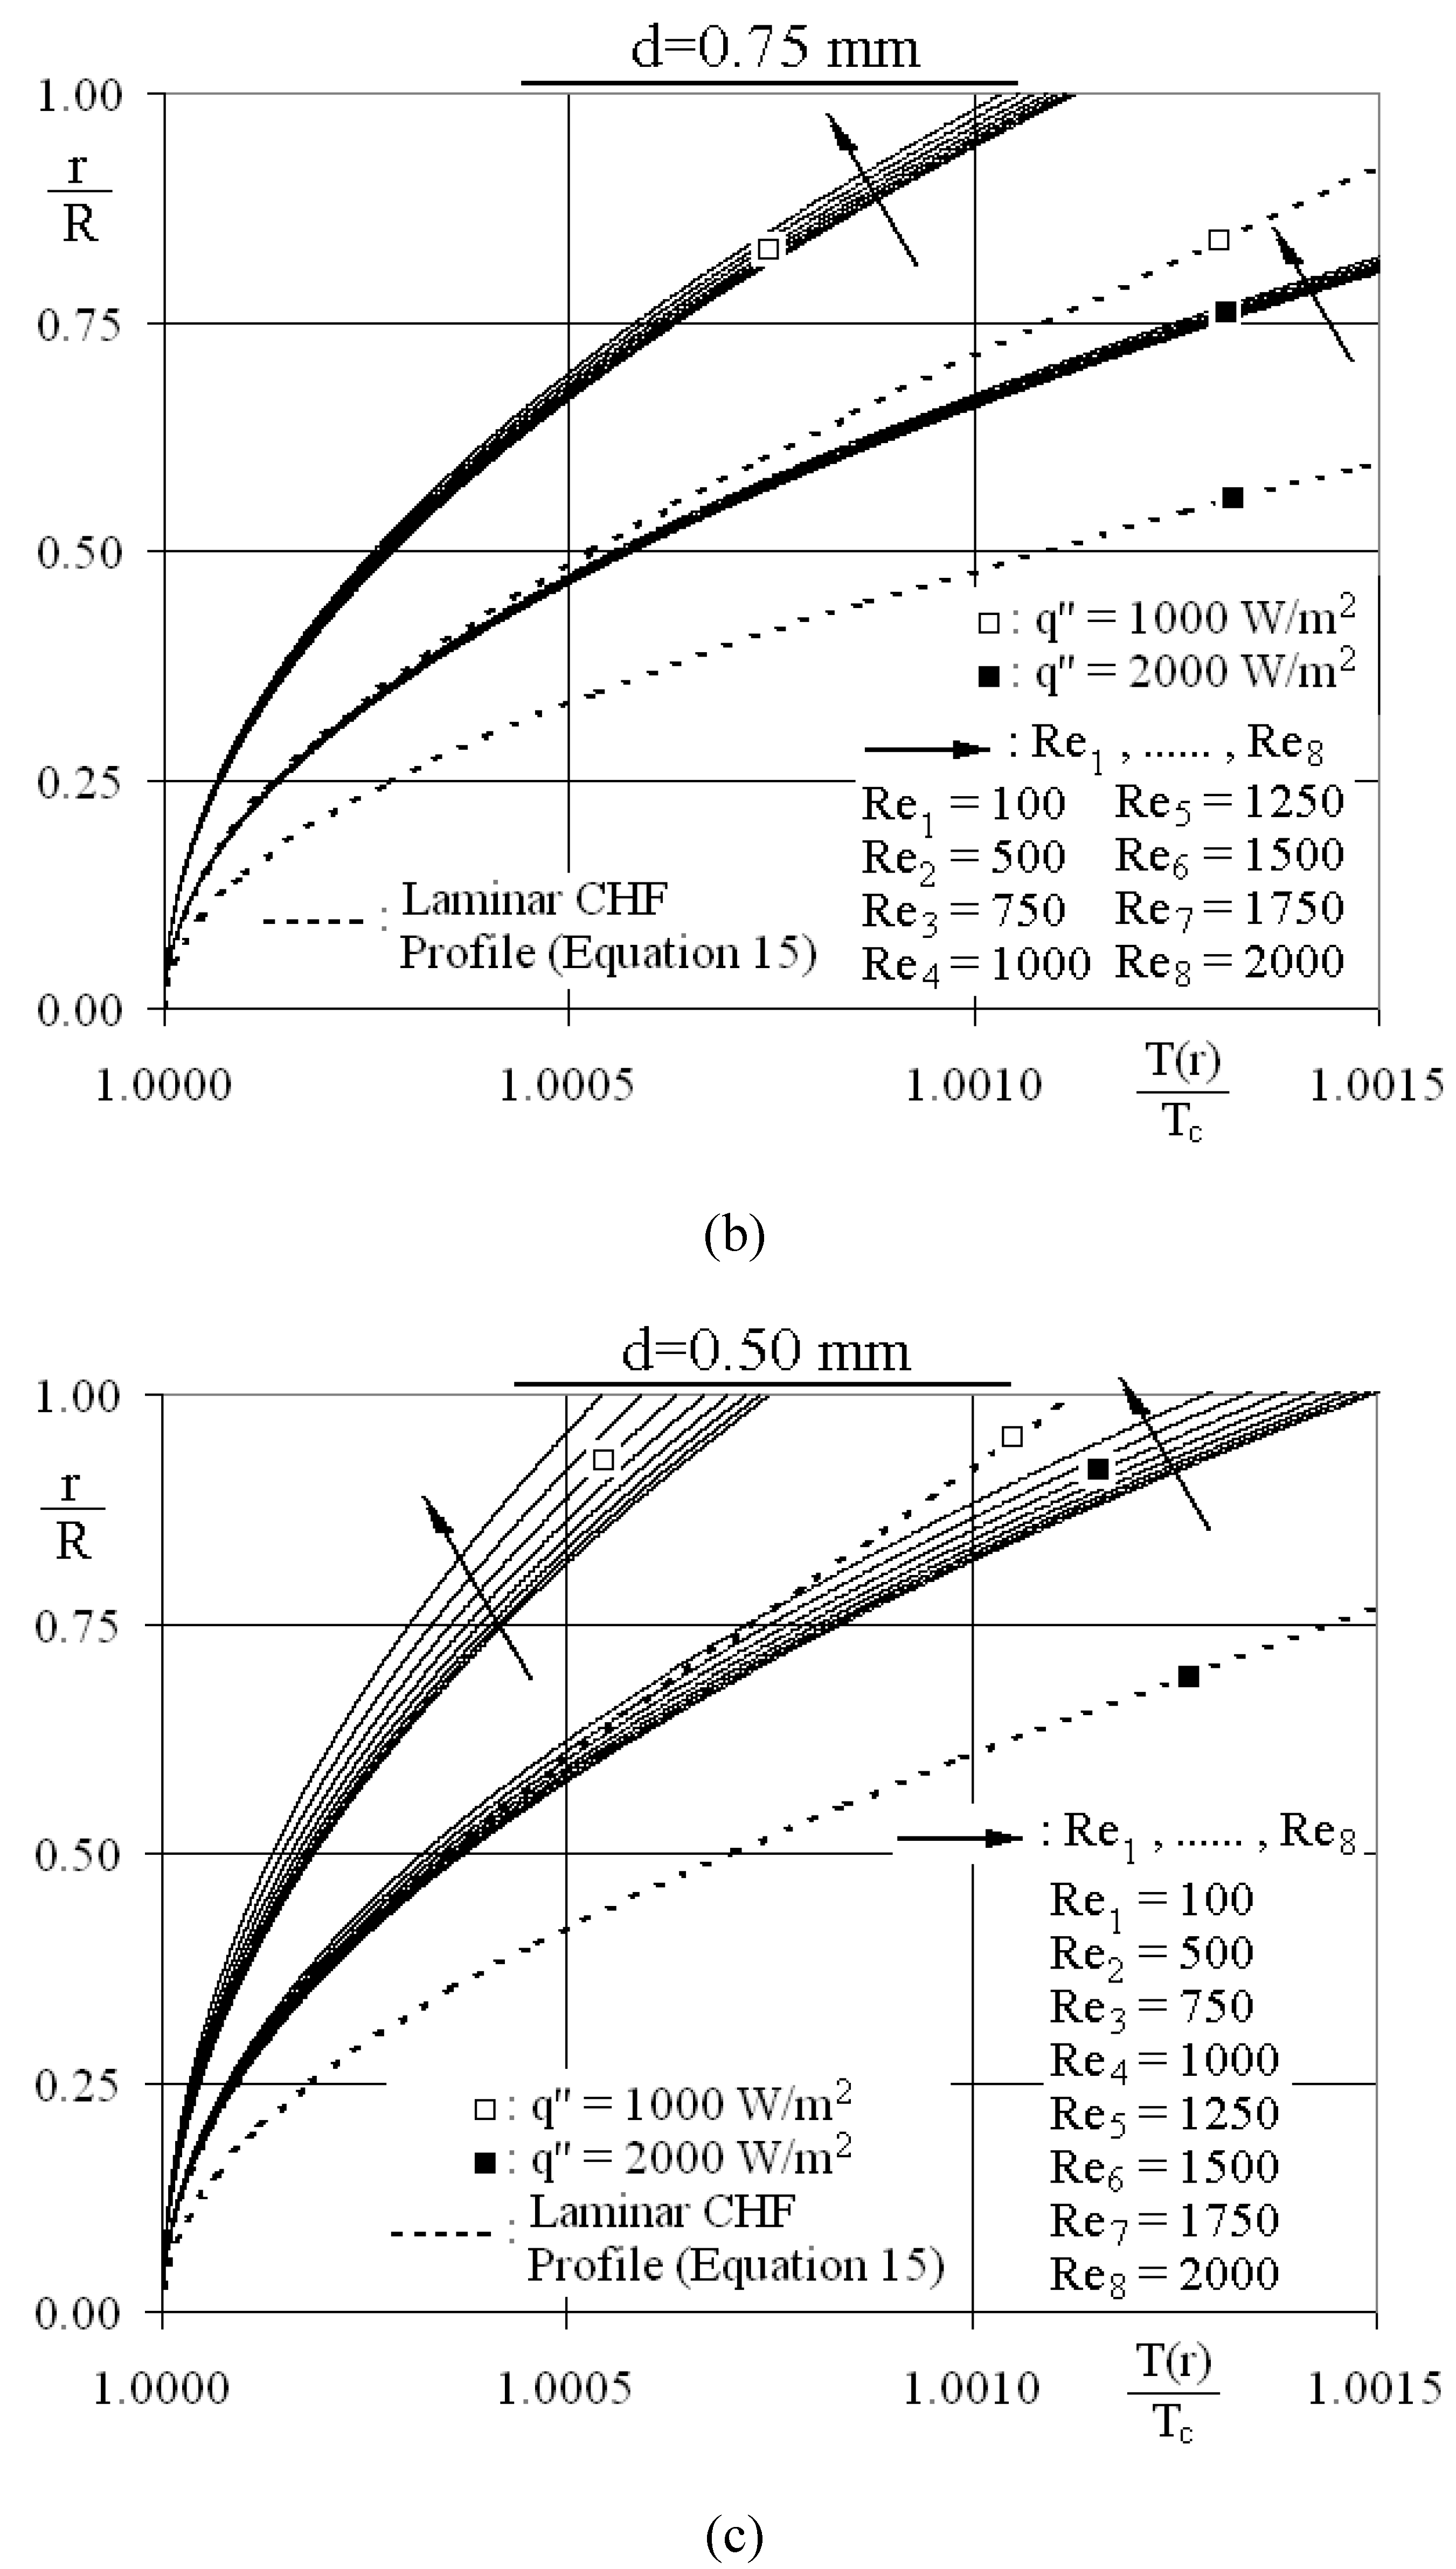
3.1.1. Radial schemes

Figure 2 displays the velocity profile (VP) formation in the Reynolds number range of Re = 100–2,000, for the pipe diameters d = 1.00, 0.75 and 0.50 mm with the fixed non-dimensional surface roughness of ε* = 0.001. To clearly display the deviations of the VPs from the characteristic styles of laminar and turbulent regimes and also to put forward the roles of d and Re on the transition mechanism, the characteristic laminar profile (Equation 12a) and the modified turbulent logarithm law for roughness (Equation 12b) (White [38]) are also displayed in Figure 2, where U* is the friction velocity (Equation 12c).
U z (r) U o = 2 [ 1 ( r R ) 2 ]    U z (r) U * = 2.44ln ( R r ε ) + 8.5    U * = τ w ρ
To clarify the roles of micro-pipe diameter and Reynolds number on the frictional activity, the classical and normalized friction coefficient values are evaluated by Equations 13a-c [38]. To strengthen the discussions on transition, boundary layer parameters like shape factor (H) and intermittency (γ) [38] are estimated by Equations 14a and b, respectively.
C f = 2 μ T | dU z dr | r = R | ρ U o 2    ( C f ) lam = 16 Re    C f * = C f ( C f ) lam
H = r = 0 r = R ( 1 U z (r) U c ) rdr r = 0 r = R U(r) U m ( 1 U z (r) U c ) rdr    γ = H lam H H lam H turb
As the laminar (Hlam = 3.36) and turbulent (Hturb = 1.70) shape factor values are computed with Equation 14a, by integrating the laminar (Equation 12a) and turbulent (Equation 12b) profiles, the shape factor data of the transitional flows were also calculated with Equation 14a, however with the computationally evaluated corresponding velocity profiles. The computed boundary layer and transition parameters are presented in Table 1.
Table 1. Boundary layer parameters for various Re and d cases (*: Transitional Reynolds numbers).
Entropy 12 00445 i001
It can be inspected from Figure 2 that in the all pipe diameter cases investigated, the VPs for the Re = 100 flow fit with the laminar profile, where the shape factor values are evaluated as H ≥ 3.345 (Table 1) being very close to the characteristic laminar value of H = 3.36. In the Re = 500 case, the VPs are still in harmony with the laminar profile; however slight shifts from the laminar character can be detected, such that the center velocity values and the shape factor and intermittency data build up the ranges of Uc/Uo = 1.960→1.950, H = 3.293→3.275 and γ = 0.041→0.051 (d = 1.00→0.50 mm), respectively.
Moreover, in the scenarios with higher Re, recognizable deviations in the VPs are determined. Thus to identify the modifications, the near wall (0.998 ≤ r/R ≤ 1) and pipe-centerline (0 ≤ r/R ≤ 0.4) regions are demonstrated through zoomed plots. Computations put forward that in the systems with higher Re and/or lower d as Cf elevates, the VPs depart significantly from the laminar profile causing the center velocity figures (Uc/Uo) to decrease, where these evaluations can also be visualized from the zoomed plots and Table 1. Since friction coefficient is mainly characterized by the rate of viscous momentum exchange at the solid boundary ( C f = μ T | dU z dr | r = R / 1 2 ρ U o 2 ) , the encouraged advance of the wall velocity gradient ( | dU z / dr | r = R ) with higher Re and/or lower d can be identified as the primary flow catalyst motivating the grow of Cf (Table 1). The near wall (0.998 ≤ r/R ≤ 1) zoomed plots of Figure 2 clarify that for flows with lower micro-pipe diameter the impact of Reynolds number on VPs is more noticeable. This evaluation is significant to interpret the combined effects of Re and d on the momentum transfer and transition mechanism in micro-pipe flows. In the light of several numerical and experimental research studies that examine the roles of micro-pipe diameter and surface roughness on the transition mechanism in internal flow problems, many of the involved scientists [5,9,10,16,39] accept the 10% rise of Cf (Cf* = 1.1) above the laminar value (Equation 13b) as an indicator for the transitional onset. Analyzing the present friction coefficient findings with this method sensitively mark the transitional Reynolds numbers for the micro-pipe diameters of d = 1.00, 0.90, 0.75, 0.60 and 0.50 mm as Retra = 1,656, 1,607, 1,491, 1,341 and 1,272 respectively. These numbers point out that the structural inducement (d = 1.00→0.50 mm) of the micro flow character with the encouraged transition behavior at relatively lower Re. The open literature proposes a number of transitional micro-pipe studies. Although the common point is the encouraged transitional activity at lower micro-pipe diameters, the findings on transitional Reynolds numbers do mostly not closely resemble but interpret a general attitude. Such as: Guo and Li [5] Retra = 1800 for d = 0.13–0.18 mm, Celata et al. [13] Retra = 100 for d = 0.13 mm, Ozalp [35] Retra = 1650→450 (ε* = 0.001→0.05) for d = 1.00 mm, Wu and Little [39] Retra = 400–900 for d=0.05–0.08 mm, Yu et al. [40] Retra = 1700 and Choi et al. [41] Retra = 500 for d = 0.01 mm. The basis of this divergence may be due to the undefined/unavailable surface roughness information in many of the works. However, the present findings on transition onset still not only conform with the associated reports but also enriches the related research frame with scientific outputs on well defined scenarios. It can additionally be extracted from the present Retra that, as the gap of (Retra)d=1.00 mm - (Retra)d=0.90 mm is 49, the corresponding one for (Retra)d=0.60 mm - (Retra)d=0.50 mm becomes 69. These values clearly pronounce that, the lower the micro-pipe diameter is reduced the more the sensed influence on Retra is promoted. The tabulated outputs in Table 1 further denote that the transitional shape factor and intermittency are located in the ranges of H = 3.133→3.159 and γ = 0.137→0.121 for d = 1.00→0.50 mm. These transition indicators expose the rise of shape factor values and drop of intermittency data in micro-pipes with lower diameters. Numerical works of Ozalp [34,35] for air flow in a micro-pipe with d = 1.00 mm and ε* = 0.001 concluded with the transitional shape factor and intermittency outputs of H = 3.141 and γ = 0.132, respectively. Moreover, the zoomed plots (0 ≤ r/R ≤ 0.4) of Figure 2 confirm for the velocity profiles, matching the Retra range of Table 1, that the center velocity values (Uc) generate the scene of 1.85 ≤ Uc/Uo ≤ 1.90, which can also be considered as a trustable indicator for transitional activity.
The combined roles of Reynolds number, surface heat flux and micro-pipe diameter on the temperature profile (TP) development are shown in Figure 3. TPs are presented in non-dimensional form with respect to the centerline value (Tc). To identify the considerable influence of viscous dissipation based energy loss ( ψ loss = 2 π 0 R U z 1 r r ( r τ rz ) rdrL ) on the TP structure in micro-pipe flows TPs are also compared with the laminar Constant Heat Flux (CHF) formula of Equation 15 [36]. Moreover, the findings on the thermal behavior of micro-pipe flows are supported with the tabulated records of Ψloss and flow temperature rise (ΔT) in Table 2.
T(r) = T s 2U o κ f T R 2 ρ C p T ( dT o dz ) [ 3 16 + 1 16 ( r R ) 4 1 4 ( r R ) 2 ]
Figure 2. Variations of radial velocity profiles with Re for the micro-pipe diameters of (a) d = 1.00 mm, (b) d = 0.75 mm and (c) d = 0.50 mm.
Entropy 12 00445 g002aEntropy 12 00445 g002b
Table 2. ΔT and Ψloss values for various Re, d and q cases.
d (mm)q'' (W/m2)Qs (W)Re = 100Re = 500Re = 1000Re = 1500Re = 2000
ΔT (K)Ψloss (W)ΔT (K)Ψloss (W)ΔT (K)Ψloss (W)ΔT (K)Ψloss (W)ΔT (K)Ψloss (W)
1.0010001.5714.6901.333E-040.9363.336E-030.4651.337E-020.3073.017E-020.2275.386E-02
15002.3567.0361.292E-041.4053.312E-030.7001.332E-020.4633.010E-020.3445.377E-02
20003.1429.3811.257E-041.8743.289E-030.9341.327E-020.6193.003E-020.4615.367E-02
0.7510001.1784.6902.371E-040.9335.931E-030.4602.378E-020.2985.369E-020.2159.594E-02
15001.7677.0352.298E-041.4035.889E-030.6942.369E-020.4555.356E-020.3339.577E-02
20002.3569.3812.23E-041.8725.848E-030.9292.361E-020.6115.344E-020.4509.560E-02
0.5010000.7854.6885.334E-040.9221.335E-020.4375.354E-020.2651.211E-010.1702.166E-01
15001.1787.0335.170E-041.3911.325E-020.6725.336E-020.4211.208E-010.2872.163E-01
20001.5719.3795.027E-041.8601.316E-020.9065.317E-020.5771.205E-010.4042.159E-01
It can be inspected from Figure 3 that more noticeable deviations in TPs from the laminar CHF profile (Equation 15) arise in the flow scenarios with lower micro-pipe diameter and heat flux and higher Reynolds number. This determination can be explained by the growth of Ψloss values under these flow conditions (Table 2). The higher energy loss outputs, with lower d and higher Re, count on the enhanced wall velocity gradients (Figure 2) and the corresponding stronger friction activity (Table 1). On the other hand, the source of the raised Ψloss with lower q can be enlightened with the decay of ΔT data (Table 2) with this manipulation. Since liquid viscosity responses inversely to fluid temperature, lower ΔT due to reduced q results in promoted viscosity levels causing as well the motivation of Ψloss values. Besides, the reverse impact of Re on ΔT can be outlined with the direct relation of Reynolds number and mass flow rate in the micro-pipe, where the overall transferred heat through the micro-pipe surface can also be defined with the fundamental formula of Qs = m . CpΔT. Figure 3 additionally puts forward that the wall temperature gradients ( T(r) / r | r R = 1 ) rise with lower d and higher Re, in other words in cases with excited Ψloss. Contributing directly the wall temperature gradients with heat transfer rates (Equation 2b) enlightens the parallelism of frictional and thermal activities from the point of attaining motivation with lower d and higher Re. Depending on the above indicated and verified scientific association of TP formation with Ψloss data, to interpret and discuss the deviations in TP profiles with the considered structural (d), flow (Re) and thermal ( q ) parameters, the variations in Ψloss under different operating conditions are identified by Equation 16.
Δ Ψ loss = ( Ψ loss ) q = 1000   W/m 2 ( Ψ loss ) q = 2000   W/m 2
Analyses show that as ΔΨloss gets the values of 7.6×10⁻⁶ W and 1.9×10⁻⁴ W for Re = 100 and 2,000 in the micro-pipe flow of d = 1.00 mm, these data rise to 1.41×10⁻⁵ W and 3.4×10⁻⁴ W at d = 0.75 mm and to 3.07×10⁻⁵ W and 7.0×10⁻⁴ W at d = 0.50 mm. These findings indicate that the potential of q on Ψloss develops with lower d and higher Re. This determination is quite significant in identifying the scenarios where the TPs are more probable to deviate from the laminar constant heat flux profile. Since ΔT and Ψloss respond inversely to the imposed parameters, they develop completely in a contrary mechanism under the influence of these operational factors. Furthermore, simultaneous inspection of the depended character of Ψloss on the VPs and the affiliation of ΔT with TPs evidently put forward the strong interaction of the momentum and thermal characteristics in micro-pipe flows.
Figure 3. Variations of radial temperature profiles with Re and q for the micro-pipe diameters of (a) d = 1.00 mm, (b) d = 0.75 mm and (c) d = 0.50 mm.
Entropy 12 00445 g003aEntropy 12 00445 g003b

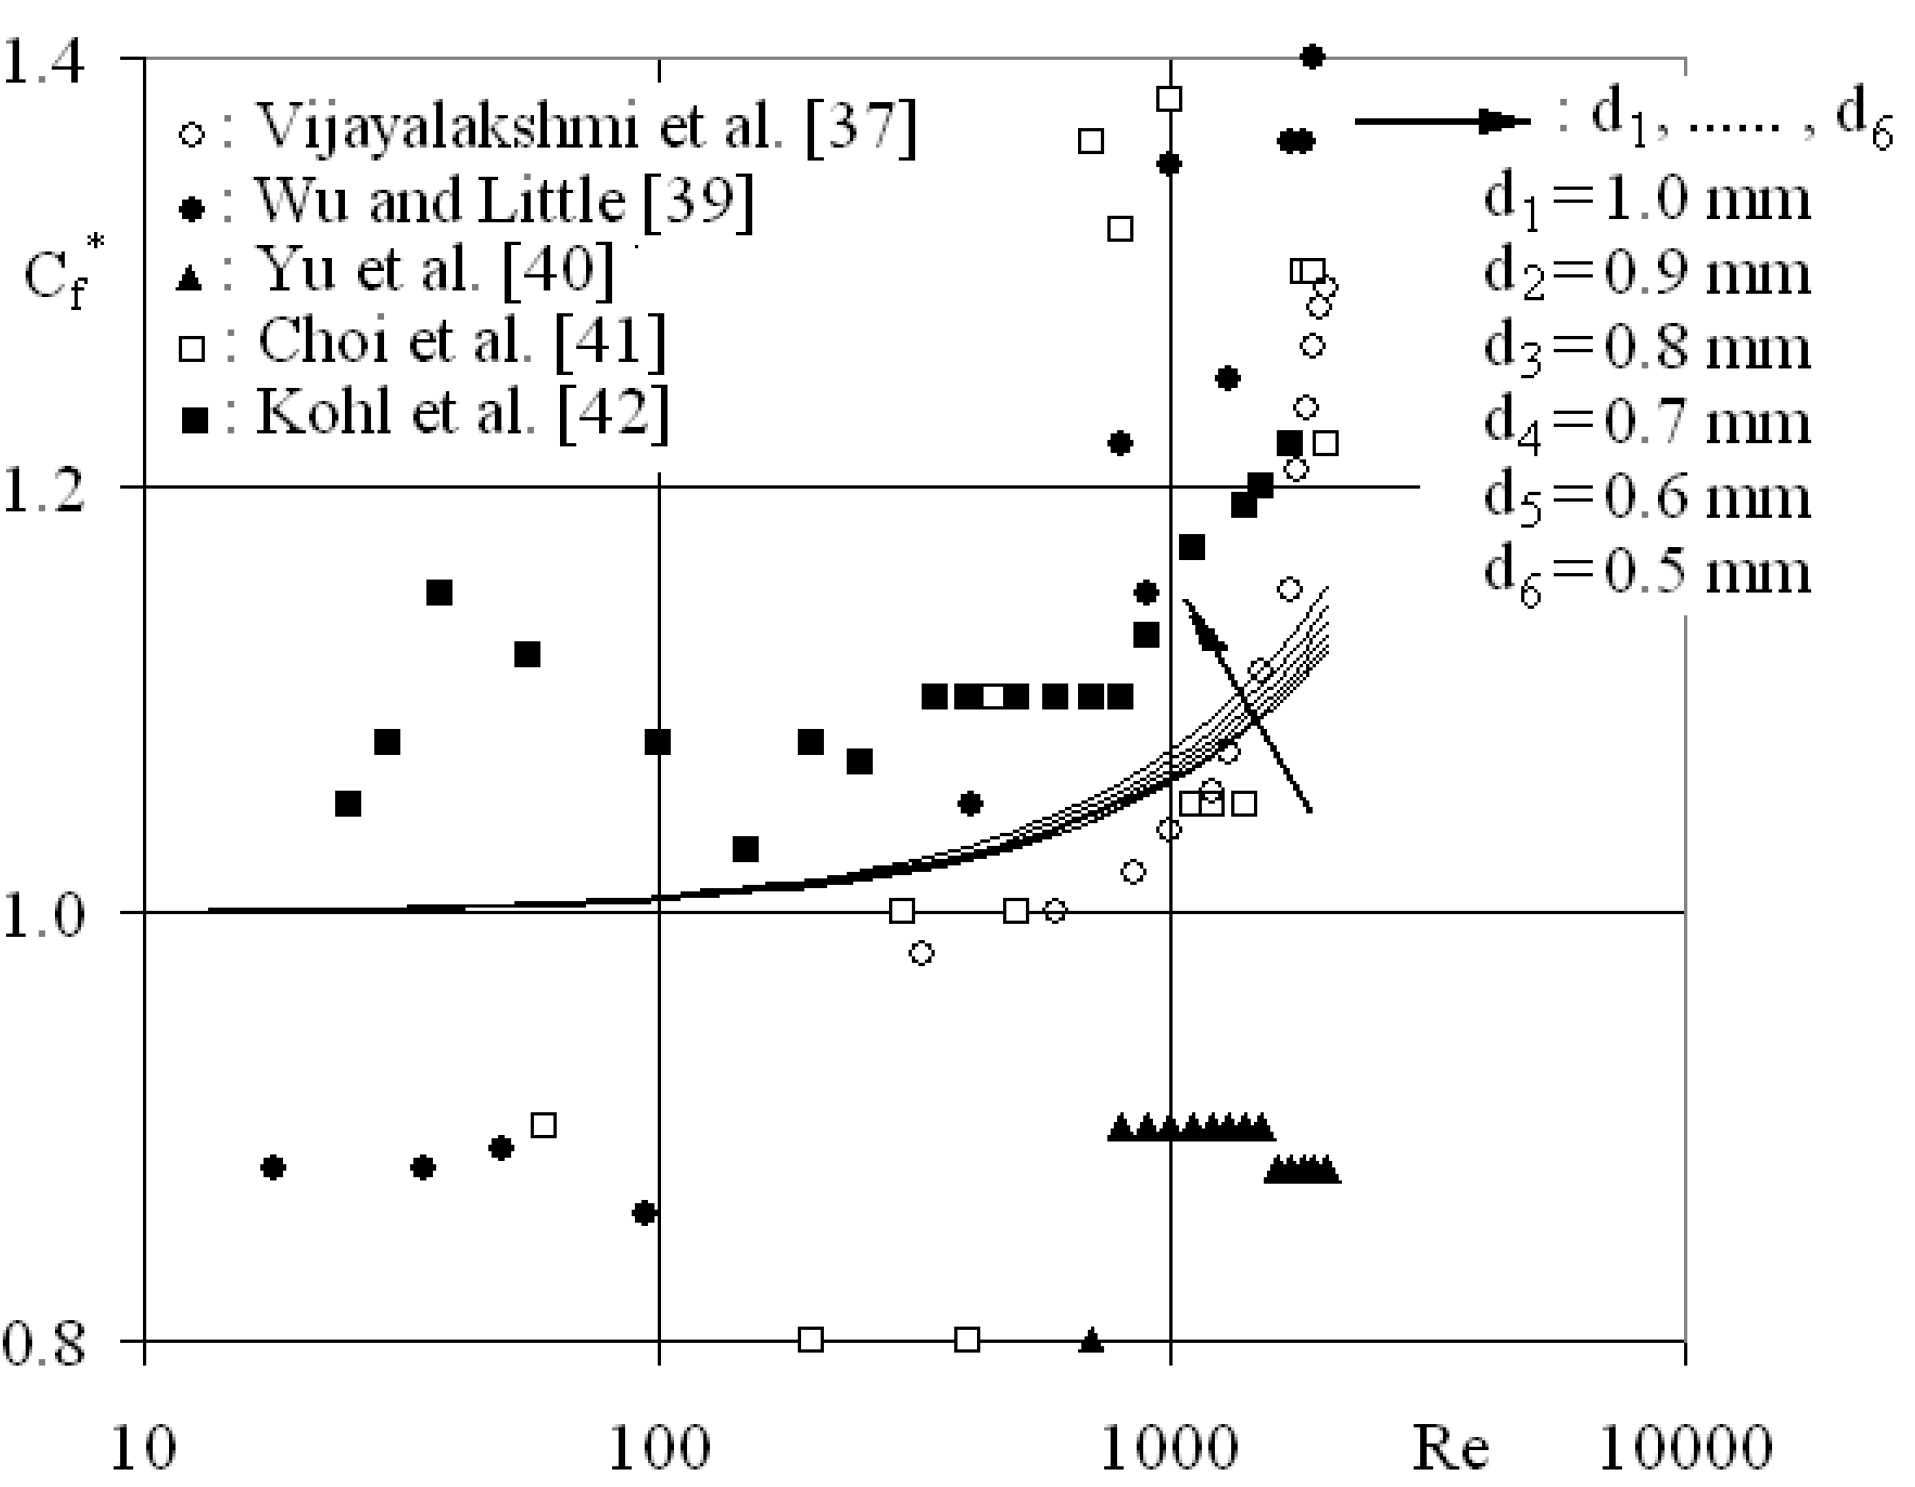
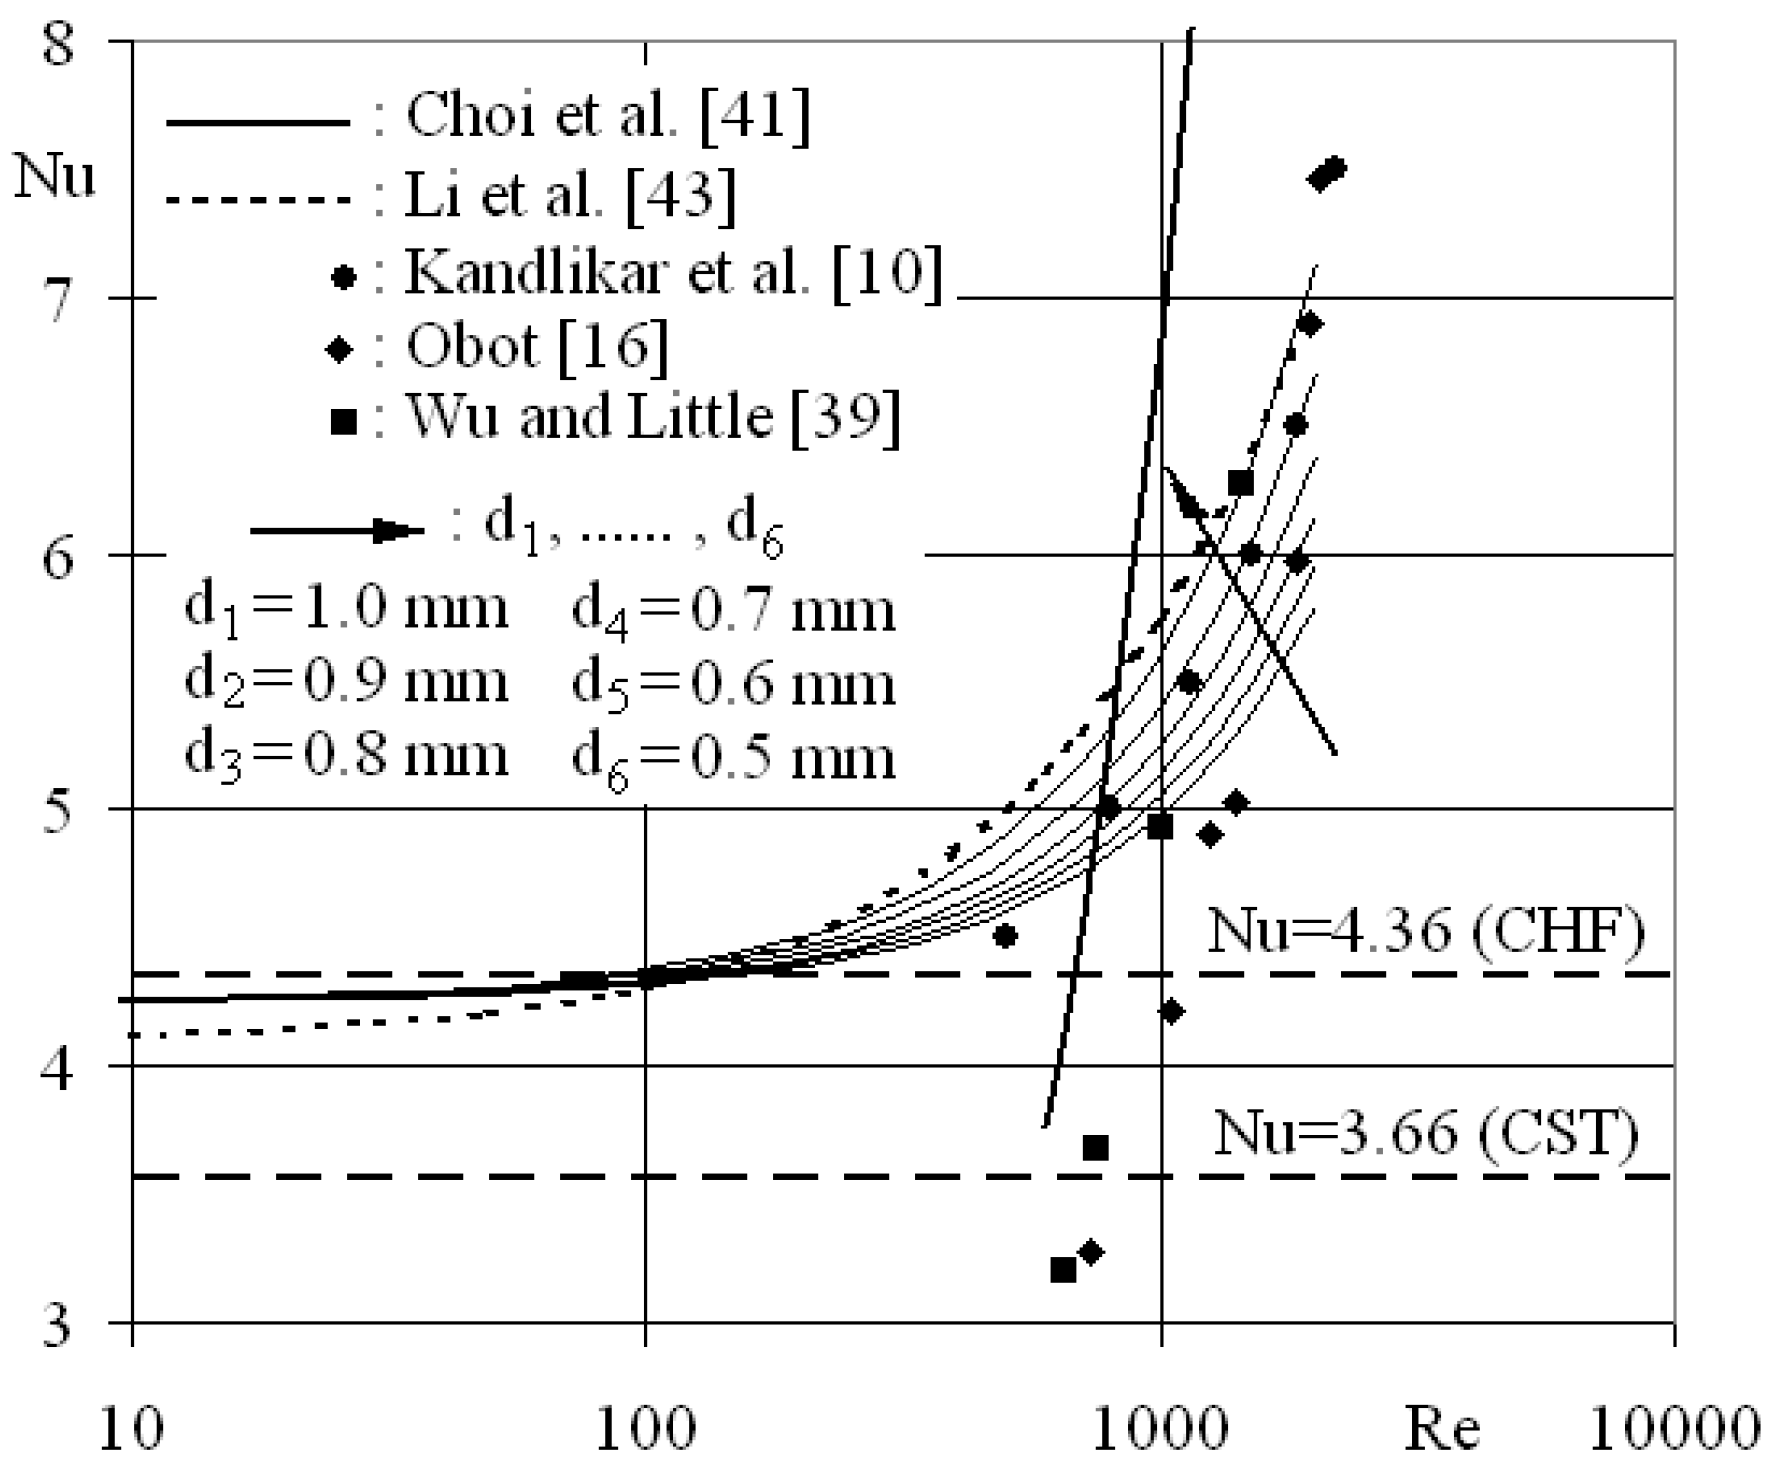
3.1.2. Characteristic parameters

Computational Cf* values, for various Re and d cases, are presented in Figure 4, together with the available literature based data. The roles of Reynolds number and micro-pipe diameter on friction coefficient comprise appreciable importance not only from the point of flow characteristics and momentum transfer, but also due to direct contribution of viscous effects on the local frictional entropy generation ( S Δ P - Equation 10). It can be seen from Figure 4 that Cf* values augment with both higher Reynolds number and lower micro-pipe diameter. Computations identified the Cf* range for Re = 100 as Cf* = 1.006→1.007 (d = 1.00→0.50 mm), whereas the corresponding ones for Re = 500, 1,000 and 1,500 are Cf* = 1.028→1.038, 1.063→1.075 and 1.088→1.116, respectively. These numbers enlighten the combined contribution of Re and d on the transformation of Cf* values towards the transition onset label of Cf* = 1.1. It can additionally be resolved from the above ranges that as the deviation of (Cf*)d=1.00 mm and (Cf*)d=0.50 mm at Re = 100 is only 0.1%, it becomes 0.97%, 1.13% and 2.57% at Re = 500, 1,000 and 1,500, respectively. These deviations put forward that the impact of micro-pipe diameter on momentum characteristics becomes more significant at high Reynolds numbers. The complete set of presentations and analysis on the characterization of micro-pipe flows with Reynolds number and micro-pipe diameter not only ascertained the decrease of H and Uc/Uo and increase of Cf* and γ values, but also identified the shift process of VPs from fully laminar to the transitional structure. As tendency to transitional activity and promoted friction coefficients account to the augmentation of pressure loss amounts of the flow, the present findings on the individual and combined roles of Reynolds number and micro-pipe diameter are quite remarkable for micro-level industrial applications such as heat exchangers, pumps, electronics cooling, piping arrangements and lubrication systems. On the other hand, Figure 4 as well shows that although the Cf* values of Yu et al. [40] were even below the laminar theory for 100 < Re < 2,000, the experimental friction coefficient data of Vijayalakshmi et al. [37] (ε* = 0.002), Choi et al. [41] (ε* = 0.0003), Kohl et al. [42] (ε* = 0.003–0.013) and Wu and Little [39] exposed strengthening trends for Re > 500, showing harmony with the present numerical evaluations.
Figure 4. Variation of Cf* with Re and d.
Entropy 12 00445 g004
Figure 5 presents the variation of Nusselt numbers for various Reynolds numbers and micro-pipe diameters, where the computational outputs are compared not only with the literature based experimental results but also with the empirical correlations of the related recent work. Analyses shown that Nusselt numbers, for the complete micro-pipe diameter range investigated, attained the almost constant value of Nu = 4.25 at the low Reynolds number range of Re < 100, where this value lays between the characteristic indicators of Nu = 4.36 and Nu = 3.66 for the laminar constant heat flux (CHF) and constant surface temperature (CST) scenarios. The present computational Nu trends in Figure 5 put forward the rise of heat transfer activity in flows with lower micro-pipe diameters and higher Reynolds numbers. Indeed this finding complies with the high wall temperature gradients (Figure 3) at the identical conditions and assists as a double verification marker in the heat transfer vision of this research. Comparing the current numerical results with the experimental reports of Kandlikar et al. [10], Obot [16] and Wu and Little [39] exhibit a close harmony with their upper limit of Nusselt number set for Re ≥ 850. On the other hand, as the analogy of Choi et al. [41] (Equation 17a), developed for the significantly low micro-pipe diameters of d ≤ 0.081 mm, matches with the present outputs only in the narrow Reynolds number band of 700 < Re < 900, Li et al.’s [43] empiric suggestion (Equation 17b) not only displays the same style of the present variations but also its solution set for d = 0.75 mm shows close similarity with the present results of the d = 0.50–0.70 mm cases for Re > 300.
Nu = 0.0000972 * Re1.17 1.17 * Pr 0.333   Nu = 4.1 + 0.14*d/L*Re*Pr 1 + 0.05* ( d/L*Re*Pr ) 2 / 3
Figure 5. Variation of Nu with Re and d.
Entropy 12 00445 g005
To provide a more sensitive designation on the individual role of micro-pipe diameter on Nusselt number, the ratio of Nud=0.50 mm/Nud=1.00 mm is taken into consideration, which proposed the variation rates of 1.065, 1.126, 1.181 and 1.231 at the Reynolds number levels of Re = 500, 1,000, 1,500 and 2,000 respectively. These proportions clearly identify the growing influence of the micro structure on the heat transfer behavior at high Reynolds numbers. Besides, comparing the Nusselt numbers evaluated at the transition Reynolds numbers (Nutra) with the laminar typical value of Nulam = 4.25 points out the augmentation rates of Nutra/Nulam as 1.30 and 1.41 at d = 1.00 mm and d = 0.50 mm, respectively. These values put forward that at the onset of transition, heat transfer activity is more potentially provoked at lower micro-pipe diameter cases. It can additionally be extracted from these proportions that, for the micro-pipe diameter range of d = 0.50–1.00 mm with the fairly low relative roughness of ε* = 0.001, the Nusselt numbers rise by a factor range of 1.30–1.40 at the transition onset.

3.2. Analyses on Second-Law Characteristics

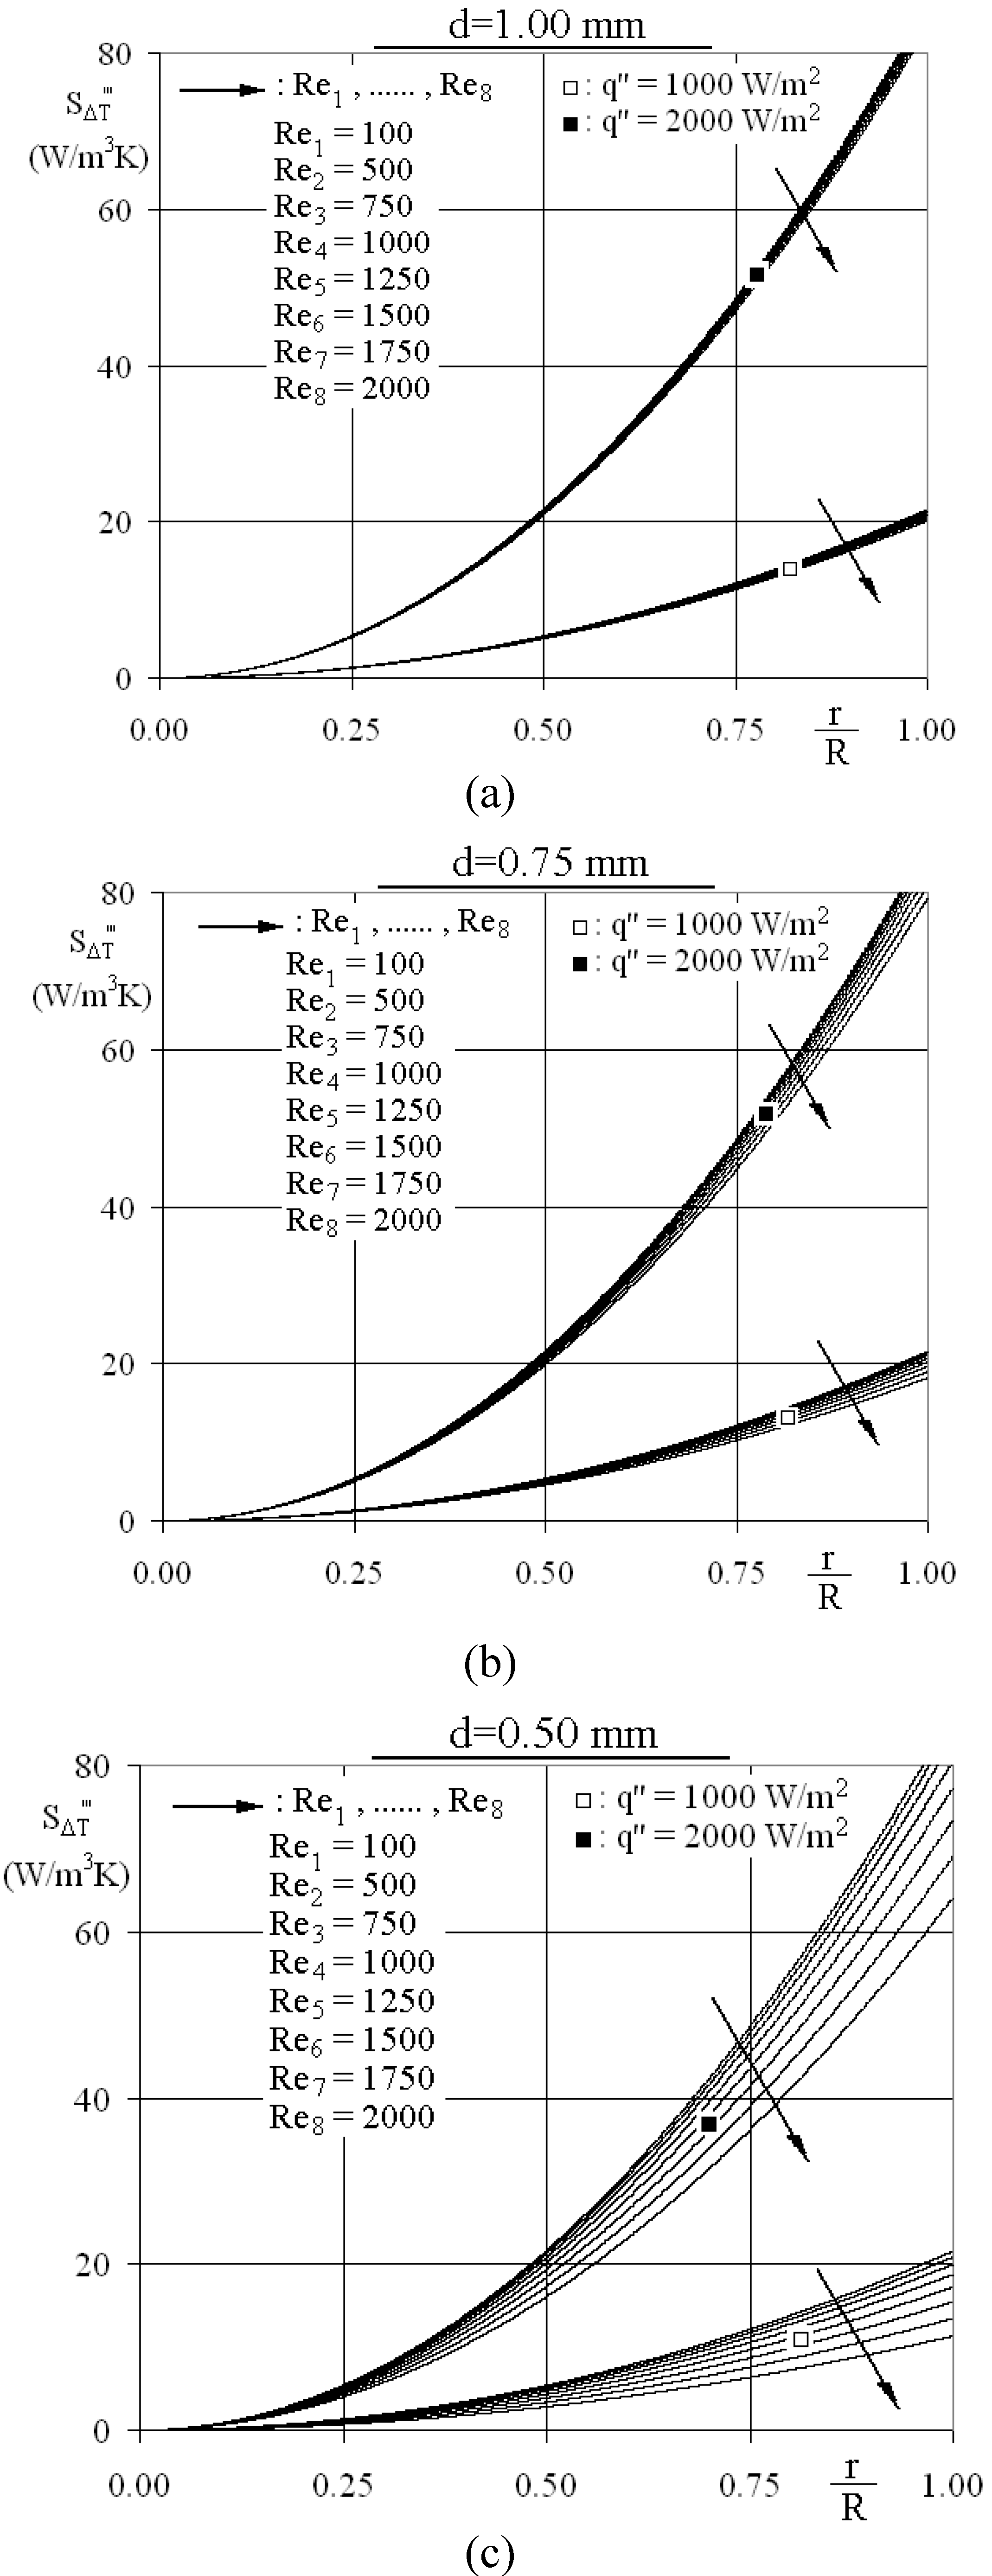
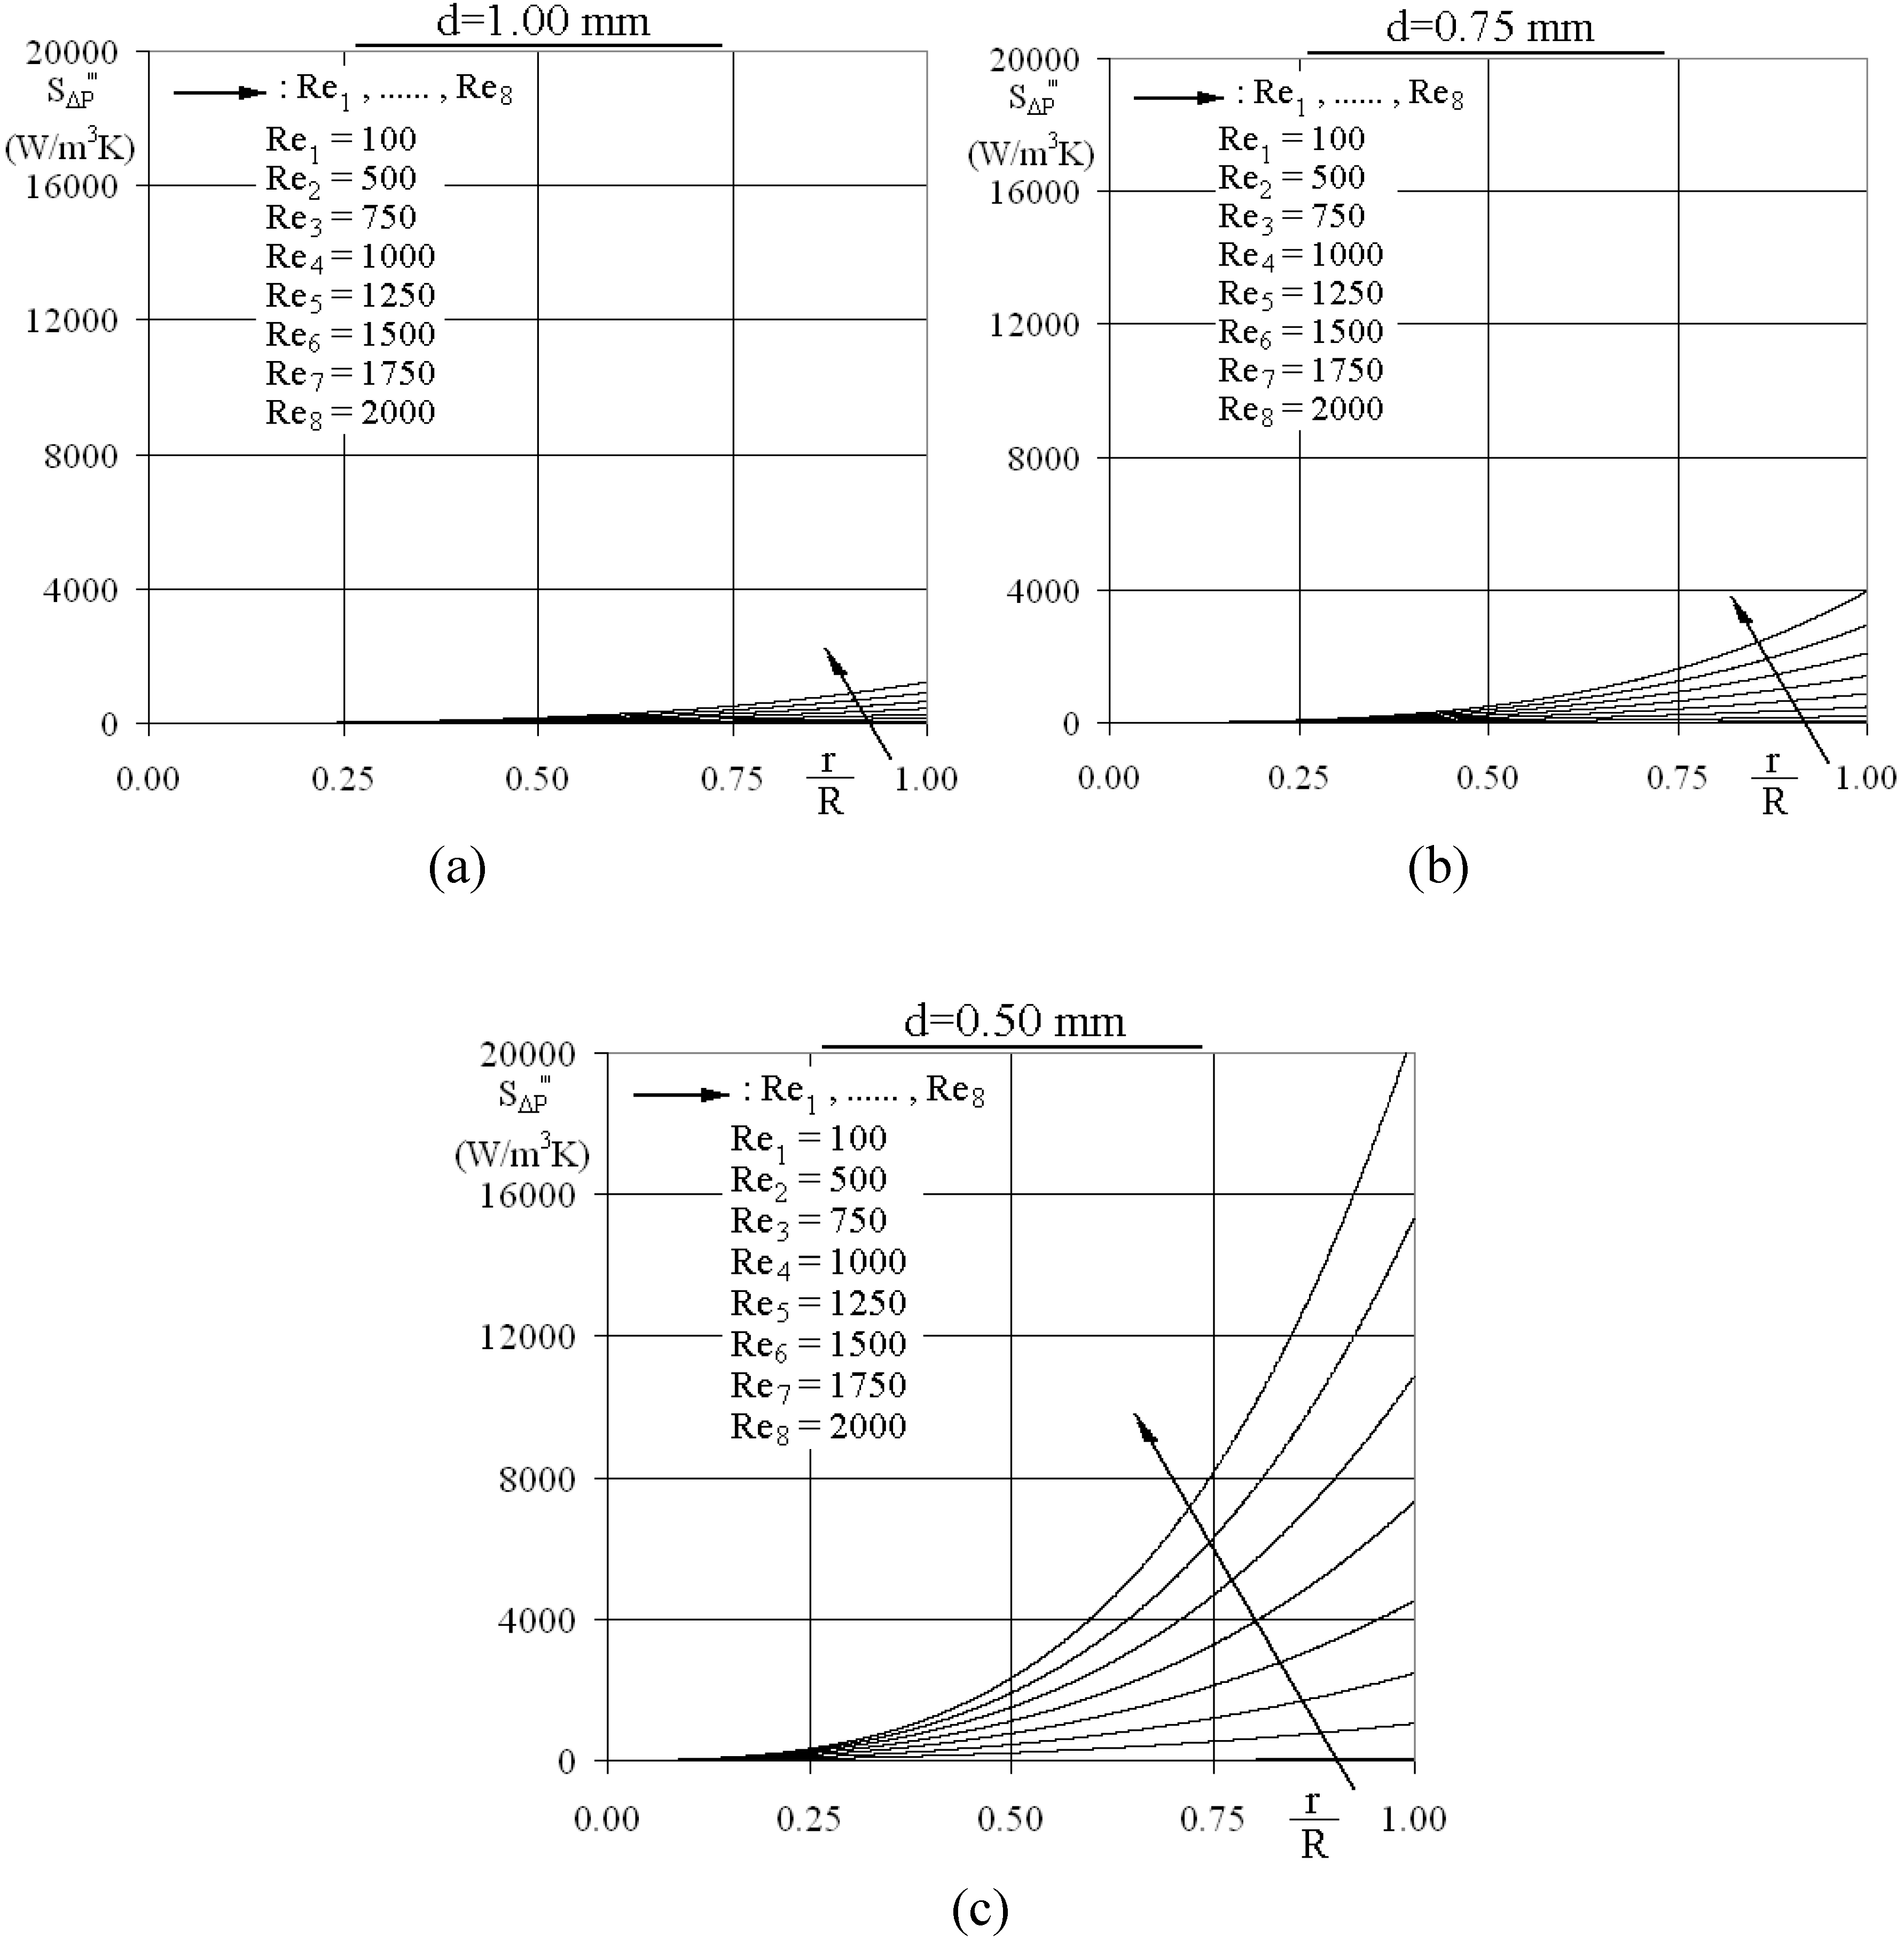
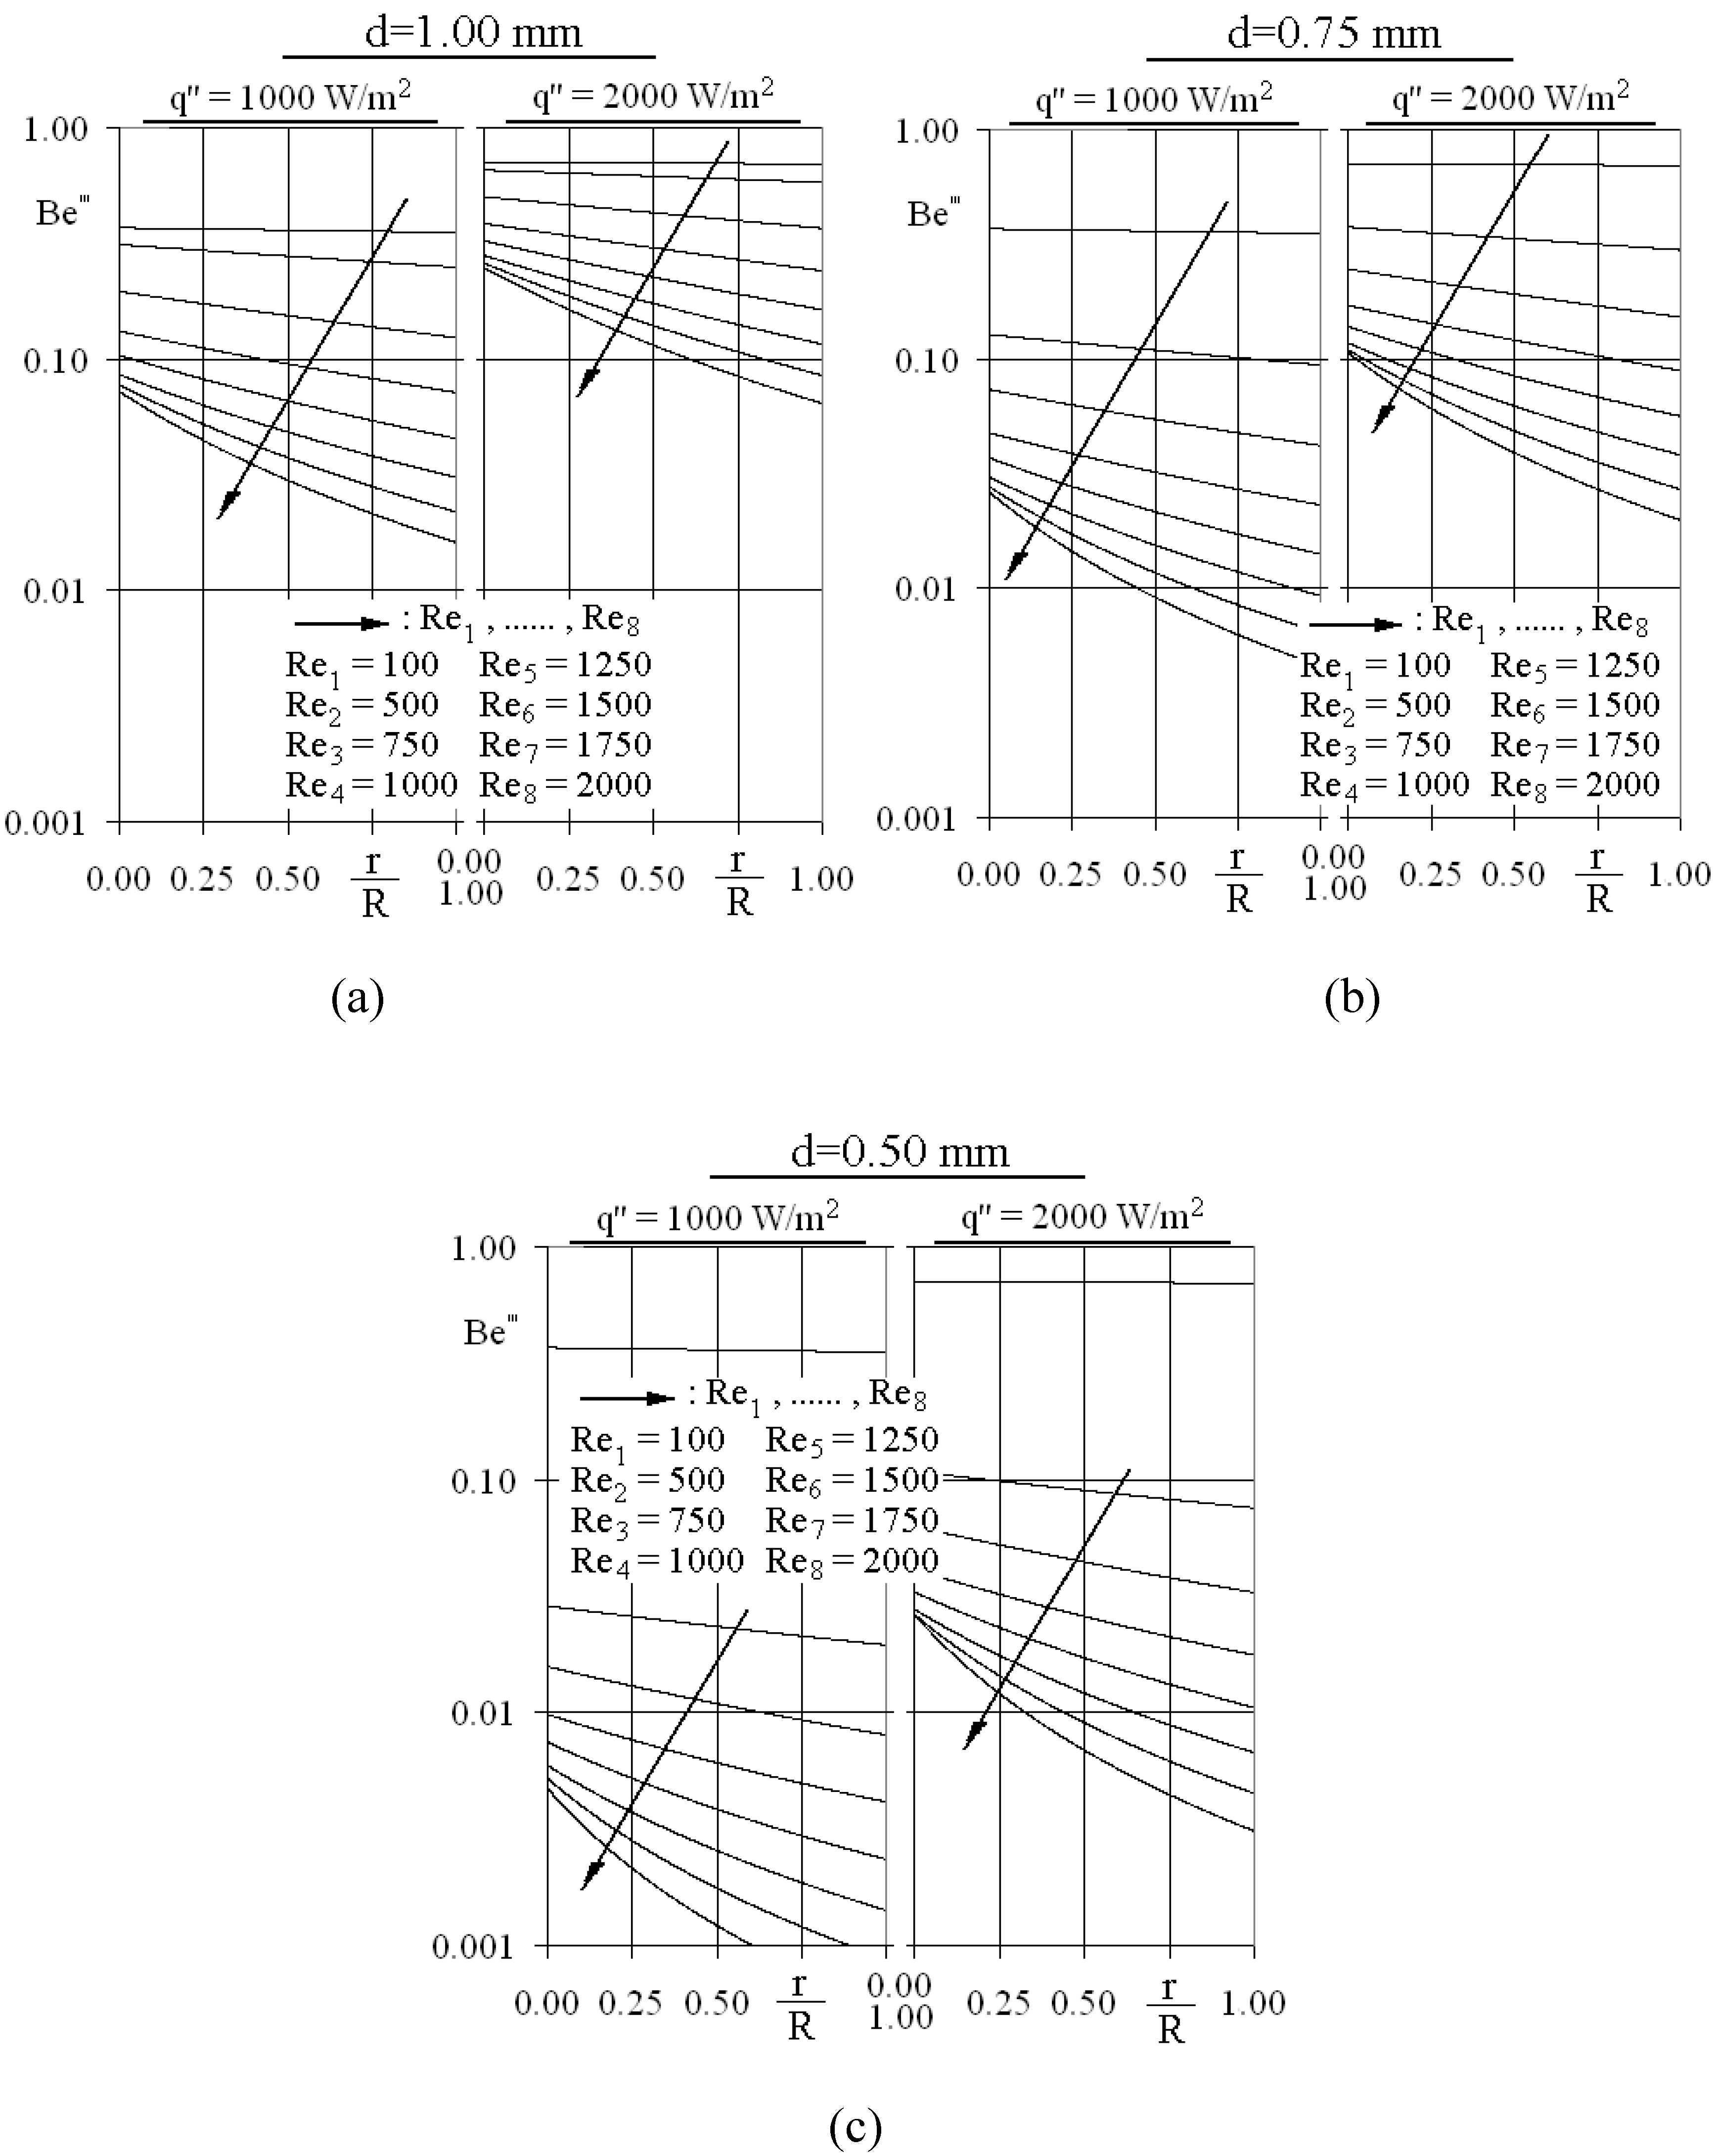
3.2.1. Radial schemes

Due to the fact that local entropy generation is dependent on the two sub-components (Equation 10b) of thermal ( S Δ T ) and frictional ( S Δ P ) parts, at the initial step of the related discussions the radial distribution characteristics of these individual items are presented. These discussions will cooperate to enlighten the local influences of pipe diameter (d), Reynolds number (Re) and heat flux ( q ) on the mechanism of entropy generation. Figure 6 shows the radial profiles of S Δ T , those of S Δ P are displayed in Figure 7.
Figure 6 clearly identifies that as the flow at the pipe centerline (r/R = 0) does not have any contribution on S Δ T , thermal based entropy generation values attain the highest rates at the micro-pipe walls (r/R = 1). This outcome can be simultaneously interrelated with the fundamental definition of S Δ T and temperature profiles of Figure 3. Since thermal entropy generation is mainly dependent on temperature gradients in the flow domain (Equations 10a-b), the locations of the least and top gradients also define the locus of the lowest and highest S Δ T values. Moreover, as expanded in detail through Figure 3, the impacts of d, Re and q on TP development as well manipulate the thermal entropy generation rates; thus the S Δ T values go along not only the with the TPs but also with the Ψloss and ΔT data (Table 2). To identify the individual and combined roles of d, Re and q on S Δ T , Equations 18 a and b are evaluated at the pipe wall (r/R = 1) for the considered micro-pipe diameter and Reynolds number ranges. For the highest micro-pipe diameter of d = 1.00 mm, β1 is computed to attain the values of 3.99, 4.03 and 4.14 for Re = 100, 1,000 and 2,000, respectively. As decreasing the pipe diameter to d = 0.75 mm restructures the above figures to 3.99, 4.08 and 4.36, at the lowest diameter (d = 0.50 mm) of the present research, β1 is augmented up to 4, 4.29 and 5.66. Inspecting β2 clarifies the superiority of S Δ T (d = 1.00 → 0.50 mm) with the ratios of 1, 1.13 and 1.78 for Re = 100, 1,000 and 2,000 at q = 1,000 W/m2, whereas these proportions fall to 1, 1.06 and 1.30 at q = 2,000 W/m2.
β 1 = ( S Δ T ) q = 2000  W/m 2 ( S Δ T ) q = 1000  W/m 2    β 2 = ( S Δ T ) d = 1.00 mm ( S Δ T ) d = 0.50  mm
From the β1 point of view, it can be said for the low Reynolds numbers (Re = 100) that the encouraging role of q on S Δ T is almost fixed in the complete micro-pipe diameter range investigated. However, the influence of heat flux grows with both high Re and low d, especially for Re > 1,000 and d < 0.75 mm, indicating that the intend of flow towards both transitional and micro-flow character are additional motivations to increase the local thermal entropy generation rates. The second indicator (β2) further identifies that the impact of d improves with Re and drops with q .
Figure 6. Variation of radial S Δ T distributions with Re and q for the micro-pipe diameters of (a) d = 1 mm, (b) d = 0.75 mm and (c) d = 0.50 mm.
Entropy 12 00445 g006
Figure 7. Variation of radial S Δ P distributions with Re for the micro-pipe diameters of (a) d = 1 mm, (b) d = 0.75 mm and (c) d = 0.50 mm.
Entropy 12 00445 g007
Figure 7 shows the formation and variation of radial characteristics of frictional entropy generation ( S Δ P ) for various Reynolds numbers and micro-pipe diameters. Since the viscous energy loss values (Ψloss) for different heat flux applications are quite similar (Table 2), only the S Δ P profiles for q = 1,000 W/m2 are presented in Figure 7. It can be seen from the figure that S Δ P values rise towards the pipe walls, where the most significant velocity gradients (Figure 2), shear rates, friction coefficients (Figure 3) and the frictional entropy generation values are located. Due to the fact that frictional entropy generation is essentially defined by the magnitude of velocity gradient, there exist not only scientific but also operational close relation among the Cf* and S Δ P values. As in the variation of friction coefficients with Reynolds number and micro-pipe diameter (Figure 4Table 1), frictional entropy generation rates are as well computed to enhance with higher Re and lower d. This outcome can be enlightened through the elevated fluid flow-solid domain interaction in cases with narrower flow domains (lower micro-pipe diameter) or increased mass flow rate (higher Reynolds number). Present computational determinations are completely in harmony with the results of Ko [31] for double-sine ducts, on the variations of the thermal and frictional entropy generation rates with Reynolds number.
The individual and combined roles of micro-pipe diameter and Reynolds number can be distinguished more specifically by comparing the wall (r/R = 1) frictional entropy generation values of different micro-pipe diameters and Reynolds numbers (Equations 19a-b). Numerical analyses show that α1 has the values of 1.00, 5.62 and 16.90 for Re = 100, 1,000 and 2,000, respectively; besides α2 is computed as 30.99 and 523.42 for the micro-pipe diameters of d = 1.00 mm and 0.50 mm. The grow of α1 with higher Re clearly states that the influence of micro character on frictional entropy generation becomes more impressive at higher Reynolds numbers. Besides, the provoked view of α2 at lower d establishes the accelerated role of Re on S Δ P in the pipes with stronger micro character. Indeed α1 and α2 simultaneously denote the synergy imposed on frictional entropy generation by the concurrent action of Reynolds number and micro-pipe diameter.
α 1 = ( S Δ P ) d = 0.50 mm ( S Δ P ) d = 1.00 mm    α 2 = ( S Δ P ) Re = 2000 ( S Δ P ) Re = 100
Individual and combined roles of surface heat flux, Reynolds number and micro-pipe diameter on the radial variations of local Bejan number ( Be ) are demonstrated in Figure 8. It can be inspected from the figure that Bejan numbers decrease in the radial direction (r/R = 0→1). This output puts forward that among the both radially increasing two sub-components of entropy generation ( S Δ T -Figure 6 and S Δ P -Figure 7), augmentation in the frictional component is more significant. The reduced appearance of Be with Re is an expected evaluation due to the deeply discussed drop of S Δ T and rise of S Δ P with Re (Figure 6 and Figure 7). On the other hand, analyses show that local Bejan numbers increase with both heat flux and micro-pipe diameter. The rise of Be due to q can be attributed not only to the q dependent grow of S Δ T but also the unvarying nature of S Δ P with q . Whereas the role of d on Be identifies the decay of S Δ P , thus viscous losses, and the featured behavior of S Δ T with the depart from the micro-flow character (d→1.00 mm). By comparing the wall (r/R = 1) Bejan number values at different ranks of surface heat flux, Reynolds number and micro-pipe diameter through Equations 20a-b, can provide a deeper insight into the mechanism of Be .
ζ 1 = ( Be ) q = 2000 W/m 2 ( Be ) q = 1000 W/m 2     ζ 2 = ( Be ) d = 1.00 mm ( Be ) d = 0.50 mm
Computations show that as ζ1 gets the values of 1.94, 3.31 and 3.94 for Re = 100, 1,000 and 2,000, respectively at d = 1.00 mm, they become 1.94, 3.81 and 4.29 at d = 0.75 mm and 1.94, 4.24 and 5.65 at d = 0.50 mm. Since surface heat flux is not influential on frictional entropy generation (Figure 7Table 2), ζ1 is mainly structured by the variation of thermal entropy rates. The rising impact of q on Be with higher Re puts forward that the elevating role of q on S Δ T is dominant to the suppressing function of Re on S Δ T . Besides, ζ1 also shows that the variation of Be with q becomes enhanced at low d, interpreting that the bridling function of q on S Δ T is dominant to that of d on S Δ T .
Figure 8. Variation of radial Be distributions with Re and q for the micro-pipe diameters of (a) d = 1.00 mm, (b) d = 0.75 mm and (c) d = 0.50 mm.
Entropy 12 00445 g008
The above findings completely enlighten the chief configurative stance of heat flux among the characterizing parameters of Bejan number in micro-pipe flows. It can additionally be extracted from ζ1 that, the overall scheme of the above defined characteristic actions on Be is more significant in the Reynolds number range of Re = 100–1,000; for Re > 1,000 the momentum of the augmenting role decreases. This evaluation puts forward that the exhibited functions is more decisive in laminar flow. On the other hand, ζ2 figures out the potential of micro-pipe diameter on Bejan number with the descriptive numbers of 1.00, 17.36 and 29.55 for Re = 100, 1,000 and 2,000 at q = 1,000 W/m2 and1.00, 13.56 and 20.60 at q = 2,000 W/m2. ζ2 puts forward complementary indicators, not only identifying the more noticeable role of micro-pipe diameter on Bejan number in scenarios with high Reynolds number and low heat flux but also pointing out the comprehensive motivation of micro-pipe diameter on Bejan number in the Reynolds number range of Re = 100–1,000.

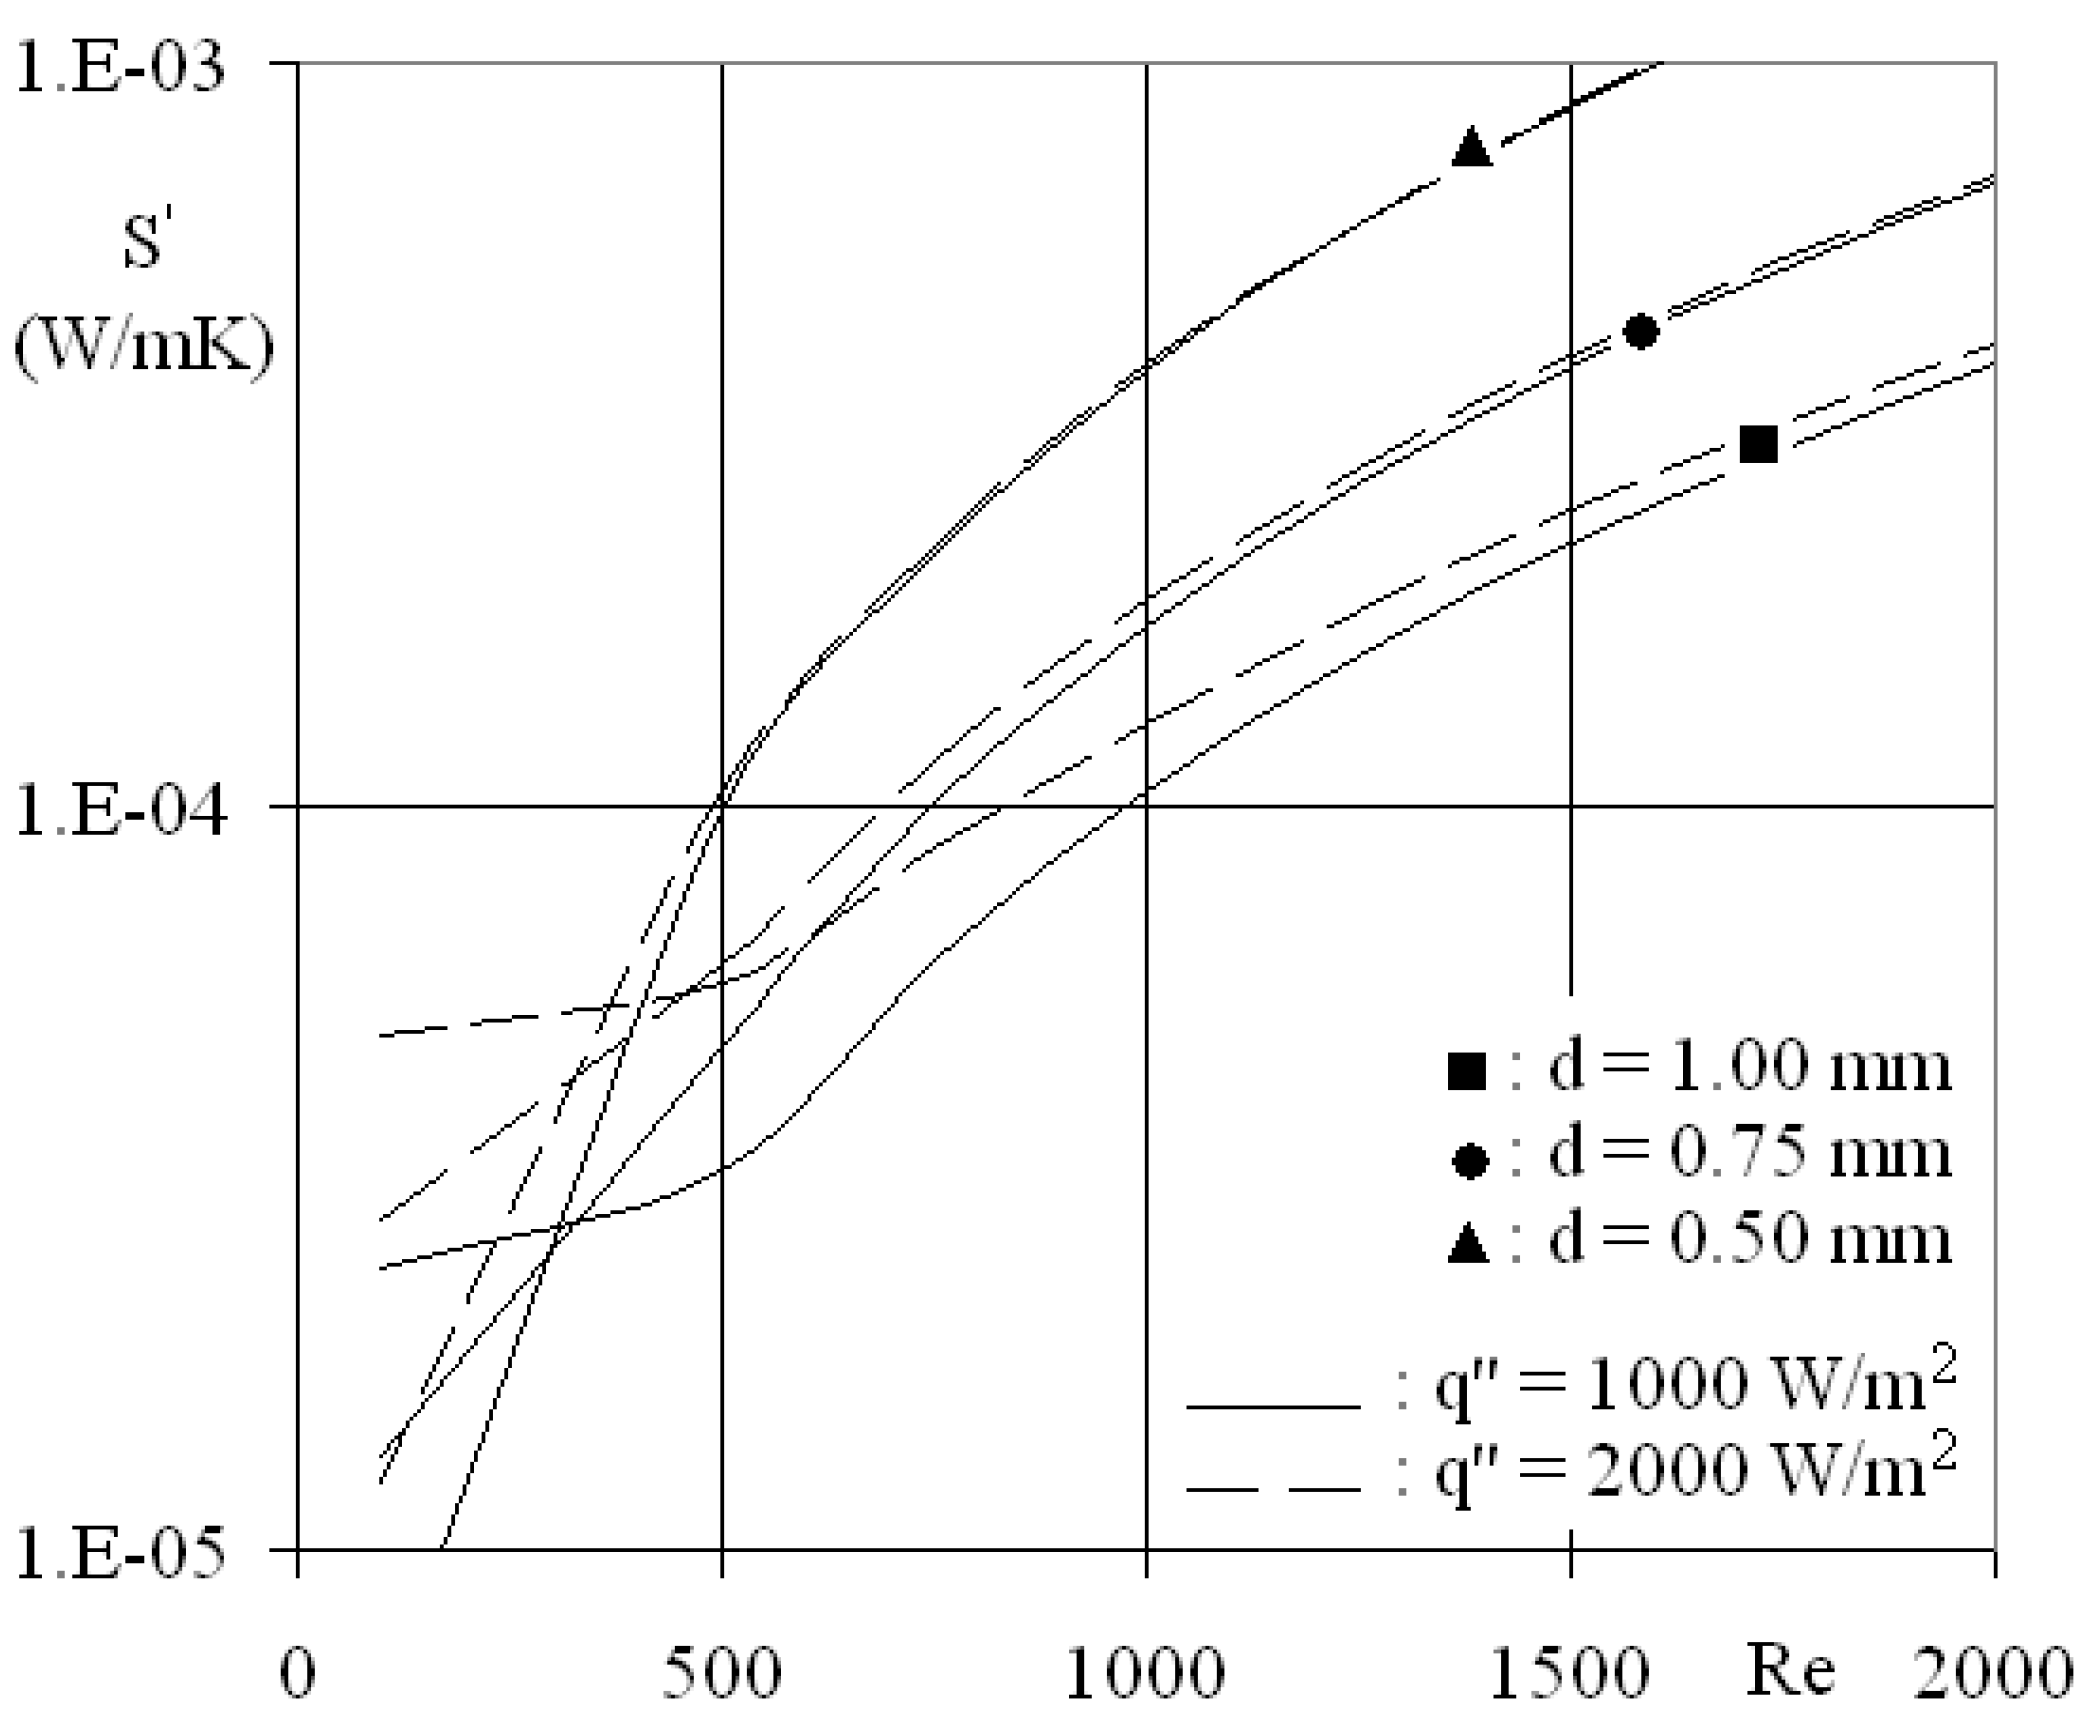
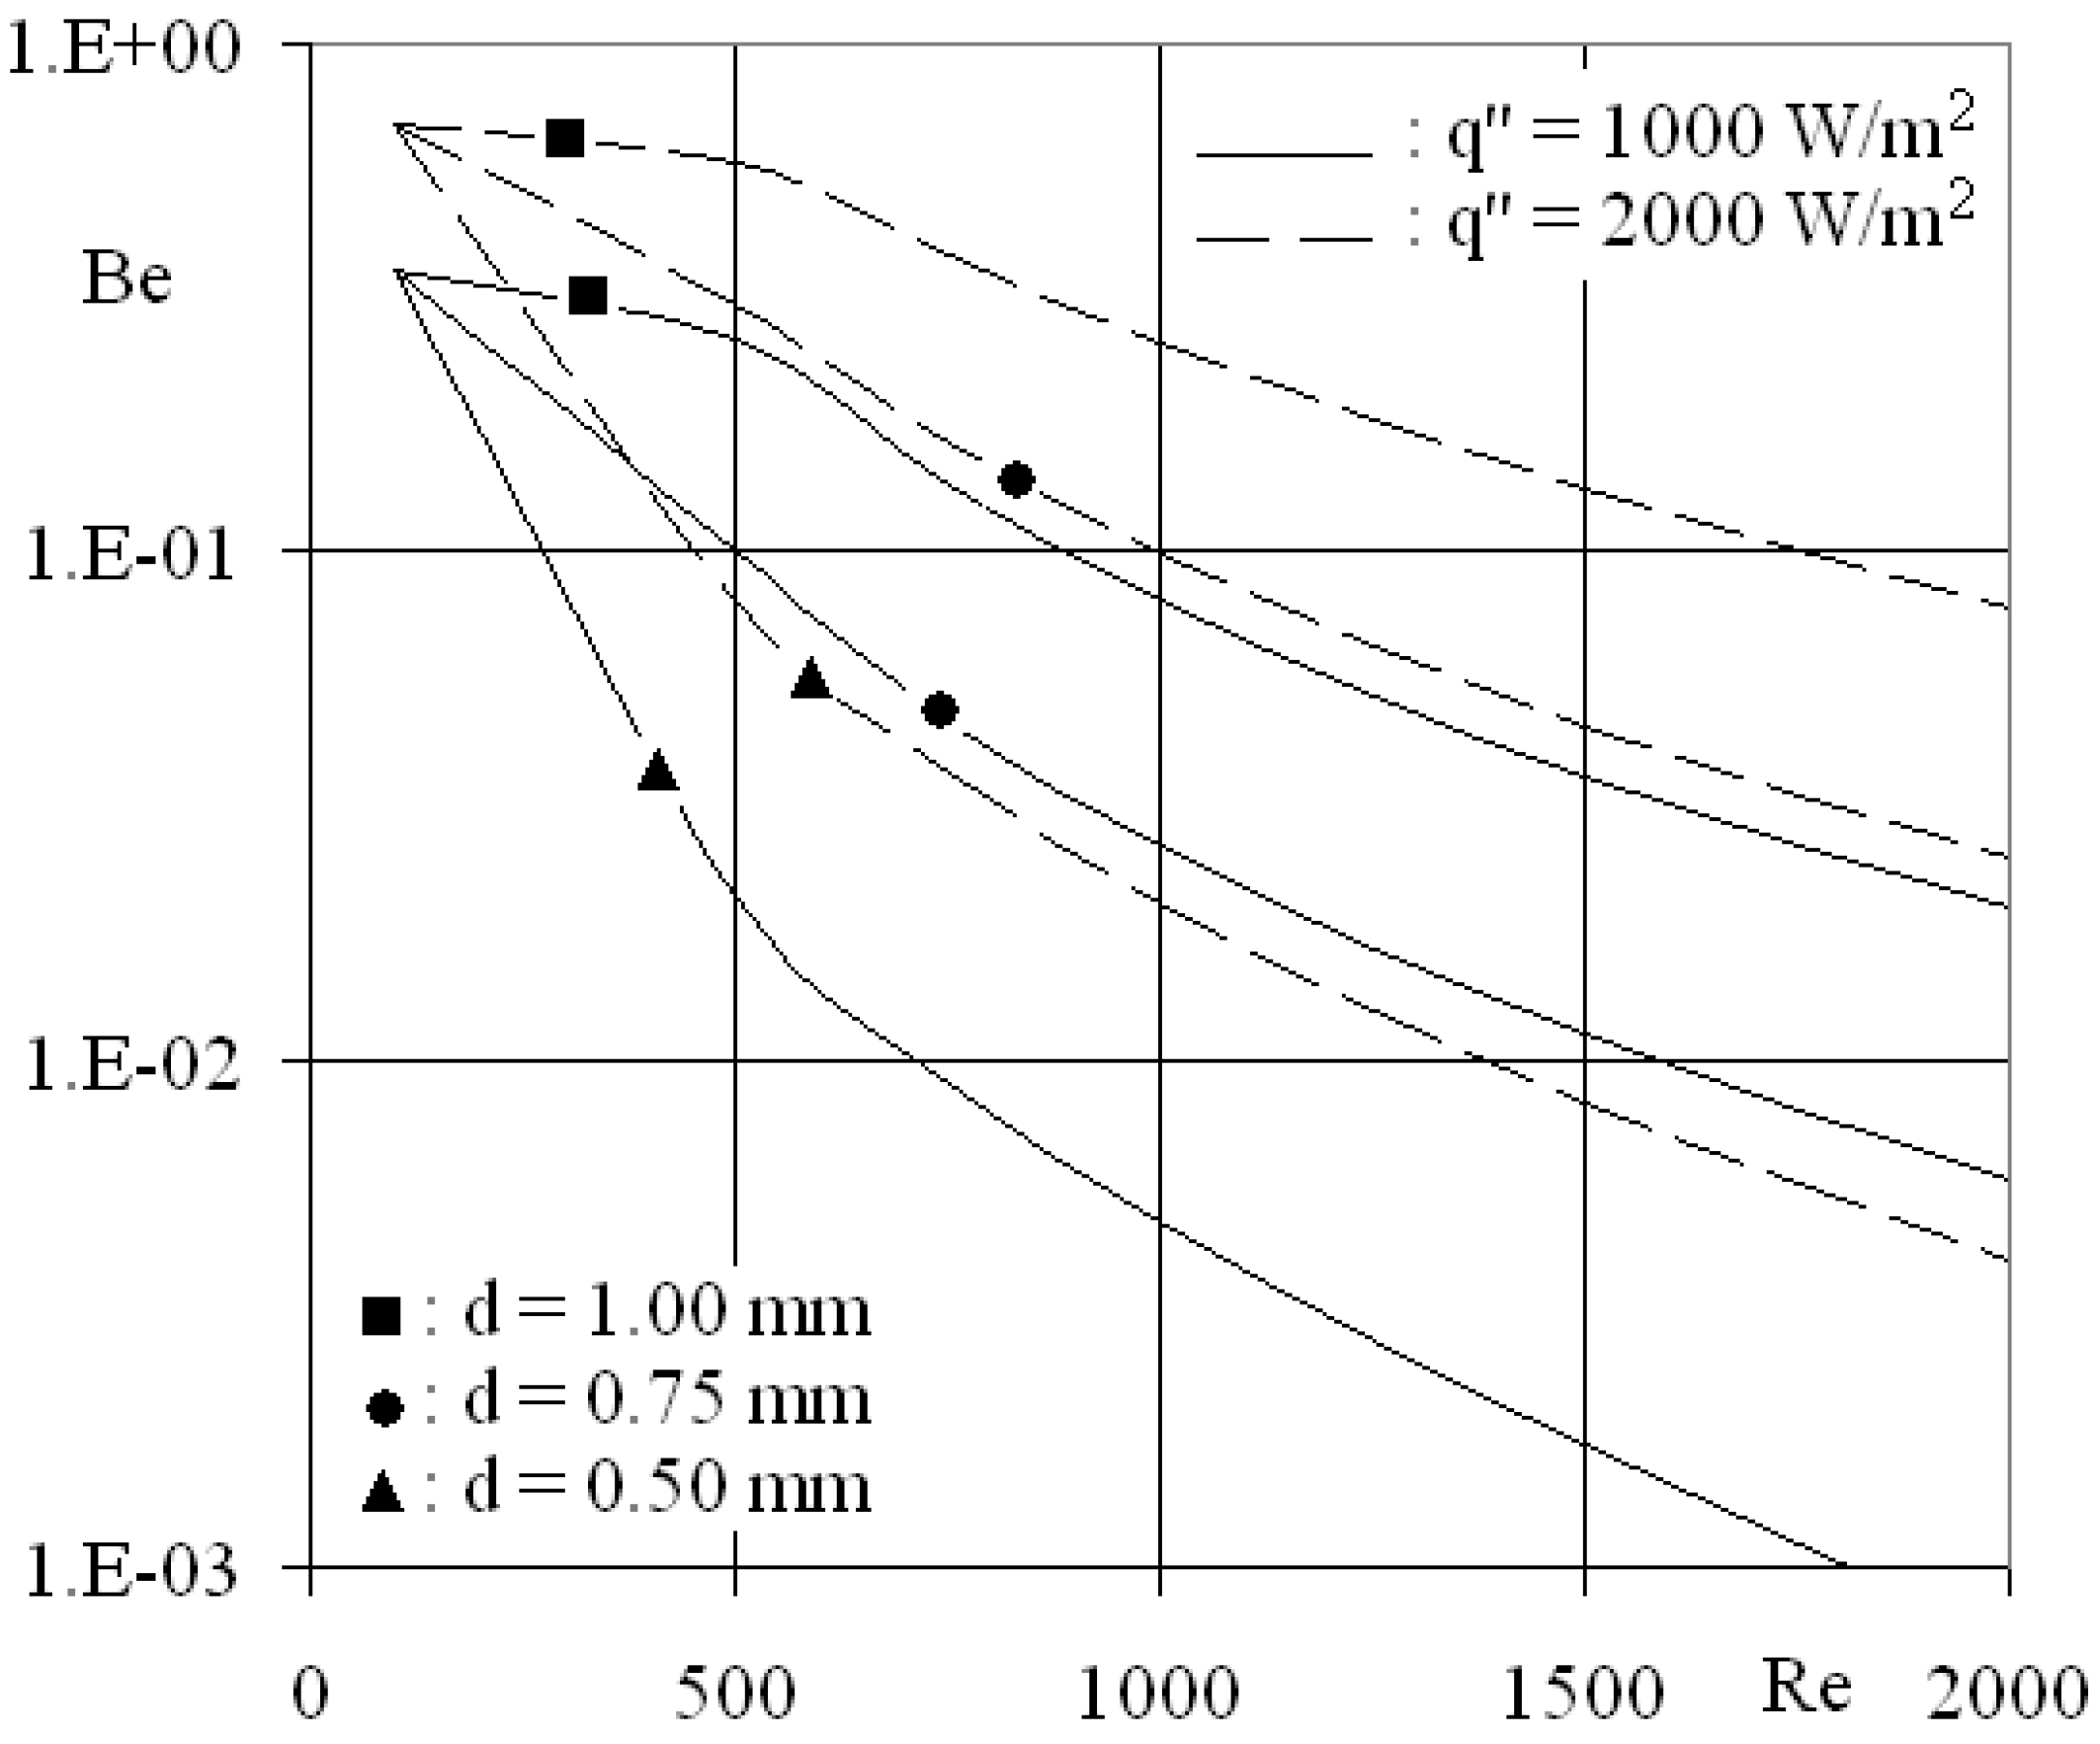
3.2.2. Characteristic parameters

Figure 9 displays the cross-sectional total entropy generation ( S ) in the micro-pipe for various surface heat flux, Reynolds number and diameter cases. The grow of S with q is completely dependent on the rise of S Δ T with q (Figure 6), due to the unnoticeable change in frictional entropy generation at different levels of heat flux (Figure 7Table 2). Besides, the superior S in flows with lower d can be interrelated not only with the forced S Δ P values at low d but also with the overwhelming increase of S Δ P to the decrease rate of S Δ T in lower micro-pipe diameters. On the other hand, the augmentation of total entropy generation at high Reynolds numbers can be attributed to the dominant progress of frictional entropy generation to the decline of thermal entropy generation towards the upper Reynolds number limit of the present work. The rise of the entropy values with Reynolds number were also reported by Lin and Lee [25] for heat exchangers, by Rakshit and Balaji [28] for a finned channel flow and by Zimparov [29] for a constant wall temperature duct flow.
To identify the individual and integrated influences of q , Re and d on S , the following parameters of λ1 and λ2 are defined (Equations 21 a and b). Calculations resulted in the λ1 values of 2.07, 1.02 and 1.00 for for Re = 100, 1,000 and 2,000, respectively at d = 0.50 mm and 2.07, 1.08 and 1.02 at d = 0.75 mm and 2.07, 1.24 and 1.06 at d = 1.00 mm. Whereas those of λ2 come out to be, for the identical Reynolds numbers, as 4.00, 0.27 and 0.25 at q = 1,000 W/m2 and 4.00, 0.33 and 0.27 at q = 2,000 W/m2. It can be identified from λ1 that the impact of q on S is more sensible in scenarios with low Re and high d. This output can be explained by the simultaneous presence of unvarying S Δ P with q and stimulated S Δ T with low Re and high d.
λ 1 = ( S ) q = 2000 W/m 2 ( S ) q = 1000 W/m 2    λ 2 = ( S ) d = 1.00 mm ( S ) d = 0.50 mm
Furthermore, λ2 additionally clarifies the notable contribution of d on S at high q with low Re. Moreover, the almost heat flux independent character of the micro-pipe diameter effect on cross-sectional total entropy generation (λ2 = 0.25–0.27) at high Reynolds numbers can be confirmed by not only with the predominant S Δ P composition in S but also through the decrease of Be with high Re (Figure 8). Since entropy generation is a fundamental scientific indicator of the amount of thermodynamic irreversibilities, the present foresights on the simultaneous actions and roles of Reynolds number, pipe diameter and surface heat flux on the second-law characteristics of micro-pipe flows can be considered as guiding tools in handling the second-law efficiency aspects of micro-level power generation systems or turbomachines, such as gas turbines, compressors, turbines and nozzles.
Figure 9. Variation of S’ with Re, d and q .
Entropy 12 00445 g009
Figure 10. Variation of Be with Re, d and q .
Entropy 12 00445 g010
Variation of cross-sectional average Bejan numbers with surface heat flux, Reynolds number and micro-pipe diameter is given in Figure 10. As expected from the findings and discussions through Figure 8, Bejan number decreases with high Reynolds number and low micro-pipe diameter and heat flux. To provide a deeper inspection into the second-law mechanism of Be, based on flow (Re), thermal ( q ) and structural (d) components, Equations 22a-b are defined in terms of the employed scenarios.
π 1 = ( Be ) q = 2000  W/m 2 ( Be ) q = 1000  W/m 2     π 2 = ( Be ) d = 1.00 mm ( Be ) d = 0.50 mm
π1 attains the almost identical values of ζ1 ( Be ) as 1.93, 3.25 and 3.90 for Re = 100, 1,000 and 2,000, respectively at d = 1.00 mm, and 1.93, 3.78 and 4.28 at d = 0.75 mm and 1.93, 4.23 and 5.65 at d = 0.50 mm. The similarity of π1 and ζ1 exposes that the impact of q on the local value of Be at r/R = 1 and on the complete Be variation for r/R = 0→1 is mostly matching. On the other hand, π2 data differ from those of ζ2, especially at the high Reynolds number range of Re = 1,000–2,000. At q = 1,000 W/m2, π2 are evaluated as 1.00, 16.77 and 28.05 for Re = 100, 1,000 and 2,000 and become 1.00, 12.86 and 19.35 at q = 2,000 W/m2. The slightly lower (<6%) view of π2 than ζ2 puts forward that the effectiveness of the extreme centerline Be values (Figure 8) on Be becomes more recognizable in flows with low micro-pipe diameter. Indeed this record is quite significant to designate the flow and thermal fundamentals and thermodynamic interactivity of the radial variations of S Δ T , S Δ P and Be , and also the cross-sectional average Bejan number of Be as well.

4. Conclusions

Temperature dependent property continuity, momentum and energy equations are simultaneously solved to computationally investigate the flow, heat transfer and second-law characteristics of laminar-transitional micro-pipe flows. The combined effects of pipe diameter, Reynolds number and wall heat flux are presented and discussed in detail.
Analyses on flow characteristics resulted in the following main findings: Friction coefficients increase with higher Reynolds number and/or lower micro-pipe diameter, with comprehensive velocity profile deviations from the laminar profile. As the center velocity values decrease, due to the rise of wall velocity gradients, non-dimensional friction coefficients transform towards the transition with the interpreting figures of Cf* = 1.006→1.007 (d = 1.00→0.50 mm) at Re = 100, Cf* = 1.028→1.038 at Re = 500, Cf* = 1.063→1.075 at Re = 1,000 and Cf* = 1.088→1.116 at Re = 1,500. Towards the transition regime, shape factor data drop below the laminar regime indicator of H = 3.36 and the intermittency elevates. As the combined influence of micro-structure and surface roughness cause earlier transition at the descriptive Reynolds numbers of Retra = 1,656, 1,607, 1,491, 1,341 and 1,272 at d = 1.00, 0.90, 0.75, 0.60 and 0.50 mm respectively, the boundary layer parameters appear in the ranges of H = 3.133→3.159 and γ = 0.137→0.121 (d = 1.00→0.50 mm).
Analyses on heat transfer characteristics identified the following primary issues: The wall temperature gradients are evaluated to rise with lower micro-pipe diameter and higher Reynolds number; besides energy loss come out to be notably excited in these scenarios . Energy loss values additionally rise at lower heat flux applications; moreover the impact of surface heat flux on energy loss is determined to grow at higher Reynolds number and lower micro-pipe diameter. Due to the direct relation of Reynolds number and mass flow rate, Reynolds number inversely motivates the temperature rise of water in the streamwise direction. Heat transfer rates are determined to increase in flows with lower micro-pipe diameters and higher Reynolds numbers. The growing impact of the micro-structure on the heat transfer activity at high Reynolds numbers is revealed by the Nud=0.50 mm/Nud=1.00 mm ratios of 1.065, 1.126, 1.181 and 1.231 at Re = 500, 1,000, 1,500 and 2,000 respectively. Moreover, at the transition onset, Nusselt numbers are computed to augment above the typical laminar value (Nulam = 4.25) by 30→40% (d = 1.00→0.50 mm), pointing out the rising strength of micro-flow affects on the heat transfer mechanism at lower micro-pipe diameters.
Analyses on second-law characteristics pointed out the following essential items: It is determined that, at low Reynolds numbers (Re = 100), the augmenting capacity of heat flux on local thermal entropy generation is almost fixed in the complete micro-pipe diameter range of d = 0.50–1.00 mm; however the influence grows with both high Reynolds number and low micro-pipe diameter. Due to the intensity of the velocity gradients, local frictional entropy generation rises towards the pipe walls. Computations exhibited a synergy imposed on local frictional entropy generation with the combined action of higher Reynolds number and lower micro-pipe diameter. The promoted cross-sectional total entropy generation values in lower micro-pipe diameter flows can be attributed not only to the forced local frictional entropy generation with lower diameters but also to the overwhelming increase of local frictional entropy generation to the decrease rate of local thermal entropy generation in lower micro-pipe diameters. In scenarios with high Reynolds numbers and low micro-pipe diameters and heat flux levels, Bejan numbers are monitored to noticeably decrease. In flows with low micro-pipe diameter, local Bejan numbers, around the centerline vicinity, are comprehensively decisive on the cross-sectional average Bejan numbers, which is relatively important from the point of thermodynamic interactivity of the radial variations of local thermal and frictional entropy generation rates and local and cross-sectional average Bejan numbers.
NomenclatureGreek Symbols
acurve fit constantsεroughness amplitude (mm)
Across sectional area (m2)εnon-dimensional surface roughness (=ε/d)
Cffriction coefficientδiKronecker unit tensor
Cf*normalized friction coefficientκfthermal conductivity of fluid (W/mK)
Cpspecific heat (J/kgK)γintermittency
ddiameter (m)μdynamic viscosity (Pa.s)
ΔTtemperature rise of flow (K)νkinematic viscosity (m2/s)
einternal energy per unit mass (J/kg)θperipheral direction
fε(z)surface roughness model functionρdensity (kg/m3)
hconvective heat transfer coefficient (W/m2K)τshear stress (Pa)
Hshape factorξwater properties
kkinetic energy per unit mass (J/kg)Ψlossenergy loss (W)
Lpipe length (m)ωroughness period (mm)
m . mass flow rate (kg/s)ω’roughness periodicity parameter (=ω/ε)
NuNusselt numberSubscripts
Pstatic pressure (Pa)
q surface heat flux (W/m2)ccenter
q r radial heat flux (W/m2)crcritical
q z axial heat flux (W/m2)ΔPfrictional
Qstotal surface heat transfer (W)ΔTthermal
rradial directionhhydraulic
Rradius (m)in, exinlet, exit
ReReynolds numberlamlaminar
S cross-sectional total entropy generation (W/mK)omean
ttime (s)r, θ, zradial, peripheral, axial
Ttemperature (K)
Uzaxial velocity (m/s)s, wsurface, wall
V velocity vector (m/s)ththermal
zaxial directiontratransitional
turbturbulent
Superscripts
local rate
Ttemperature dependency

Acknowledgments

This work is supported by the Research Fund of the University of Uludag through project number: M(U)-2009/35.

References

  1. Kolb, G.; Schurer, J.; Tiemann, D. Fuel processing in integrated micro-structured heat-exchanger reactors. J. Power Source. 2007, 171, 198–204. [Google Scholar]
  2. Fan, M.Q.; Sun, L.X.; Xu, F. Feasibility study of hydrogen generation from the milled al-based materials for micro fuel cell applications. Energy Fuels 2009, 23, 4562–4566. [Google Scholar]
  3. Dau, V.T.; Dinh, T.X.; Tanaka, K. Design and simulation of a valveless micro pump. J. Adv. Mech. Des. Syst. Manuf. 2009, 3, 69–75. [Google Scholar]
  4. Riccio, G.; Chiaramonti, D. Design and simulation of a small polygeneration plant cofiring biomass and natural gas in a dual combustion micro gas turbine (BIO_MGT). Biomass Bioenerg. 2009, 33, 1520–1531. [Google Scholar] [CrossRef]
  5. Guo, Z.Y.; Li, Z.X. Size effect on microscale single-phase flow and heat transfer. Int. J. Heat Mass Transfer 2003, 46, 149–159. [Google Scholar] [CrossRef]
  6. Celata, G.P.; Lorenzini, M.; Morini, G.L.; Zummo, G. Friction factor in micropipe gas flow under laminar, transition and turbulent flow regime. Int. J. Heat Fluid Flow 2009, 30, 814–822. [Google Scholar] [CrossRef]
  7. Ogedengbe, E.O.B.; Naterer, G.F.; Rosen, M.A. Slip flow irreversibility of dissipative kinetic and internal energy exchange in microchannels. J. Micromech. Microeng. 2006, 16, 2167–2176. [Google Scholar] [CrossRef]
  8. Engin, T.; Dogruer, U.; Evrensel, C.; Heavin, S.; Gordaninejad, F. Effect of wall roughness on laminar flow of bingham plastic fluids through microtubes. ASME J. Fluids Eng. 2004, 126, 880–883. [Google Scholar] [CrossRef]
  9. Vicente, P.G.; Garcia, A.; Viedma, A. Experimental study of mixed convection and pressure drop in helically dimpled tubes for laminar and transition flow. Int. J. Heat Mass Transfer 2002, 45, 5091–5105. [Google Scholar] [CrossRef]
  10. Kandlikar, S.G.; Joshi, S.; Tian, S. Effect of surface roughness on heat transfer and fluid flow characteristics at low reynolds numbers in small diameter tubes. Heat Transfer Eng. 2003, 24, 4–16. [Google Scholar] [CrossRef]
  11. Wen, M.Y.; Jang, K.J.; Yang, C.C. Augmented Heat transfer and pressure drop of strip-type inserts in the small tubes. Heat Mass Transfer 2003, 40, 133–141. [Google Scholar] [CrossRef]
  12. Koo, J.; Kleinstreuer, C. Viscous dissipation effects in microtubes and microchannels. Int. J. Heat Mass Transfer 2004, 47, 3159–3169. [Google Scholar] [CrossRef]
  13. Celata, G.P.; Cumo, M.; McPhail, S.; Zummo, G. Characterization of fluid dynamic behaviour and channel wall effects in microtube. Int. J. Heat Fluid Flow 2006, 27, 135–143. [Google Scholar] [CrossRef]
  14. Celata, G.P.; Morini, G.L.; Marconi, V.; McPhail, S.J.; Zummo, G. Using viscous heating to determine the friction factor in microchannels – an experimental validation. Exp. Therm. Fluid Sci. 2006, 30, 725–731. [Google Scholar] [CrossRef]
  15. Morini, G.L. Viscous heating in liquid flows in micro-channels. Int. J. Heat Mass Transfer 2005, 48, 3637–3647. [Google Scholar] [CrossRef]
  16. Obot, N.T. Toward a better understanding of friction and heat/mass transfer in microchannels – a literature review. Microscale Thermophys. Eng. 2002, 6, 155–173. [Google Scholar] [CrossRef]
  17. Wang, H.; Wang, Y.; Zhang, J. Influence of ribbon structure rough wall on the microscale poiseuille flow. ASME J. Fluids Eng. 2005, 127, 1140–1145. [Google Scholar] [CrossRef]
  18. Sheikh, A.K.; Zubair, S.M.; Younas, M.; Budair, M. O. Statistical aspects of fouling processes. Proc. Inst. Mech. Eng. E 2001, 215, 331–354. [Google Scholar] [CrossRef]
  19. Sahin, A.Z.; Zubair, S.M.; Al-Garni, A.Z.; Kahraman, R. Effect of fouling on operational cost in pipe flow due to entropy generation. Energy Convers. Manag. 2000, 41, 1485–1496. [Google Scholar] [CrossRef]
  20. Cao, B.Y.; Chen, M.; Guo, Z. Y. Effect of surface roughness on gas flow in microchannels by molecular dynamics simulation. Int. J. Eng. Sci. 2006, 44, 927–937. [Google Scholar] [CrossRef]
  21. Ozalp, A.A. A Computational study to predict the combined effects of surface roughness and heat flux conditions on converging-nozzle flows. Trans. Can. Soc. Mech. Eng. 2006, 29, 67–80. [Google Scholar]
  22. Ozalp, A.A. Numerical analysis of choked converging nozzle flows with surface roughness and heat flux conditions. Sadhana-Acad. Proc. Eng. 2006, 31, 31–46. [Google Scholar] [CrossRef]
  23. Kotas, T.J.; Mayhew, Y.R.; Raichura, R.C. Nomenclature for exergy analysis. Proc. Inst. Mech. Eng. A 1995, 209, 275–280. [Google Scholar] [CrossRef]
  24. Zimparov, V. Energy conservation through heat transfer enhancement techniques. Int. J. Energy Res. 2002, 26, 675–696. [Google Scholar] [CrossRef]
  25. Lin, W.W.; Lee, D.J. Second-law analysis on wavy plate fin-and-tube heat exchangers. ASME J. Heat Transfer 1998, 120, 797–801. [Google Scholar] [CrossRef]
  26. Ratts, E.B.; Raut, A.G. Entropy generation minimization of fully developed internal flow with constant heat flux. ASME J. Heat Transfer 2004, 126, 656–659. [Google Scholar] [CrossRef]
  27. Sahin, A.Z. Second-law analysis of laminar viscous flow through a duct subjected to constant wall temperature. ASME J. Heat Transfer 1998, 120, 77–83. [Google Scholar] [CrossRef]
  28. Rakshit, D.; Balaji, C. Thermodynamic optimization of conjugate convection from a finned channel using genetic algorithms. Heat Mass Transfer 2005, 41, 535–544. [Google Scholar] [CrossRef]
  29. Zimparov, V. Extended performance evaluation criteria for enhanced heat transfer surfaces: heat transfer through ducts with constant wall temperature. Int. J. Heat Mass Transfer 2000, 43, 3137–3155. [Google Scholar] [CrossRef]
  30. Richardson, D.H.; Sekulic, D.P.; Campo, A. Low reynolds number flow inside straight micro channels with irregular cross sections. Heat Mass Transfer 2000, 36, 187–193. [Google Scholar] [CrossRef]
  31. Ko, T.H. Numerical analysis of entropy generation and optimal reynolds number for developing laminar forced convection in double-sine ducts with various aspect ratios. Int. J. Heat Mass Transfer 2006, 49, 718–726. [Google Scholar] [CrossRef]
  32. Ko, T.H. Numerical investigation of laminar forced convection and entropy generation in a helical coil with constant wall heat flux. Numer. Heat Transfer PT A 2006, 49, 257–278. [Google Scholar] [CrossRef]
  33. Ozalp, A.A. Roughness induced forced convective laminar-transitional micropipe flow: energy and exergy analysis. Heat Mass Transfer 2008, 45, 31–46. [Google Scholar] [CrossRef]
  34. Ozalp, A.A. Entropy analysis of laminar-forced convection in a pipe with wall roughness. Int. J. Exergy 2009, 6, 249–275. [Google Scholar] [CrossRef]
  35. Ozalp, A.A. 1st and 2nd Law characteristics in a micropipe: integrated effects of surface roughness, heat flux and reynolds number. Heat Transfer Eng. 2009, 30, 973–987. [Google Scholar] [CrossRef]
  36. Incropera, F.P.; DeWitt, D.P. Fundamentals of Heat and Mass Transfer; Wiley: New York, NY, USA, 2001. [Google Scholar]
  37. Vijayalakshmi, K.; Anoop, K.B.; Patel, H.E. Effects of compressibility and transition to turbulence on flow through microchannels. Int. J. Heat Mass Transfer 2009, 52, 2196–2204. [Google Scholar] [CrossRef]
  38. White, F.M. Fluid Mechanics; McGraw-Hill: Singapore, 1988. [Google Scholar]
  39. Wu, P.; Little, W.A. Measurement of friction factors for the flow of gases in very fine channels used for microminiature joule–thompson refrigerators. Cryogenics 1983, 23, 273–277. [Google Scholar]
  40. Yu, D.; Warrington, R.; Baron, R.; Ameel, T. An experimental and theoretical investigation of fluid flow and heat transfer in microtubes. In Proceedings of the 4th ASME/JSME Thermal Engineering Conference, Maui, HI, USA, 19th–24th March 1995; ASME: New York, NY, USA; Volume 1, pp. 523–530.
  41. Choi, S.B.; Barron, R.F.; Warrington, R.O. Fluid flow and heat transfer in microtubes. Micromech. Sensor. Actuator. Syst. 1991, 32, 123–134. [Google Scholar]
  42. Kohl, M.J.; Abdel-Khalik, S.I.; Jeter, S.M.; Sadowski, D.L. An experimental investigation of microchannel flow with internal pressure measurements. Int. J. Heat Mass Transfer 2005, 48, 1518–1533. [Google Scholar] [CrossRef]
  43. Li, J.; Peterson, G. P.; Cheng, P. Three-dimensional analysis of heat transfer in a micro-heat sink with single phase flow. Int. J. Heat Mass Transfer 2004, 47, 4215–4231. [Google Scholar] [CrossRef]

