3. Results and Discussion
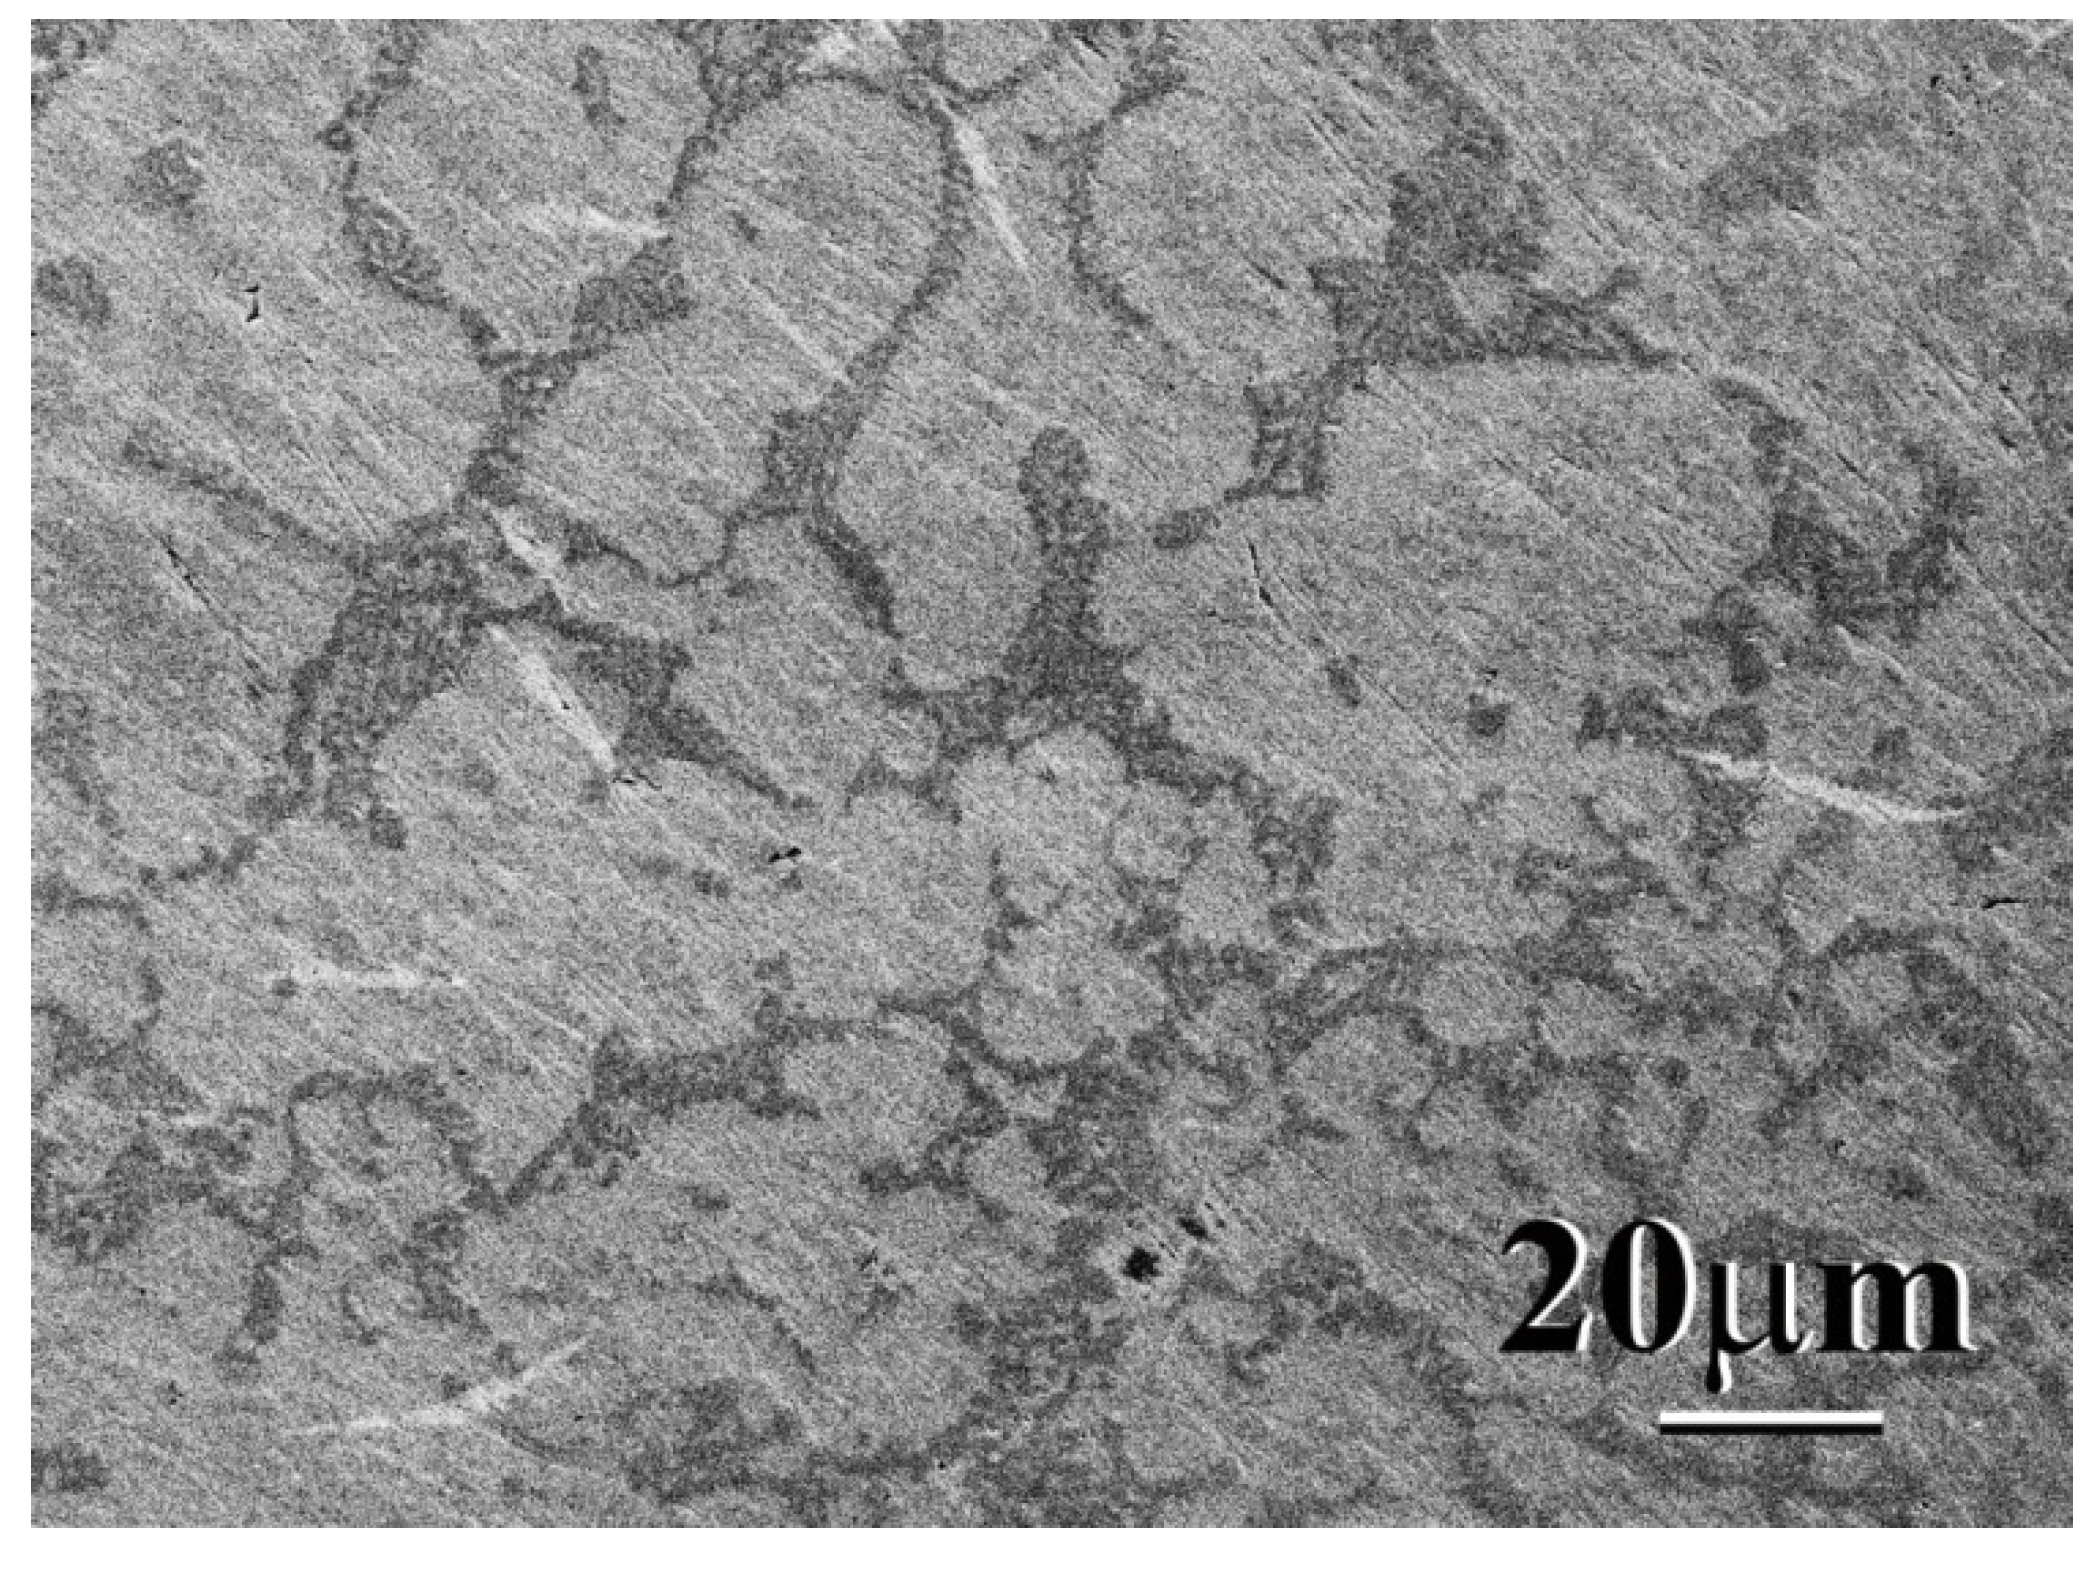
The as-cast TiCrZrNb alloy (the target) had a dendritic microstructure, as shown in
Figure 1. The dendrite shows only a single phase, and the interdendritic region shows an eutectic structure.
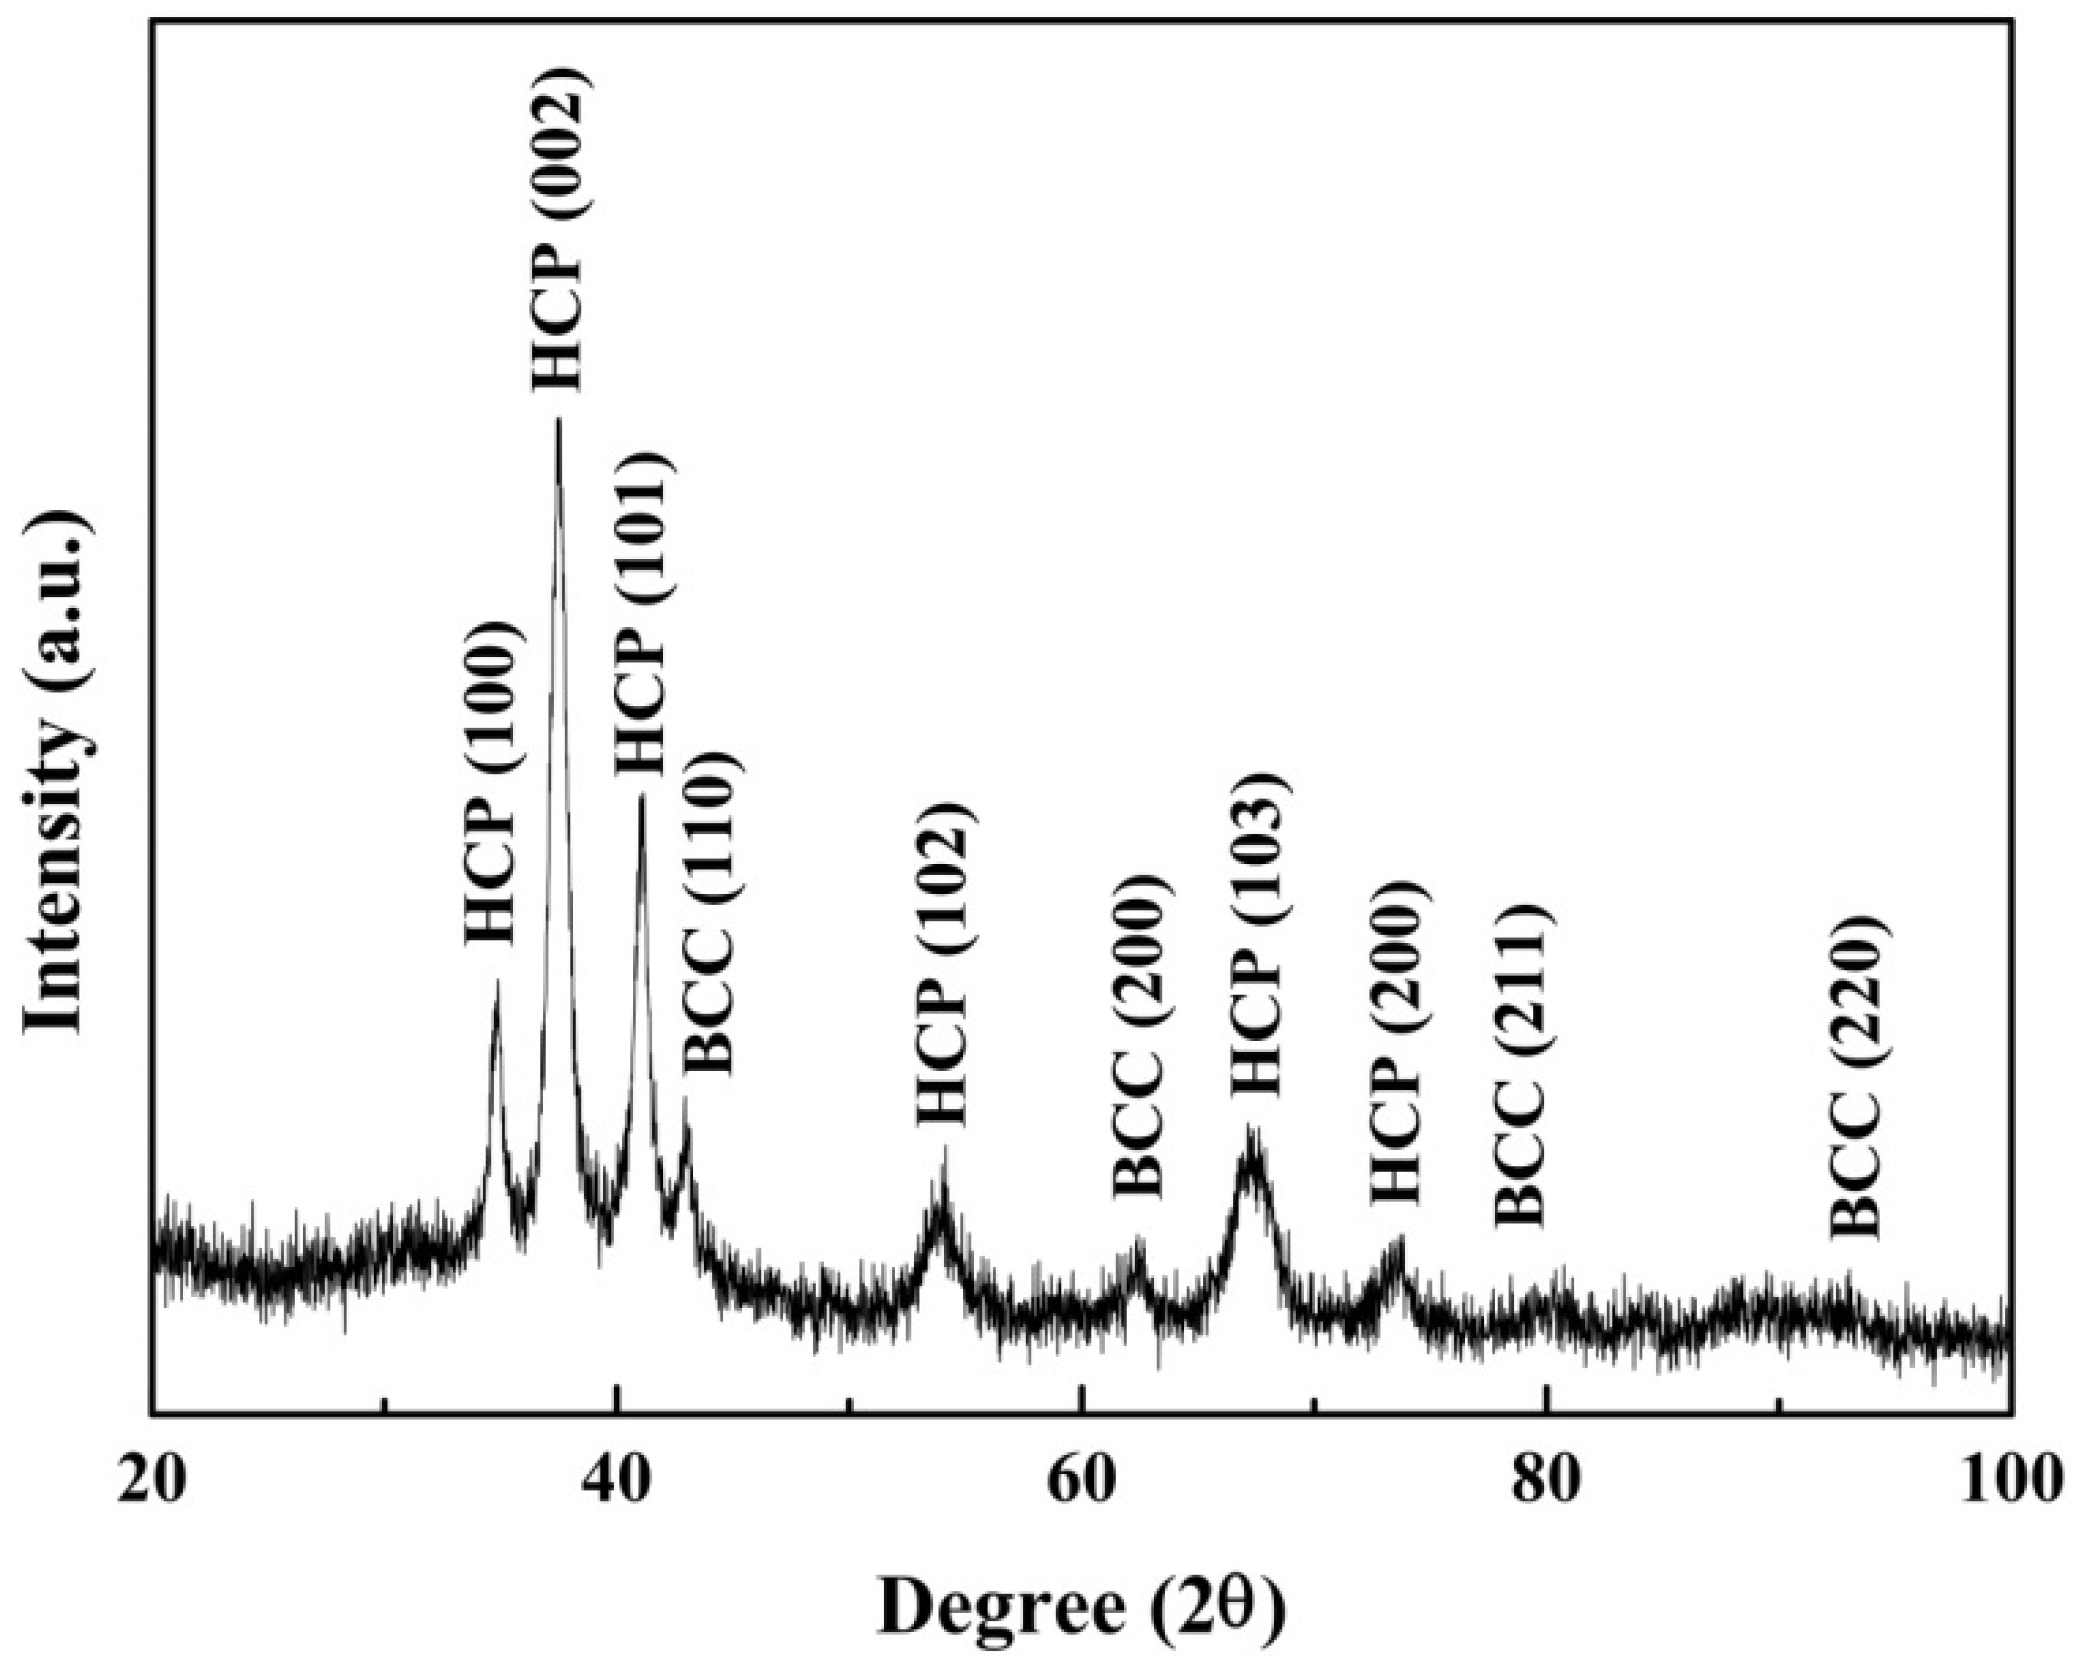
Figure 2 is the XRD diffraction pattern of this as-cast TiCrZrNb alloy, and it indicates that there are two phases existing in this alloy. By comparing the intensities of the XRD peaks and the SEM micrographs, the dendrite was a HCP phase with lattice constants of
a = 0.297 nm and
c = 0.479 nm. The matrix of the interdendritic region was a BCC phase with a lattice constant of 0.298 nm. The lattice constants of the HCP phase were calculated from the peaks of (100) and (002); and the lattice constant of the BCC phase was calculated from the (110) peak. The structure of the particles embedded in the matrix of interdendritic region was HCP phase and had a similar dendritic structure.
Figure 1.
SEM micrograph of as-cast TiCrZrNb alloy.
Figure 1.
SEM micrograph of as-cast TiCrZrNb alloy.
Figure 2.
XRD diffraction pattern of as-cast TiCrZrNb alloy.
Figure 2.
XRD diffraction pattern of as-cast TiCrZrNb alloy.
This study produced alloy nitride thin films of this TiCrZrNb alloy target with a mixing gas of Ar and N
2. The total amount of Ar and N
2 were fixed at 30 sccm, and flow rate of N
2 was varied from 2 to 10 sccm.
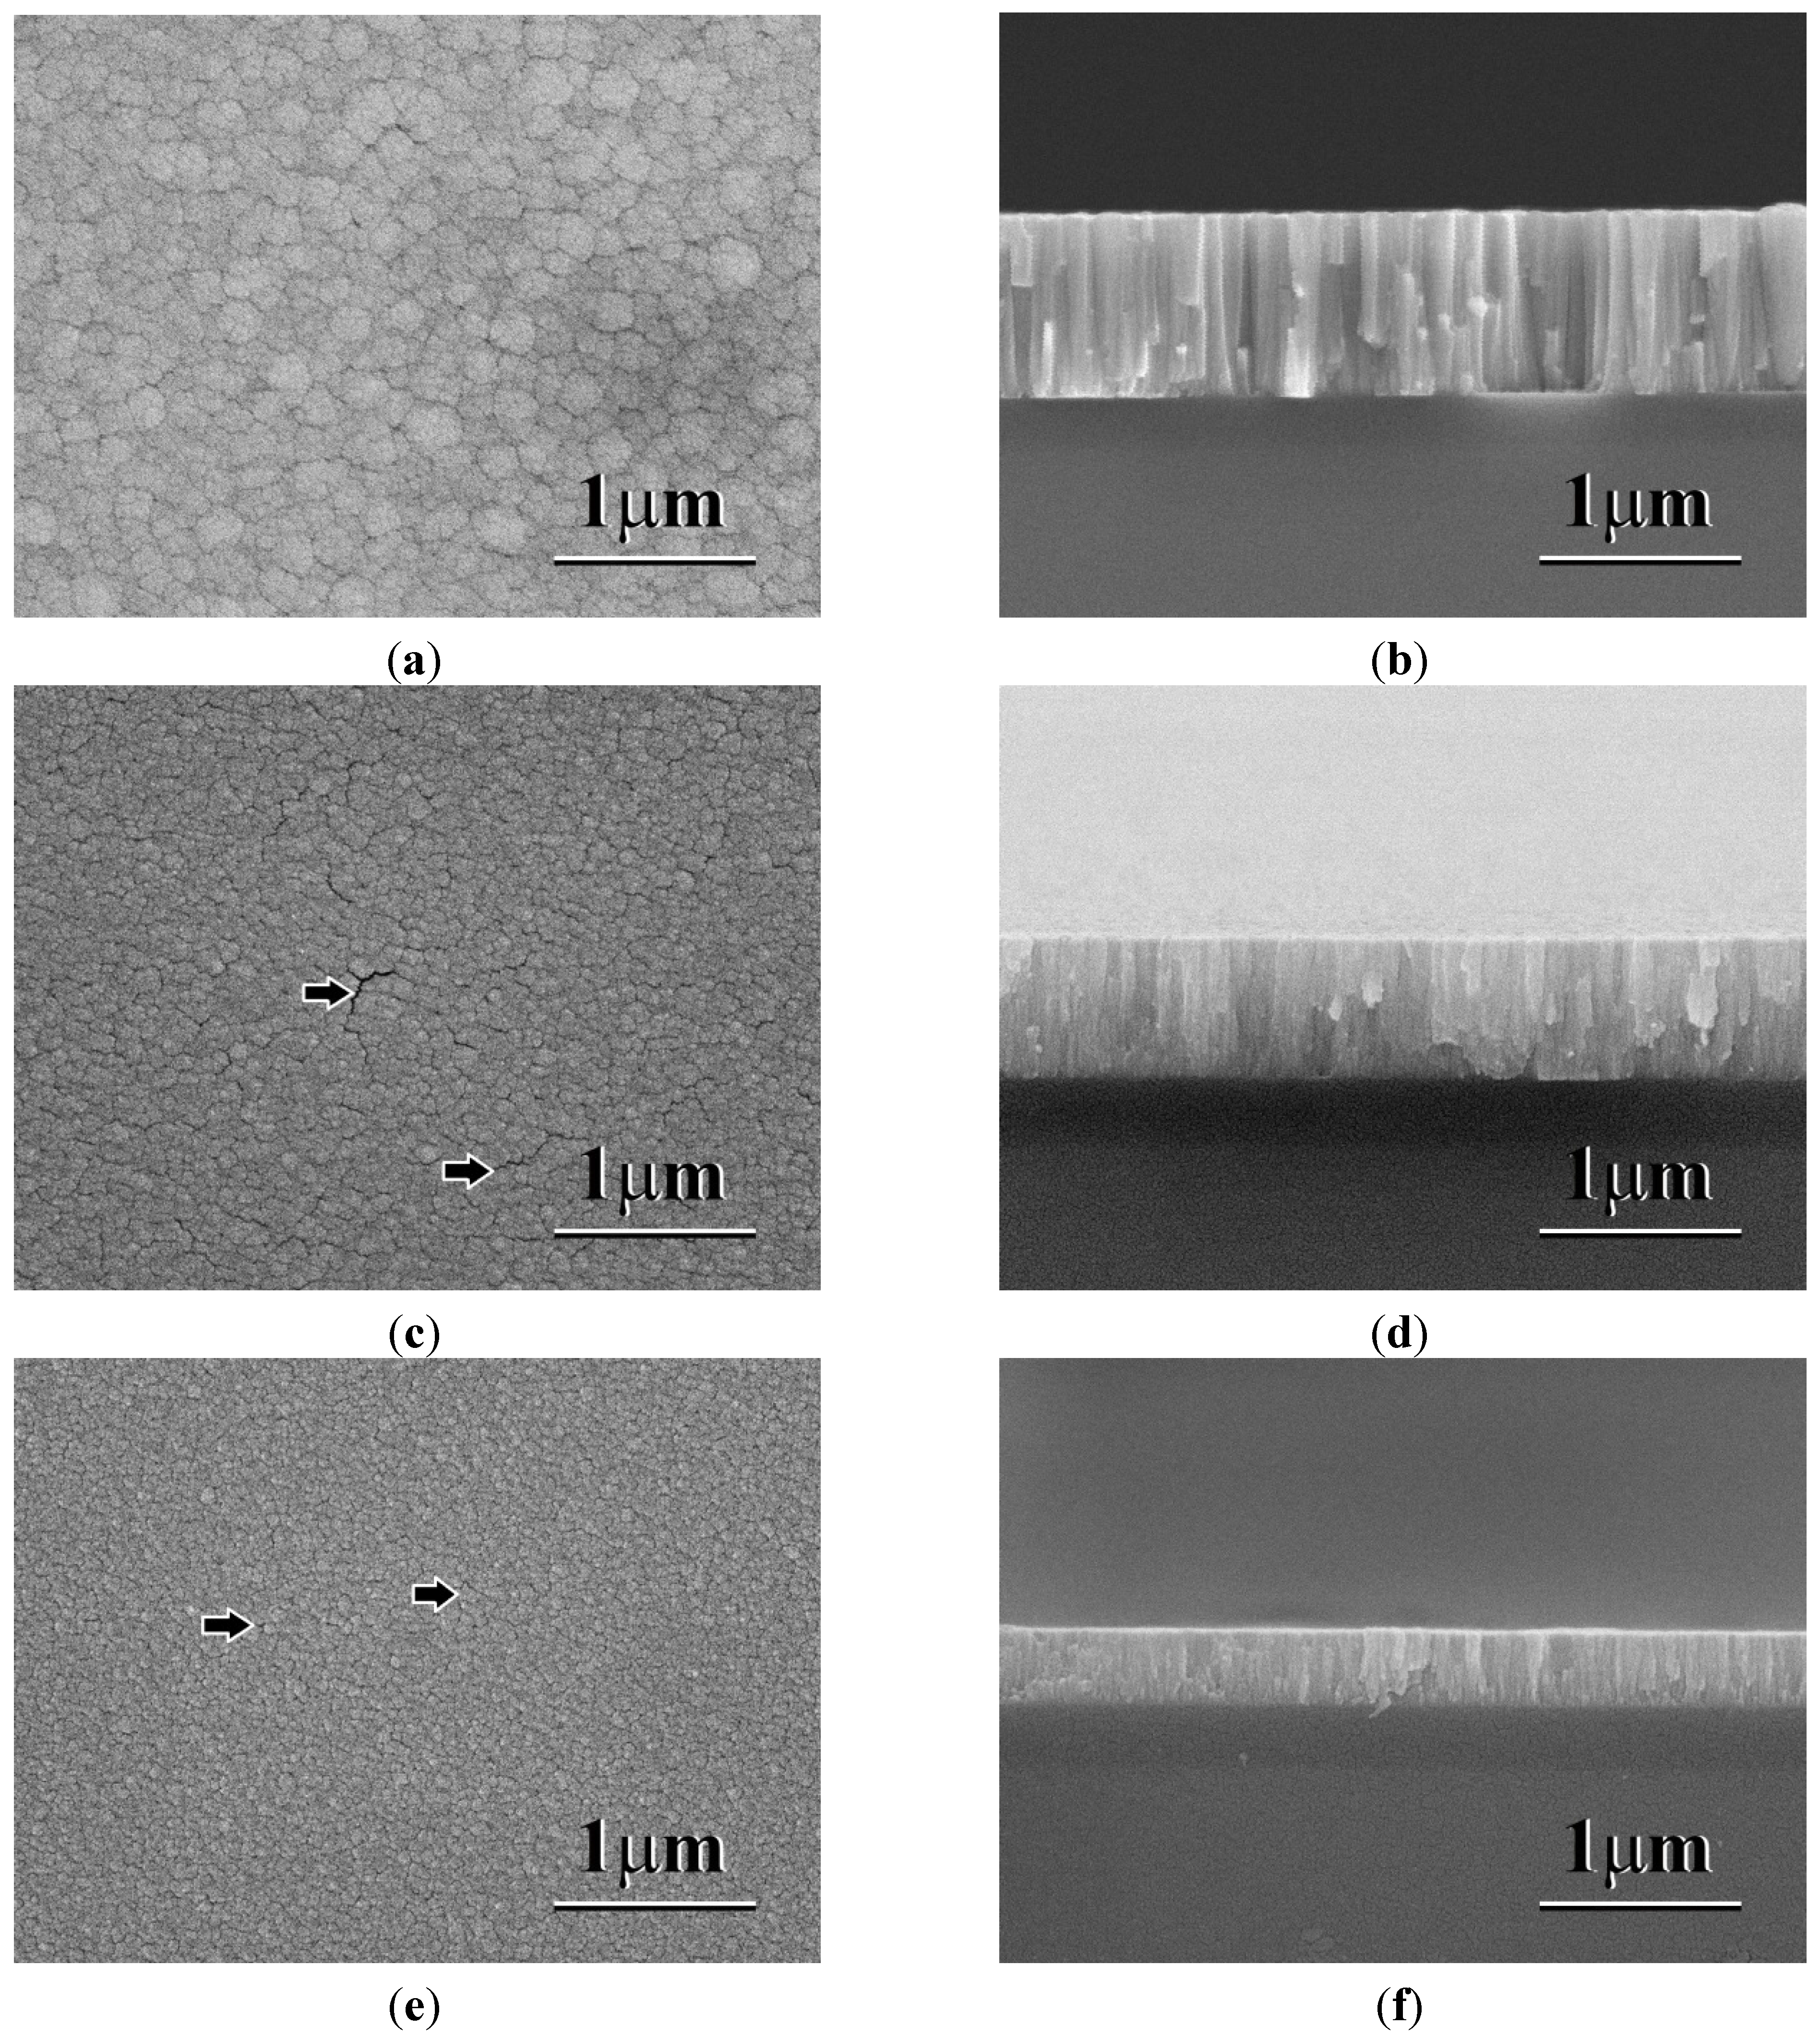
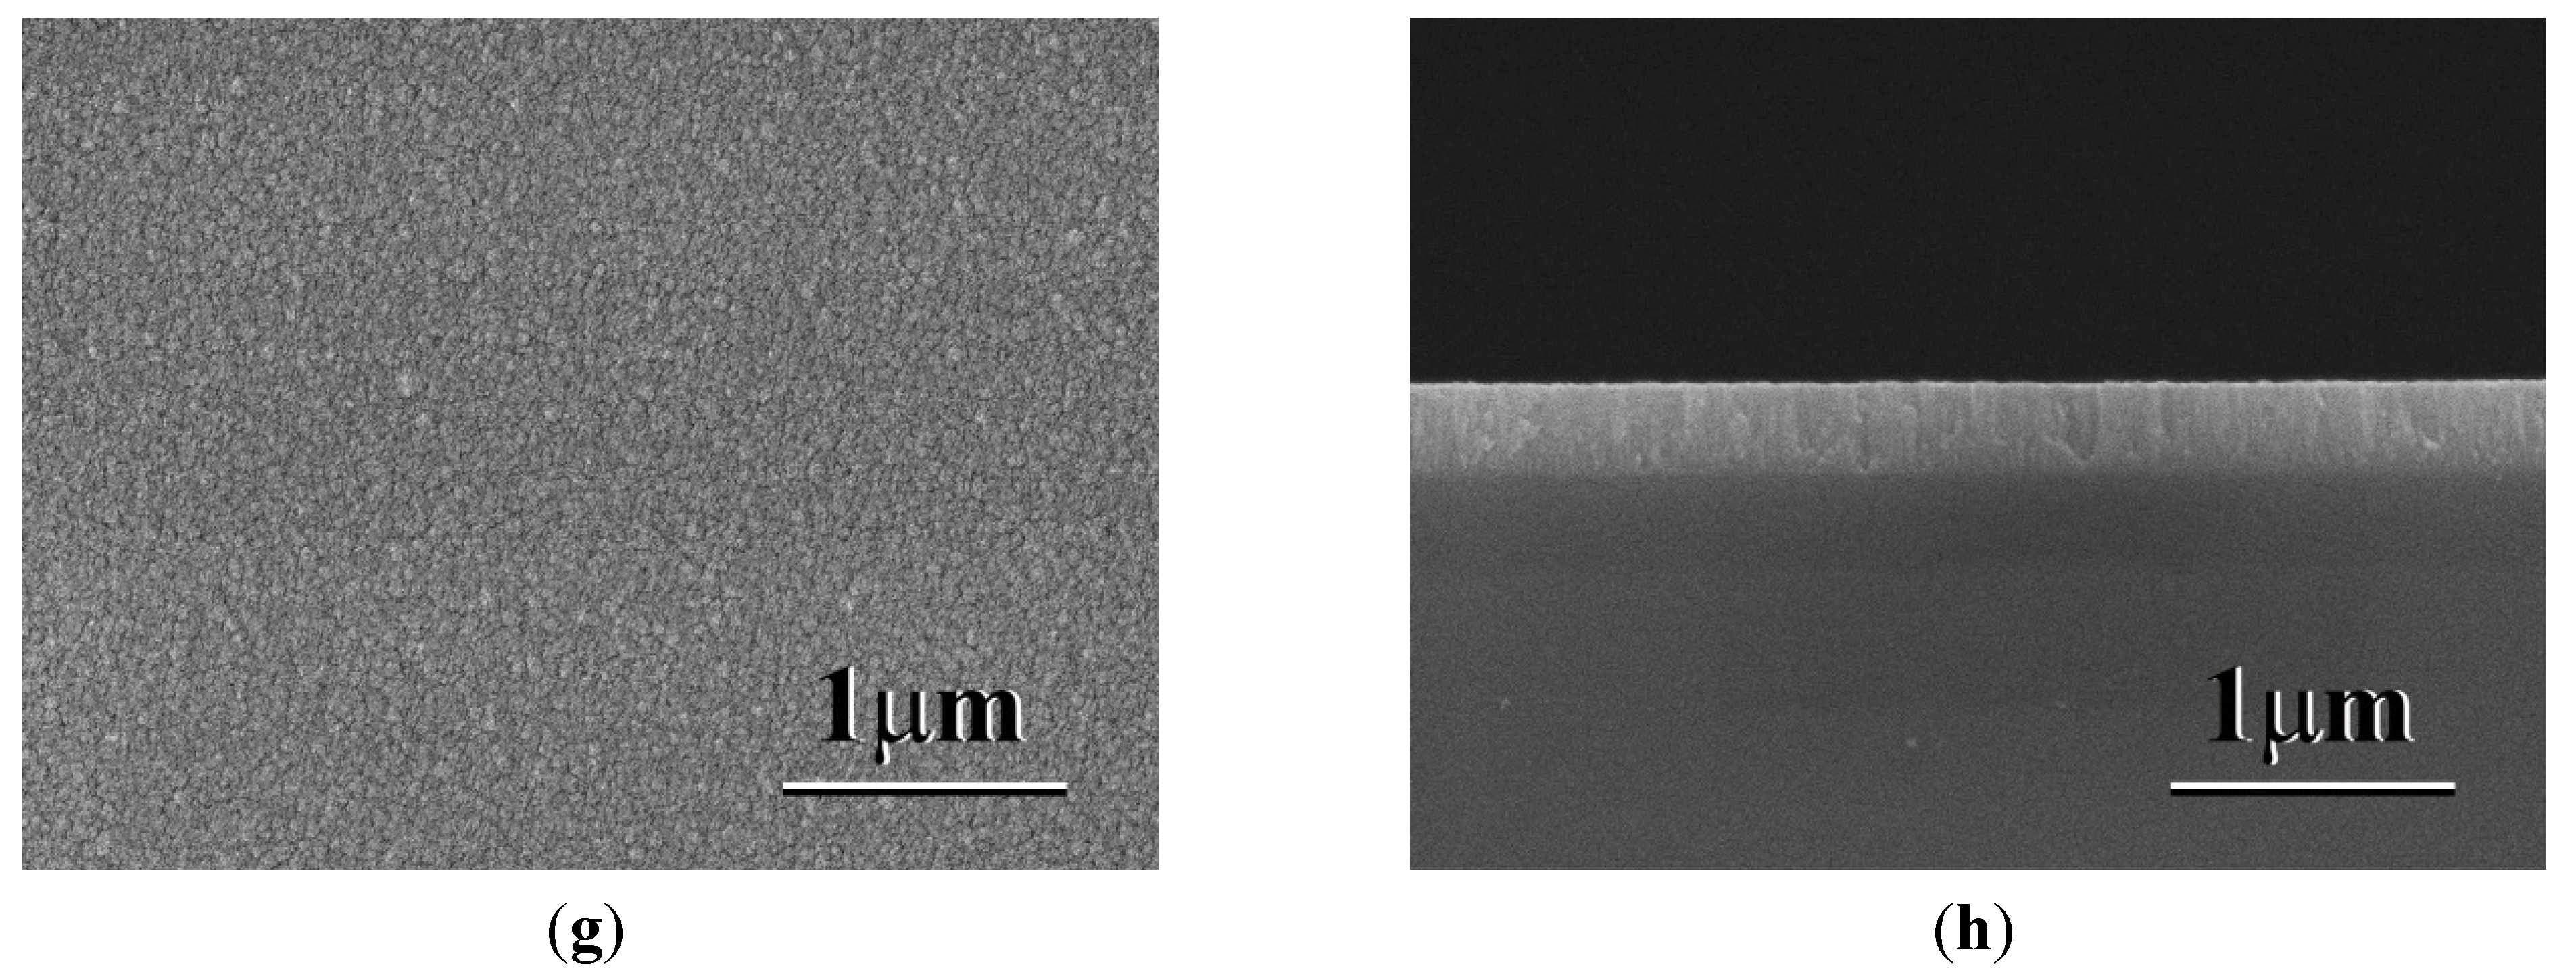
Figure 3 indicates some top view and corresponding cross-section SEM micrographs of the as-deposited TiCrZrNb metallic thin films and TiCrZrNbN
x nitride thin films. The deposition time of these thin films shown in
Figure 3 was 1 h. The metallic thin film was deposited while the atmosphere was Ar, that is, the flow rate of N
2 was zero. All of the top view micrographs of TiCrZrNbN
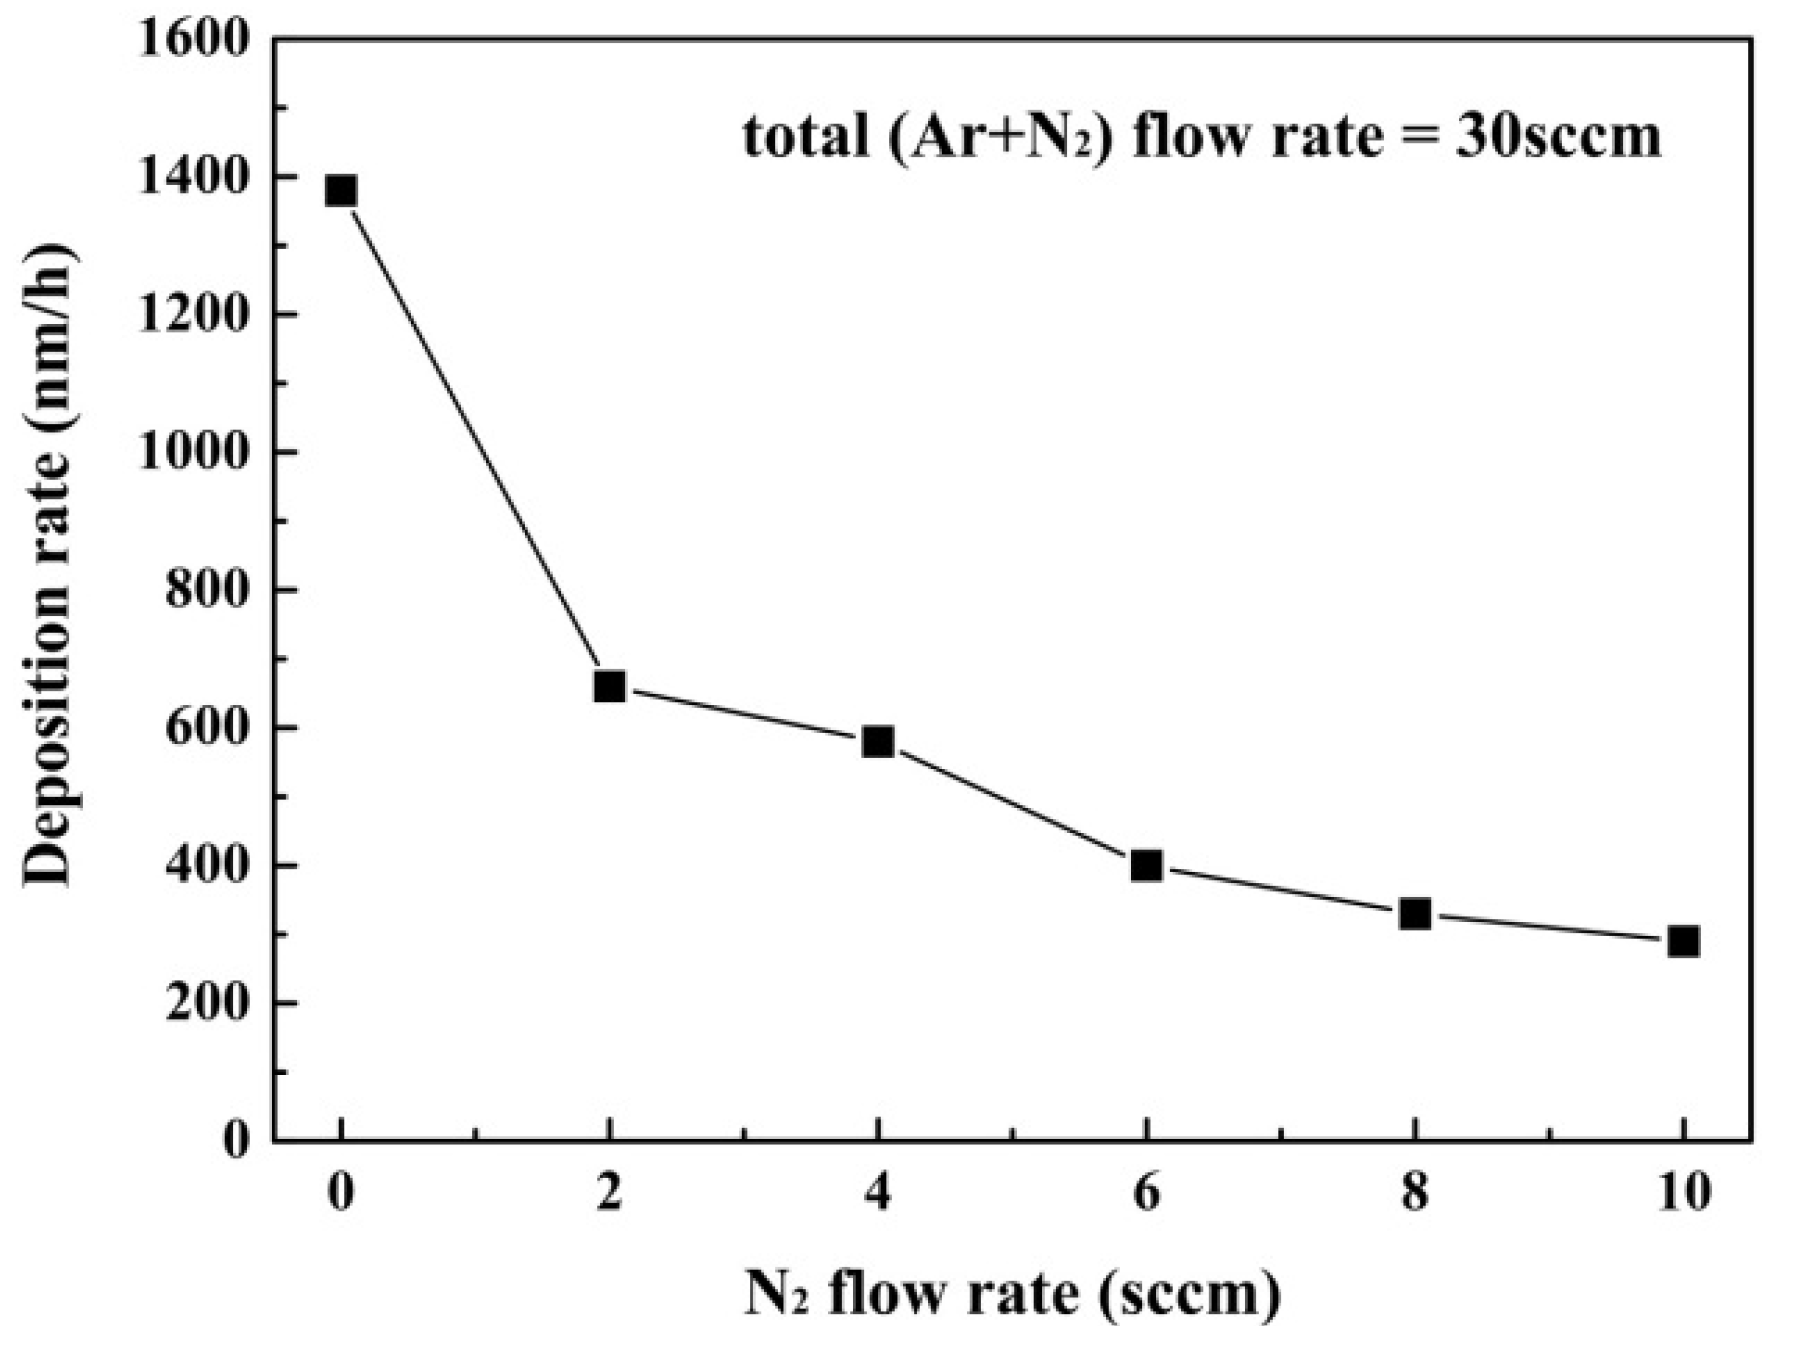
x thin films show a particle-like structure. Although these micrographs looked like granular structures, they actually had an amorphous structure. The deposition rate against the N
2 flow rate is shown in
Figure 4. The deposition rate decreased sharply result upon increasing the N
2 flow rate. The decreasing deposition rate was contributed by two factors. One was caused by the decreasing Ar flow rate. Reducing the flow rate of Ar also diminished the sputtering yield, and consequently the deposition rate decayed. The other factor was a so-called poisoning phenomenon, because some insulator was forming on the surface of the target [
14,
15].
Figure 3.
SEM micrographs of as-deposited TiCrZrNbNx thin films (deposition time was 1 h): (a) top view, N2 flow rate: 0 sccm; (b) cross-section, N2 flow rate: 0 sccm; (c) top view, N2 flow rate: 2 sccm; (d) cross-section, N2 flow rate: 2 sccm; (e) top view, N2 flow rate: 6 sccm; (f) cross-section, N2 flow rate: 6 sccm; (g) top view, N2 flow rate: 8 sccm; (h) cross-section, N2 flow rate: 8 sccm. The cracks are marked by arrows.
Figure 4.
Plot of the deposition rate of as-deposited TiCrZrNbNx thin films vs. N2 flow rate. Total gas (Ar and N2) flow rate was fixed at 30 sccm.
Figure 4.
Plot of the deposition rate of as-deposited TiCrZrNbNx thin films vs. N2 flow rate. Total gas (Ar and N2) flow rate was fixed at 30 sccm.
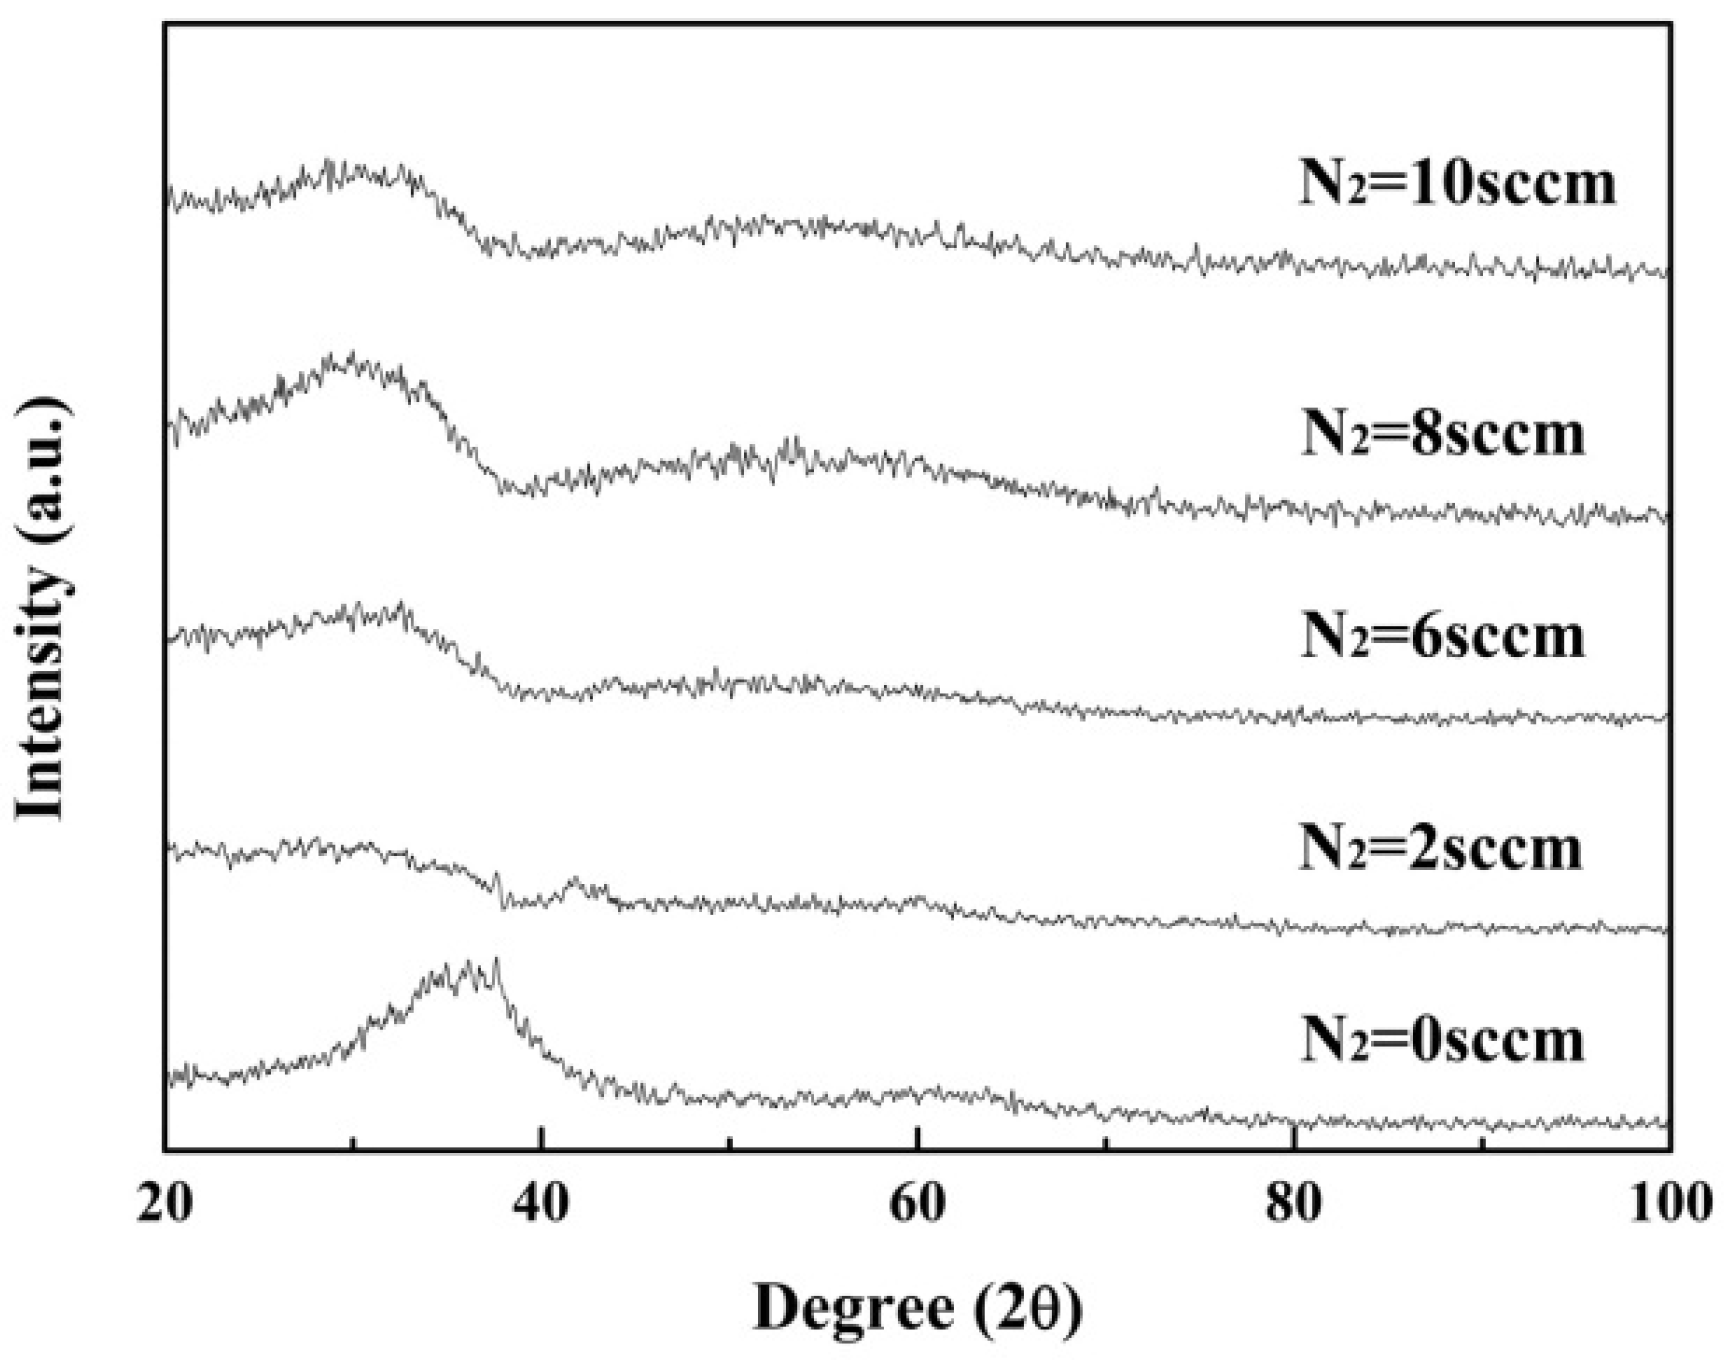
The structures of the TiCrZrNbN
x thin films were identified by XRD, as shown in
Figure 5. No evident peak is observed from the XRD patterns. Therefore, it indicated that all of the as-deposited TiCrZrNb alloy film and TiCrZrNbN
x nitride films were amorphous. The central line of the broad peak shifts gradually to a smaller angle side revealing that the average interatomic spacing becomes larger with more nitrogen doping. Moreover, the XRD patterns of the TiCrZrNbN
x films with N
2 flow rate of 8 and 10 sccm were very similar; this indicated that the solid solubility of nitrogen was saturated when the N
2 flow rate reached 8 sccm. The amorphous structure was also confirmed by TEM observation.
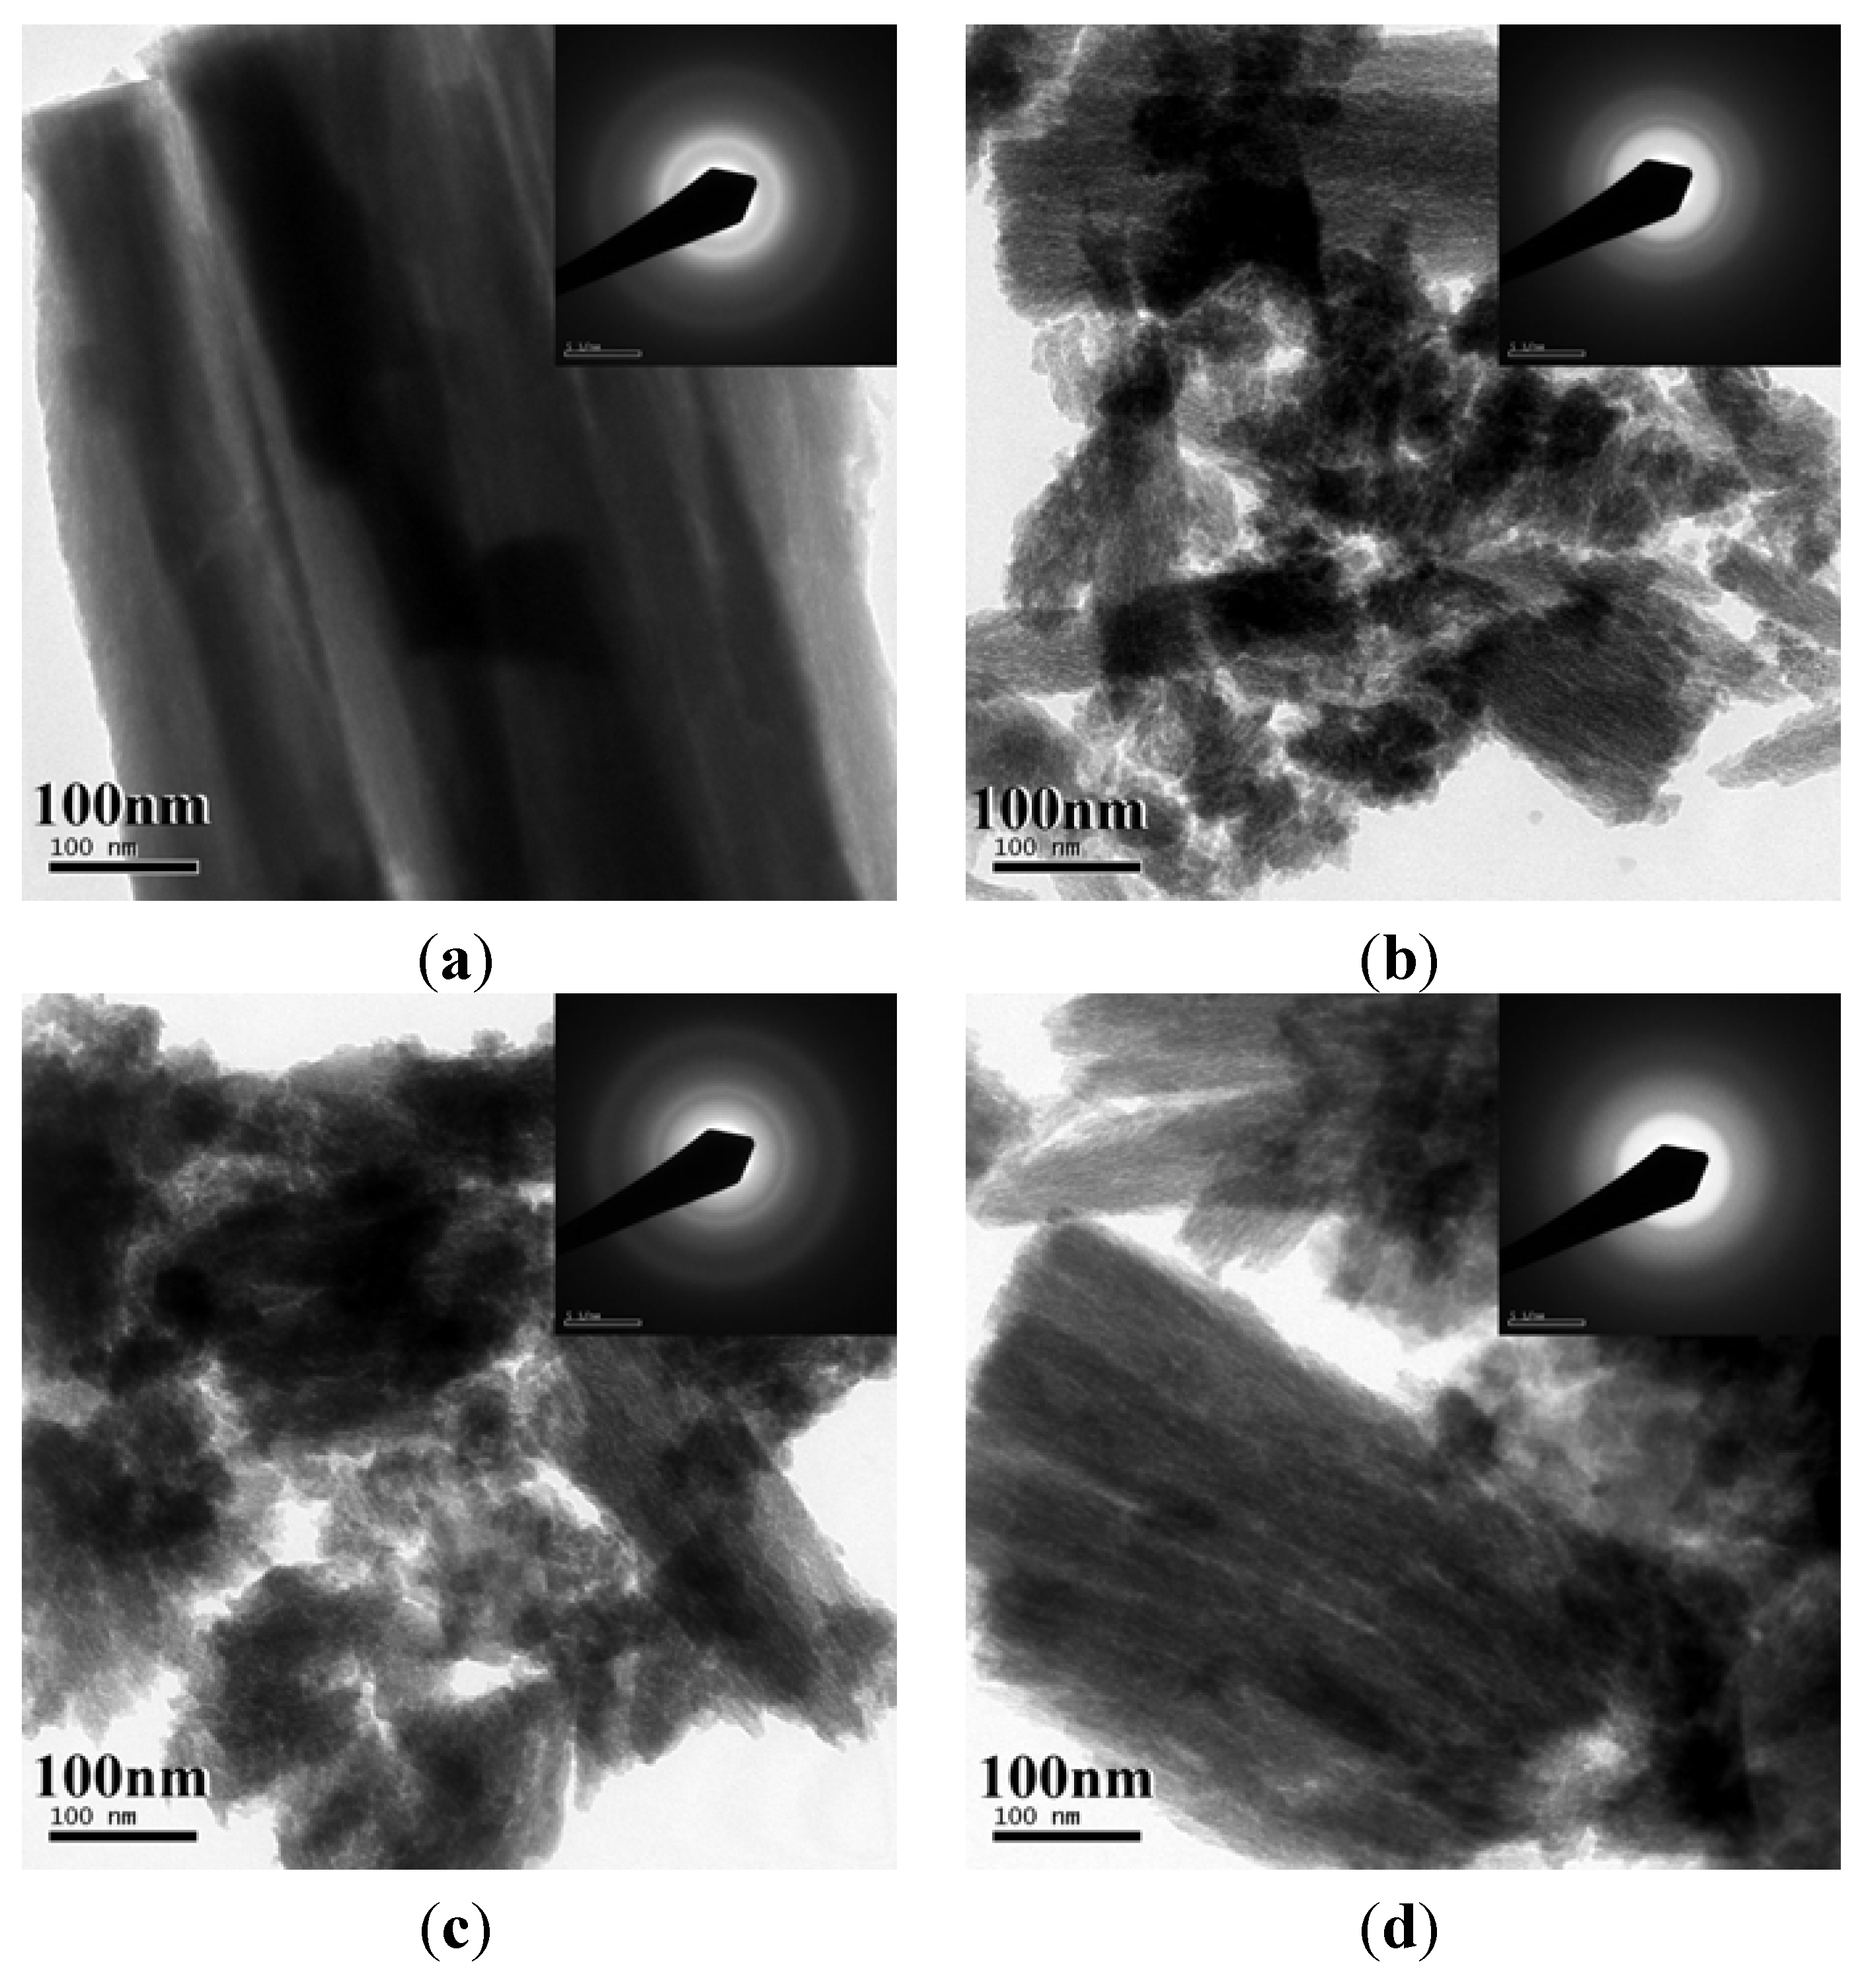
Figure 6 shows the TEM bright field (BF) images and the corresponding selection area diffraction patterns (SAD) of the as-deposited thin films.
Figure 6a shows the TEM image of the as-deposited TiCrZrNb metallic thin film; and the TEM images of as-deposited TiCrZrNbN
x nitride thin films under N
2 flow rate of 2, 4 and 10 sccm are shown in
Figure 6b–d, respectively. All of the TEM images show the columnar structures but differ in sizes. All of the corresponding SADs indicate that their structures are amorphous. The columnar amorphous boundaries were the results of a void network [
16,
17]. Donovan and Heineman first observed these boundaries in an evaporated amorphous Ge thin film [
16], and they suggested that the formation of a void network resulted in density-deficient boundaries that are intrinsic to amorphous films. Tsukimoto
et al. [
17] further described the mechanism of formation of amorphous grain boundaries in TaN thin films, following a detailed analysis.
Figure 5.
XRD patterns of of as-deposited TiCrZrNbNx thin films under different N2 flow rates.
Figure 5.
XRD patterns of of as-deposited TiCrZrNbNx thin films under different N2 flow rates.
Figure 6.
TEM micrographs and their corresponding diffraction patterns of as-deposited TiCrZrNbNx thin films under N2 flow rates of: (a) 0 sccm; (b) 2 sccm; (c) 4 sccm; and (d) 10 sccm.
Figure 6.
TEM micrographs and their corresponding diffraction patterns of as-deposited TiCrZrNbNx thin films under N2 flow rates of: (a) 0 sccm; (b) 2 sccm; (c) 4 sccm; and (d) 10 sccm.
The diameters of Ti, Cr, Zr and Nb atoms are 0.294 nm, 0.256 nm, 0.320 nm and 0.294 nm, respectively [
18]. The Zr atom is 8.8% larger than the Ti and Nb atoms; and it is 25% larger than the Cr atom. The composition of the alloy film was uniform because not only the deposition was an atom-by-atom process but also the confusion principle dictated that four elements with different crystalline structures could not form a vital crystal structure without sufficient time and energy for diffusion. The amorphization could be explained by the variation among the atomic sizes of these four elements, and the defects, and the effect of the confusion principle, as stated above. The broad peak broadened after increasing of nitrogen; this indicated that the amorphous structure became more disordered with more nitrogen doping. These phenomena could be explained based on the occupation of small nitrogen atoms in the interstitial sites. The nitrogen atoms were always larger than the interstitial sites, the interatomic spacing would be thus enlarged, and atomic configuration structure would be more distorted.
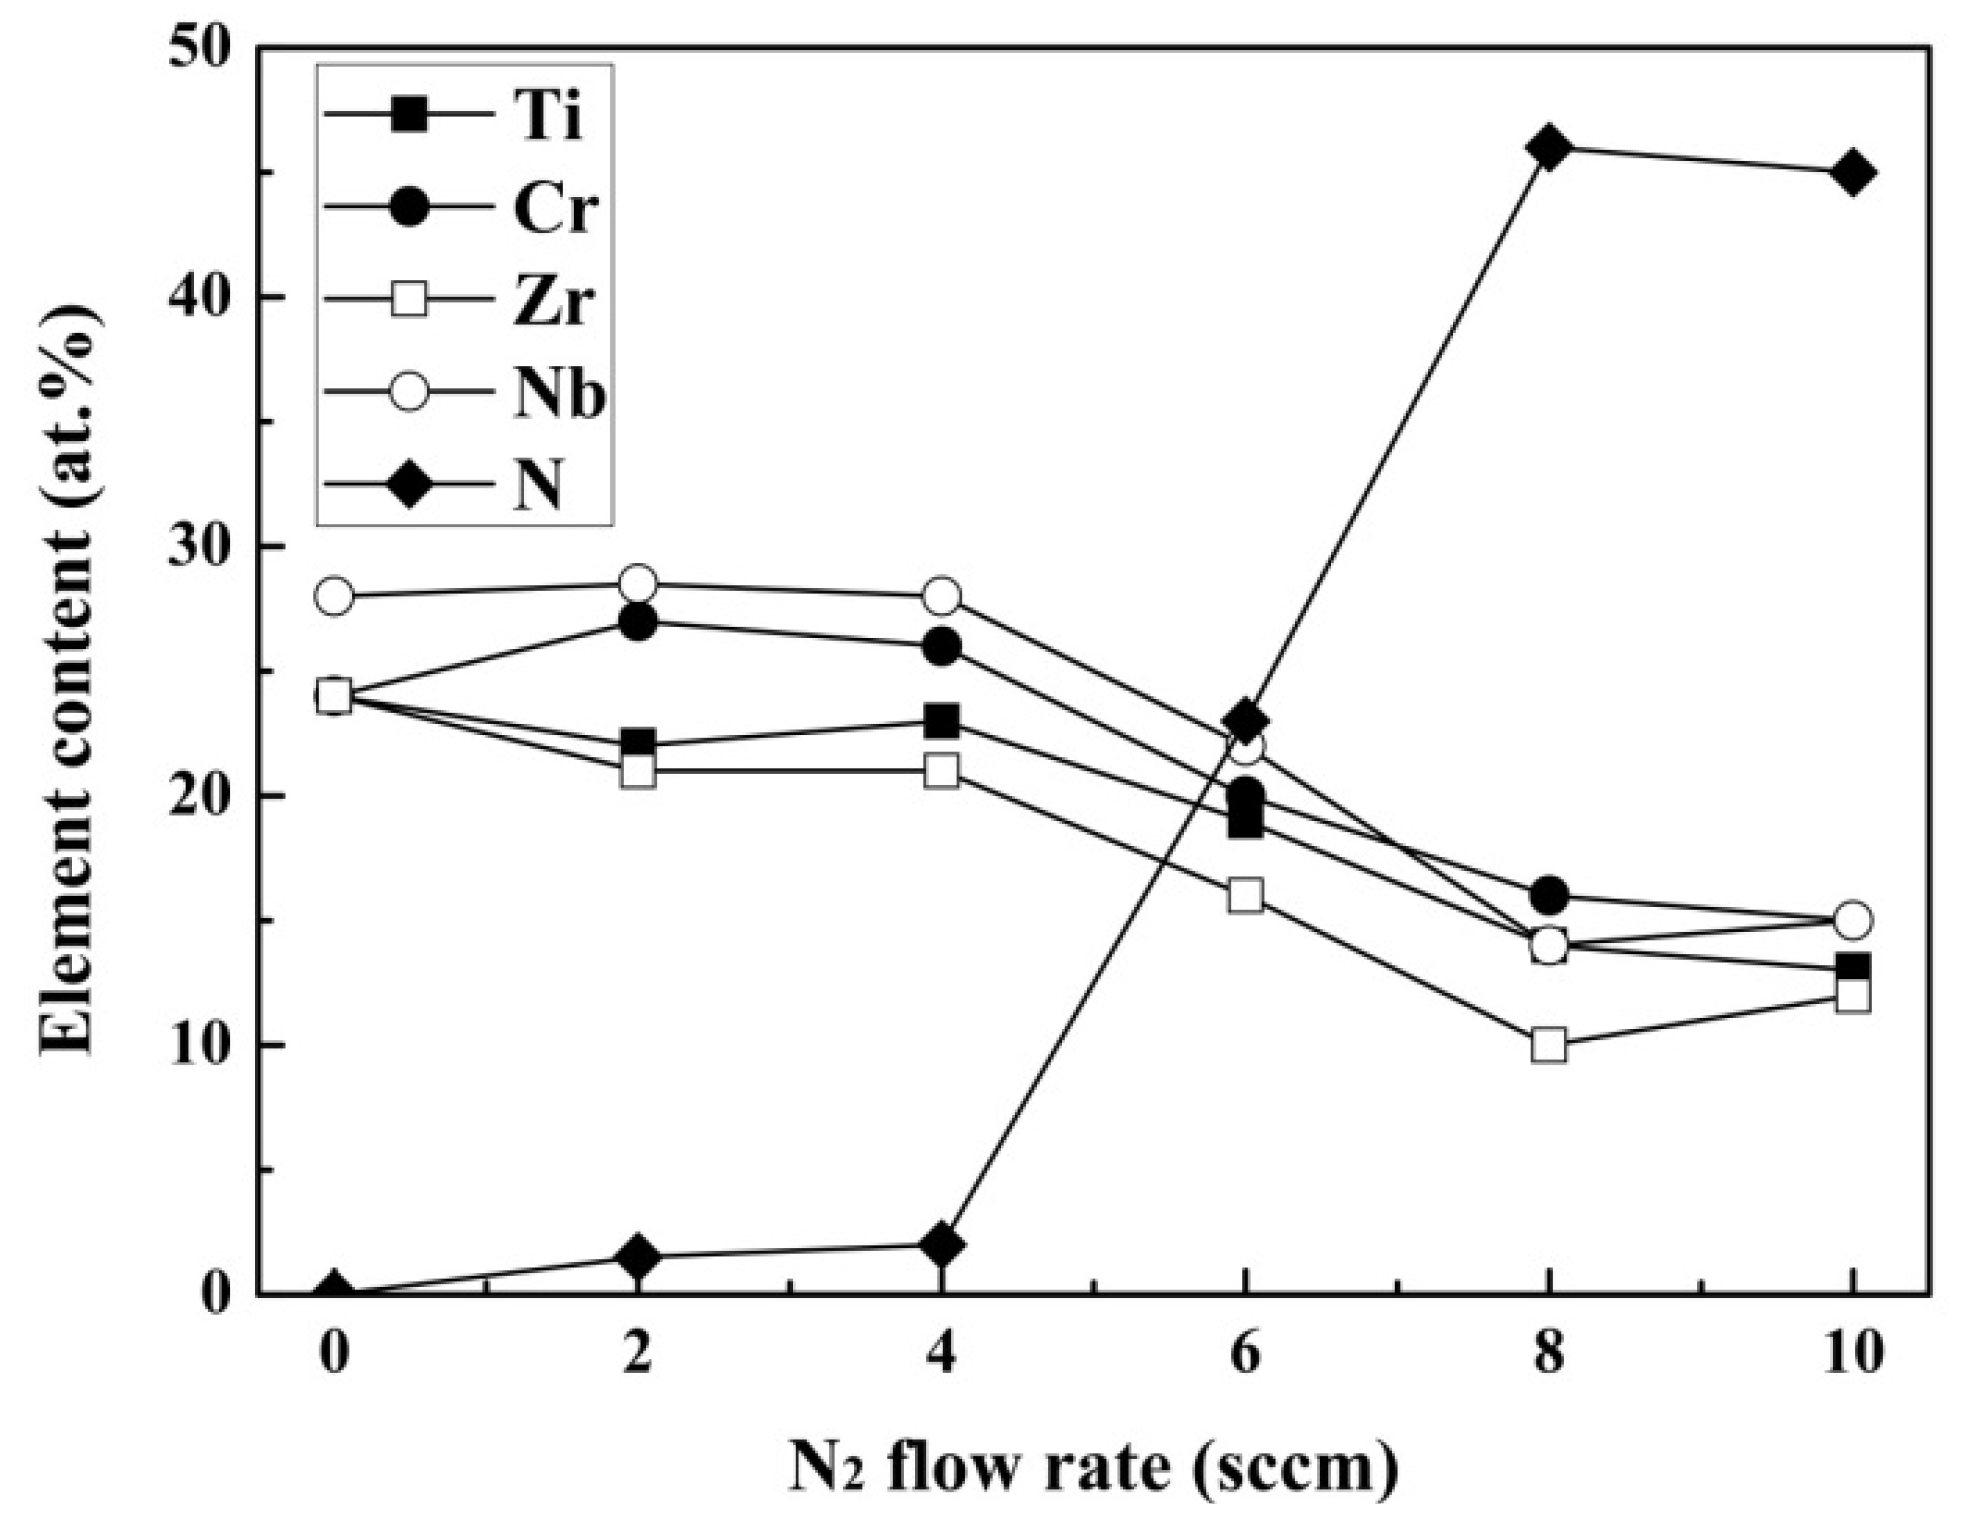
The compositions of the as-deposited TiCrZrNbN
x thin films are shown in
Figure 7. The contents of the Ti, Cr, Zr and Nb in the as-deposited TiCrZrNb thin films were around 25 atom percent. This also proved the compositions of the TiCrZrNb target. The nitrogen contents in the TiCrZrNbN
x thin films were very small under the low N
2 flow rate regime. The nitrogen contents in the TiCrZrNbN
x thin films increased significantly when the N
2 flow rate was greater than 4 sccm. The nitrogen contents in the TiCrZrNbN
x thin film saturated at about 47 atomic percent when the N
2 flow rate reached 8 sccm. This also proves the results of XRD patterns described above.
Figure 7.
Plot of the compositions of the TiCrZrNbNx thin films vs. N2 flow rate.
Figure 7.
Plot of the compositions of the TiCrZrNbNx thin films vs. N2 flow rate.
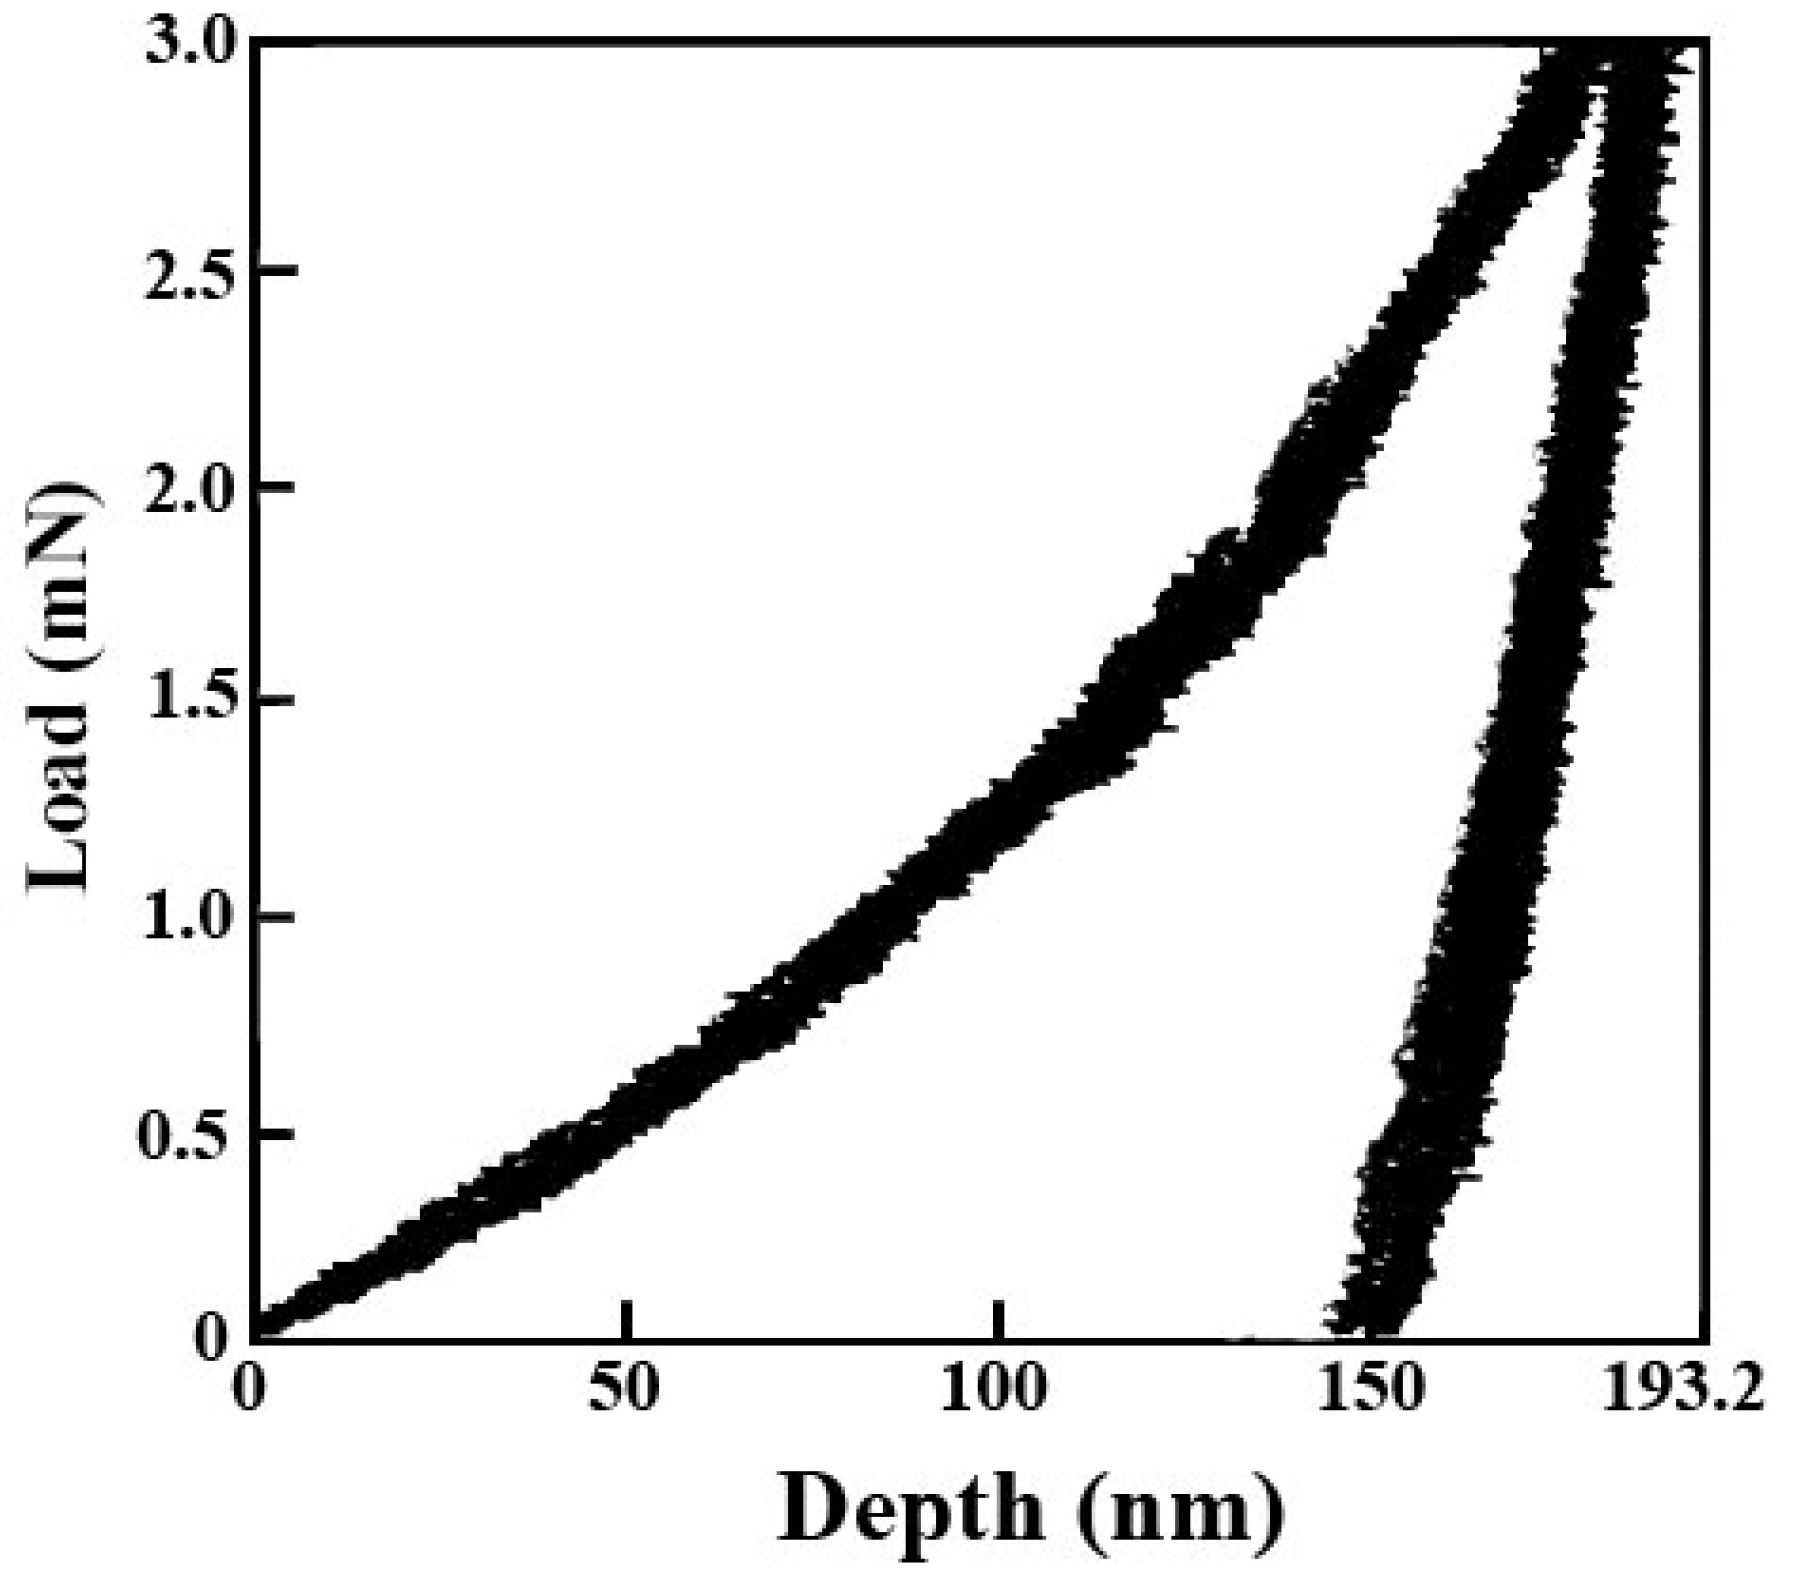
Hardness and Young’s modulus of the as-deposited TiCrZrNbN
x thin films with 1 micrometer thickness were tested by a nanoindenter, and the typical nanoindentation load-displacement loading curves are shown in
Figure 8. The left curve in
Figure 8 is the loading curve; and the right curve is the unloading curve. The maximum load shows 3 mN. The stiffness of a material can be obtained from the initial unloading slope by evaluating the maximum load and maximum depth. The details of testing and calculating Young’s modulus and hardness can be found in Fang and Chang’s work [
19].
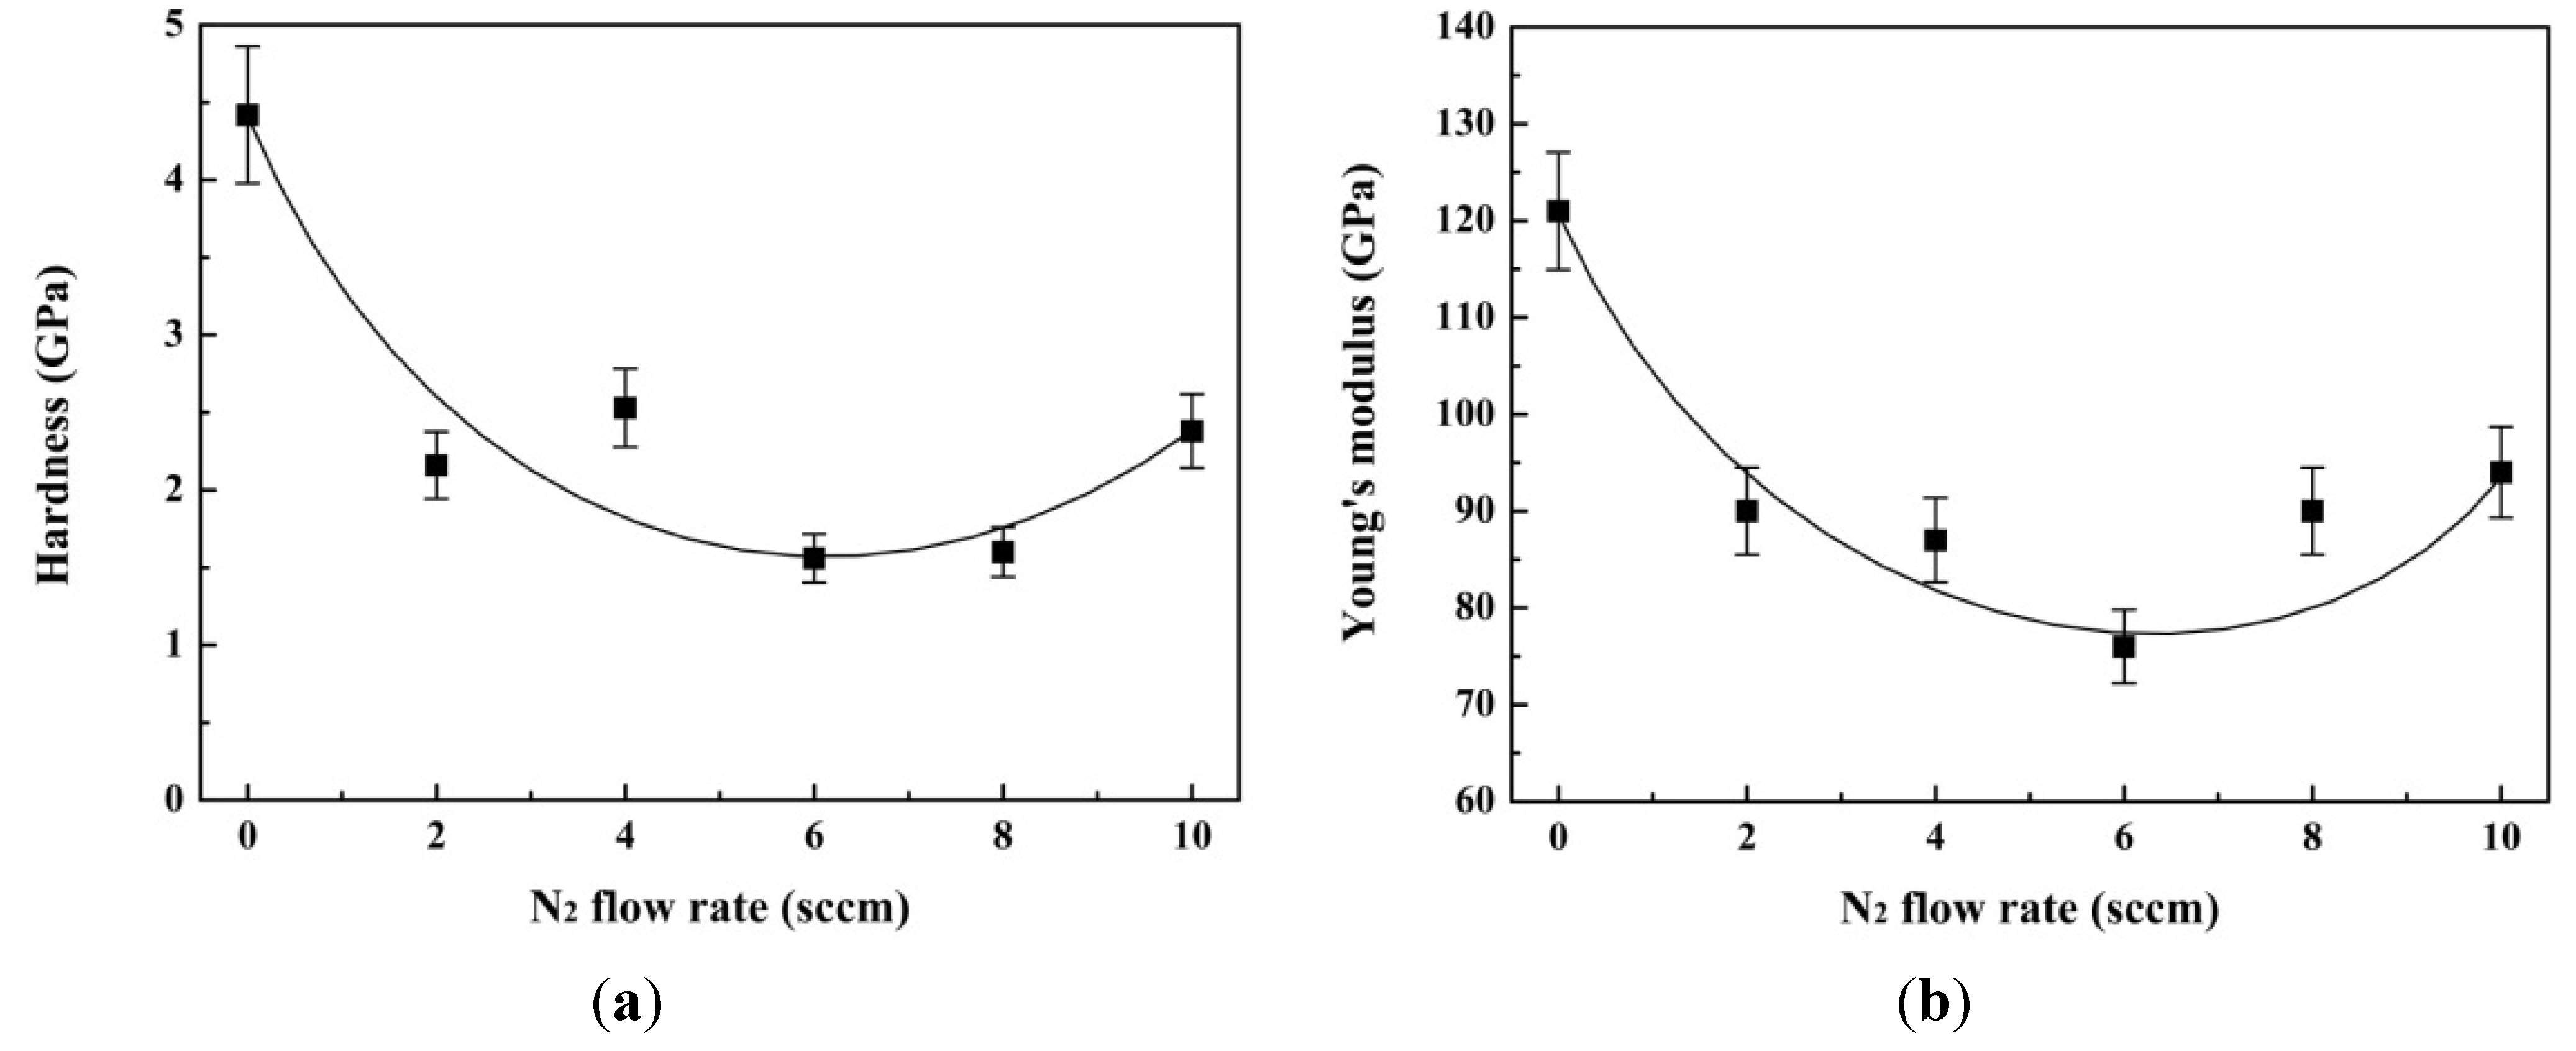
The hardness and Young’s modulus of the as-deposited TiCrZrNbN
x thin films were shown in
Figure 9a,b respectively. Hardness of the TiCrZrNb metallic thin film was 4.4 GPa. This value was very close to the hardness of TiCrZrNb bulk, 4.7 GPa. The difference of hardness between the bulk and thin film was because of their different structures. The TiCrZrNb bulk had a dense crystalline structure; the TiCrZrNb thin film had an amorphous structure, and this structure was not as dense as that of the bulk, as described above. Additionally, some cracks were observed along the particle boundaries after increasing the N
2 flow rate; these were caused by the thermal stress or internal stress during the deposition, because the substrate was cool during deposition. Therefore, hardness of the TiCrZrNbN
x thin films decreased due to the cracks. However, more study on the relationship between the cracks and nitrogen flow rate is needed. The cracks almost vanished when the N
2 flow rate reached 8 sccm, and the hardness of the TiCrZrNbN
x thin films thereby increased again. The Young’s modulus of the as-deposited TiCrZrNb thin film was 122 GPa. This value indicated that this thin film is a soft material, and this value was only slightly higher than the Young’s modulus of phosphor bronze, 110 GPa [
20].
Figure 8.
Typical nanoindentation load-displacement loading curves on the TiCrZrNbNx thin films under a N2 flow rate of 4 sccm.
Figure 8.
Typical nanoindentation load-displacement loading curves on the TiCrZrNbNx thin films under a N2 flow rate of 4 sccm.
Figure 9.
Plots of (a) hardness, and (b) Young’s modulus of the TiCrZrNbNx thin films vs. N2 flow rate.
Figure 9.
Plots of (a) hardness, and (b) Young’s modulus of the TiCrZrNbNx thin films vs. N2 flow rate.
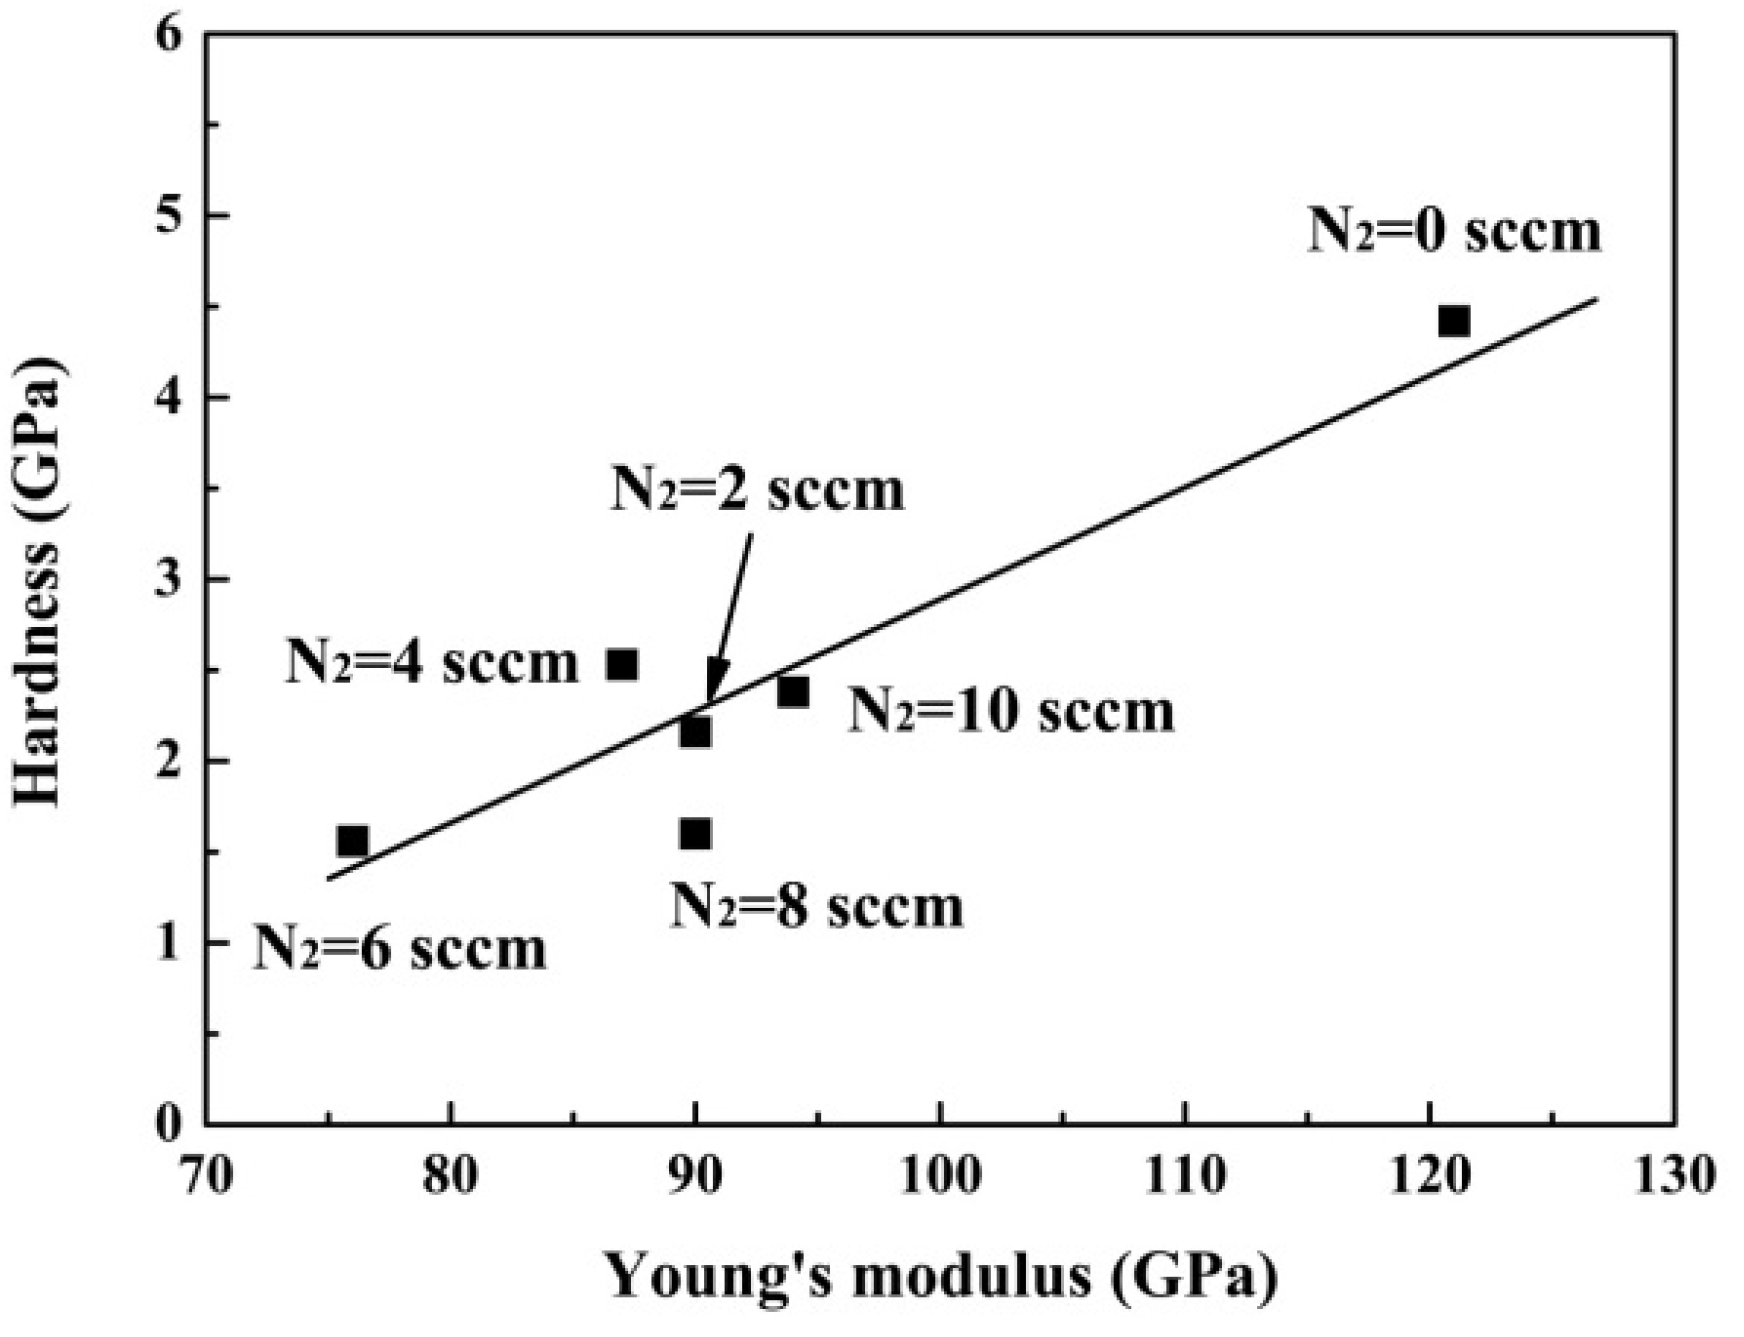
Moreover, the Young’s modulus of the TiCrZrNbN
x thin films decreased with increasing the N
2 flow rate, just like the hardness tendency. The Young’s modulus of the TiCrZrNbN
x thin films increased again after the N
2 flow rate increased to 8 sccm. The Young’s modulus (
E) and hardness (
H) of the TiCrZrNbN
x thin films have almost the same tendency, and
H/
E is about 0.06 as shown in
Figure 10. Jiang
et al. investigated hardness and Young’s modulus of amorphous hydrogenated carbon and silicon films, and pointed out that the hardness of amorphous hydrogenated carbon and silicon films are proportional to Young’s modulus, that is (
H/
E)
C = 0.115 and (
H/
E)
Si = 0.093 [
21]. This work also exhibited a similar result, but the
H/
E value was lower.
Figure 10.
Plot of correlation between hardness and Young’s modulus of the TiCrZrNbNx thin films.
Figure 10.
Plot of correlation between hardness and Young’s modulus of the TiCrZrNbNx thin films.


