Article

Effect of the Postural Challenge on the Dependence of the Cardiovascular Control Complexity on Age

by
Aparecida M. Catai
1,*,
Anielle C.M. Takahashi
1,2,
Natália M. Perseguini
1,
Juliana C. Milan
1,
Vinicius Minatel
1,
Patrícia Rehder-Santos
1,
Andrea Marchi
3,
Vlasta Bari
4 and
Alberto Porta
5,6
1
Cardiovascular Physiotherapy Laboratory, Nucleus of Research in Physical Exercise, Department of Physiotherapy, Federal University of São Carlos, Rodovia Washington Luís, km 235, Monjolinho, 13565-905 São Carlos, SP, Brazil
2
Research Laboratory on Healthy Aging, Department of Physiotherapy, Federal University of São Carlos, Rodovia Washington Luís, km 235, Monjolinho, 13565-905 São Carlos, SP, Brazil
3
Department of Anesthesia and Intensive Care Unit, Humanitas Clinical and Research Center, Via Manzoni 56, 20089 Rozzano, Italy
4
Department of Cardiothoracic, Vascular Anesthesia and Intensive Care, IRCCS Policlinico San Donato, Via Morandi 30, 20097 San Donato Milanese, Milan, Italy
5
Department of Biomedical Sciences for Health, University of Milan, Via R. Galeazzi 4, 20161 Milan, Italy
6
IRCCS Galeazzi Orthopedic Institute, Via R. Galeazzi 4, 20161 Milan, Italy
*
Author to whom correspondence should be addressed.
Entropy 2014, 16(12), 6686-6704; https://0-doi-org.brum.beds.ac.uk/10.3390/e16126686
Submission received: 28 October 2014 / Revised: 8 December 2014 / Accepted: 18 December 2014 / Published: 22 December 2014
(This article belongs to the Special Issue Entropy and Cardiac Physics)

Abstract

:
Short-term complexity of heart period (HP) and systolic arterial pressure (SAP) was computed to detect age and gender influences over cardiovascular control in resting supine condition (REST) and during standing (STAND). Healthy subjects (n = 110, men = 55) were equally divided into five groups (21–30; 31–40; 41–50; 51–60; and 61–70 years of age). HP and SAP series were recorded for 15 min at REST and during STAND. A normalized complexity index (NCI) based on conditional entropy was assessed. At REST we found that both NCIHP and NCISAP decreased with age in the overall population, but only women were responsible for this trend. During STAND we observed that both NCIHP and NCISAP were unrelated to age in the overall population, even when divided by gender. When the variation of NCI in response to STAND (ΔNCI = NCI at REST-NCI during STAND) was computed individually, we found that ΔNCIHP progressively decreased with age in the overall population, and women were again responsible for this trend. Conversely, ΔNCISAP was unrelated to age and gender. This study stresses that the complexity of cardiovascular control and its ability to respond to stressors are more importantly lost with age in women than in men.

Graphical Abstract

1. Introduction

Aging is associated with a reduced ability of the physiological regulatory mechanisms to interact, leading to less flexible cardiovascular control [1,2]. These changes are mirrored by a reduction in heart period (HP) variability [29], by an increase of systolic blood pressure (SAP) variability [1012], and by a reduction in complexity of physiological dynamics [24,1323]. Although the abovementioned studies indicate that aging reduces the complexity of the cardiovascular control and prove the gender dependence, it is still unclear whether the complexity reduction and the gender relation are similarly observable from HP and SAP variabilities and if it persists during a cardiovascular control challenge. Indeed, protocols assessing the effect of aging on the complexity of the cardiovascular control are mainly limited to the evaluation of the complexity of the HP variability [1315,1923] and mostly do not deliberately challenge the cardiovascular control according to an experimental maneuver or pharmacological intervention [1319,22,23]. In addition, those studies challenging autonomic nervous system regulation have a limited power because age ranges are inadequate [20] or they are mainly based on biased indexes of complexity such as approximate entropy [21].
The aim of this study was to evaluate the effect of a postural challenge on the dependence of the cardiovascular control complexity on age. The aging and gender effects on the complexity of HP and SAP variability are assessed by means of a univariate approach assessing irregularity as the amount of information carried by a series that cannot be derived from the knowledge of its own past values through the corrected conditional entropy [24] in several age groups in resting supine condition and during sympathetic activation induced by active standing in healthy subjects.

2. Methods

2.1. Study Population

The study was carried out at the Laboratory of Cardiovascular Physiotherapy, Department of Physiotherapy of the Federal University of São Carlos, São Carlos, Brazil. The study was performed according to the Declaration of Helsinki for medical research involving humans and approved by the Human Research Ethics Committee of the Federal University of São Carlos (protocol number 173/2011). Written informed consent was obtained from all subjects.
One hundred and ten subjects were studied and divided into five groups (n = 22 for each group, 11 men), according to the following age ranges: 21–30; 31–40; 41–50; 51–60; 61–70. All subjects were apparently healthy, were not taking medicine that influenced cardiovascular system, and had no history and no clinical evidence of any disease based on clinical and physical examinations, laboratory tests, a standard ECG, and a maximum cardiopulmonary exercise test conducted by a physician. Smokers, habitual drinkers, and obese subjects (body mass index larger than 30 kg/m2) were excluded from this study. Only women without contraceptive medication or hormone replacement therapy were included. All women 51–60 and 61–70 were in the menopausal phase.

2.2. Experimental Protocol

All subjects were evaluated in the afternoon. The experiments were carried out in a climatically controlled room (22–23 °C), with relative air humidity of 40–60%. Subjects were instructed to not ingest caffeinated or alcoholic beverages as well as to not perform strenuous exercise on the day before the protocol application. They were also instructed to ingest a light meal at least 2 h prior to the test. On the experimental day, the subjects were interviewed and examined before the test to verify that they were in good health, had had a regular night’s sleep, and had a heart rate and systemic blood pressure within the normal range. Prior to the experiment, the volunteers were familiarized with the equipment and the experimental procedure.

2.3. Data Acquisition

Prior to the experimental procedure, the subjects were maintained in the resting supine condition for 10 min. Then, signals were acquired for 15 min in the resting supine position (REST) and 15 min in the standing position (STAND). The subjects were instructed to breathe spontaneously but they were not allowed to talk. All subjects completed STAND without experiencing any sign of pre-syncope. The electrocardiographic signal (modified lead I) was captured by a bioamplificator (BioAmp FE132, ADInstruments, Sydney, Australia). Noninvasive continuous blood pressure waveform monitoring (Finometer-PRO, Finapres Medical System, Amsterdam, The Netherlands) was obtained from the middle finger of the right hand, which was maintained at the level of the heart by fixing the subject’s arm to his thorax during the whole of the experiment. The auto-calibration procedure of the device was switched off after the first automatic calibration at the onset of the protocol. All signals were sampled at 400 Hz (Power Lab 8/35, ADInstruments, Sydney, Australia).

2.4. Time Series Extraction

After detecting the QRS complex of the electrocardiogram and locating the R-wave apex using parabolic interpolation, the HP was approximated as the time distance between two consecutive R-wave apexes. The maximum of arterial pressure inside HP was taken as SAP. The occurrences of QRS and SAP peaks were carefully checked to avoid erroneous detections or missed beats. The series HP = {HP(i), i = 1, …, N} and SAP = {SAP(i), i = 1, …, N}, where i is the progressive cardiac beat number, were linearly detrended. Since the analysis focuses on short-term cardiovascular control [25], the series length N was set to 256 (i.e., recordings of a few minutes). The stationarity of the selected sequence was tested according to [26] over the original series after linear detrending. If the test for the steadiness of mean and variance was not fulfilled, a new selection was carried out again until the fulfillment of the prerequisites for restricted weak stationarity [26]. Time domain parameters such as the HP mean, HP variance, SAP mean, and SAP variance, indicated as μHP, σ2HP, μSAP, and σ2SAP, respectively, were computed to assess their relation with age.

2.5. Complexity Analysis

Complexity was estimated via corrected conditional entropy, as described by Porta et al. [14,24]. The approach measures the amount of information carried by a time series that cannot be derived from the knowledge of its previous samples. If HP or SAP sequences are regular, the series are more predictable and less complex. In the opposite case, if the heart (or vessels) receives a large amount of information due to the action of many control subsystems, HP (or SAP) exhibits a higher degree of unpredictability. As a function of the number of previous samples, the corrected conditional entropy: (i) remains constant in the case of white noise; (ii) decreases to zero in the case of fully predictable signals; and (iii) shows a minimum if repetitive patterns are embedded in noise. In the corrected conditional entropy, the number of previous conditioning samples was not a priori fixed, as it occurs in sample entropy [27] and approximate entropy [28], but it is optimized on a case-by-case basis. Conversely, the level of coarse graining was fixed according to the number of levels utilized in the uniform quantization procedure (here, 6). The optimal embedding dimension for HP and SAP ranged from 2 to 6 at REST and from 2 to 7 during STAND. The minimum of the corrected conditional entropy with respect to the number of past conditioning values was taken as a complexity index (CI). CI ranges between 0, indicating null information, and the Shannon entropy of the series, indicating the maximum amount of information carried by the sequence of data. This index was normalized by the Shannon entropy to obtain a normalized CI (NCI), thus expressing complexity in terms of dimensionless units. This index ranges from 0 (null information, maximal predictability) to 1 (maximum information, minimal predictability) [29]. The greater the CI and NCI, the less predictable and regular the time series.

2.6. Statistical Analysis

Normality of the distributions was tested by the Kolmogorov–Smirnov test. One-way analysis of variance (Tukey test for multiple comparisons), or Kruskal–Wallis one-way analysis of variance on ranks (Dunn’s method for multiple comparisons) when appropriate, was applied to check the significance of the differences among parameters in different age groups. Assigned the age group, unpaired t-test, or the Mann–Whitney rank sum test when appropriate, was applied to test the significance of the difference between genders. Bonferroni’s correction was utilized to account for multiple comparisons. The Pearson correlation analysis was performed to check the linear association of any parameter on age. The same analysis was also used to assess the association between NCI and time domain parameters.
Linear regression analysis on age was performed only if a significant difference between the 21–30 and 61–70 groups was detected according to one-way analysis of variance. A p < 0.05 was considered significant. Statistical analyses were carried out using a commercial statistical program (SigmaPlot 11.0, Systat, Chicago, IL, USA). Data are shown as median (1st quartile–3rd quartile) in all tables and figures.

3. Results

3.1. Characteristics of the Population

Table 1 shows the anthropometric characteristics and aerobic capacity of our 110 studied subjects. Males and females are equally divided into five groups. The anthropometric characteristics (height and weight) did not show significant differences among groups. The body mass index (BMI) was significantly higher in the 41–50 and 61–70 groups compared to 21–30. The VO2 peak was lower in the older groups (51–60 and 61–70) compared to 31–40.
When the data were analyzed by gender, only women exhibited a difference in BMI (41–50 and 61–70 were different compared to 21–30, and 61–70 was different in relation to 31–40). Men showed lower values of VO2 peak in 41–50, 51–60, and 61–70 compared to 31–40, while women had lower values in 51–60 and 61–70 compared to 21–30 and 31–40, and also lower values in 61–70 compared to 41–50.

3.2. Time Domain Parameters: Aging and Gender Effects

Table 2 shows the results of the linear regression analysis of time domain parameters (i.e., μHP, σ2HP, μSAP, and σ2SAP) on age in the overall group of subjects and after the separation of the two genders. At REST in the entire group we found that σ2HP, μSAP, and σ2SAP were significantly correlated with age, while μHP was not. The correlation coefficient was positive in the case of μSAP and σ2SAP and negative in the case of σ2HP. Similar results were obtained in women. In men the positive correlations of μSAP and σ2SAP were lost. During STAND in the whole group we found that μHP, σ2HP, and μSAP were linearly related to age and the sign of the correlation coefficient was positive in the case of μHP and μSAP and negative in the case of σ2HP. Similar results were obtained in women. In men the positive correlations of μHP and μSAP were lost.

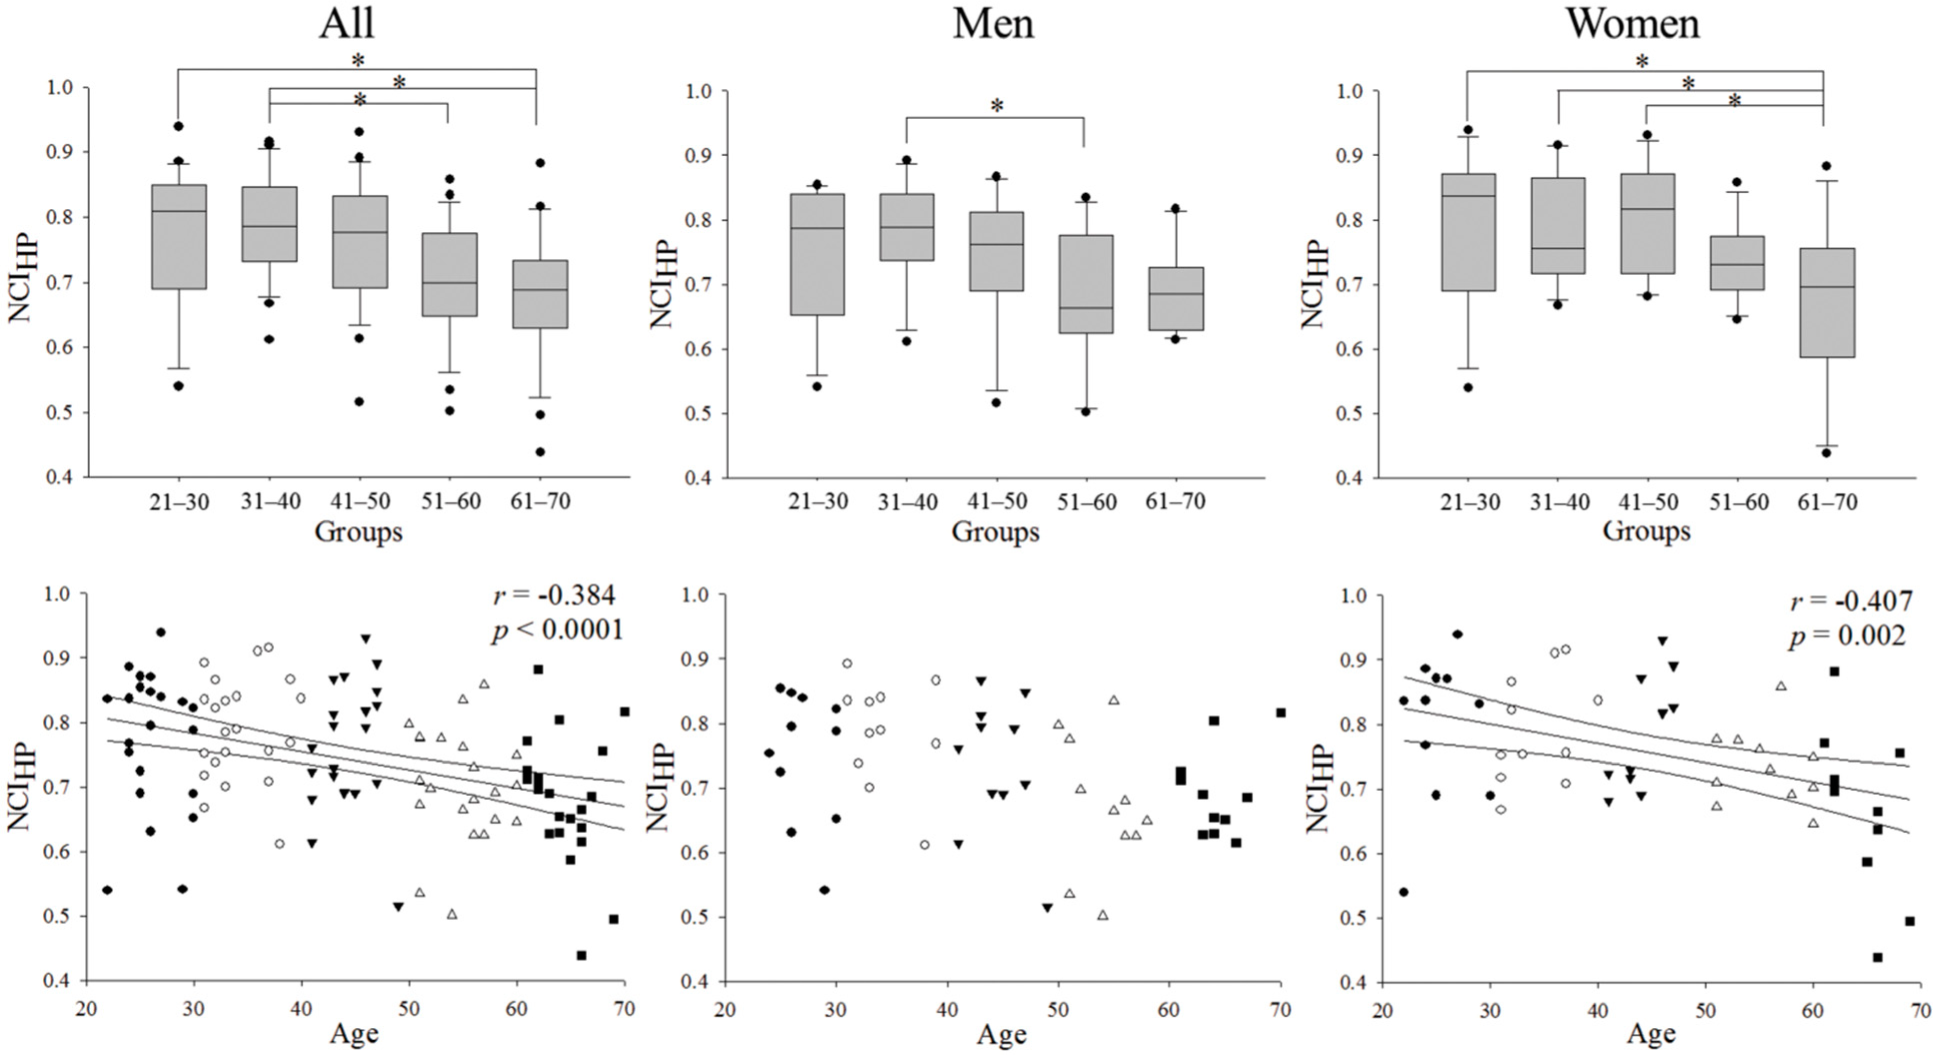
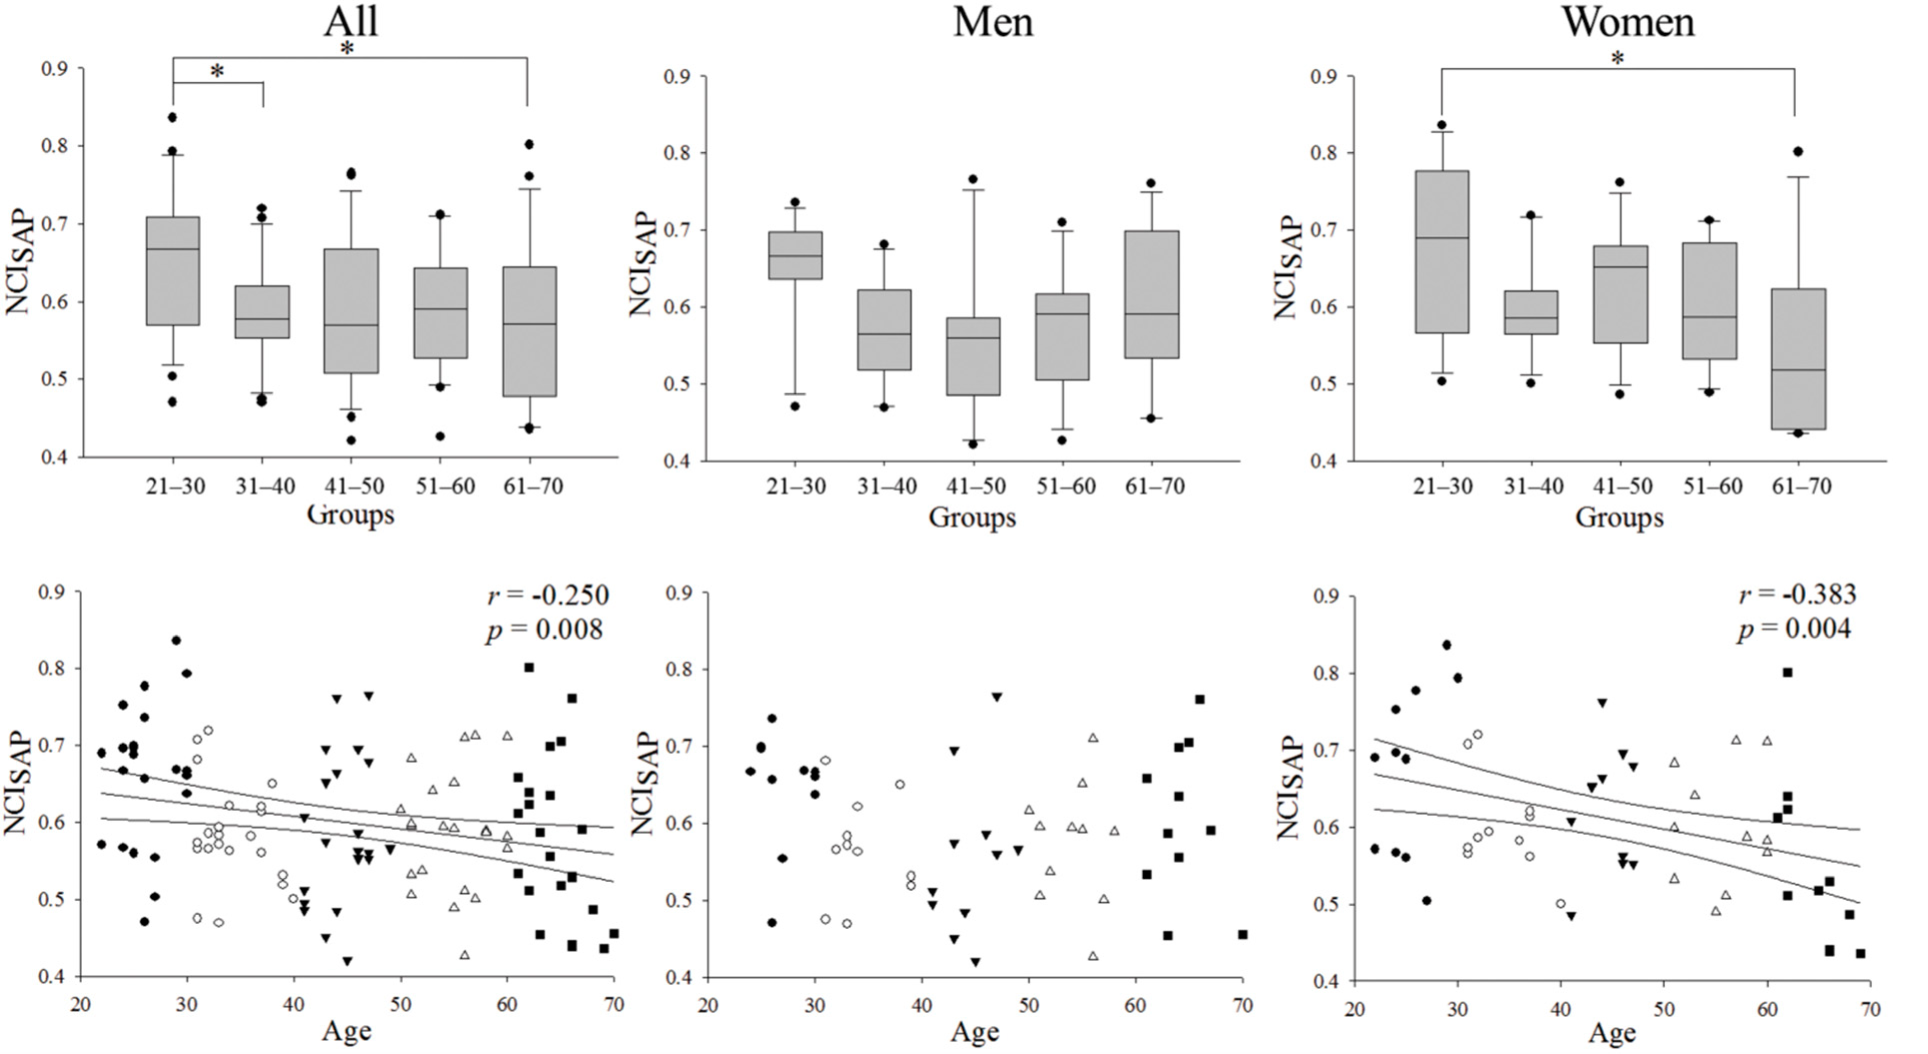
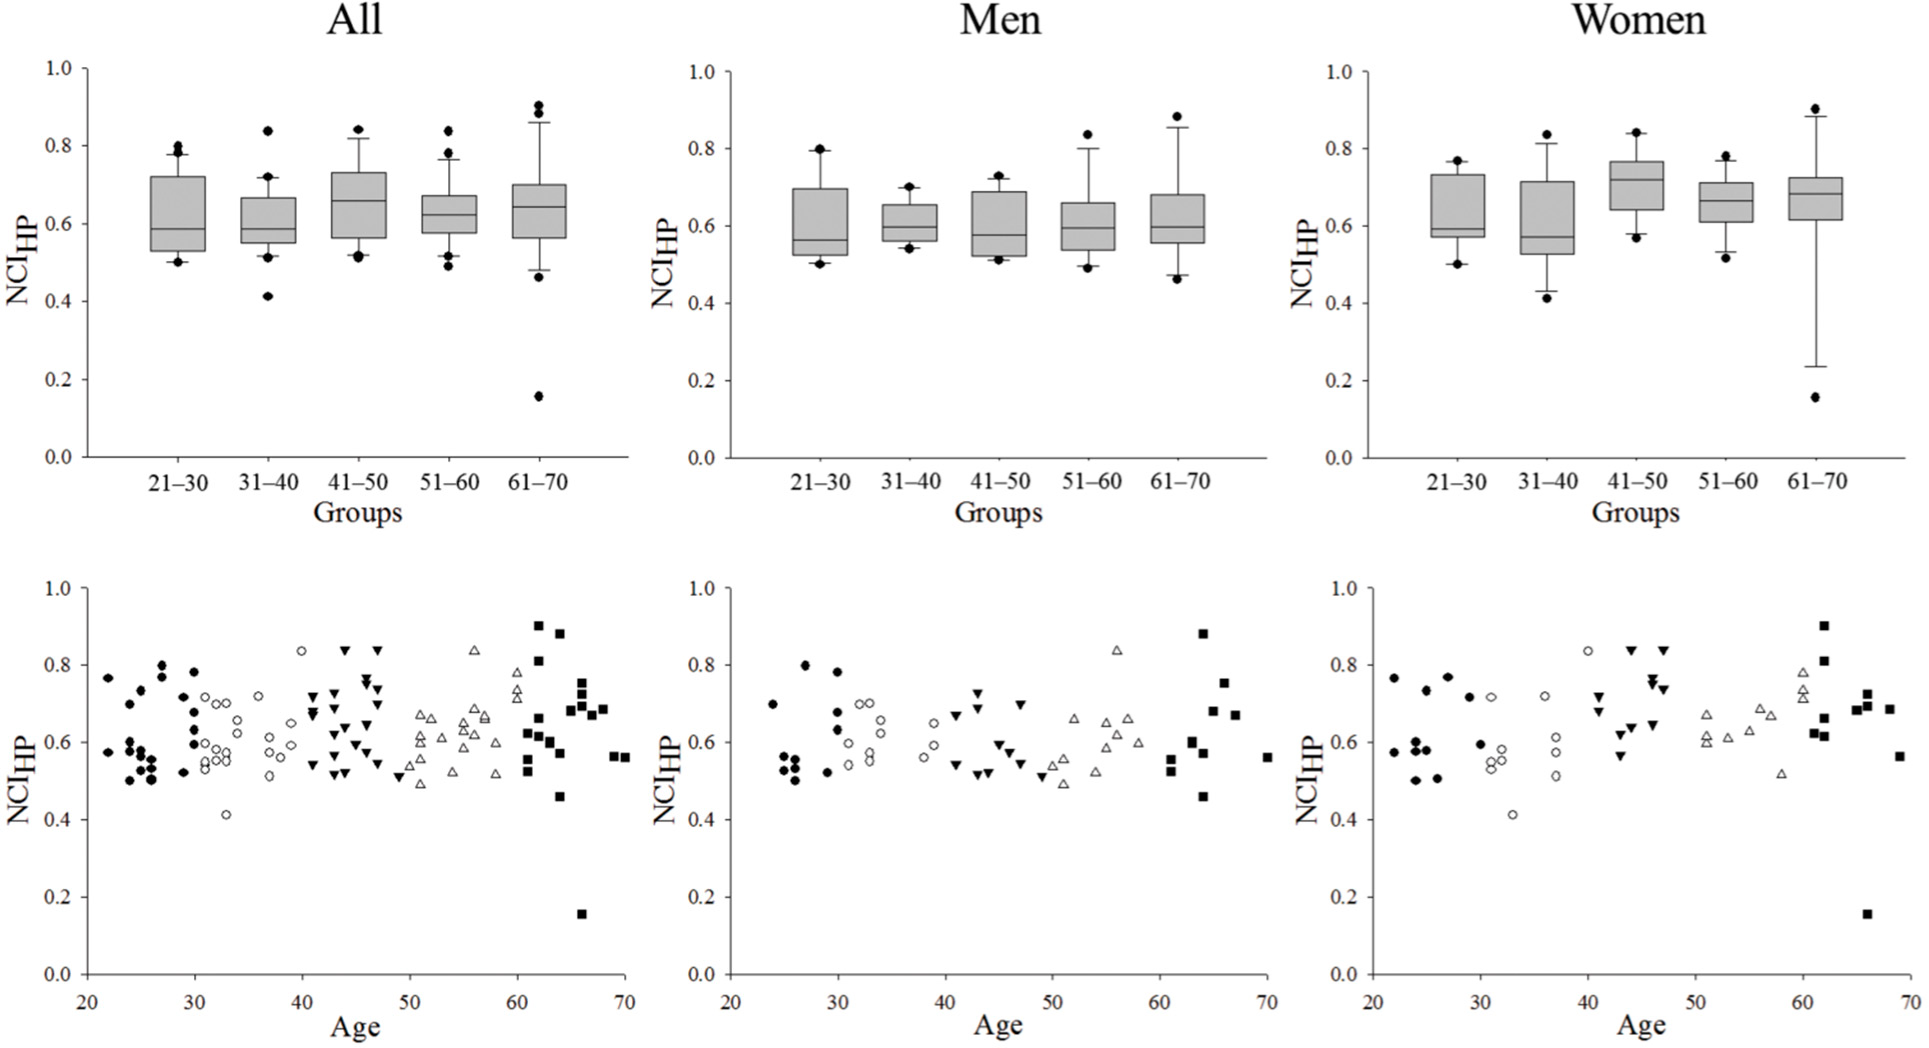
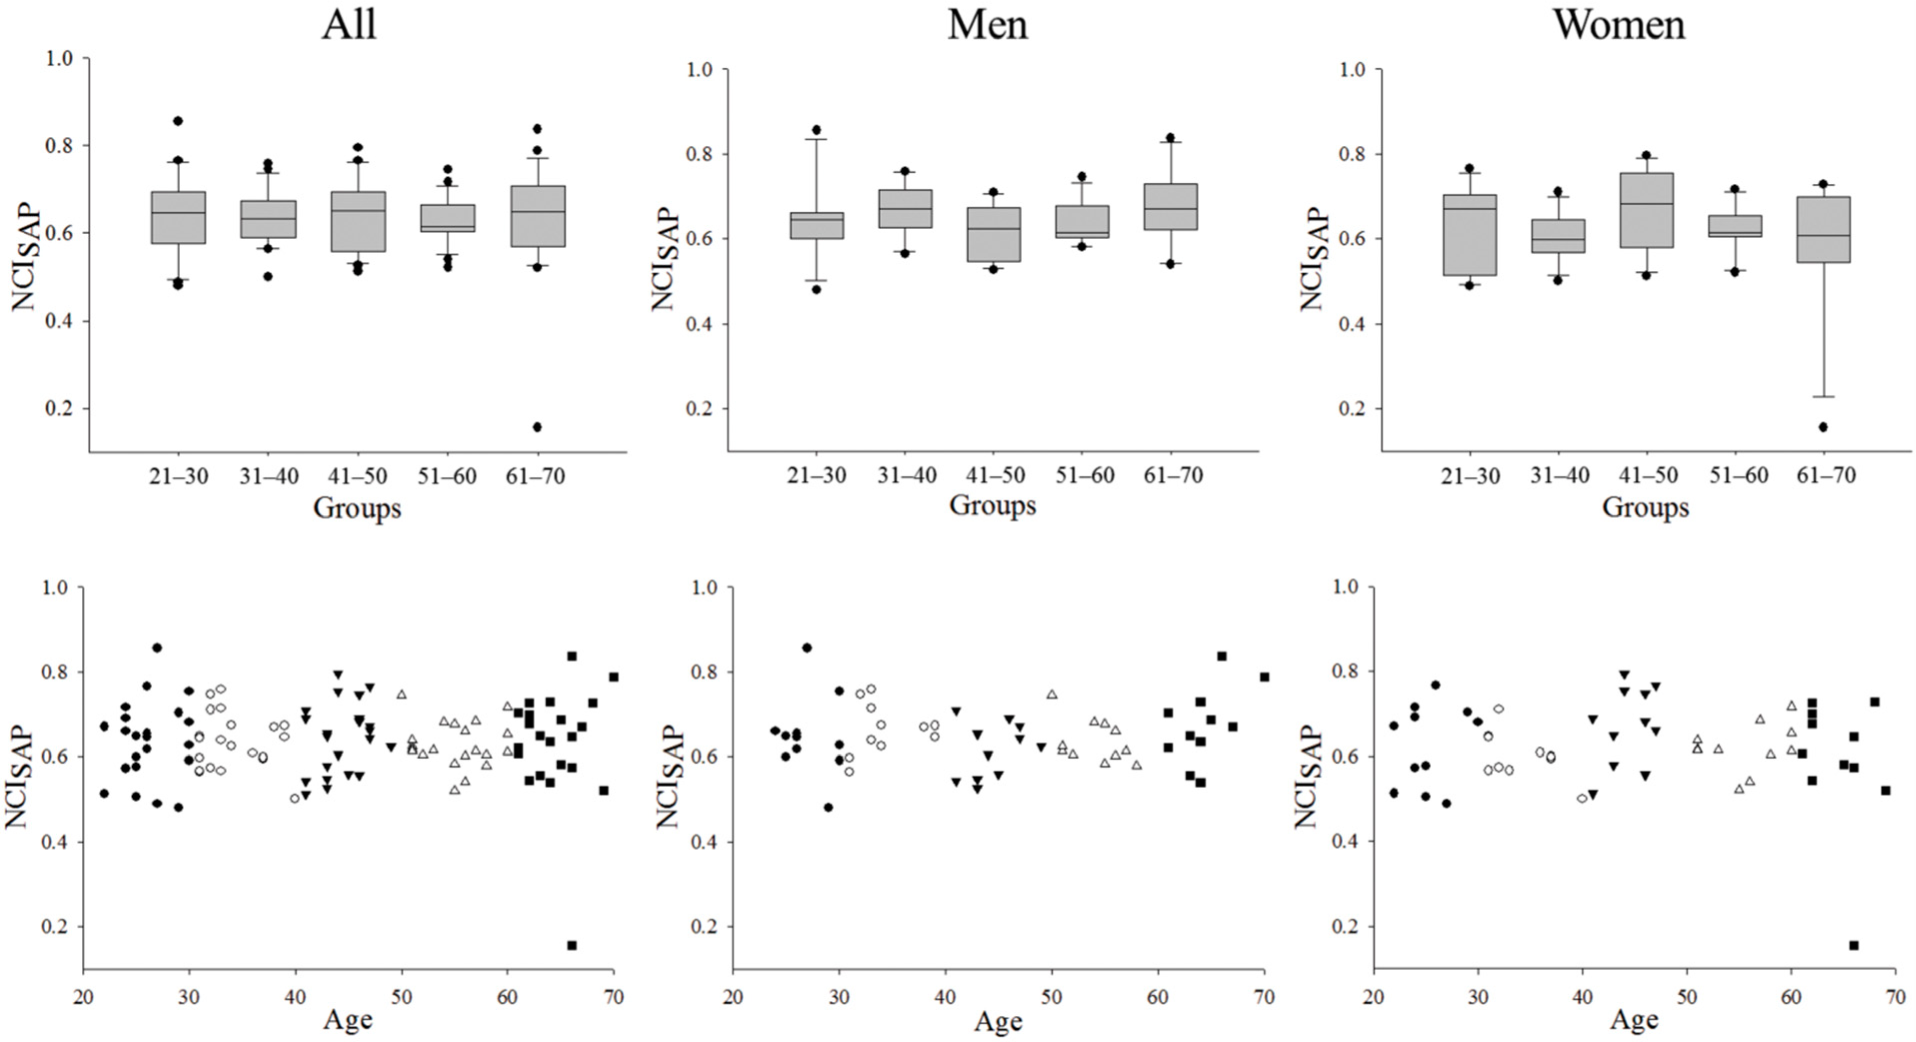
3.3. NCIHP and NCISAP at REST: Aging and Gender Effects

Figure 1 shows that NCIHP decreased with age in the overall population at REST. However, when the groups were divided by gender, a significant negative correlation of NCIHP on age was observed only in women. These data suggest that the decrease of HP complexity in women was the main cause of the decrease of NCIHP in the overall population.
In men there was a tendency for NCIHP to decrease, as suggested by the decreasing tendency in 41–50 compared to 31–40 and by the significantly lower values of 51–60 compared to 31–40, but this tendency was weak and finally did not produce a significant change from 21–30 to 61–70. Conversely, in women NCIHP was significantly lower in 61–70 compared to 21–30, 31–40 and 41–50 and a clear crossover was observed at 51–60 (NCIHP remained stable in 21–30, 31–40 and 41–50).
Similarly, Figure 2 shows that NCISAP decreased with age in the overall population. Again the analysis by gender showed that the decrease of NCISAP in women was responsible for the decrease of this variable in the overall population (NCISAP did not decrease in men). In women the decrease of NCISAP was particularly relevant in 61–70.

3.4. NCIHP and NCISAP during STAND: Aging and Gender Effects

Figure 3 shows that during STAND NCIHP did not vary with age and this result was independent of gender (i.e., NCIHP did not show any relation to age in either men or women). The same finding held in the case of NCISAP (Figure 4).

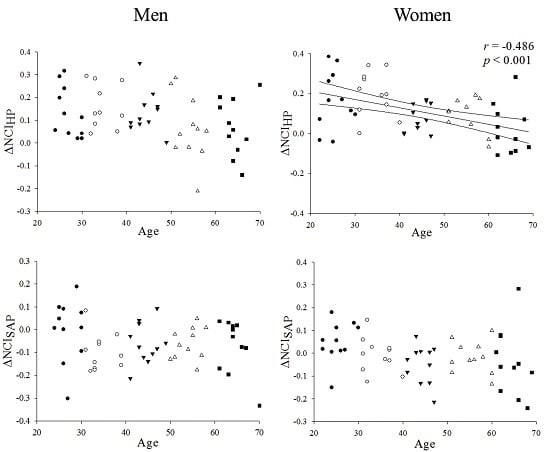
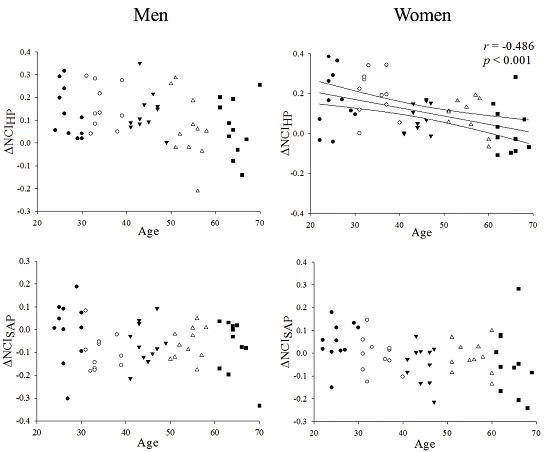
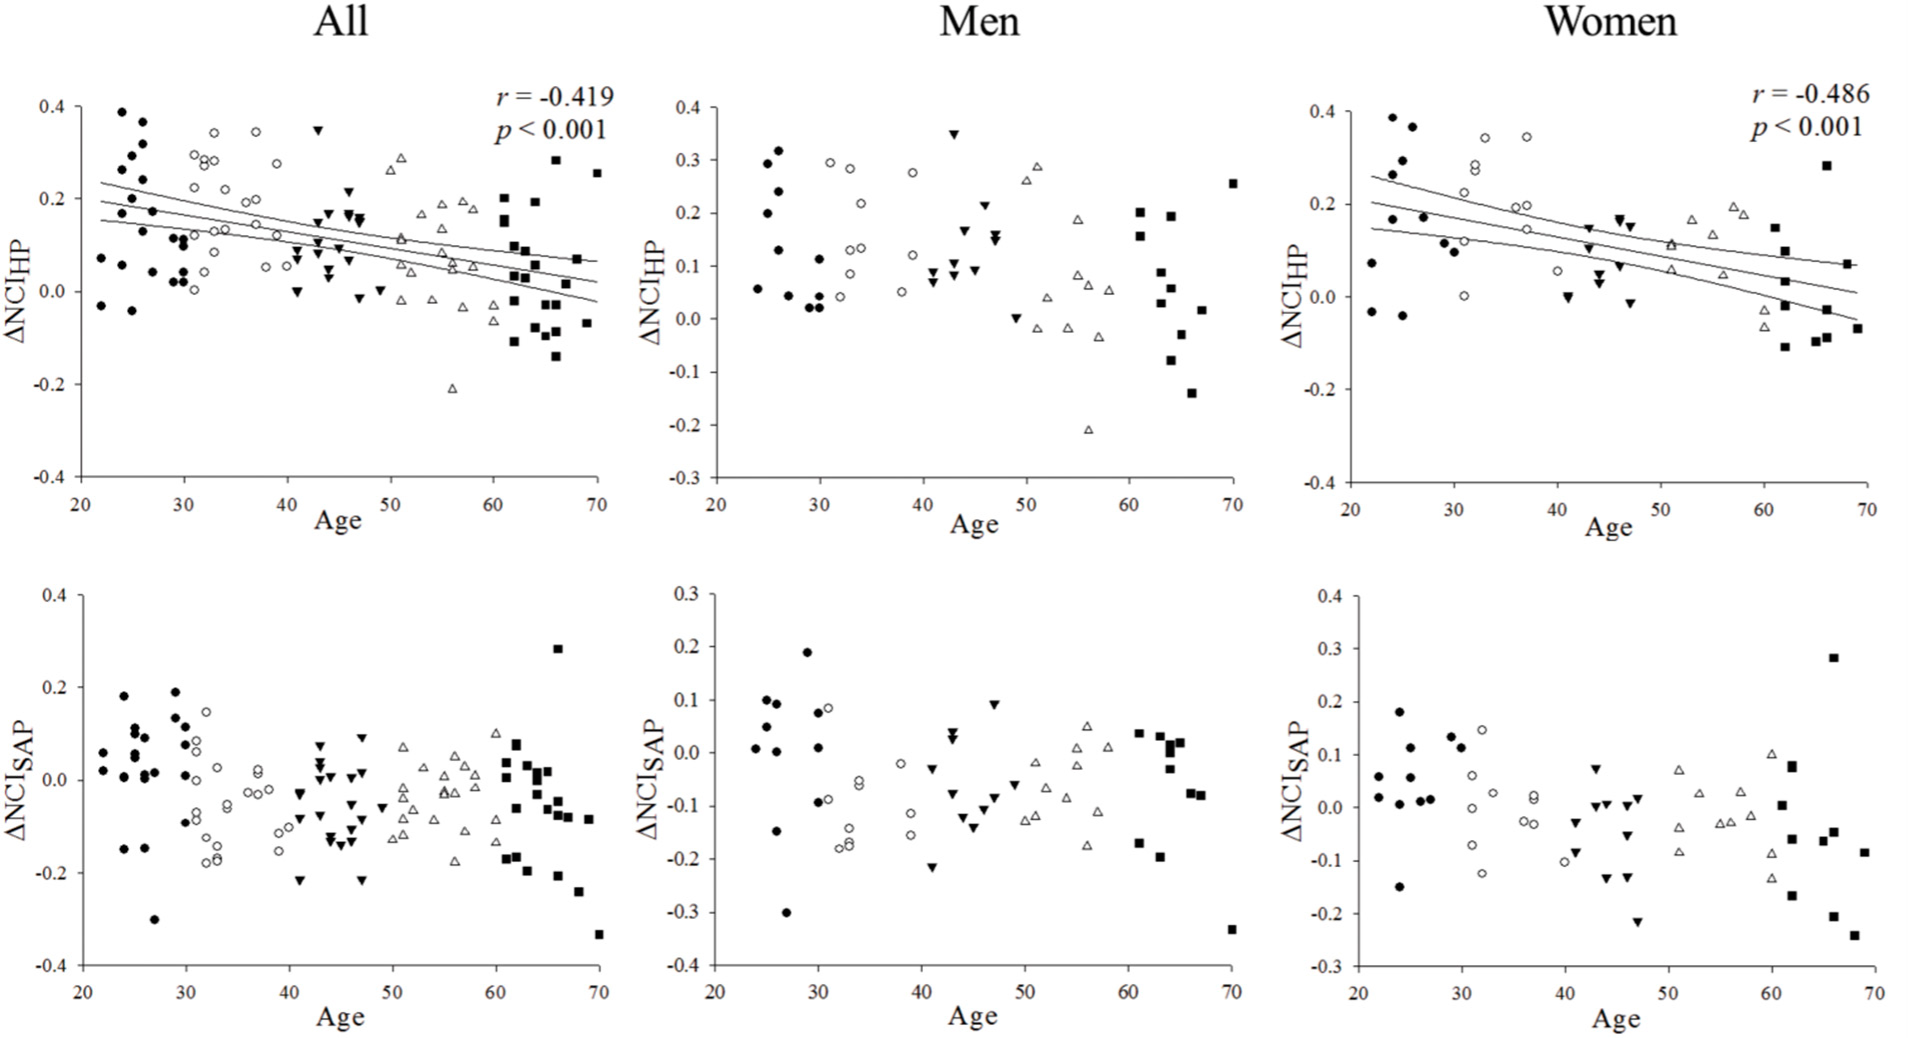
3.5. ΔNCIHP and ΔNCISAP: Aging and Gender Effects

Figure 5 shows the correlation of ΔNCIHP (upper panel) and ΔNCISAP (lower panel) to age. ΔNCI was assessed as the NCI at REST minus NCI during STAND and represents the individual response of complexity to the orthostatic challenge.
A significant change between 21–30 and 61–70 was detected in the case of ΔNCIHP in the overall population and in the subgroup of women. Linear correlation analysis of ΔNCIHP on age confirmed that the change of ΔNCIHP between 21–30 and 61–70 was related to aging. Therefore, the decrease of ΔNCIHP with age in the overall population was explained by the decrease of ΔNCIHP in women. Since no significant change between 21–30 and 61–70 was detected in the case of ΔNCISAP, linear association with age was not tested.

3.6. Linear Correlation Analysis between NCI and Time Domain Parameters

Table 3 shows the results of the linear regression analysis of time domain parameters (i.e., μHP, σ2HP, μSAP, and σ2SAP) on NCI in the overall group of subjects and after separation of the two genders. The correlation analysis was performed in the planes (μHP, NCIHP), (σ2HP, NCIHP), (μSAP, NCISAP), and (σ2SAP, NCISAP). At REST in the entire group we found that μHP and σ2HP are significantly correlated with NCIHP, while σ2SAP were significantly correlated with NCISAP. The correlation coefficient was positive in the case of μHP and σ2HP and negative in the case of σ2SAP. The same findings were obtained after separation of the two genders. During STAND in the overall group and in men the relations between μHP and NCIHP and between σ2SAP and NCISAP were confirmed. In women the correlation between σ2SAP and NCISAP was lost.

4. Discussion

The main findings of this study are: (i) at REST NCIHP and NCISAP decreased with age in the overall population and only women was responsible for this decrease; (ii) in women at REST the decrease of NCIHP started in 51–60 and became significant in 61–70, while in men a tendency toward a decrease was observable in 41–50; (iii) during STAND NCIHP and NCISAP was unrelated to age in the overall population and this trend held in both men and women; (iv) ΔNCIHP decreased with age in the overall population and again only women were responsible for this decrease; and (v) ΔNCISAP was unrelated to age in the overall population and analysis by gender confirmed this trend.

4.1. Selection of the Population

No remarkable differences among groups were detectable. Only a tendency to decrease the functional capacity evaluated by VO2 peak in both genders and a trend towards the increase of BMI in women were observed. These tendencies are expected, because the normal aging process is associated with a reduction in functional capacity of the main organs (lung, heart, and skeletal muscles) involved in oxygen transportation, delivery, and utilization beyond the loss of ability to perform aerobic exercise [3032] and with a propensity to overweight in women in the menopause period [33].

4.2. Complexity of the HP Variability at REST: Aging and Gender Effects

A significant decrease of HP variance and complexity was observed. These findings suggest that the magnitude of the HP changes became smaller and HP dynamics turned out to be more regular and predictable as a function of age. These results are in agreement with previous studies regardless of whether they are based on entropy rates [14,15,17,18,22,23,28,34] or on different metrics [2,13,15,16,19,22,23,29,34].
The most striking result of this study came out when the overall group was divided by gender: indeed, we found that the negative correlation of NCIHP at REST was present only in women, thus suggesting that the decrease of HP complexity in women is responsible for the decrease of HP complexity in the overall population. Men had a tendency to decrease NCIHP but this tendency did not lead to a significant change from 21–30 to 61–70. This observation is in agreement with the conclusion drawn by a recently proposed symbolic analysis approach [19]. Some studies using different nonlinear HP variability indexes detected the gender dependency of the relation of cardiac control complexity to age [13,16,17] but they rejected the statement that women have a significantly steeper negative relation with age than men. This discrepancy might be mostly the effect of the calculation of a biased entropy rate (i.e., ApEn) that might limit the statistical power in distinguishing groups [35]. It is worth noting that, despite the decrease of functional capacity evaluated by VO2 peak was observed in both men and women, the decline of the HP complexity was found only in women, thus suggesting that the changes of the HP complexity with age cannot be completely explained by modifications of the functional capacity. In addition, although in women there was a clear tendency to increase BMI (below the obesity threshold), the BMI variation was not significantly correlated with HP complexity modifications (REST: r = −0.10, p = 0.278; STAND: r = −0.01, p = 0.898).
It is not surprising to find out that gender is a factor modulating the relation of the complexity of the cardiac control with age at REST. Previous studies have reported that gender is one of the factors that influence cardiovascular autonomic regulation. Differences in adrenoreceptor responsiveness, arterial baroreflex sensitivity, cardiopulmonary baroreflex, and cardiac vagal and sympathetic activity and/or modulation [20,3640] contribute to differentiating the cardiovascular control of men and women. These differences might play a role in the different relation of complexity of the cardiac control with age. We attribute to menopause the main responsibility of the observed difference between genders. Ryan et al. [21] observed difference in HP complexity between men and women at REST. Women showed a HP complexity greater than men. This result was interpreted as the effect of estrogen in women, making cardiac control in women more complex than that in men. Since the level of estrogen in women dramatically drops during menopause, it is not surprising to find that this decrease is mirrored by a decrease of HP complexity in women. Since the decrease of estrogen is associated to a reduction in vagal function as well [38,42], the vagal withdrawal might have driven the observed reduction of HP complexity [35,43]. The analysis of the differences between men and women in a specific age group corroborated the observation that menopause is a key factor in decreasing HP complexity in women. Indeed, although no significant statistical differences between HP complexity in men and women were detected in any age group, likely as a result of the low statistical power of the study for this specific endpoint, we observed that NCIHP was systematically larger in women than in men in any age group except 61–70, thus suggesting that after menopause complexity of the HP series in women dramatically dropped. This result confirmed the progressive decrease of gender differences with age reported in [13,19,23,38,41].
Additionally, our data suggest that, while women showed a relevant drop in 51–60, men started to exhibit a tendency toward a decrease of NCIHP one decade before. Although this tendency was clear in men, it did not result in a significant change of NCIHP from 21–30 to 61–70. The more stable behavior of HP complexity with age in women in the decades before 51–60 suggests that until menopause the preserved levels of estrogen might contribute to keeping the HP complexity high, thus playing a protective role against adverse cardiac events in women [13,21,44,45]. Therefore, our data support the view that menopause identifies a significant turning point in cardiovascular physiology in women [46]. Indeed, it is known that women have lower incidence of cardiovascular disease compared to men until menopause [46], and this protective effect is mirrored by a tendency to have a higher complexity of cardiac control. After menopause an increased incidence of cardiovascular disease has been observed [46,47], and the observed significant reduction of complexity of cardiac control in women might be a hallmark of the increased risk of occurrence of cardiovascular events [5].

4.3. Complexity of the SAP Variability at REST: Aging and Gender Effects

Earlier studies described an increase of SAP mean [7,48] and SAP variability with aging [1012,4951]. These results have been interpreted as a consequence of the increase of sympathetic activity and/or modulation directed to the vessels with age [48]. However, a modified cardiac reserve [7], changes of the structure of the arteries (i.e., increased stiffness, decreased compliance, and endothelial dysfunction) [52], and changes of diastolic filling and increases in collagen in the left ventricle might play a role in the modification of SAP mean and variance with age [7,31]. Due to the abovementioned modifications all having a possible impact on SAP dynamics, a modification of the complexity of the SAP series at REST with age is expected.
In the present study we observed at REST a decrease of NCISAP with age in the overall population. This finding is in agreement with [18]. However, after separating women from men we found that the negative correlation of NCISAP with age was significant only in women. Therefore, it appears that the decrease of SAP complexity in women seems to be mainly responsible for the decrease of NCISAP in the overall population because the SAP complexity in men did not significantly decrease. The observed decrease in women is relevant as emphasized by the significantly lower NCISAP in 61–70 compared to 21–30. Similarly to the HP complexity, the relation of the SAP complexity with age observed in women cannot be fully explained as a result of the reduction of the functional capacity evaluated by VO2 peak with age, given that a similar VO2 peak decrease in men did not produce a significant change of the SAP complexity from 21–30 to 61–70. Again similarly to the HP complexity, the increase of BMI in women was not found to be correlated to SAP complexity variations (REST: r = −0.08, p = 0.405; STAND: r = −0.02, p = 0.800).
We speculate that, with the advent of menopause, the decrease in estrogen production leads to an increase in sympathetic tone [44,45,53,54] and sympathetic overactivity is mainly responsible for the reduction of SAP complexity with age in women [18]. Since the sympathetic drive increased with age even in men but was not associated to a reduction of the SAP complexity with age, we conclude that sympathetic control directed to the vessel is different in old men and women and this difference might be related to the sensitivity of cardiovascular control mechanisms to estrogen levels in women. Even though the abovementioned explanations are plausible, we cannot exclude the possibility that the progressive reduction of the SAP variability complexity with age might simply be a reflection of the decrease of HP variability complexity transferred to the SAP variability via the feedforward pathway, accounting for the Frank–Starling mechanism and the Windkessel effect [18].

4.4. Complexity of HP and SAP Variabilities during STAND: Aging and Gender Effects

During STAND, NCIHP and NCISAP did not vary with age. This result was in agreement with [18] when a similar metric (i.e., an entropy rate) was considered. Since this result held even when the overall group was divided by gender, we suggest that cardiovascular adjustments occurring during senescence in a healthy population in relation to one of the most important challenges for human beings (i.e., STAND) is responsible for the lack of any gender-dependent effect.

4.5. Individual Changes in the Complexity of HP and SAP Variabilities in Response to STAND

The study assessed the individual response to the orthostatic challenge by computing the difference between the complexity markers assessed at REST and during STAND (i.e., ΔNCI = NCI at REST–NCI during STAND). We confirm that in the youngest group (i.e., 21–30) ΔNCI was positive in the case of ΔNCIHP and was about 0 in the case of ΔNCISAP [43,55]. One of the original findings of this study is that ΔNCIHP decreased with age in the overall population, while ΔNCISAP was not affected by age. Since at REST both NCIHP and NCISAP decreased with age, the observed trends of ΔNCI cannot be considered exclusively a reflection of those of NCI at REST. This observation suggests that a mere decrease of vagal activity and/or sympathetic overactivation with age at REST might be insufficient to explain per se the progressive reduction of ΔNCIHP during senescence. We suggest that the decrease of ΔNCIHP with age is a sign of the difficulty that older individuals have in dealing with sympathetic stressors, such as the orthostatic challenge [37]: indeed, older subjects seem to lose their ability to decrease HP complexity by synchronizing the activity of several control mechanisms [35], likely via a sympathetic activation [56]. This loss of capability was not evident at the level of complexity of the vascular control, mainly because ΔNCISAP was already low in young subjects [43,55]. These findings are in agreement with those reported in [18,57,58] and can be explained by the reduced effect of the change of posture on the cardiovascular variables with age. The progressively limited influence of the orthostatic challenge has been attributed to the impairment of beta-adrenergic receptor stimulation [7,31], reduced efficiency of post-synaptic-adrenergic signaling [52], reduced vagal autonomic modulation to the sinus node [3,59,59], reduced sympathetic modulation to the vessels [48], and decreased baroreflex efficiency [48,58,60].
Remarkably, when the overall group was subdivided by gender we found that only women showed a significant negative correlation of ΔNCIHP on age. In men only, a tendency toward a decrease of ΔNCIHP was observed. However, this tendency did not produce a significant drop of ΔNCIHP from 21–30 to 61–70. Therefore, men did not contribute to the reduction of the individual response of HP complexity to postural challenge with age observed in the overall population, thus stressing further that the relation of the complexity of cardiac control with age is gender-dependent. It appears that the ability to synchronize several control mechanisms via a sympathetic activation was more importantly lost in women than in men. We speculate that the reduction of estrogen during menopause leads to a higher sympathetic tone at REST [20,21] and, thus, to a cardiovascular control less fit to react to the change of posture.

4.6. Linear Regression Analysis of NCI on Time Domain Parameters

From a methodological perspective, time domain parameters, such as mean and variance describing, respectively, the position and the dispersion of the HP and SAP distributions, provide completely different information compared to NCI quantifying the degree of irregularity of the series based on their unpredictability. Despite the different focus, we found an important association between time domain and complexity indexes. For example, the positive association between HP variance and HP complexity is due to their relation with vagal control increasing both HP variance and HP complexity [25,35] and the negative association between SAP variance and SAP complexity might be due to their relation with sympathetic control increasing SAP variance but decreasing SAP complexity, possibly via synchronization of peripheral vasomotion in different districts [56]. However, having a significant association between a time domain parameter and a complexity index does not imply that the two variables exhibit the same relation (significant or nonsignificant) with age. For example, despite HP mean and HP complexity being correlated at REST, the HP mean was not significantly related to age, while HP complexity was. This observation leads us to conclude that, although correlated, time domain parameters and complexity indexes carry non-redundant information.

5. Conclusions

Our study stresses that the relation of the complexity of cardiovascular control to age, as measured via the computation of an entropy rate over HP and SAP variabilities, is gender-dependent. Therefore, gender should be accounted for in any study assessing the complexity of the cardiovascular regulation. We observed that women exhibited a bigger drop in the complexity of cardiovascular control than men and this relevant decrease occurred after menopause, thus suggesting its association with the reduction of estrogen production during menopause. In addition, only women showed a progressively limited response to the orthostatic challenge with age, thus stressing again the dependence of complexity indexes on gender and suggesting that women tend to lose the physiological ability to reduce the complexity of cardiac control during orthostatic challenge at a faster rate with age than men, especially during menopause. This study suggests that complexity markers derived from cardiovascular variability are more helpful in following the aging process in women than in men. Similarly, orthostatic challenge appears to be more suitable in women than in men for emphasizing the difficulty that elderly subjects have in reacting to a postural challenge.

Acknowledgments

Research supported by FAPESP (Process 2010/52070-4) to Aparecida M. Catai, CAPES-PVE (Process 23028.007721/2013-4) to Aparecida M. Catai., Anielle C.M. Takahashi and Alberto Porta and CNPq (Process: 311938/2013-2) to Aparecida M. Catai. The founders had no role in study design, data collection and analysis, decision to publish, or preparation of the manuscript.

Author Contributions

Aparecida M. Catai: conception and design of the work, analysis of the data, interpretation of the data, drafting the article, critical revision of the manuscript.
Anielle C.M. Takahashi: conception of the work, analysis of the data, critical revision of the manuscript.
Natália M. Perseguini, Juliana C. Milan, Vinicius Minatel, Patrícia Rehder-Santos: acquisition of the data, analysis of the data.
Vlasta Bari, Andrea Marchi: analysis of the data.
Alberto Porta: conception and design of the work, interpretation of the data, drafting the article, critical revision of the manuscript.
All authors have read and approved the final manuscript.

Conflicts of Interest

The authors declare no conflict of interest.

References

  1. Goldberger, A.L.; Peng, C.K.; Lipsitz, L.A. What is physiologic complexity and how does it change with aging and disease? Neurobiol. Aging 2002, 23, 23–26. [Google Scholar]
  2. Pikkujämsä, S.M.; Mäkikallio, T.H.; Sourander, L.B.; Räihä, I.J.; Puukka, P.; Skyttä, J.; Peng, C.K.; Goldberger, A.L.; Huikuri, H.V. Cardiac interbeat interval dynamics from childhood to senescence: Comparison of conventional and new measures based on fractals and chaos theory. Circulation 1999, 100, 393–399. [Google Scholar]
  3. Lipsitz, L.A.; Mietus, J.; Moody, G.B.; Goldberger, A.L. Spectral characteristics of heart rate variability before and during postural tilt: Relations to aging and risk of syncope. Circulation 1990, 81, 1803–1810. [Google Scholar]
  4. Kaplan, D.T.; Furman, M.; Pincus, S.M.; Ryan, S.M.; Lipsitz, L.A.; Goldberger, A.L. Aging and the complexity of cardiovascular dynamics. Biophys. J. 1991, 59, 945–949. [Google Scholar]
  5. Bigger, J.T., Jr.; Fleiss, J.L.; Steinman, R.C.; Rolnitzky, L.M.; Kleiger, R.E.; Rottman, J.N. Frequency domain measures of heart period variability and mortality after myocardial infarction. Circulation 1992, 85, 164–171. [Google Scholar]
  6. Catai, A.M.; Chacon-Mikahil, M.P.; Martinelli, F.S.; Forti, V.A.; Silva, E.; Golfetti, R.; Martins, L.E.; Szrajer, J.S.; Wanderley, J.S.; Lima-Filho, E.C.; et al. Effects of aerobic exercise training on heart rate variability during wakefulness and sleep and cardiorespiratory responses of young and middle-aged healthy men. Braz. J. Med. Biol. Res. 2002, 35, 741–752. [Google Scholar]
  7. Lakatta, E.G.; Levy, D. Arterial and cardiac aging: Major shareholders in cardiovascular disease enterprises: Part I: Aging arteries: A “set up” for vascular disease. Circulation 2003, 107, 139–146. [Google Scholar]
  8. Melo, R.C.; Santos, M.D.; Silva, E.; Quiterio, R.J.; Moreno, M.A.; Reis, M.S.; Verzola, I.A.; Oliveira, L.; Martins, L.E.; Gallo, L., Jr.; et al. Effects of age and physical activity on the autonomic control of heart rate in healthy men. Braz. J. Med. Biol. Res. 2005, 38, 1331–1338. [Google Scholar]
  9. Zhang, J. Effect of age and sex on heart rate variability in healthy subjects. J. Manip. Physiol. Ther. 2007, 30, 374–379. [Google Scholar]
  10. Mancia, G.; Ferrari, A.; Gregorini, L.; Parati, G.; Pomidossi, G.; Bertinieri, G.; Grassi, G.; di Rienzo, M.; Pedotti, A.; Zanchetti, A. Blood pressure and heart rate variabilities in normotensive and hypertensive human beings. Circ. Res. 1983, 53, 96–104. [Google Scholar]
  11. Mann, S.; Millar Craig, M.W.; Altman, D.G.; Raftery, E.B.; Hunyor, S.N. Blood pressure variability in health, hypertension and autonomic failure. Clin. Exp. Hypertens. 1985, 7, 187–194. [Google Scholar]
  12. Watson, R.D.S.; Stallard, T.J.; Flinn, R.M.; Littler, W.A. Factors determining direct arterial pressure and its variability in hypertensive man. Hypertension 1980, 2, 333–341. [Google Scholar]
  13. Beckers, F.; Verheyden, B.; Aubert, A.E. Aging and nonlinear heart rate control in a healthy population. Am. J. Physiol. 2006, 290, H2560–H2570. [Google Scholar]
  14. Viola, A.U.; Tobaldini, E.; Chellappa, S.L.; Rabello Casali, K.; Porta, A.; Montano, N. Short-term complexity of cardiac autonomic control during sleep: REM as a potential risk factor for cardiovascular system in aging. PLoS ONE 2011, 6. [Google Scholar] [CrossRef]
  15. Takahashi, A.C.M.; Porta, A.; Melo, R.C.; Quitério, R.J.; da Silva, E.; Borghi-Silva, A.; Tobaldini, E.; Montano, N.; Catai, A.M. Aging reduces complexity of heart rate variability by conditional entropy and symbolic analysis. Intern. Emerg. Med. 2012, 7, 229–235. [Google Scholar]
  16. Vandeput, S.; Verheyden, B.; Aubert, A.E.; van Huffel, S. Nonlinear heart rate dynamics: Circadian profile and influence of age and gender. Med. Eng. Phys. 2012, 34, 108–117. [Google Scholar]
  17. Nemati, S.; Edwards, B.A.; Lee, J.; Pittman-Polletta, B.; Butler, J.P.; Malhotra, A. Respiration and heart rate complexity: Effects of age and gender assessed by band-limited transfer entropy. Respir. Physiol. Neurobiol. 2013, 189, 27–33. [Google Scholar]
  18. Porta, A.; Faes, L.; Bari, V.; Marchi, A.; Bassani, T.; Nollo, G.; Perseguini, N.M.; Milan, J.; Minatel, V.; Borghi-Silva, A.; et al. Effect of age on complexity and causality of the cardiovascular control: Comparison between model-based and model-free approaches. PLoS ONE 2014, 9. [Google Scholar] [CrossRef]
  19. Mueller, A.; Bonnemeier, H.; Malberg, H.; Kurths, J.; Wessel, N. Age-Dependent Changes in the Manifestations of gender-related differences in the cardiovascular regulation. Proceedings of the 8th Conference of the European Study Group on Cardiovascular Oscillations (ESGCO 2014), Trento, Italy, 25–28 May 2014; pp. 147–148.
  20. Perseguini, N.M.; Takahashi, A.C.M.; Rebelatto, J.R.; Silva, E.; Borghi-Silva, A.; Porta, A.; Montano, N.; Catai, A.M. Spectral and symbolic analysis of the effect of gender and postural change on cardiac autonomic modulation in health elderly subjects. Braz. J. Med. Biol. Res. 2011, 44, 29–37. [Google Scholar]
  21. Ryan, S.M.; Goldberger, A.L.; Pincus, S.M.; Mietus, J.; Lipsitz, L.A. Gender- and age-related differences in heart rate dynamics: are women more complex than men? J. Am. Coll. Card. 1994, 24, 1700–1707. [Google Scholar]
  22. Voss, A.; Heitmann, A.; Schroeder, R.; Peters, A.; Perz, S. Short-term heart rate variability—Age dependence in healthy subjects. Physiol. Meas. 2012, 33, 1289–1311. [Google Scholar]
  23. Voss, A.; Schroeder, R.; Fisher, C.; Heitmann, A.; Peters, A.; Perz, S. Influence of age and gender on complexity measures for short-term heart rate variability analysis in healthy subjects. Proceedings of the 35th Annual International Conference of the IEEE EMBS, Osaka, Japan, 3–7 July 2013; pp. 5574–5577.
  24. Porta, A.; Baselli, G.; Liberati, D.; Montano, N.; Cogliati, C.; Gnecchi-Ruscone, T.; Malliani, A.; Cerutti, S. Measuring regularity by means of a corrected conditional entropy in sympathetic outflow. Biol. Cybern. 1998, 78, 71–78. [Google Scholar]
  25. Malik, M.; Bigger, J.T.; Camm, A.J.; Kleiger, R.E.; Malliani, A.; Moss, A.J.; Schwartz, P.J. Heart rate variability: Standards of measurement, physiological interpretation and clinical use. Eur. Heart J. 1996, 17, 354–381. [Google Scholar]
  26. Magagnin, V.; Bassani, T.; Bari, V.; Turiel, M.; Maestri, R.; Pinna, G.D.; Porta, A. Non-stationarities significantly distort short-term spectral, symbolic and entropy heart rate variability indexes. Physiol. Meas. 2011, 32, 1775–1786. [Google Scholar]
  27. Richman, J.S.; Moorman, J.R. Physiological time-series analysis using approximate entropy and sample entropy. Am. J. Physiol. 2000, 278, H2039–H2049. [Google Scholar]
  28. Pincus, S.M. Approximate entropy as a measure of system complexity. Proc. Natl. Acad. Sci. 1991, 88, 2297–2301. [Google Scholar]
  29. Porta, A.; Faes, L.; Masé, M.; D’Addio, G.; Pinna, G.D.; Maestri, R.; Montano, N.; Furlan, R.; Guzzetti, S.; Nollo, G.; et al. An integrated approach based on uniform quantization for the evaluation of complexity of short-term heart period variability: Application to 24 h Holter recordings in healthy and heart failure humans. Chaos 2007, 17. [Google Scholar] [CrossRef]
  30. Wasserman, K.; Hansen, J.E.; Sue, D.Y.; Casaburi, R.; Whipp, B.J. Principles of Exercise Testing and Interpretation, 3rd ed; Lippincott Williams & Wilkins: Baltimore, MD, USA, 1999. [Google Scholar]
  31. Fleg, J.L.; Strait, J. Age-associated changes in cardiovascular structure and function: A fertile milieu for future disease. Heart Fail. Rev. 2012, 17, 545–554. [Google Scholar]
  32. Burtscher, M. Exercise limitations by the oxygen delivery and utilization systems in aging and disease: Coordinated adaptation and deadaptation of the lung-heart muscle axis—A mini-review. Gerontology 2013, 59, 289–296. [Google Scholar]
  33. Dubnov, G.; Brzezinski, A.; Berry, M. Weight control and the management of obesity after menopause: The role of physical activity. Maturitas 2003, 44, 89–101. [Google Scholar]
  34. Lipsitz, L.A.; Goldberger, A.L. Loss of “complexity” and aging: potential applications of fractals and chaos theory to senescence. J. Am. Med. Assoc. 1992, 267, 1806–1809. [Google Scholar]
  35. Porta, A.; Gnecchi-Ruscone, T.; Tobaldini, E.; Guzzetti, S.; Furlan, R.; Montano, N. Progressive decrease of heart period variability entropy-based complexity during graded head-up tilt. J. Appl. Physiol. 2007, 103, 1143–1149. [Google Scholar]
  36. Convertino, V.A. Gender differences in autonomic functions associated with blood pressure regulation. Am. J. Physiol. 1998, 275, R1909–R1920. [Google Scholar]
  37. Laitinen, T.; Hartikainen, J.; Vanninen, E.; Niskanen, L.; Geelen, G.; Lansimies, E. Age and gender dependency of baroreflex sensitivity in healthy subjects. J. Appl. Physiol. 1998, 84, 576–583. [Google Scholar]
  38. Kuo, T.B.; Lin, T.; Yang, C.C.; Li, C.L.; Chen, C.F.; Chou, P. Effect of aging on gender differences in neural control of heart rate. Am J. Physiol. 1999, 277, H2233–H2239. [Google Scholar]
  39. Evans, J.M.; Ziegler, M.G.; Patwardhan, A.R.; Ott, J.B.; Kim, C.S.; Leonelli, F.M.; Knapp, C.F. Gender differences in autonomic cardiovascular regulation: Spectral, hormonal and hemodynamic indexes. J. Appl. Physiol. 2001, 91, 2611–2618. [Google Scholar]
  40. Pikkujämsä, S.M.; Mäkikallio, T.H.; Airaksinen, K.E.J.; Huikuri, H.V. Determinants and interindividual variation of R-R interval dynamic in healthy middle-aged subjects. Am. J. Physiol. 2001, 280, H1400–H1406. [Google Scholar]
  41. Ramaekers, D.; Ector, H.; Aubert, A.E.; Rubens, A.; Van de Werf, F. Heart rate variability in healthy volunteers. Is the female autonomic system cardioprotective? Eur. Heart J. 1998, 19, 1334–1341. [Google Scholar]
  42. Bonnemeier, H.; Wiegand, U.K.H.; Brandes, A.; Kluge, N.; Katus, H.A.; Richardt, G.; Potratz, J. Circadian profile of cardiac autonomic nervous modulation in healthy subjects: Differing effects of aging and gender on heart rate variability. J. Cardiovasc. Electrophysiol. 2003, 14, 791–799. [Google Scholar]
  43. Porta, A.; Castiglioni, P.; di Rienzo, M.; Bari, V.; Bassani, T.; Marchi, A.; Takahashi, A.C.M.; Tobaldini, E.; Montano, N.; Catai, A.M.; et al. Short-term complexity indexes of heart period and systolic arterial pressure variabilities provide complementary information. J. Appl. Physiol. 2012, 113, 1810–1820. [Google Scholar]
  44. Mendelshon, M.E. Protective effects of estrogen on the cardiovascular system. Am. J. Cardiol. 2002, 89, 12E–17E. [Google Scholar]
  45. Mercuro, G.; Podda, A.; Pitzalis, L.; Zoncu, S.; Mascia, M.; Melis, G.B.; Rosano, G.M. Evidence of a role of endogenous estrogen in the modulation of autonomic nervous system. Am. J. Cardiol. 2000, 85, 787–789. [Google Scholar]
  46. Hayward, C.S.; Kelly, R.P.; Collins, P. The roles of gender, the menopause and hormone replacement on cardiovascular function. Cardiovasc. Res. 2000, 46, 28–49. [Google Scholar]
  47. Genazzani, A.R. Controversial issues in climacteric medicine (I) Cardiovascular disease and hormone replacement therapy. In Maturitas, International Menopause Society Expert Workshop, royal society of medicine, London, UK, 13–16 October 2000; 2001; 38, pp. 263–271. [Google Scholar]
  48. Laitinen, T.; Niskamen, L.; Geelen, G.; Lansimies, E.; Hartikainen, J. Age dependency of cardiovascular autonomic responses to head-up tilt in healthy subjects. J. Appl. Physiol. 2004, 96, 2333–2340. [Google Scholar]
  49. Kikuya, M.; Hozawa, A.; Ohokubo, T.; Tsuji, I.; Michimata, M.; Matsubara, M.; Ota, M.; Nagai, K.; Araki, T.; Satoh, H.; et al. Prognostic significance of blood pressure and heart rate variabilities: The Ohasama study. Hypertension 2000, 36, 901–906. [Google Scholar]
  50. Singh, D.; Vinod, K.; Saxena, S.C.; Deepa, K.K. Spectral evaluation of aging effects on blood pressure and heart rate variations in healthy subjects. J. Med. Eng. Techn. 2006, 30, 145–150. [Google Scholar]
  51. Stauss, H.M. Identification of blood pressure control mechanisms by power spectral analysis. Clin. Exp. Pharmacol. Physiol. 2007, 34, 362–368. [Google Scholar]
  52. Lakatta, E.G. Arterial aging is risky. J. Appl. Physiol. 2008, 105, 1321–1322. [Google Scholar]
  53. Liu, C.C.; Kuo, T.B.J.; Yang, C.C.H. Effects of estrogen on gender-related autonomic differences in humans. Am. J. Physiol. 2003, 285, H2188–H2193. [Google Scholar]
  54. Rosano, G.M.C.; Patrizi, R.; Leonardo, F.; Ponikowski, P.; Collins, P.; Sarrel, P.M.; Chierchia, S.L. Effect of estrogen replacement therapy on heart rate variability and heart rate in healthy postmenopausal women. Am. J. Cardiol. 1997, 80, 815–817. [Google Scholar]
  55. Turianikova, Z.; Javorka, K.; Baumert, M.; Calkovska, A.; Javorka, M. The effect of orthostatic stress on multiscale entropy of heart rate and blood pressure. Physiol. Meas. 2011, 32, 1425–1437. [Google Scholar]
  56. Baselli, G.; Porta, A.; Pagani, M. Coupling arterial windkessel with peripheral vasomotion: Modeling the effects on low-frequency oscillations. IEEE Trans. Biomed. Eng. 2006, 53, 53–64. [Google Scholar]
  57. Barnett, S.R.; Morin, R.J.; Kiely, D.K.; Gagnon, M.; Azhar, G.; Knight, E.L.; Nelson, J.C.; Lipsitz, L.A. Effects of age and gender on autonomic control of blood pressure dynamics. Hypertension 1999, 33, 1195–1200. [Google Scholar]
  58. Veermann, D.P.; Imholz, B.P.M.; Wieling, W.; Karemaker, J.M.; van Mortfrans, G.A. Effects of aging on blood pressure variability in resting conditions. Hypertension 1994, 24, 120–130. [Google Scholar]
  59. Zulfiqar, U.; Jurivich, D.A.; Gao, W.; Singer, D.H. Relation of high heart rate variability to healthy longevity. Am. J. Cardiol. 2010, 105, 1181–1185. [Google Scholar]
  60. Jones, P.P.; Christou, D.D.; Jordan, J.; Seals, D.R. Baroreflex buffering is reduced with age in healthy men. Circulation 2003, 107, 1770–1774. [Google Scholar]
Figure 1. Box-and-whisker plots of NCIHP at REST (upper panels) and linear regression of NCIHP on age (lower panels). The linear regression over all values (i.e., solid circles: age 21–30; open circles: age 31–40; solid triangles pointing down: age 41–50; open triangles pointing up: age 51–60; solid squares: age 61–70) and its 95% confidence interval are plotted when a significant change from 21–30 to 61–70 is detected according to one-way analysis of variance. The symbol * indicates p < 0.05.
Entropy 16 06686f1
Figure 2. Box-and-whisker plots of NCISAP at REST (upper panels) and linear regression of NCISAP on age (lower panels). The linear regression over all values (i.e., solid circles: age 21–30; open circles: age 31–40; solid triangles pointing down: age 41–50; open triangles pointing up: age 51–60; solid squares: age 61–70) and its 95% confidence interval are plotted when a significant change from 21–30 to 61–70 is detected according to one-way analysis of variance. The symbol * indicates p < 0.05.
Entropy 16 06686f2
Figure 3. Box-and-whisker plots of NCIHP during STAND (upper panels) and linear regression of NCIHP on age (lower panels). The linear regression over all values (i.e., solid circles: age 21–30; open circles: age 31–40; solid triangles pointing down: age 41–50; open triangles pointing up: age 51–60; solid squares: age 61–70) and its 95% confidence interval are plotted when a significant change from 21–30 to 61–70 is detected according to one-way analysis of variance. The symbol * indicates p < 0.05.
Entropy 16 06686f3
Figure 4. Box-and-whisker plots of NCISAP during STAND (upper panels) and linear regression of NCISAP on age (lower panels). The linear regression over all values (i.e., solid circles: age 21–30; open circles: age 31–40; solid triangles pointing down: age 41–50; open triangles pointing up: age 51–60; solid squares: age 61–70) and its 95% confidence interval are plotted when a significant change from 21–30 to 61–70 is detected according to one-way analysis of variance. The symbol * indicates p < 0.05.
Entropy 16 06686f4
Figure 5. Linear regression of ΔNCIHP (upper panels) and ΔNCISAP (lower panels) on age. The linear regression over all values (i.e., solid circles: age 21–30; open circles: age 31–40; solid triangles pointing down: age 41–50; open triangles pointing up: age 51–60; solid squares: age 61–70) and its 95% confidence interval are plotted when a significant change from 21–30 to 61–70 is detected according to one-way analysis of variance. ΔNCI is assessed as NCI at REST minus NCI during STAND.
Entropy 16 06686f5
Table 1. Characteristics of the population.
Age bin21–3031–4041–5051–6061–70
110 volunteers11 M/11 F11 M/11 F11 M/11 F11 M/11 F11 M/11 F

Age (years)26 (24–29)33 (32–37)44 (43–46)55 (51–57)64 (62–66)
Height (cm)169 (164–178)168 (163–174)170 (160–174)168 (159–172)163 (155–167)
Weight (kg)67.5 (59.5–73.0)65.1 (60.0–75.0)73.0 (64.1–83.0)65.2 (58.0–73.0)67.5 (62.0–73.0)
BMI (kg/m2)23 (21–24)24 (22–25)26 (23–28)*§25 (23–25)25 (24–27)*
VO2 peak (mL/kg/min)34 (28–40)36 (28–43)29 (24–38)27 (23–34)§24 (19–30)§

Men11 M11 M11 M11 M11 M

Age (years)26 (25–30)33 (32–37)44 (43–47)55 (51–56)64 (63–66)
Height (cm)174 (170–182)172 (168–178)174 (170–181)171 (168–177)166 (164–176)
Weight (kg)73.0 (68.6–80.0)75.0 (69.1–78.2)80.0 (76.1–86.7)72.0 (69.0–80.9)68.2 (65.5–76.6)
BMI (kg/m2)24 (23–26)24 (23–26)26 (25–28)25 (22–25)24 (24–27)
VO2 peak (mL/kg/min)37 (36–41)42 (36–45)38 (30–42)§33 (30–38)§29 (26–31)§

Women11 F11 F11 F11 F11 F

Age (years)25 (24–27)33 (31–37)44 (43–46)56 (52–59)65 (62–66)
Height (cm)164 (159–167)163 (159–165)160 (158–165)159 (151–165)155 (148–162)
Weight (kg)59.5 (51.9–63.5)60.0 (53.1–62.7)64.1 (62.0–71.5)58.5 (57.1–61.1)66.3 (56.5–70.1)
BMI (kg/m2)22 (20–23)22 (20–25)25 (24–26)*24 (23–25)27 (25–27)*§
VO2 peak (mL/kg/min)28 (25–31)27 (25–36)27 (22–29)22 (20–25)*§19 (18–21)*§#
Values are expressed as median (1st quartile–3rd quartile). F: female; M: male; BMI: body mass index; VO2 peak: peak oxygen uptake.
*p < 0.05 compared to 21–30;
§p < 0.05 compared to 31–40;
#p < 0.05 compared to 41–50.
Table 2. Linear regression analysis of time domain parameters on age.
Experimental Condition
REST
STAND
Indexrsignificancersignificance
All
(55 M/55 F)
μHP0.027No0.258Yes
σ2HP−0.378Yes−0.433Yes
μSAP0.287Yes0.324Yes
σ2SAP0.339Yes−0.003No

Men
(55 M)
μHP−0.037No0.015No
σ2HP−0.415Yes−0.546Yes
μSAP0.064No0.153No
σ2SAP0.220No−0.137No

Women
(55 F)
μHP0.106No0.579Yes
σ2HP−0.348Yes−0.326Yes
μSAP0.477Yes0.480Yes
σ2SAP0.424Yes0.148No
μHP: HP mean; σ2HP: HP variance; μSAP: SAP mean; σ2SAP: SAP variance; r: Pearson correlation coefficient; Yes/No: detection of a significant correlation with p < 0.05.
Table 3. Linear regression analysis of time domain parameters on NCI.
Experimental Condition
REST
STAND
Indexrsignificancersignificance
All
(55 M/55 F)
μHP0.422Yes0.394Yes
σ2HP0.343Yes–0.046No
μSAP–0.161No0.070No
σ2SAP–0.493Yes–0.333Yes

Men
(55 M)
μHP0.585Yes0.546Yes
σ2HP0.432Yes0.090No
μSAP–0.143No–0.034No
σ2SAP–0.503Yes–0.550Yes

Women
(55 F)
μHP0.388Yes0.401Yes
σ2HP0.294Yes–0.127No
μSAP–0.178No0.109No
σ2SAP–0.5Yes–0.205No
μHP: HP mean; σ2HP: HP variance; μSAP: SAP mean; σ2SAP: SAP variance; r: Pearson correlation coefficient; Yes/No: detection of a significant correlation with p < 0.05. μHP and σ2HP were tested against NCIHP, while μSAP and σ2SAP against NCISAP.

