Prediction Method for Image Coding Quality Based on Differential Information Entropy

Abstract
: For the requirement of quality-based image coding, an approach to predict the quality of image coding based on differential information entropy is proposed. First of all, some typical prediction approaches are introduced, and then the differential information entropy is reviewed. Taking JPEG2000 as an example, the relationship between differential information entropy and the objective assessment indicator PSNR at a fixed compression ratio is established via data fitting, and the constraint for fitting is to minimize the average error. Next, the relationship among differential information entropy, compression ratio and PSNR at various compression ratios is constructed and this relationship is used as an indicator to predict the image coding quality. Finally, the proposed approach is compared with some traditional approaches. From the experiments, it can be seen that the differential information entropy has a better linear relationship with image coding quality than that with the image activity. Therefore, the conclusion can be reached that the proposed approach is capable of predicting image coding quality at low compression ratios with small errors, and can be widely applied in a variety of real-time space image coding systems for its simplicity.1. Introduction
With the gradual reduction of the Earth’s resources, countries all over the world are becoming increasingly aware of the importance of exploiting space resources. The European Space Agency (ESA) has completed the Near-Infrared Spectrograph, which is contributing to the international James Webb Space Telescope (a space observatory set for launch on an Ariane 5 rocket in 2018). NASA’s Voyager 1 spacecraft has ventured into interstellar space. The probe is now about 19 billion kilometers from our sun. China is expected to launch its fifth lunar probe, Chang’e-5, in 2017 to send back a moon rock sample to Earth. The NO.1 High-Resolution satellite was launched in the first batch and is a component of the major China High-Resolution Earth Observation System (CHEOS) technical project. The target is to provide accurate service for sectors of land, environment and agriculture, etc.
In all these projects, observing images is an efficient way for the acquisition of space information. These images are always sent back to the ground for observation, but the data channels for space communication are always limited. The goal of image coding is to resolve the contradiction between the large amounts of high resolution images and the limited data channels. The wavelet-based coding technique is an important research direction in the field of image coding [1–3]. One of the key steps in the wavelet-based coding technique is rate control. For example, JPEG2000, which is an excellent currently used well-known coding algorithm, can control the bit rate accurately and conveniently by a post-coding rate-distortion optimization algorithm. Currently, a lot of research has been done on the rate control algorithms in JPEG2000 [4–6]. These algorithms consume large amounts of memory and computing time for the reason that most of the coding process must be performed in order to estimate the image distortion. Therefore, prediction of image quality (image distortion) before coding is very useful for the implementation of the image coding algorithms due to the reduction of the memory cost and the computing time. Saha analyzed the relationship between coding quality and image activity measure (IAM) at a fixed bit rate [7,8]. Li proposed a model to predict JPEG2000 image quality at high compression ratios (CR) which obtained desirable prediction accuracy, but required a compression ratio larger than 10:1 [9]. In remote sensing, the compression ratio is usually low for fear of large image distortion. However, when the compression ratio is low, it is always difficult to predict image coding quality accurately.
In this paper, differential information entropy is used to predict the image coding quality at low compression ratios. The rest of the paper is organized as follows: in Section 2, a brief introduction on the background of the topic is given. In Section 3, differential information entropy is introduced. Taking the JPEG2000 coding algorithm as an example, the relationship between the differential information entropy and the objective assessment indicator (Peak Signal-to-Noise Ratio—PSNR) at fixed compression ratios is established through data fitting. In Section 4, the relationship among differential information entropy, compression ratio and PSNR is studied. The conclusions are drawn in Section 5.
2. Background
It is important to predict image coding quality before coding for the purpose of reducing the memory cost and the computing time. The relationship between the image coding performance and the image activity at fixed compression ratios was established in previous researches [7–9], and is given as follows:
Li established the relationship between image coding performance and image activity at dynamic compression ratios as follows [9]:
3. Differential Information Entropy
In these studies, it is clearly shown that the prediction accuracy of image coding quality depends on the relationship between the image activity and PSNR. We find out that for some images, the relationship between the image activity and PSNR is not that close. Three images are shown in Figure 2a,b and c with similar image activity. Also, the logarithm of the image activity (lnIAMD1) is used to measure the image activity for each image, which are 2.12, 2.10 and 2.00, respectively.
From the lnIAMD1 values, it seems that the images in Figure 2a and Figure 2b have similar image coding performance. Then the JPEG2000 algorithm is used to code the images. The compression ratio is 4 and the coding performance is measured by PSNR. The PSNR values of the three images are 51.12, 53.79 and 54.17, respectively. The experimental results indicate that the images in Figure 2b and Figure 2c are similar in the coding performance which is different from the prediction results made by lnIAMD1. Therefore, the first purpose of the paper is to find an image coding quality prediction descriptor, which can more accurately reflect image coding performance.
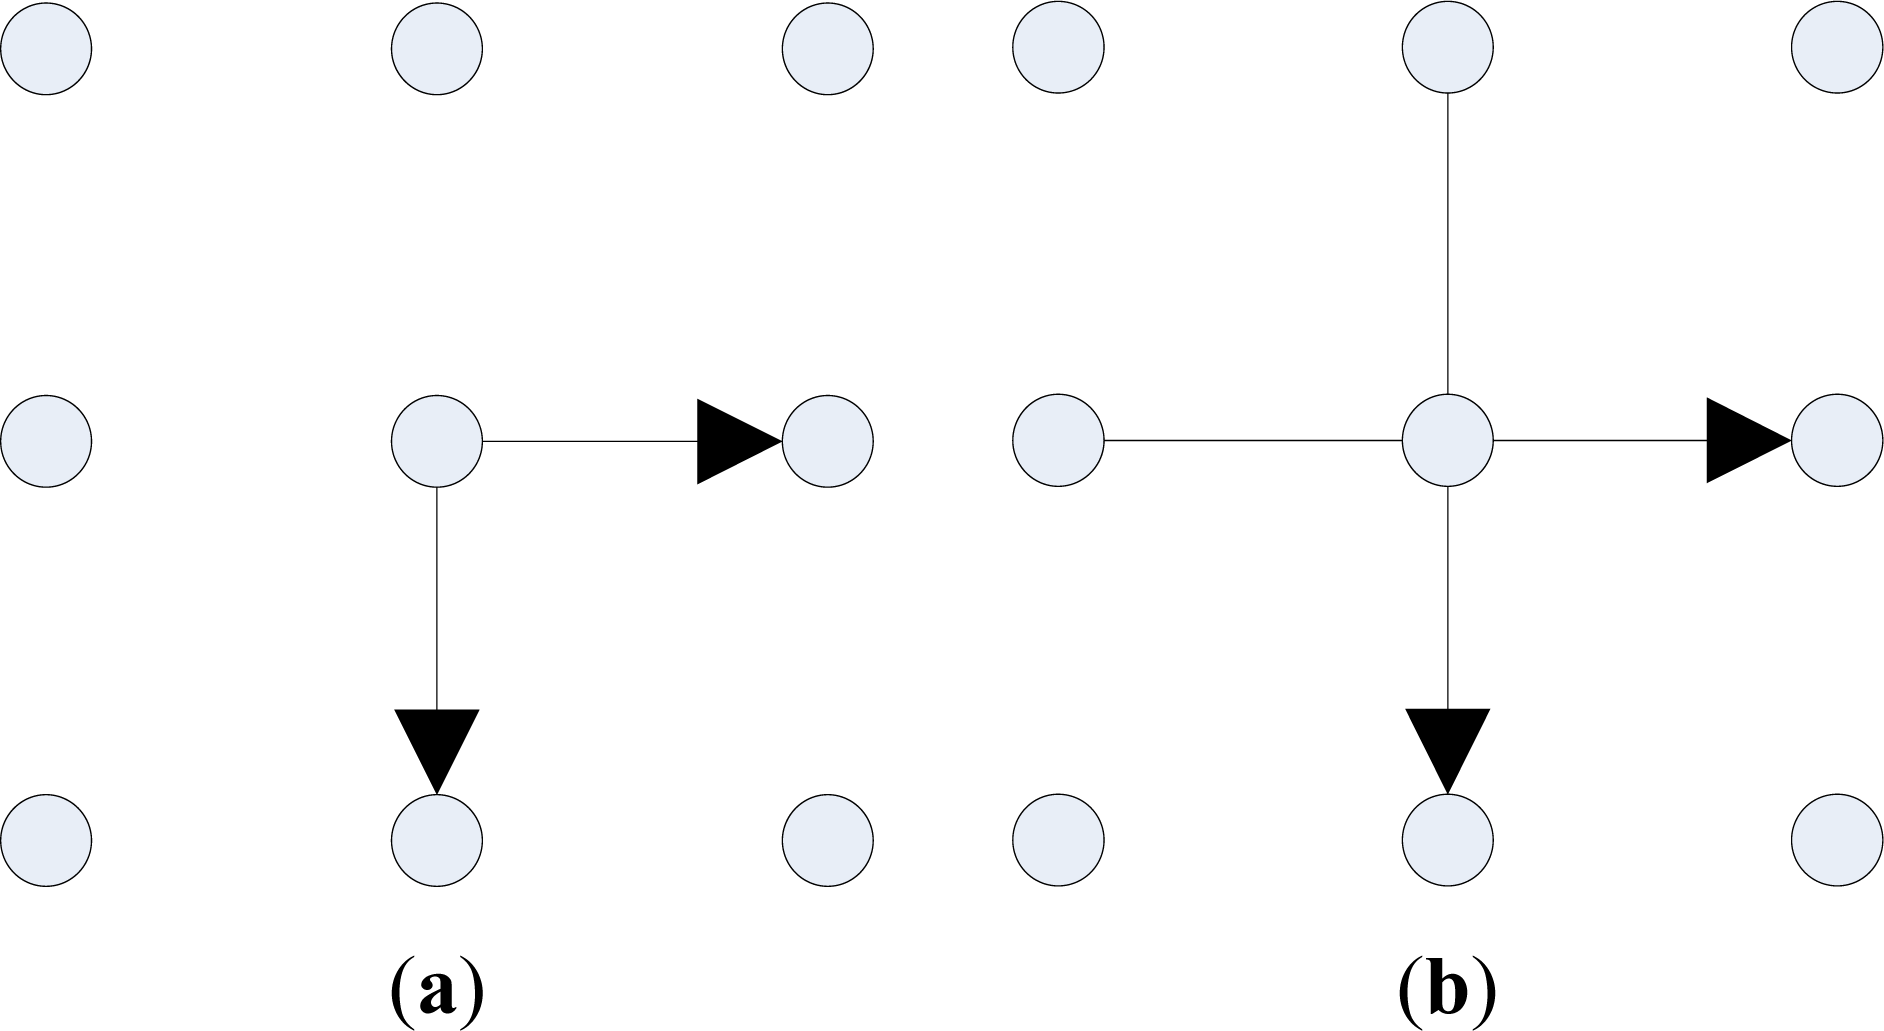
We have noticed that images which have superior lossless coding performance, would also have good lossy coding performance. Since lossless coding is always simpler than lossy coding, a descriptor that is capable of reflecting lossless coding performance has been considered in the first step. A simple and common lossless coding algorithm can be implemented by conducting differential operation to adjacent pixels and then perform Huffman coding to differential values. The Huffman coding performance is close to the entropy of the differential values. Hence, the differential information entropy can be used to describe the coding performance of the above lossless coding algorithm, which is defined as:
In the second step, the differential information entropy is tested to see whether it is capable of measuring the coding performance of lossy coding. The JPEG2000 algorithm is taken as an example and the PSNR is utilized as a measurement for image coding performance. The wavelet base is Db 9/7, and the transform level of wavelet is 3. A database for 8 bit high resolution grey remote sensing images of size 1,024 × 512 is built. There are three kinds of images, which are urban, plain and farmland, separately. Both simple and complex images are included. The similar characteristics of the images may be reflected in the imaging mode, such as remote sensing. In other words, the parameters by data fitting in the paper may be more suitable for remote sensing applications. The proposed quality prediction method can be applicable to other kinds of images with some other suitable parameters. Then these images are coded at different compression ratios (the compression ratios varying from 4/1 to 12/1), and the PSNR values are calculated for the coded images with each compression ratio. There are two tests: (1) the relationship between D_Entropy and PSNR. By removing some images of similar image compression characteristic, 23 images are selected from the database and used for data fitting. The sum of squares due to error(SSE) and R-square are used to evaluate the data fitting results. (2) The prediction method. The 23 images are used to find the relationship among PSNR, D_Entropy and compression ratio. This relationship is used as an indicator to predict the image coding quality. Six images are randomly selected from the rest images in the database for the verification of the prediction. In the first test, D_Entropy and lnIAMD1 for each image are calculated. The experimental results are shown in Table 1.
Assuming that D_Entropy is linear with PSNR for the sake of convenience, that is PSNR = a * D_Entropy + b. Then data fitting is used to find the parameters a and b. The constraint for fitting is to minimize the mean error of all samples. For comparison, the relationship between PSNR and lnIAMD1 is also studied, which is PSNR = αlnIAMD1+β.
The assessment parameters include SSE and R-square. The former is to compute the square error sum of original data and fitting data, the formula of which is:
R-square determines the fitting effect through the variation of data, the formula of which is:
Total sum of squares(SST) is the sum of the square of deviations from the original data (yi) and the average value(ȳi), the formula of which is:
R-square represents the square of the correlation between the real values and the predicted values. The more R-square is, the better fitting result will be. The experimental results are shown in Table 2 and Table 3.
From Table 2 and Table 3, it can be found that D_Entropy has smaller SSE and larger R-square than that in lnIAMD1 at various compression ratios. Hence, a conclusion can be made that D_Entropy has a better linear relationship with PSNR in the data fitting process.
4. The Relationship among PSNR, D_Entropy and Compression Ratio
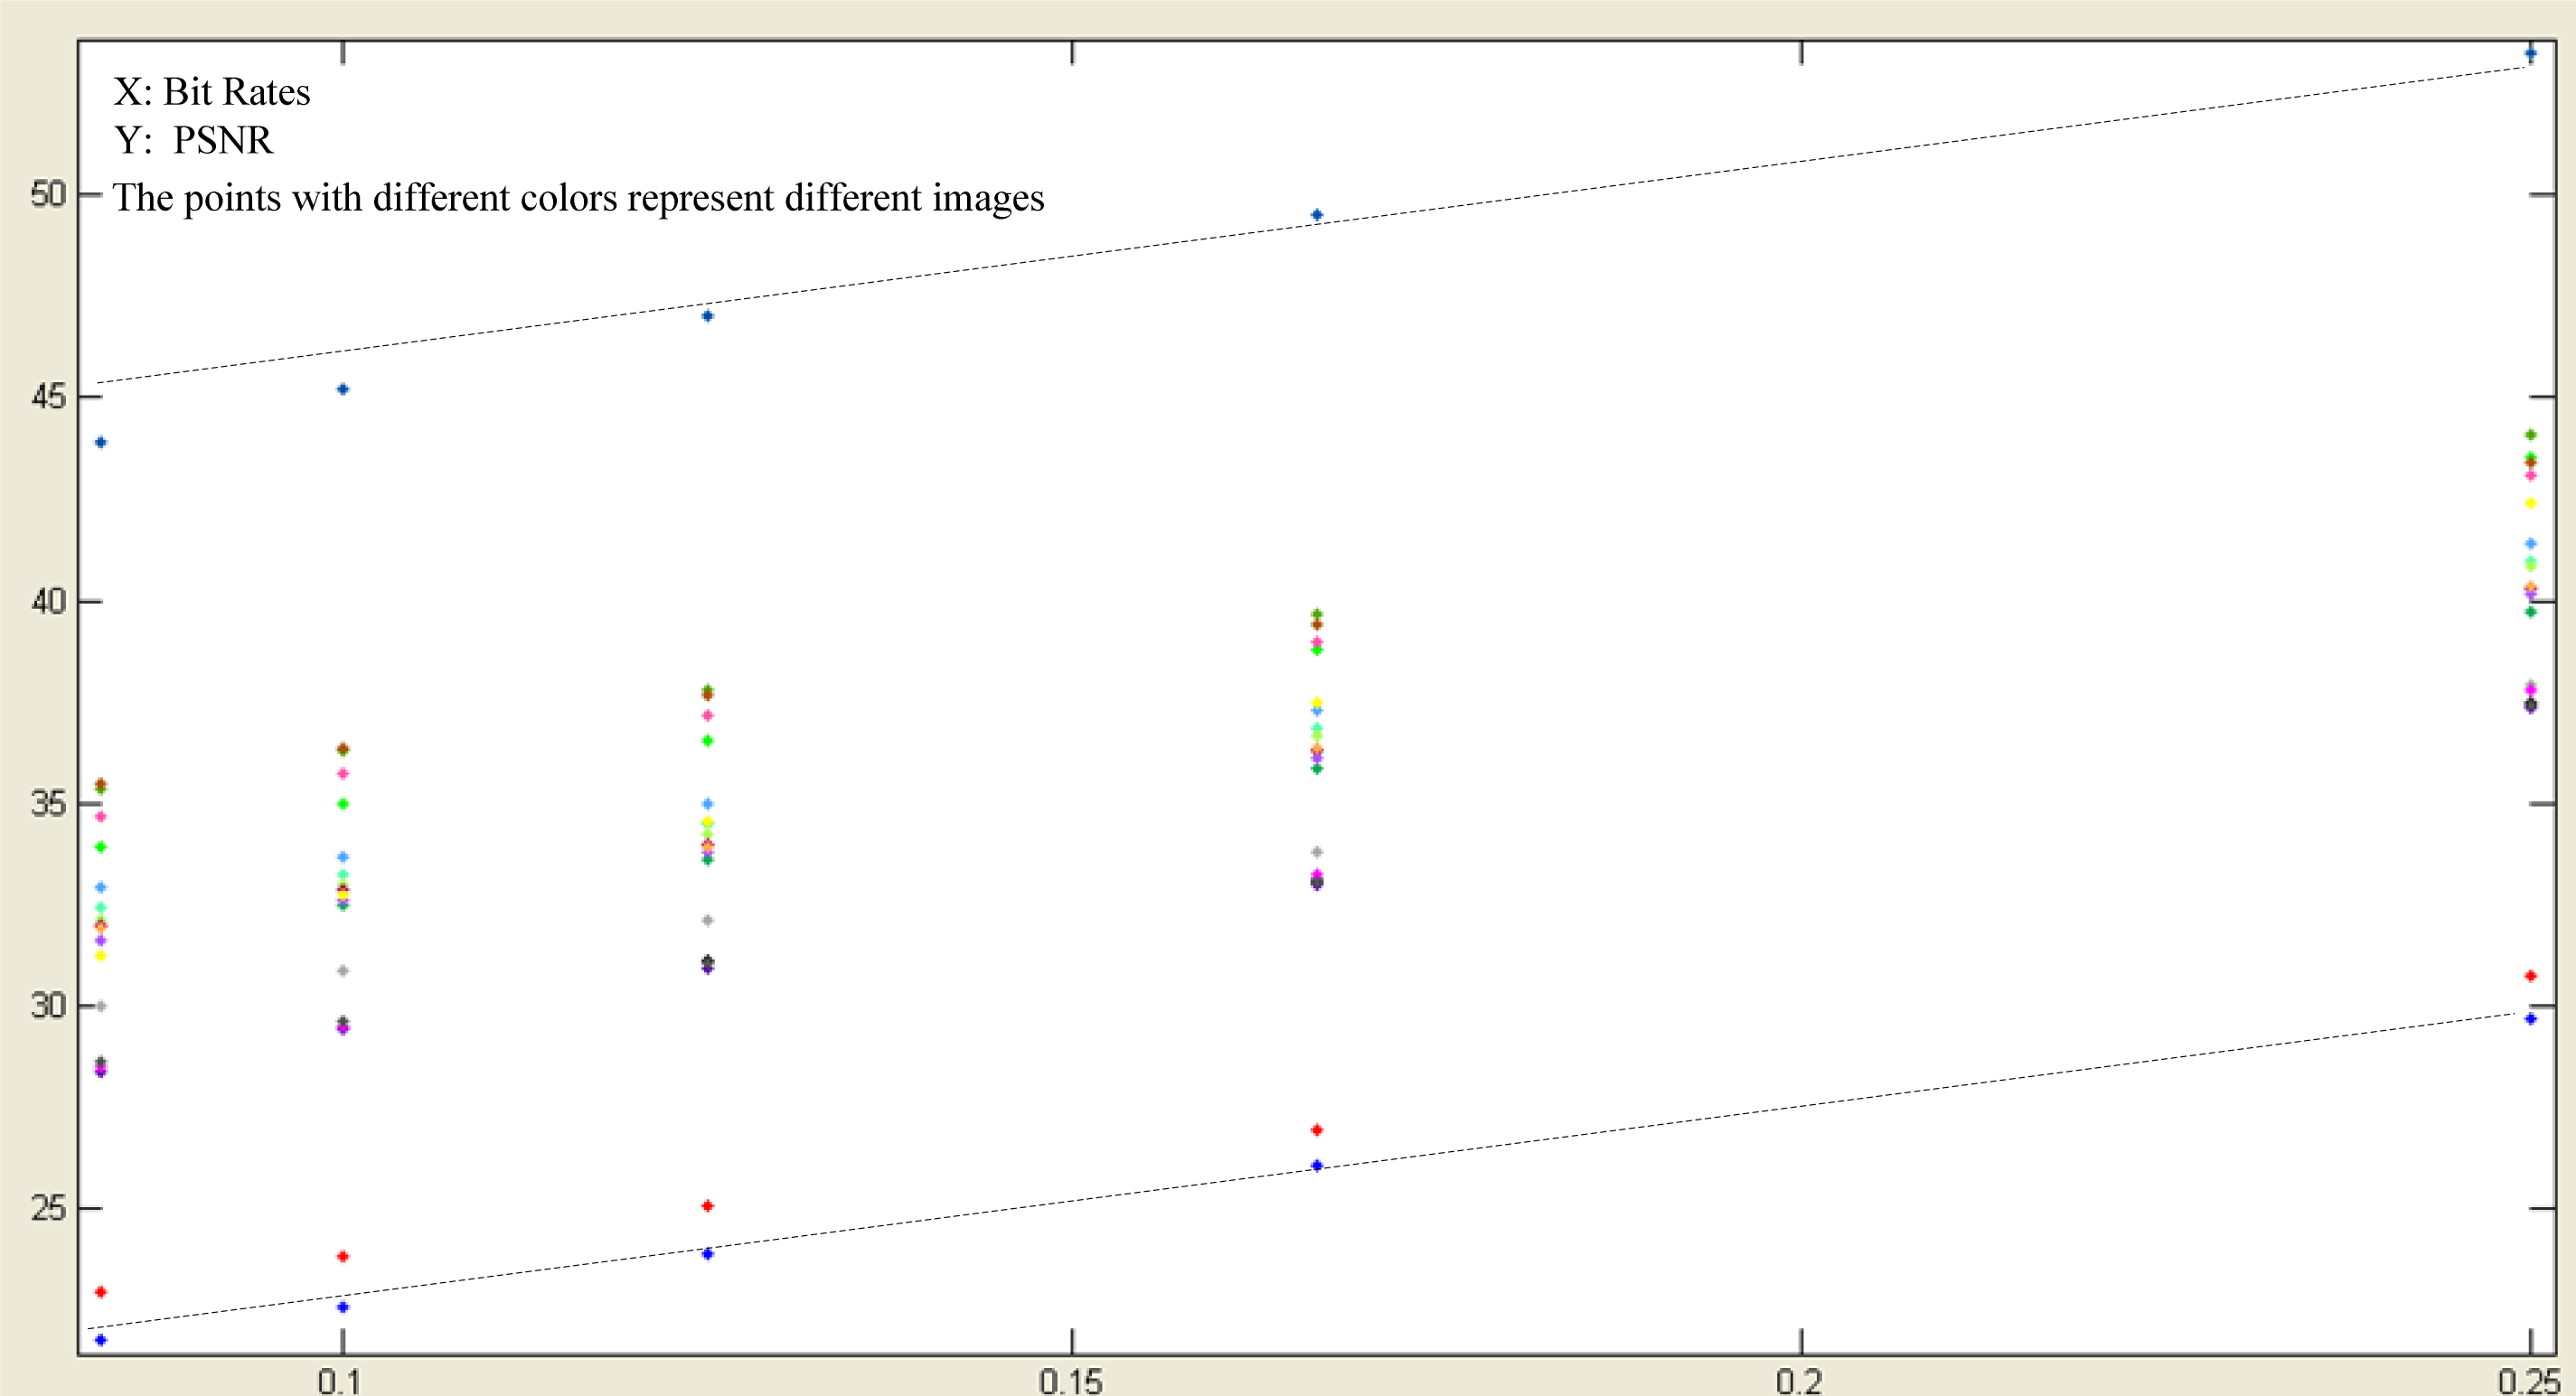
The linear relationship between PSNR and D_Entropy at fixed compression ratios has been verified in Section 3. In Section 4, the relationship among PSNR, D_Entropy and compression ratio will be discussed. We have noticed that for most images, coding of the high-frequency sub-bands will consume large amounts of bit rates. Therefore, at a low compression ratio, the loss in one image will happen in the high-frequency sub-bands. Since the loss of the high-frequency sub-bands contributes similarly to the distortion of one image, the relationship between the coding performance (measured by PSNR) and the bit rates (reciprocal of the compression ratios) can also be viewed as a linear relationship. It can be proved in our experiments, which is shown in Figure 3. Then, in the second test, the following relationship can be assumed: PSNR = a / CR+b*D_Entropy + c. Through data fitting of samples in Table 1, it can be obtained that a = 52.9466, b = −7.4096, c = 69.1329. The average mean square error is 1.87.
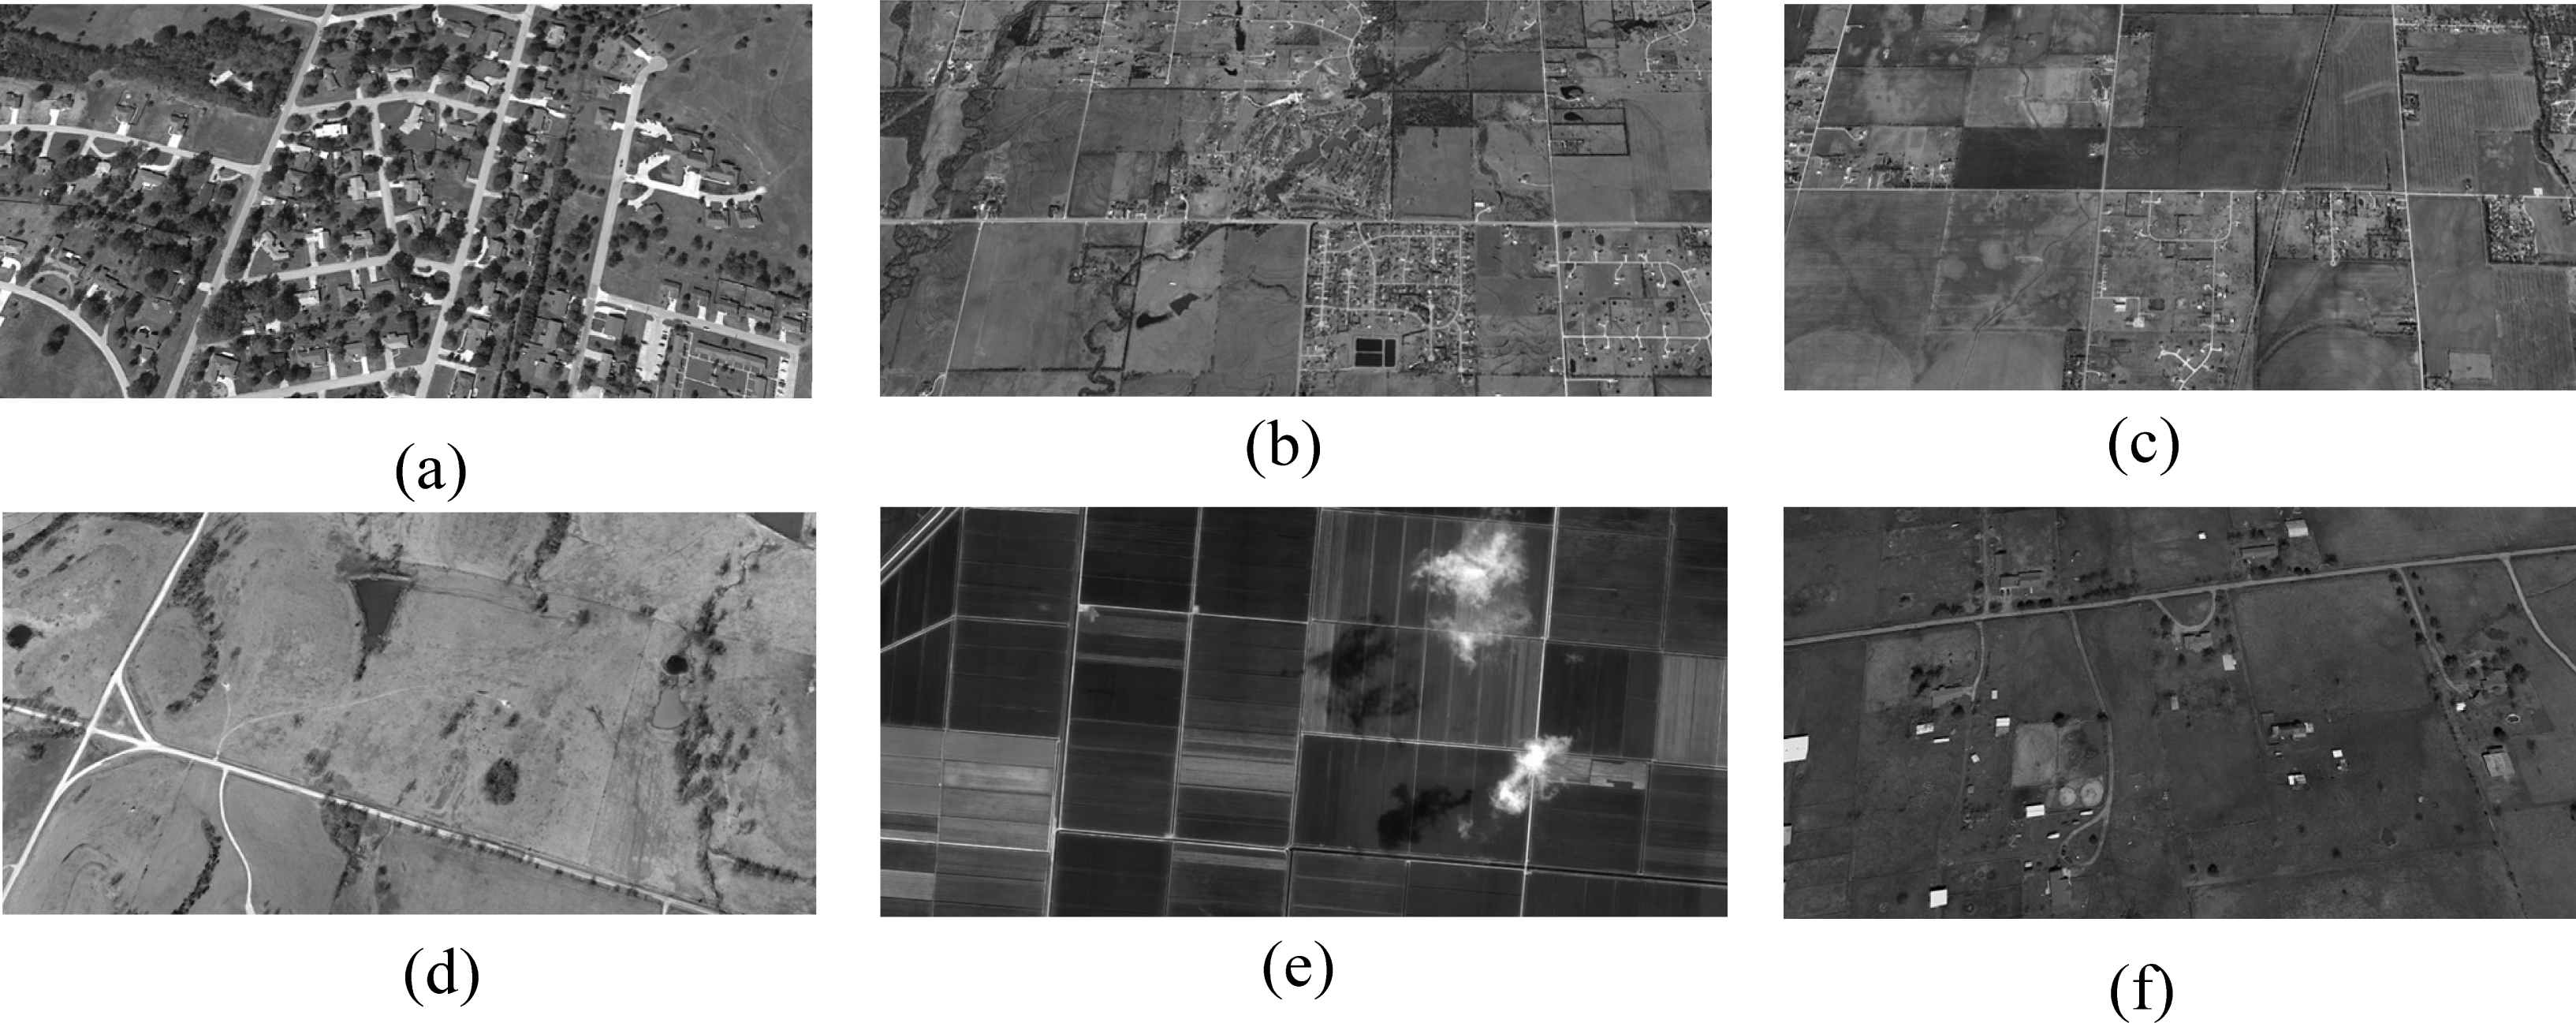
Then the above relationship can be seen as a method to predict the image coding quality. In order to validate the effectiveness of the proposed method, six 8 bit 1,024 × 512 grey remote sensing images are tested. The images and the experimental results are shown in Figure 4 and Table 4, separately.
From the experimental results, it can be found that for different images, the prediction error of the proposed method is smaller than that in Li [9] and not exceed 2 dB. Meanwhile, the proposed method is simple. Therefore, it can be widely applied in a variety of space real-time image coding systems.
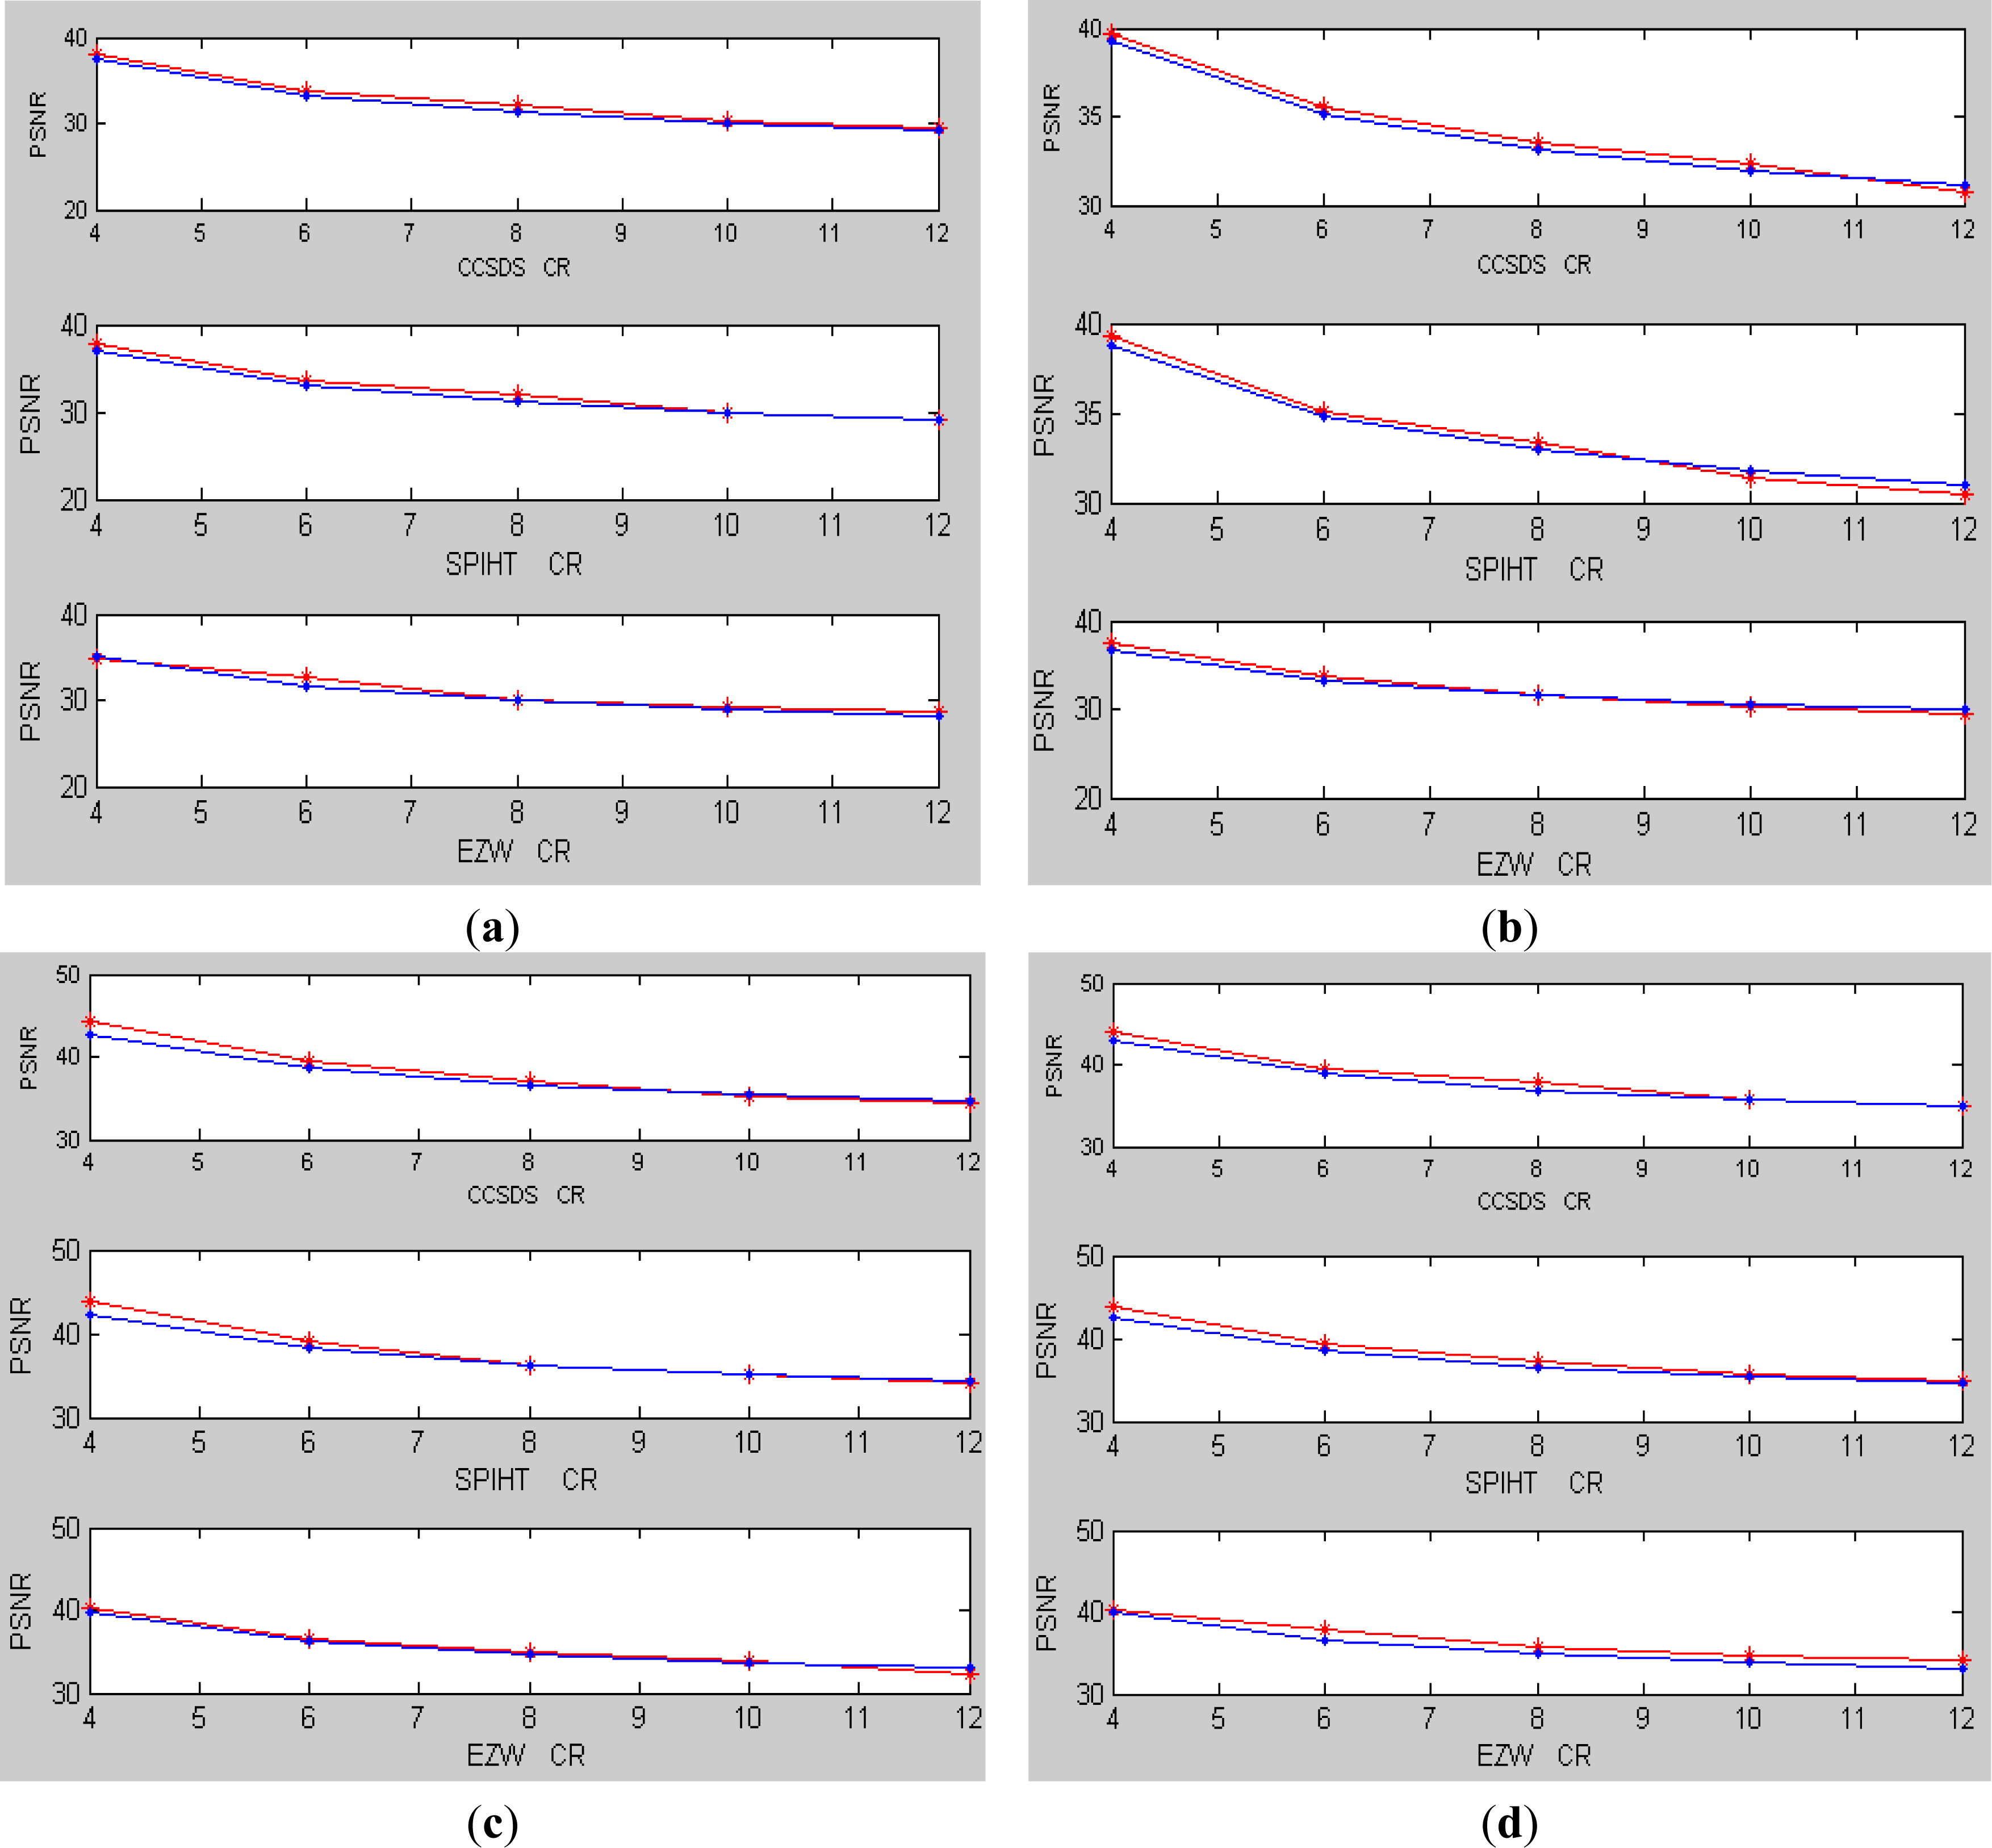
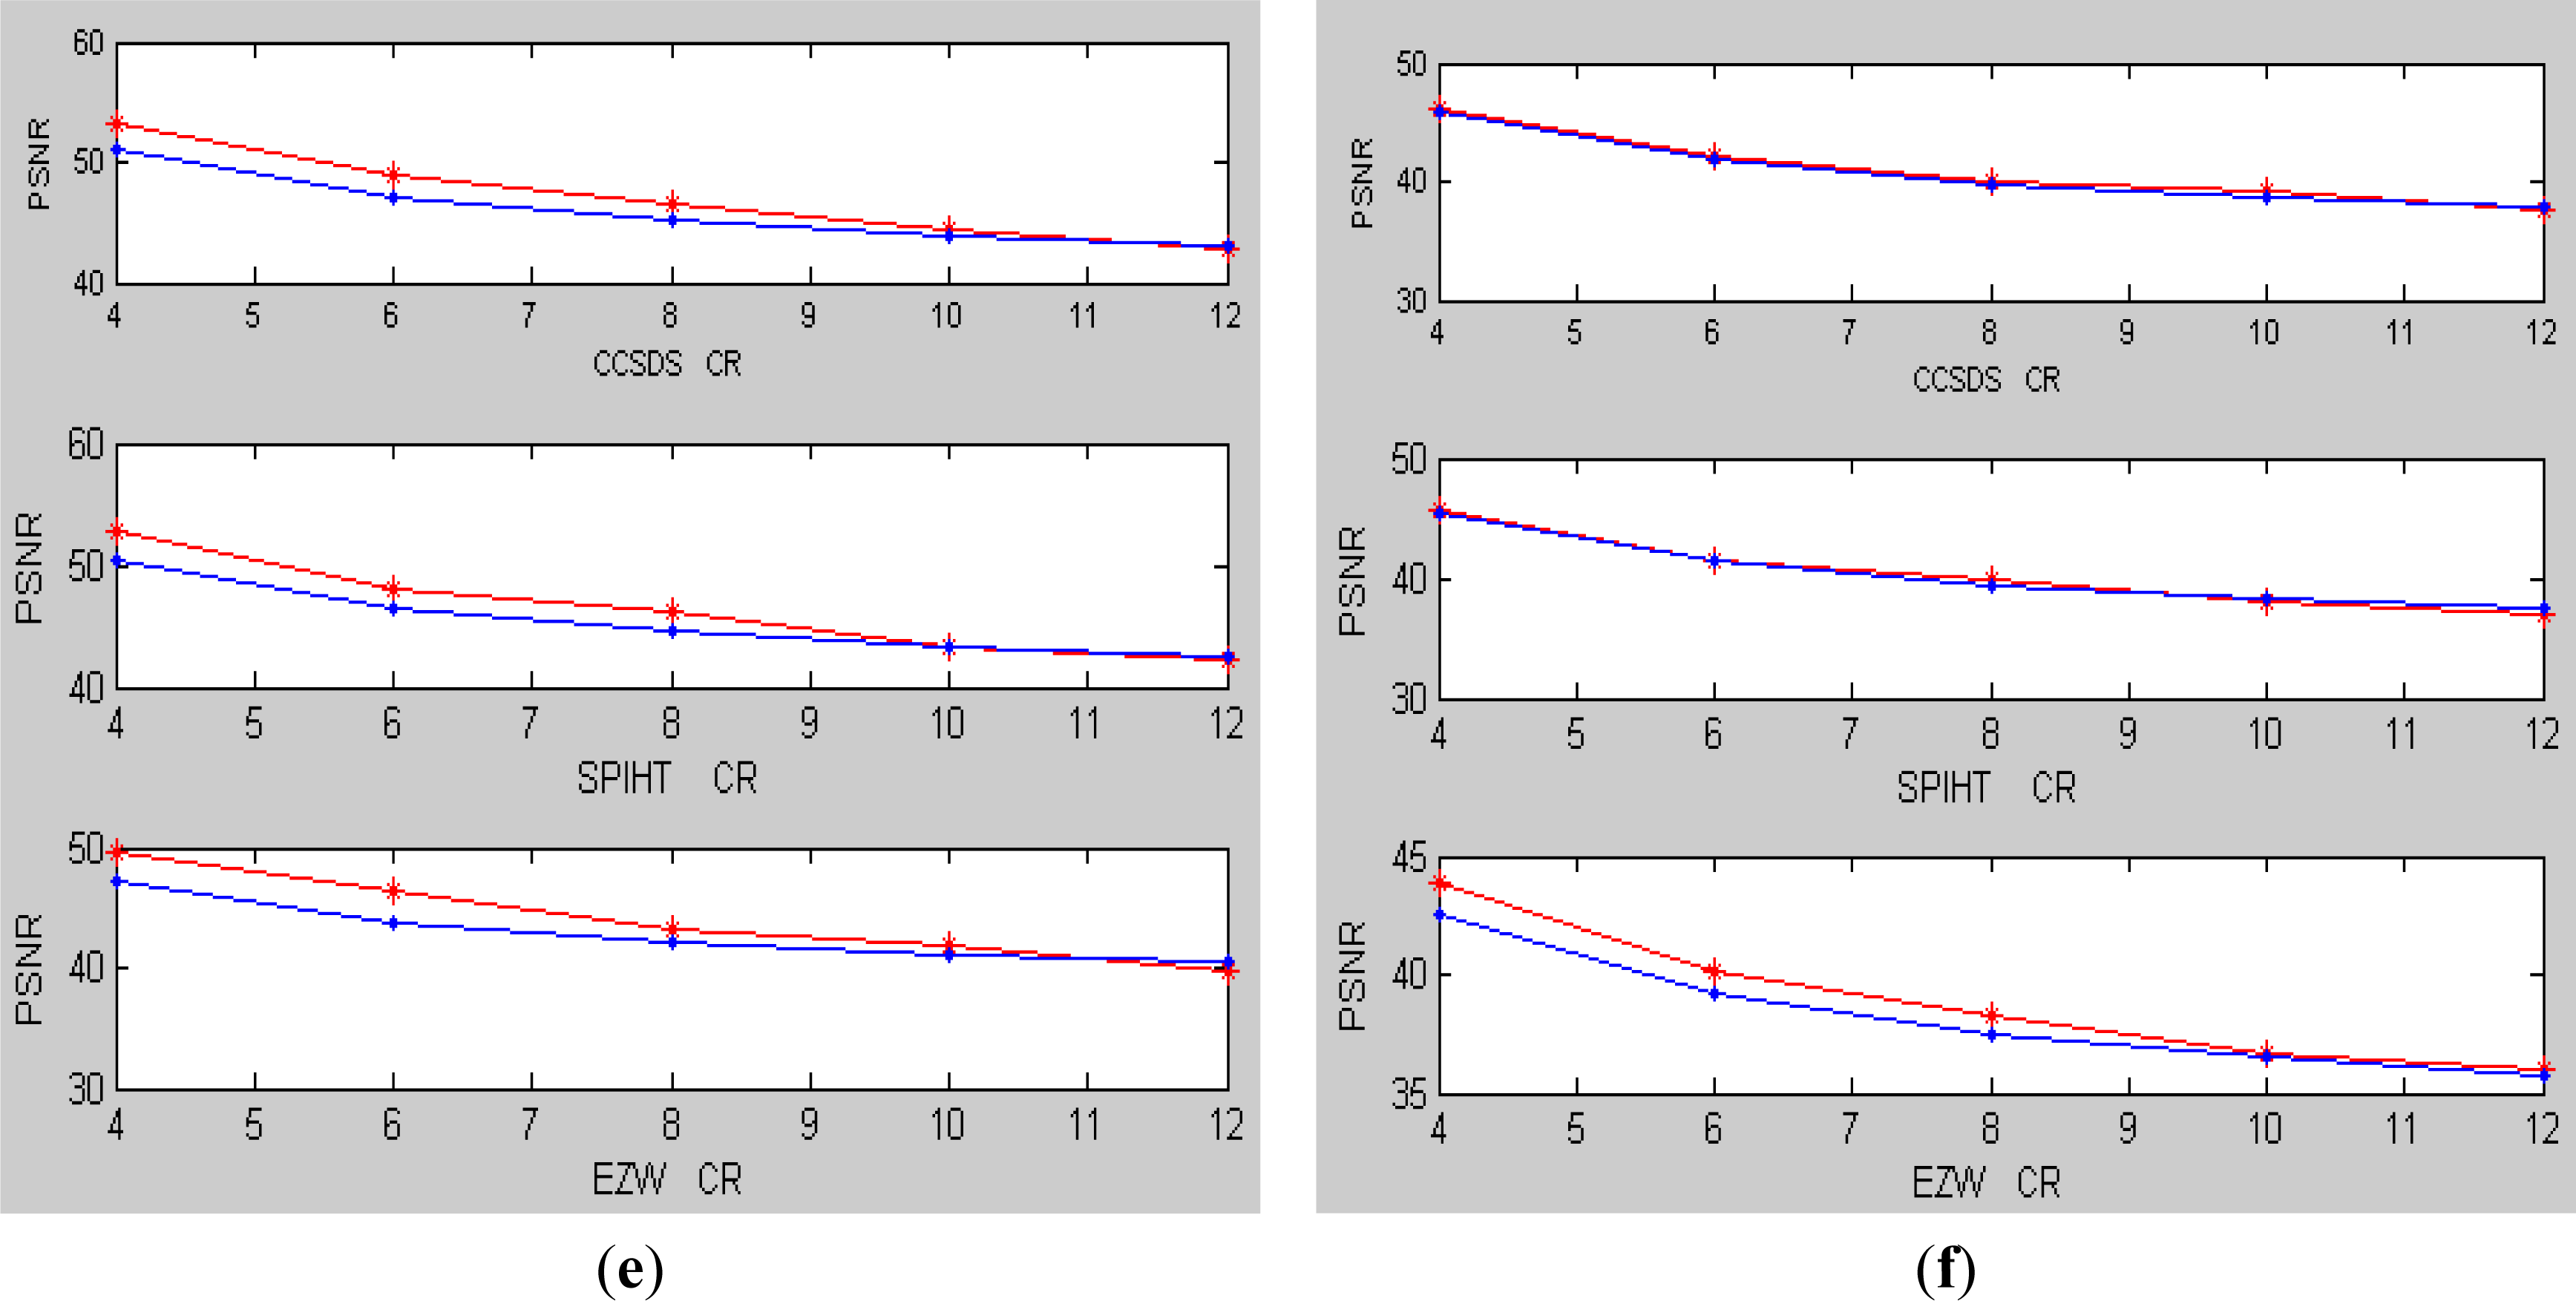
Finally, other coding algorithms (such as CCSDS [10], SPIHT [11] and EZW [12]) are implemented and tested. The following relationship is also assumed: PSNR = a / CR+b*D_Entropy+c. By data fitting of samples in Table 1, the results are shown in Table 5 and Table 8. Then the coding quality of the images in Figure 4 can be predicted and the prediction results are shown in Figure 5. The actual results and the predicted results for the coding quality of images in Figure 4 are represented by red line and blue line, separately. From the experimental results in Figure 5, it showed that the maximum prediction error is less than 2.5 dB and the average error is 1.12 dB. Therefore, a conclusion can be made that the proposed method is also efficient for some other coding algorithms.
5. Conclusions
In this study, the differential information entropy is used to describe the image coding performance. The relationship among differential information entropy, compression ratio and PSNR at various compression ratios is studied. Then a prediction method based on the relationship has been proposed to predict the image coding quality. From the experimental results, it demonstrated that the differential information entropy has a good linear relationship with PSNR. A conclusion can be made that the image coding performance can be predicted with small errors by the differential information entropy, which can be widely applied in a variety of space real-time image coding systems due to its low complexity. With the increase of the compression ratio, it is noteworthy that the relationship among differential information entropy, compression ratio and PSNR may be not a simple linear one. Therefore, the prediction error will be increased. How to reduce the prediction error in high compression ratios is a question we need to solve in the future.
Acknowledgments
This work was supported by the Nature Science Foundation of China, under Grants 61102064 , Hubei Natural Science Foundation of China, under Grants 2013CFB298, and the Chen-Guang Project of Wuhan City, under Grants 2013072304010826.
Conflicts of Interest
The authors declare no conflict of interest.
References
- Li, B.; Yang, R.; Jiang, H. Remote-sensing image compression using two-dimensional oriented wavelet transform. IEEE Trans. Geosci. Rem. Sens 2011, 49, 236–250. [Google Scholar]
- Garcia-Vilchez, F.; Serra-Sagrista, J. Extending the ccsds recommendation for image data compression for remote sensing scenarios. IEEE Trans. Geosci. Rem. Sens 2009, 47, 3431–3445. [Google Scholar]
- Ma, J.; Plonka, G.; Chauris, H. A new sparse representation of seismic data using adaptive easy-path wavelet transform. IEEE Trans. Geosci. Rem. Sens. Lett 2010, 7, 540–544. [Google Scholar]
- Liu, Z.; Karam, L.J.; Watson, A.B. JPEG2000 encoding with perceptual distortion control. IEEE Trans. Image Process 2006, 15, 1763–1778. [Google Scholar]
- An, J.C.; Cai, Z.X. Efficient rate control for lossless mode of JPEG2000. IEEE Signal Process. Lett 2008, 15, 409–412. [Google Scholar]
- Singh, S.; Sharma, R.K.; Sharma, S.K. Efficient rate control approach for JPEG2000 image coding. J. Electron. Imaging 2012, 21, 033004. [Google Scholar]
- Saha, S.; Vemuri, R. An analysis on the effect of image features on lossy coding performance. IEEE Signal Process. Lett 2000, 7, 104–107. [Google Scholar]
- Saha, S.; Vemuri, R. How do image statistics impact lossy coding performance? Proceedings of International Conference on Information Technology: Coding and Computing, Las Vegas, NV, USA, 2000, 42–47. [Google Scholar]
- Li, L.; Wang, Z.S. Compression Quality Prediction Model for JPEG2000. IEEE Trans. Image Process 2010, 19, 384–398. [Google Scholar]
- Image Data Compression: Report Concerning Space Data System Standards; Informational Report CCSDS 120.1-G-1; CCSDS: Washington, DC, USA; June; 2007.
- Said, A.; Pearlman, W.A. A new fast and efficient image codec based on set partitioning in hierarchical trees. IEEE Trans. Circuits Systems Video Technol 1996, 6, 243–250. [Google Scholar]
- Shapiro, J.M. Embedded image coding using zerotrees of wavelet coefficients. IEEE Trans. Signal Process 1993, 41, 3445–3462. [Google Scholar]


| Images | lnIAMD1 | D_Entropy | PSNR in different compression ratios | ||||
|---|---|---|---|---|---|---|---|
| 4 | 6 | 8 | 10 | 12 | |||
| 1 | 3.37 | 6.40 | 37.36 | 32.97 | 30.92 | 29.43 | 28.38 |
| 2 | 2.46 | 4.92 | 44.10 | 39.68 | 37.80 | 36.31 | 35.37 |
| 3 | 3.28 | 6.25 | 37.49 | 33.15 | 31.11 | 29.60 | 28.53 |
| 4 | 2.84 | 5.52 | 40.98 | 36.88 | 34.50 | 33.22 | 32.45 |
| 5 | 2.06 | 4.27 | 53.53 | 49.51 | 47.01 | 45.19 | 43.93 |
| 6 | 2.87 | 5.58 | 40.87 | 36.68 | 34.26 | 32.98 | 32.12 |
| 7 | 2.72 | 5.26 | 41.41 | 37.27 | 34.99 | 33.66 | 32.92 |
| 8 | 2.72 | 5.36 | 43.53 | 38.79 | 36.53 | 34.99 | 33.92 |
| 9 | 2.56 | 5.25 | 43.11 | 38.97 | 37.15 | 35.73 | 34.66 |
| 10 | 2.88 | 5.64 | 40.31 | 36.3 | 34.01 | 32.85 | 32.01 |
| 11 | 2.90 | 5.67 | 39.75 | 35.85 | 33.62 | 32.50 | 31.61 |
| 12 | 2.94 | 5.59 | 40.14 | 36.13 | 33.81 | 32.64 | 31.61 |
| 13 | 3.06 | 5.77 | 37.90 | 33.81 | 32.11 | 30.87 | 30.01 |
| 14 | 2.92 | 5.59 | 40.37 | 36.38 | 33.96 | 32.73 | 31.91 |
| 15 | 3.05 | 5.46 | 42.41 | 37.49 | 34.54 | 32.74 | 31.27 |
| 16 | 3.28 | 6.03 | 37.77 | 33.23 | 31.04 | 29.48 | 28.48 |
| 17 | 3.22 | 6.00 | 37.43 | 33.07 | 31.05 | 29.61 | 28.61 |
| 18 | 2.47 | 5.03 | 43.43 | 39.4 | 37.67 | 36.34 | 35.49 |
| 19 | 3.93 | 6.95 | 29.70 | 26.07 | 23.91 | 22.60 | 21.75 |
| 20 | 3.80 | 6.85 | 30.77 | 26.96 | 25.10 | 23.84 | 22.95 |
| 21 | 2.12 | 4.56 | 51.12 | 49.67 | 46.94 | 42.66 | 41.22 |
| 22 | 2.10 | 3.73 | 53.79 | 49.68 | 46.95 | 45.01 | 43.58 |
| 23 | 2.00 | 3.78 | 54.17 | 50.25 | 47.82 | 45.92 | 44.58 |
| Compression Ratio | a | b | SSE | R-square |
|---|---|---|---|---|
| 4 | −7.564 | 83.07 | 40.78 | 0.9549 |
| 6 | −7.711 | 79.81 | 58.05 | 0.9392 |
| 8 | −7.535 | 76.62 | 52.02 | 0.9428 |
| 10 | −7.195 | 73.2 | 30.43 | 0.9625 |
| 12 | −7.043 | 71.35 | 27.69 | 0.9643 |
| Compression Ratio | α | β | SSE | R-square |
|---|---|---|---|---|
| 4 | −12.03 | 76.08 | 64.32 | 0.9289 |
| 6 | −12.35 | 72.93 | 70.57 | 0.9261 |
| 8 | −12.12 | 70.05 | 56.59 | 0.9377 |
| 10 | −11.54 | 66.84 | 38.73 | 0.9523 |
| 12 | −11.33 | 65.22 | 31.07 | 0.9600 |
| Test Images | lnIAMD1 | D_Entropy | Method | PSNR in different compression ratios | ||||
|---|---|---|---|---|---|---|---|---|
| 4 | 6 | 8 | 10 | 12 | ||||
| (a) | 3.0528 | 5.8051 | Actual | 39.56 | 35.41 | 33.18 | 31.72 | 30.64 |
| Proposed | 39.36 | 34.94 | 32.74 | 31.41 | 30.53 | |||
| Reference [9] | - | - | - | 32.54 | 31.32 | |||
| (b) | 2.9003 | 5.5442 | Actual | 41.99 | 37.37 | 34.72 | 33.37 | 32.17 |
| Proposed | 41.29 | 36.88 | 34.67 | 33.35 | 32.46 | |||
| Reference [9] | - | - | - | 34.01 | 32.84 | |||
| (c) | 2.6017 | 5.0605 | Actual | 45.65 | 41.24 | 38.66 | 36.95 | 35.56 |
| Proposed | 44.87 | 40.46 | 38.25 | 36.93 | 36.05 | |||
| Reference [9] | - | - | - | 36.90 | 35.80 | |||
| (d) | 2.4683 | 5.0203 | Actual | 45.02 | 40.93 | 38.72 | 37.19 | 36.11 |
| Proposed | 45.17 | 40.76 | 38.55 | 37.23 | 36.35 | |||
| Reference [9] | - | - | - | 38.19 | 37.12 | |||
| (e) | 1.9082 | 3.8752 | Actual | 54.88 | 50.86 | 48.53 | 46.59 | 45.21 |
| Proposed | 53.66 | 49.24 | 47.04 | 45.71 | 44.83 | |||
| Reference [9] | - | - | - | 43.61 | 42.68 | |||
| (f) | 2.1900 | 4.6100 | Actual | 47.72 | 43.53 | 41.15 | 39.71 | 38.64 |
| Proposed | 48.21 | 43.80 | 41.59 | 40.27 | 39.39 | |||
| Reference [9] | - | - | - | 40.88 | 39.88 | |||
| Compression Ratio | b | c | SSE | R-square |
|---|---|---|---|---|
| 4 | −7.896 | 82.81 | 37.59 | 0.9616 |
| 6 | −7.279 | 75.68 | 31.84 | 0.9617 |
| 8 | −7.168 | 73.02 | 19.81 | 0.9751 |
| 10 | −6.713 | 69.2 | 23.52 | 0.9666 |
| 12 | −6.557 | 67.46 | 22.9 | 0.9660 |
| Compression Ratio | b | c | SSE | R-square |
|---|---|---|---|---|
| 4 | −7.931 | 82.5 | 33.67 | 0.9658 |
| 6 | −7.232 | 75.16 | 34.49 | 0.9582 |
| 8 | −6.879 | 71.15 | 19.3 | 0.9737 |
| 10 | −6.585 | 68.22 | 23.8 | 0.9650 |
| 12 | −6.392 | 66.28 | 19.53 | 0.9693 |
| Compression Ratio | b | c | SSE | R-square |
|---|---|---|---|---|
| 4 | −6.902 | 74.77 | 21.71 | 0.9707 |
| 6 | −6.662 | 70.06 | 17.93 | 0.9737 |
| 8 | −6.497 | 67.79 | 23.98 | 0.9638 |
| 10 | −5.884 | 63.01 | 19.65 | 0.9633 |
| 12 | −5.817 | 61.95 | 22.85 | 0.9572 |
| Algorithm | a | b | c | Average Mean Square error |
|---|---|---|---|---|
| CCSDS | 48.1600 | −7.1272 | 66.6798 | 1.3376 |
| SPIHT | 46.8595 | −7.0083 | 65.8933 | 1.3538 |
| EZW | 40.7013 | −6.3407 | 61.6425 | 1.0696 |
© 2014 by the authors; licensee MDPI, Basel, Switzerland This article is an open access article distributed under the terms and conditions of the Creative Commons Attribution license (http://creativecommons.org/licenses/by/3.0/).
Share and Cite
Tian, X.; Li, T.; Tian, J.-W.; Li, S. Prediction Method for Image Coding Quality Based on Differential Information Entropy. Entropy 2014, 16, 990-1001. https://0-doi-org.brum.beds.ac.uk/10.3390/e16020990
Tian X, Li T, Tian J-W, Li S. Prediction Method for Image Coding Quality Based on Differential Information Entropy. Entropy. 2014; 16(2):990-1001. https://0-doi-org.brum.beds.ac.uk/10.3390/e16020990
Chicago/Turabian StyleTian, Xin, Tao Li, Jin-Wen Tian, and Song Li. 2014. "Prediction Method for Image Coding Quality Based on Differential Information Entropy" Entropy 16, no. 2: 990-1001. https://0-doi-org.brum.beds.ac.uk/10.3390/e16020990