Article

Assessment of Time and Frequency Domain Entropies to Detect Sleep Apnoea in Heart Rate Variability Recordings from Men and Women

by
Gonzalo C. Gutiérrez-Tobal
1,*,
Daniel Álvarez
1,
Javier Gomez-Pilar
1,
Félix Del Campo
2,3 and
Roberto Hornero
1
1
Biomedical Engineering Group, Universidad de Valladolid, Paseo Belén 15, 47011 Valladolid, Spain
2
Facultad de Medicina, Universidad de Valladolid, Avenida Ramón y Cajal 7, 47007 Valladolid, Spain
3
Hospital Universitario Río Hortega, Calle Dulzaina 2, 47012 Valladolid, Spain
*
Author to whom correspondence should be addressed.
Submission received: 30 October 2014 / Accepted: 31 December 2014 / Published: 6 January 2015
(This article belongs to the Special Issue Entropy and Cardiac Physics)

Abstract

:
Heart rate variability (HRV) provides useful information about heart dynamics both under healthy and pathological conditions. Entropy measures have shown their utility to characterize these dynamics. In this paper, we assess the ability of spectral entropy (SE) and multiscale entropy (MsE) to characterize the sleep apnoea-hypopnea syndrome (SAHS) in HRV recordings from 188 subjects. Additionally, we evaluate eventual differences in these analyses depending on the gender. We found that the SE computed from the very low frequency band and the low frequency band showed ability to characterize SAHS regardless the gender; and that MsE features may be able to distinguish gender specificities. SE and MsE showed complementarity to detect SAHS, since several features from both analyses were automatically selected by the forward-selection backward-elimination algorithm. Finally, SAHS was modelled through logistic regression (LR) by using optimum sets of selected features. Modelling SAHS by genders reached significant higher performance than doing it in a jointly way. The highest diagnostic ability was reached by modelling SAHS in women. The LR classifier achieved 85.2% accuracy (Acc) and 0.951 area under the ROC curve (AROC). LR for men reached 77.6% Acc and 0.895 AROC, whereas LR for the whole set reached 72.3% Acc and 0.885 AROC. Our results show the usefulness of the SE and MsE analyses of HRV to detect SAHS, as well as suggest that, when using HRV, SAHS may be more accurately modelled if data are separated by gender.

Graphical Abstract

1. Introduction

The sleep apnoea-hypopnoea syndrome (SAHS) is a highly prevalent disease which negatively impacts both the health and quality of life of affected people [1]. SAHS is mainly characterized by the recurrence of both total breathing cessation (apnoea events) and significant airflow reduction (hypopnoea events) during sleep time [2]. Apnoeas and hypopnoeas cause oxygen desaturations and sleep fragmentation [2], preventing patients from resting while sleeping, and leading to daytime symptoms such as morning headaches, excessive sleepiness, memory loss, or decreased concentration [3]. Apnoeic events are also related to challenging processes for different main body systems. In this regard, hypoxemia, hypercapnia, inspiratory overexertion, or arousals may vary the normal response of systems such as neural, cardiovascular, and metabolic [1]. Thus, SAHS has been associated with major pathological conditions such as hypertension, stroke, coronary artery disease, congestive heart failure, atrial fibrillation, or diabetes [13].
Simplifying SAHS diagnosis has become a major concern for experts in recent years. The standard diagnostic test is overnight polysomnography (PSG), which is technically complex and expensive [4], since it involves monitoring and recording multiple physiological signals such as electroencephalogram (EEG), electrocardiogram (ECG), electromyogram, oxygen saturation (SpO2), and airflow [5]. PSG is also time-consuming since the physicians need an offline inspection of these recordings to diagnose SAHS. Additionally, it is well-known that SAHS is an underdiagnosed disease. As a result, there exists an increasing demand of PSG tests [6], which exceed the clinical resources in many of the Western countries [7]. The limitations of overnight PSG have led to a search for diagnostic alternatives for SAHS. In this regard, one common approach has been the analysis of reduced sets of signals chosen among those involved on PSG [6].
Heart rate variability (HRV), which is derived from ECG, has been widely investigated to assess multiple conditions related to the heart and the autonomic nervous system (ANS) [8]. This connection between the heart function and the ANS, extensively reported in the literature, provides a unique framework when studying SAHS which is not present in the case of other signals involved in PSG. In this regard, the ANS response to the apnoeic events has been associated with a recurrent progressive-bradycardia/abrupt-tachycardia pattern observed in HRV [9,10]. Therefore, HRV has been usually studied through different approaches to gain insight into SAHS and help in its diagnosis [914]. The recurrence of bradycardia-tachycardia patterns justifies the use of frequency analyses and the definition of spectral bands of interest. Thus, the power in the very low frequency band (VLF, 0–0.04 Hz.), in the low frequency band (LF, 0.04–0.15 Hz.), and in the high frequency band (HF, 0.15–0.4 Hz.) has been successfully assessed in studies involving SAHS [11,12]. On the other hand, some works have reported chaotic heart beat behaviours [15,16], which suggest applying of nonlinear analyses to HRV.
Entropy measures, as a common choice to quantify nonlinear dynamics in biomedical signals, have shown to be useful in the study of different pathologies and physiological conditions like Alzheimer’s disease (AD) [17], diabetes [18], atrial fibrillation [19], or SAHS [20,21]. Particularly, the multiscale entropy (MsE) analysis has been widely applied to biomedical signals in order to quantify their irregularity (or complexity) over time scales. Thus, MsE has shown its usefulness to study heart rate dynamics [22], to find differences in the HRV from healthy subjects and subjects suffering from congestive heart failure and atrial fibrillation [23], to show different behaviours in the heart rate of young and elder [23], to quantify the complexity of human gait [24], to improve the knowledge of the EEG behaviour in AD patients [25], as well as to evaluate the effects of drugs in the EEG of schizophrenia patients [26]. Moreover, spectral entropy (SE) has been helpful to quantify the depth of anaesthesia in EEG recordings from women undergoing gynaecological surgery [27], to detect endpoints in speech signals recorded in noisy environments [28], to show the changes that AD causes in the spectrum of magnetoencephalographic and EEG recordings [17,29], as well as to enhance the automatic detection of SAHS from single-channel SpO2 recordings obtained during nocturnal oximetry [30].
We hypothesize that both SE and MsE can be useful to gain insight into the effects that SAHS causes in HRV and, consequently, to help in its detection. Thus, the main objective of this paper is the assessment of these analyses in the context of SAHS. As mentioned above, HRV has been commonly used to help in SAHS diagnosis, both in frequency and time domain. However, no studies have been found showing the behaviour of HRV in SAHS patients (SAHS-positive) and no-SAHS subjects (SAHS-negative) through SE and MsE, or combining them to automatically detect SAHS. Furthermore, HRV is well-known to be affected by gender [8]. In this regard, HRV has shown significantly lower amplitude in healthy women of all ages, along with lower standard deviation [31]. These findings justify take eventual gender specificities into account when analysing HRV. Therefore, we firstly propose to analyse SE and MsE in HRV recordings from SAHS-positive and SAHS-negative considering these potential differences, i.e., considering the whole set of recordings as well as dividing it into women and men. Then, the use of the automatic forward-selection backward-elimination algorithm (FSBE) is proposed to obtain optimum sets of features from the three sets. This analysis highlights relevant features as well as allows evaluating the complementarity of SE and MsE when modelling SAHS [32]. Finally, we assess the diagnostic ability of logistic regression models built with these features and we compare the results reached for women, men, and the whole set of recordings.

2. Methodology

2.1. Subjects and Signals under Study

The study involved 188 subjects (134 men and 54 women) sent to the sleep unit of the Hospital Universitario Rio Hortega (Valladolid, Spain) due to suspicion of SAHS. All subjects underwent overnight PSG. No subjects with reported cardiac illnesses were included in the study. Apnoeas and hypopnoeas were scored by a single expert, who followed the rules of the American Academy of Sleep Medicine (AASM) [33]. An apnoea-hypopnoea index (AHI) of 10 events per hour (e/h) was established as the threshold for a positive diagnosis. Accordingly, 93 men and 26 women were considered as SAHS-positive. The Ethics Committee of the Hospital Universitario Rio Hortega (Spain) accepted the protocol and all the subjects gave their informed consent. Table 1 shows demographical and clinical data from the subjects (mean ± standard deviation). No statistically significant differences were found in body mass index (BMI) and age between SAHS-positive and SAHS-negative groups in men and women (Mann-Whitney U test, p-value > 0.01), nor were found in AHI, BMI, and age between men and women in SAHS-positive and SAHS-negative groups (p-value > 0.01).
PSG was carried out with a polysomnograph (Alice 5, Respironics, Philips Healthcare, The Netherlands). The HRV signals were obtained from ECG, which was recorded during overnight PSG (6 to 8 h) at a sample rate of 200 Hz. Each sample in the HRV signal is the time between two consecutive R peaks [34]. Hence, to derive HRV, we firstly applied a QRS-complex detection algorithm [35]. It was reported to reach high sensitivity (99.94%) and positive predictive value (99.93%), even in the presence of muscular noise and baseline artefacts (99.88% sensitivity and 99.73% positive predictive value, respectively) [35]. It is based on Hilbert transform and consists of two stages. Initially, the first differential of the ECG signal is computed (dECG). This is carried out to avoid baseline shifts and motion artefacts. Then the Hilbert transform is applied to dECG (h(n) = H[dECG]). Due to the properties of Hilbert transform, points around peaks in h(n) are regions of high probability of containing actual QRS peaks [35]. Since in h(n) the P and T waves are low comparing with the R waves [35], an adaptive threshold is used to establish those regions truly corresponding to R waves. In the second stage of the algorithm, these regions are used to look for the actual peaks in the original ECG. After QRS-complex detection, the difference between R-R peaks was computed. In order to deal with arrhythmia-related artefacts, we excluded those R-R intervals not fitting: (i) 0.33 s < R-R interval < 1.5 s and (ii) difference to the previous R-R interval > 0.66 s [11]. No statistically significant differences (Mann-Whitney U test) were found between women and men in the percentage of R-R intervals discarded per subject or between SAHS-positive and SAHS-negative subjects in both groups. Before performing the spectral analysis, the HRV signals were resampled at 3.41 Hz by the use of linear interpolation [11]. This sample frequency was chosen as a trade-off between not to add a large amount of estimated data and take an efficient length for the posterior fast Fourier transform computation.

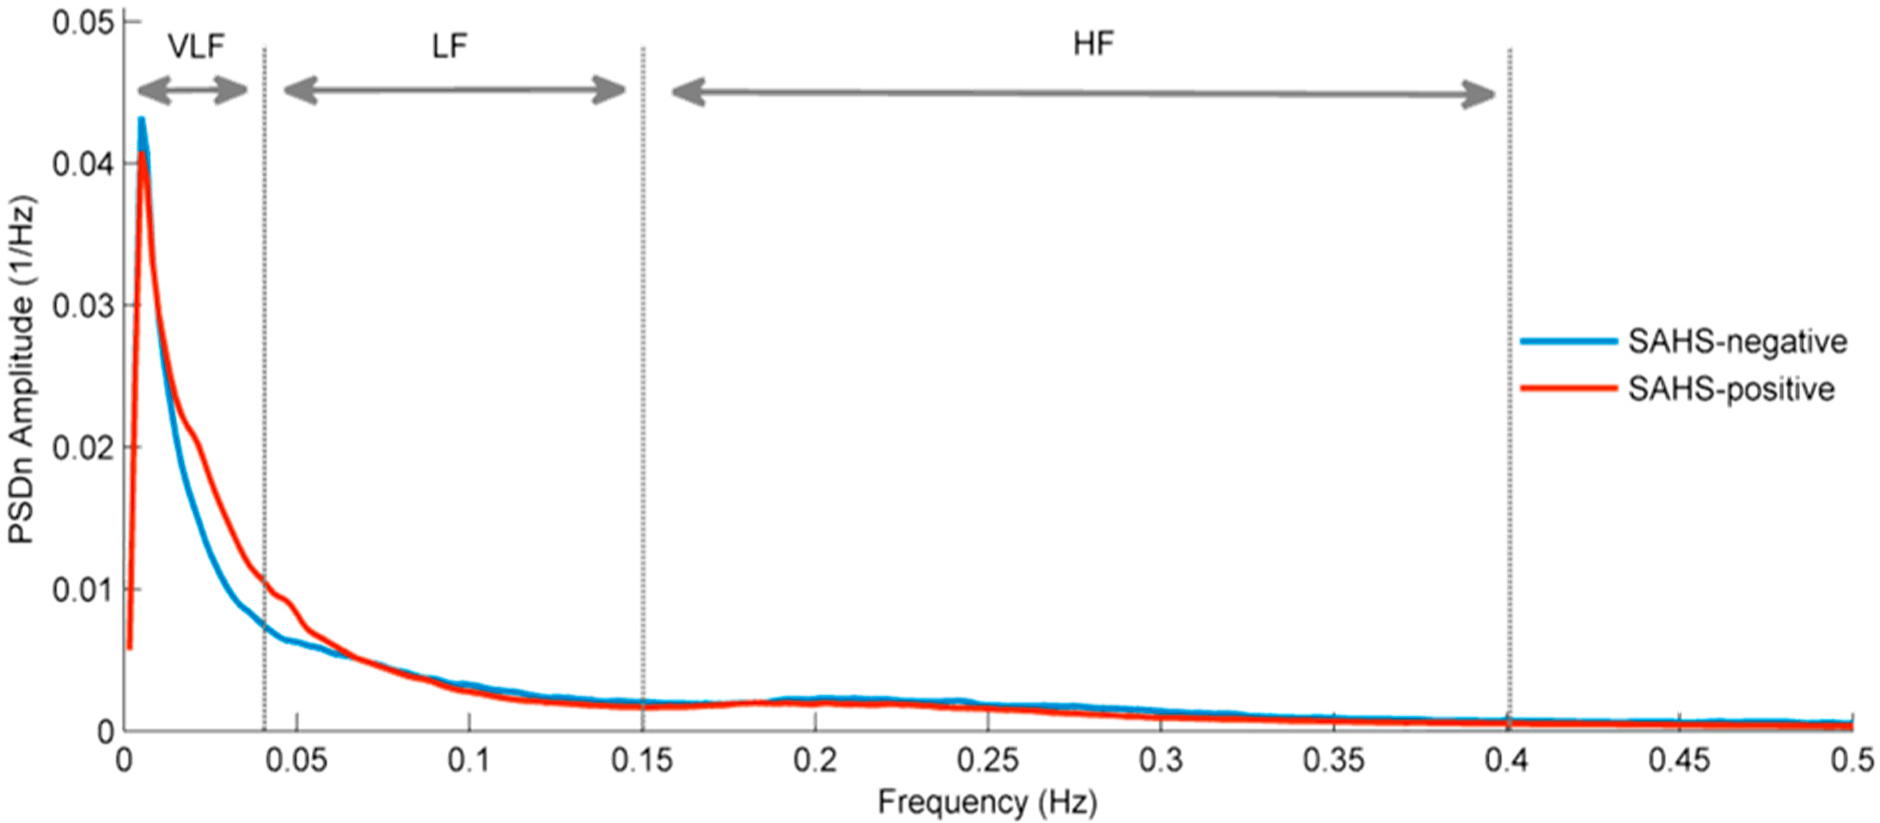
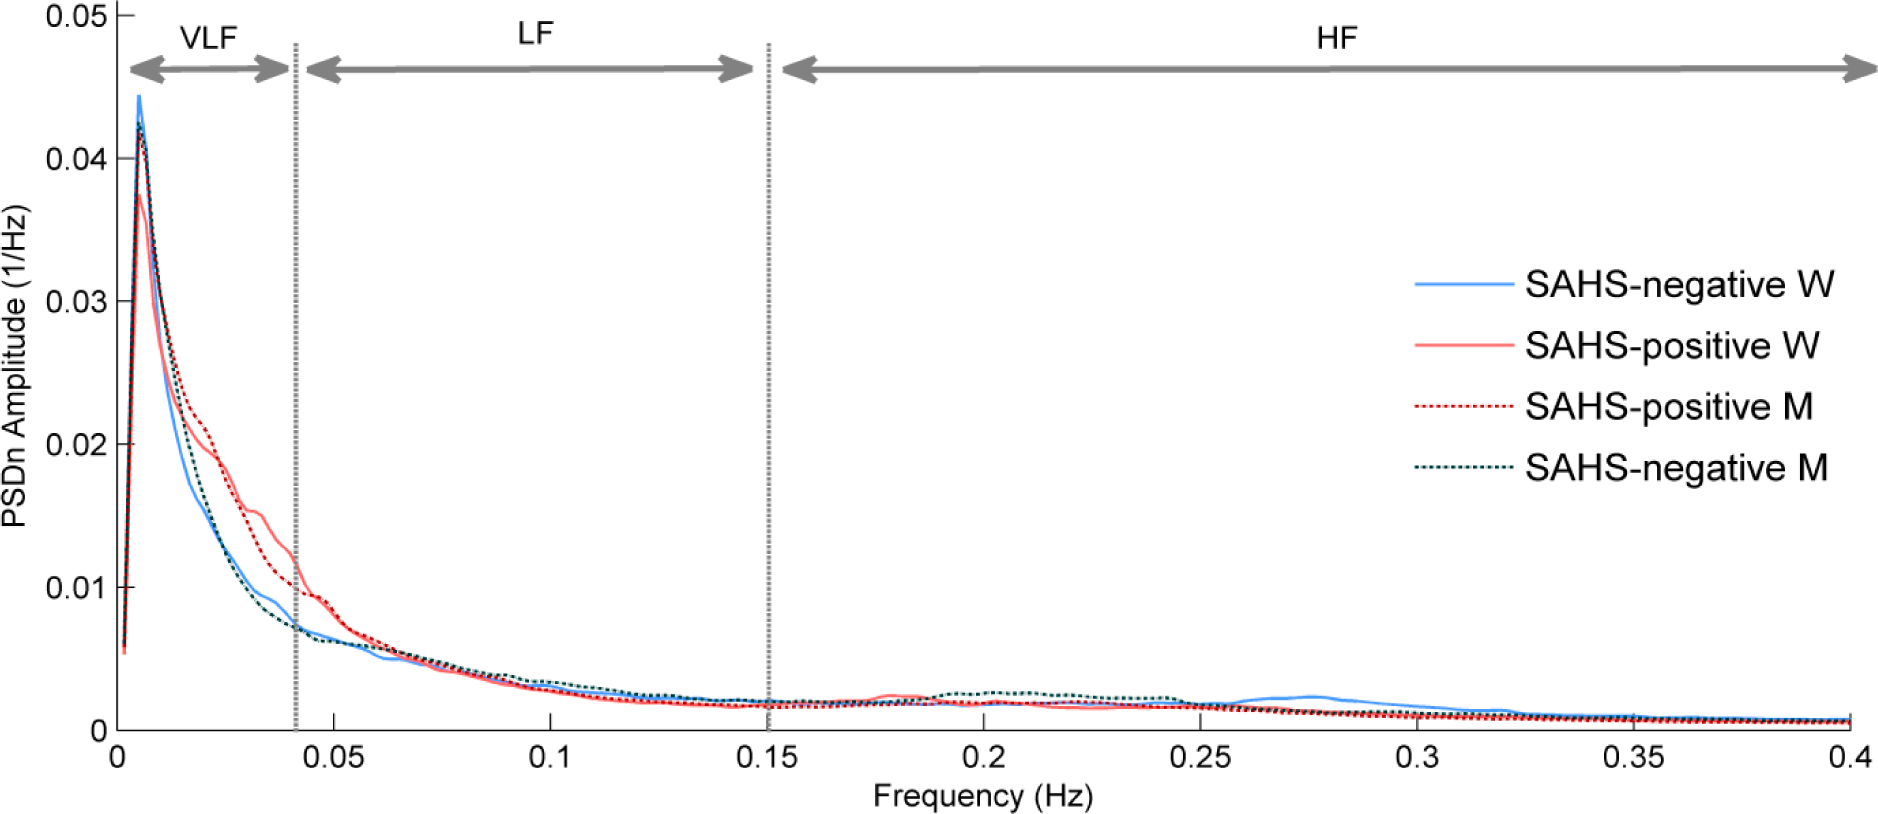
2.2. Analysis in Frequency Domain: Spectral Entropy

The power spectral density (PSD) of each resampled HRV recording was computed. We used the Welch’s method since it is suitable for non-stationary signals [36]. A Hamming window of 210 points (50% overlap), along with a discrete Fourier transform of 211 points, were used to estimate the PSDs. Then, each PSD was normalized (PSDn) by dividing the amplitude value at each frequency by the corresponding total power. In spite of some controversy [37], it is commonly accepted that LF is associated with sympathetic activity [8,11], i.e., variations in the low-frequency PSD values from HRV reflect changes in the sympathetic nervous system. On the other hand, HF has been related to the respiratory rhythms and, therefore, to the parasympathetic activity [8,11]. The physiological interpretation of the very-low-frequency PSD values remains unclear [11], and it has been simply identified with long-period rhythms [38].
SE measurements were obtained from VLF (SEVLF), LF (SELF), HF (SEHF), and 0–0.4 Hz (SEVLF-HF) bands. SE quantifies the uniformity, or flatness, of a PSD distribution [17,39]. Thus, a uniform (flat) spectrum, whose components are equally dispersed along frequencies, gives a high SE value (SE ≈ 1) [40]. This is the case of low predictability signals like the white noise [39,40]. Conversely, a condensed spectrum gives a low SE value (SE ≈ 0), which is the case of high predictability signals like sinusoids [39,40]. Thereby, for each band, higher SE values correspond to less predictability for the associated components in time domain. SE can be computed from the following expression [17]:
S E = f = f 1 f 2 PSDn ( f ) log [ PSDn ( f ) ]
which is the application of Shannon’s entropy to the normalized values of the PSD between the f1 and f2 frequency limits [17].

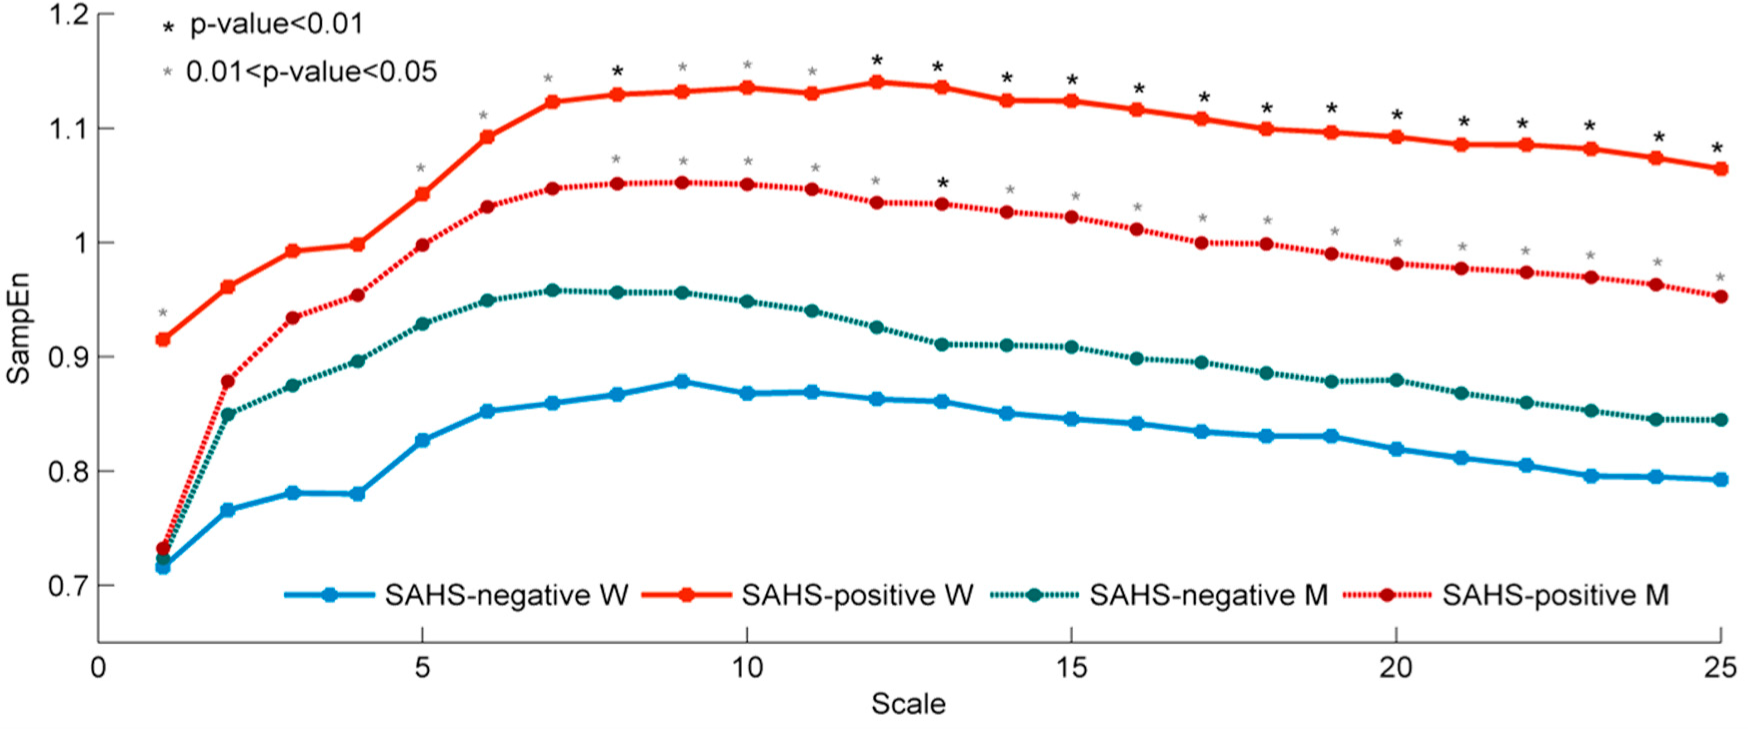
2.3. Nonlinear Analysis in Time Domain: Multiscale Entropy

It is accepted that biological systems tend to non-linearity. As stated above, the heart rate is supposed to behave in this way [16]. In this regard, the MsE analysis applied to HRV has showed to be helpful in determining complexity patterns of several illnesses, as well as age [22,23]. MsE was originally developed by Costa et al. [41] on the basis of approximate entropy (ApEn) or sample entropy (SampEn). ApEn was designed by Pincus as an entropy measure which quantifies irregularity in time series [42]. Richman and Moorman improved ApEn by developing SampEn to reduce the bias caused by self-matching [43].
SampEn divides time-series into consecutive vectors of length m. It assesses whether the maximum absolute distance between the corresponding components of each pair of vectors is less than or equal to a tolerance r, i.e., if the vectors match each other within r. If so, the vectors are considered as similar. The same process is repeated for vectors of length m + 1. Then, it is computed the conditional probability of similar vectors of length m remaining similar when the length is m + 1. The final SampEn value is obtained as the negative logarithm of such conditional probability [29,43]. Thus, higher values of SampEn indicate less self-similarity in the times-series and, consequently, more irregularity [29].
Our MsE analysis begins by applying SampEn to the original HRV series. This is the first scale. Scale 2 is computed by applying SampEn to a time-series whose values are the original HRV values averaged every two samples, without overlapping. In the same way, scale k is computed applying SampEn to time-series whose values are the original HRV values averaged every k samples without overlapping [41].
SampEn requires fitting a vector length, m, and a tolerance, r. We used m = 3 and r = 0.2 times the standard deviation of the time-series, as common choices in the study of HRV through SampEn [44]. Our HRV recordings have an average length of 29,000 points. A proper computation of SampEn requires at least 10m points [43]. Hence, we chose 25 as a conservative number of scales to be analysed. The SampEn values of the 25 scales were taken as features (SampEn1- SampEn25).

2.4. Logistic Regression: Automatic Feature Selection and Classification

Logistic regression (LR) is a well-known supervised learning algorithm which estimates the posterior probability that a given instance xi belongs to certain class Ck. This posterior probability, p(Ck| xi), is computed through the logistic function:
p ( C k | x i ) = e β 0 + β T x i 1 + e β 0 + β T x i
where β0 and β are obtained by the weighted least squares minimization procedure [32]. Then, an instance xi is assigned to the class with larger posterior probability. In our case, we have two classes: SAHS-positive and SAHS-negative. Input pattern xi for each subject was composed of the feature values obtained for that subject after the SE and MsE analyses.
In this study LR was used with two purposes. First, to automatically select relevant and non-redundant features among those extracted from the SE and MsE analyses. This was performed through the forward-selection backward-elimination algorithm (FSBE), proposed by Hosmer and Lemeshow [32]. Then, LR was also used to assess the joint diagnostic ability of the features selected in the previous step.

2.5. Statistical Analysis

Features did not pass the Lilliefors normality test. Hence, the non-parametric Mann-Whitney U test was used to establish eventual statistically significant differences between SAHS-positive and SAHS-negative subjects (p-value < 0.01), both in women and men. The diagnostic ability of LR was assessed in terms of sensitivity (Se, percentage of SAHS-positive subjects rightly classified), specificity (Sp, percentage of SAHS-negative subjects rightly classified), accuracy (Acc, overall percentage of subjects rightly classified), positive predictive value (PPV, proportion of positive test results which are true positives), negative predictive value (NPV, proportion of negative test results which are true negatives), positive likelihood ratio (LR+, Se/(1-Sp)), and negative likelihood ratio (LR-, (1-Se)/Sp). The area under the receiver operating-characteristic curve was also computed (AROC). All the statistics were obtained after a leave-one-out cross-validation (loo-cv) procedure.

3. Results

Our results are divided into three sections. First, we compare the PSDn of SAHS-positive and SAHS-negative subjects, along with their corresponding SEVLF, SELF, SEHF, and SEVLF-HF mean values. Then, a similar analysis is conducted by using MsE curves and the features extracted from them: SampEn1-SampEn25. Thus, 29 features are obtained from the HRV of each subject. Finally, we compare LR models obtained to detect SAHS in women, men, and the whole set of subjects, which are built with an optimum subset out of the 29 features for each case.

3.1. Spectral Entropy

Figure 1 shows the averaged PSDn for the whole sets of SAHS-positive and SAHS-negative subjects (men and women jointly). VLF (0–0.04 Hz), LF (0.04–0.15 Hz), and HF (0.15–0.4 Hz) bands are also showed. Figure 2 shows the average PSDn values in women and men for the SAHS-positive and SAHS-negative groups. PSDn in both genders follow the same pattern, with SAHS-positive curves being qualitatively higher than the SAHS-negative ones from 0.015 to 0.060 Hz, approximately, i.e., covering part of VLF and LF bands. Mean values of SE for the four bands considered are displayed in Table 2, separated by genders and SAHS class.
Statistically significant differences between SAHS-positive and SAHS-negative subjects were found in the SE measures from VLF and LF of women and men (Mann-Whitney U test, p-value < 0.01). Specifically, SAHS-positive women and men present significantly higher SEVLF and significantly lower SELF. On the other hand, no statistically significant differences were found in the SE of HF and the whole band. Finally, no statistically significant differences between women and men were found in any of the SE measures, either between SAHS-positive groups or between SAHS-negative ones.

3.2. Multiscale Entropy

Figure 3 displays averaged MsE curves for the 25 scales of SAHS-positive and SAHS-negative whole groups (men and women jointly). Figure 4 depicts the average MsE curves for SAHS-positive and SAHS-negative subjects, divided into women and men. It can be observed that SAHS increases SampEn values, i.e., irregularity of HRV, for all the scales. A common behaviour is observed both in men and women, since the differences in low scales (1st to 7th) are lower than those in the high scales (from the 8th). This indicates higher differences in the degree of HRV irregularity of SAHS-positive subjects as more R-R intervals are averaged. However, only scale 13th reaches statistically significant differences between SAHS-positive and SAHS-negative men, whereas statistically significant differences are showed for scale 8th and from scale 12th onwards in women. No statistically significant differences were found between SAHS-negative women and men, and only scale 1 showed them in the case of the SAHS-positive groups.

3.3. Feature Selection and Classification Results

The relevancy and complementarity of the features from SE and MsE analyses were assessed by the LR-based FSBE selection algorithm. In this regard, three experiments were conducted. First, only the features from women were included in the FSBE algorithm. Then, we did the same with the features from men. Finally, we applied the FSBE methodology to the 29 extracted features from the whole set of subjects. Table 3 shows the features selected in each case. SE and MsE features were selected in the three of them, showing that the information obtained from these analyses is complementary for SAHS detection. Moreover, SEVLF, SELF, and SampEn2 are common in the three optimum sets of features. Different tendencies can be observed for men and women in the remaining MsE features selected. For female subjects only scales below 8 were selected, whereas in the case of men the remaining features were selected from scales above 9.
The results of the diagnostic ability assessment of the corresponding LR models are shown in Table 4. All the statistics were computed after a loo-cv procedure. It can be observed that LRFSBE-W and LRFSBE-M, separately, achieve a significant higher performance than the LR model containing all the subjects. LRFSBE-W achieves the highest overall performance.

4. Discussion and Conclusions

In this study, the ability of entropy measures to characterize SAHS in HRV recordings was evaluated. We also looked for eventual differences in these analyses depending on gender. Spectral entropy measurements in the VLF and LF bands characterized SAHS transversely, i.e., regardless the gender. Thus, for both genders, SAHS decreased predictability of long-period rhythms in HRV (significantly higher SEVLF). Also, it made more predictable the rhythms usually associated with sympathetic activity (significantly lower SELF). Spectral powers from VLF (PVLF), LF (PLF), and HF (PHF), as well as the LF/HF spectral power ratio (PLF/HF), have usually acted as parameters to characterize different physiological conditions in the HRV signal [8]. Table 5 shows the values of these conventional parameters reached by our SAHS-negative and SAHS-positive groups both in women and men (mean ± standard deviation). The corresponding p-values are also displayed (Mann-Whitney U test, p-value significance threshold = 0.01). No statistically significant differences were found between SAHS-negative and SAHS-positive women in any of the classical parameters and only PHF showed a p-value < 0.01 in the case of men. Thus, SE showed higher performance when characterizing SAHS than the spectral powers obtained from the conventional VLF, LF, and HF bands. Nevertheless, a clear increase in the PSDn of SAHS-positive subjects can be observed in the range 0.015–0.060 Hz, covering part of VLF and LF bands (see Figure 3). It has been established that the typical duration of apnoeic events ranges from 20 to 40 s [45], which in the frequency domain would mainly affect the 0.025–0.050 Hz band. Latest studies confirmed this as the band with the highest statistically significant differences between SAHS-positive and SAHS-negative subjects in the airflow signal [46,47]. Additionally, a recent study has reported an increased cardio-respiratory coordination during the apnoeic events [48]. Hence, there exist strong indications that the observed changes covering part of the VLF and LF bands may be directly caused by these events, suggesting that further investigation is needed to find a specific spectral band related to SAHS in HRV. Finally, no differences were found in the SE from the HF band. This could be due to its relationship with normal breathing patterns [11], which are more predictable as well as predominant even in the presence of severe SAHS.
MsE analysis also found differences in SAHS-positive and SAHS-negative subjects. Both in women and men, SAHS increased the average irregularity of HRV in the 25 time scales considered. Although it is usually accepted that the disease condition leads to a decrease of HRV irregularity [8], it has been also shown that sick sinus syndrome, characterized by bradycardia-tachycardia events, can increase the entropy measures [8]. As these bradycardia-tachycardia patterns are also recurrent after apnoeic events [9], this is consistent with the higher values of HRV irregularity showed in the MsE analysis of the SAHS-positive subjects. Moreover, in both genders, differences for the inferior scales are lower than those for the coarse-grained scales, indicating that SAHS affects more the long-term rhythms. This agrees with the differences found in the SE of VLF and LF. However, unlike the case of SE, we found different tendencies in men and women in the MsE curves. Mean values throughout the scales were higher for SAHS-positive and lower for SAHS-negative women than the corresponding for men. Thereby, 15 out of the 25 scales reached significant differences between SAHS-positive and SAHS-negative women, whereas only one did the same among men. In this regard, it has been previously reported that the R-R intervals from healthy women are significantly shorter and present less standard deviation than the corresponding from men [31]. This is reflected in HRV time series as lower mean amplitude and degree of variability. In this study the same tendency is observed since mean and standard deviation values in HRV are 0.886 ± 0.15 ms for SAHS-negative men and 0.878 ± 0.13 ms for SAHS-negative women. When comparing the two groups, in which normal heart behaviour is expected, the lower degree of variability may be one reason for the lesser mean values of entropy in women throughout the scales. In SAHS-positive subjects, the mean and standard deviation values in HRV behave in the same way (0.901 ± 0.12 ms for men and 0.888 ± 0.10 ms for women). Progressive bradycardia patterns are present in HRV from SAHS patients, i.e., there are recurrent periods of increased HRV amplitude. Since the mean amplitude in women is lower, the difference to the increased HRV values may be higher than in men. This may be one reason for explaining the upper values of entropy, which tachycardia episodes would not be able to compensate because of their abrupt nature.
The FSBE algorithm showed the complementarity of SE and MsE analyses by automatically selecting features from both of them in the case of women, men, and the whole set of subjects. Additionally, since SEVLF and SELF were common for the three sets of optimum features, it supported SE as a transversal characterizing of SAHS. It also supported the ability of MsE to distinguish gender specificities in HRV, since only scales below the 8th were selected in the case of women and eight out of the nine scales selected for men were above the 9th.
LR models were built with the three sets of selected features. These showed significantly higher performance when modelling SAHS by genders (85.2% Acc for LRFSBE-W, 77.6% Acc for LRFSBE-M) than when doing it in a jointly way (72.3% Acc for LRFSBE-All). As a result, Acc increased 9.3% among women and 6.7% among men when comparing with the performance of the general model. Our feature selection methodology was optimized for an AHI threshold = 10 e/h. However, the outputs provided by the LR models can be also evaluated for other common thresholds. Thereby, for AHI = 5 (15) e/h, the Acc of LRFSBE-W, LRFSBE-M, and LRFSBE-ALL reaches 75.9% (79.6%), 76.1% (66.4%), and 72.3% (65.4%), respectively. Although 5 and 15 e/h are suboptimal thresholds for these models, the obtained results show the same general tendency as in the case of AHI = 10 e/h. Thus, it is suggested that SAHS may be more easily modelled from the SE and MsE analyses of HRV in the case of women.
Table 6 displays results from previous works focused on automatic SAHS classification. Data from studies involving SpO2, airflow, snoring, respiratory effort, and HRV were included. In the case of the SpO2 signal, Acc and AROC range from 84.1% to 95% and 0.822 to 0.967, respectively [4952]. A database composed of 187 recordings was used to model a multi-layer perceptron (MLP) classifier, which was obtained from three non-linear features [49]. Six spectral (3) and non-linear (3) features were extracted from the same database to obtain four more classifiers by means of linear and quadratic discriminant analysis, K-nearest neighbours (KNN), and LR [50]. The best diagnostic ability for SpO2 in terms of AROC (0.967) was achieved by a LR model obtained from four automatically-selected features extracted from the frequency and time domain of 147 recordings [51]. The best Acc (95.0%) was reported in the case of a support vector machine (SVM) classifier evaluated for a 5 e/h AHI threshold [52].
Up to nine features were extracted and analysed from the Hilbert transform of 41 oronasal airflow recordings [53]. The highest diagnostic ability was showed by the 25th frequency percentile of the Hilbert spectrum histogram (87.8% Acc and 0.877 AROC). However, these results were reached evaluating an AHI threshold = 5 e/h. Other recent study analysed linear and non-linear features from thermistor airflow [46]. A LR model obtained from three spectral features reached 82.4% Acc and 0.904 AROC after loo-cv (AHI threshold = 10 e/h). Moreover, five time and phase domain features from the abdominal and thoracic respiratory effort signals were used to feed a SVM classifier which reached 89.0% Acc, evaluated for AHI = 5 e/h [52]. Snoring sounds have been also assessed in the context of SAHS classification. A LR classifier modelled with nine spectral features reached 81.1% Acc and 0.850 AROC (AHI= 5 e/h threshold); and 86.5% Acc and 0.920 AROC (AHI = 5 e/h threshold) [54]. Another LR classifier obtained from 11 time and frequency domain features was evaluated for AHI = 10 e/h [55]. High diagnostic performance after loo-cv was reported (90.2% Acc and 0.967 AROC).
Decision trees, SVM, and LR classifiers have been also used to model SAHS from HRV features. Eight features from wavelet analysis were used to build a decision tree, reaching 69.3% Acc [56]. A SVM model was obtained from five time and frequency domain features [52]. Authors reported 79.0% Acc when evaluating the classifier for AHI = 5 e/h. A recent study reported 86.6% Acc and 0.941 AROC for a LR classifier modelling with four clinical variables and one symbolic dynamic feature extracted from HRV [57]. Finally, several works have reported 100% Acc when classifying 30 subjects from the PhysioNet Apnea-ECG database, which was used in the Computers in Cardiology Challenge 2000 [58]. However, comparison with studies using this database is difficult since borderline subjects were deliberately removed from the competition. Additionally, only one woman was included in the apnea group [59].
Our LR models achieved high diagnostic ability comparing with those studies involving HRV. Only the Acc reported in the study from Ravelo-García et al. outperformed the Acc reached by our LRFSBE-W model. However, our AROC was slightly higher and we did not include clinical variables in the modelling process. Moreover, only the results reported in the studies conducted by Álvarez et al. and Karunajeewa et al. outperformed our LRFSBE-W classifier both in Acc and AROC. Nonetheless, the latter does not meet the subject:feature ratio criterion which avoids bias in the logistic regression coefficients [60]. These results suggest that our proposal could be helpful to detect SAHS, especially in the case of women. Actually, none of the above mentioned studies addressed the problem of evaluating gender differences when modelling SAHS.
Some limitations need to be pointed out in this study. First, an increased number of subjects would provide our results with higher statistical power. Additionally, a larger number of subjects would let us define the optimum sets of features from an independent database. Nonetheless, we validated their performance by the use of leave-one-out cross-validation. Increasing the SAHS-negative men would be particularly helpful since there exists a clear unbalance with SAHS-positive ones. However, the prevalence of SAHS in our database reflects a realistic proportion of SAHS patients among the subjects which undergo PSG [7,61]. Another limitation is the complexity inherent to the acquisition of surface ECG as a previous step to obtain HRV. Although acquiring ECG is significantly easier than recording the whole set of signals involved during PSG, there exist studies which address the obtaining of HRV from simpler devices such as the oximeter [62,63]. Moreover, regarding the R-R time series, no specific correction for the timing of R waves associated with ectopic beats has been applied in this study. On the other hand, there are some factors with ability to change HRV dynamics. We did not address issues like tobacco and alcohol consumption, as well as differences in the fitness of the subjects. These could be the object of interesting future research. Another future goal is to carry out an exhaustive analysis of the optimal values of m and r for the computation of SampEn from HRV in the context of SAHS. Although the values used in this study have shown their usefulness in the characterization of a range of physiological conditions, we did not test other values which could enhance the characterization of SAHS in our specific database. Regarding the spectral and nonlinear analysis, other features extracted from HRV could complement our study and increase the diagnostic ability of our methodology. Finding a single feature with ability to gather the complementary information of those interdependent features present in our study would be of great interest. In addition, the use of more complex classifiers could also improve the results achieved. Finally, even though no statistically significant difference was found between the age of SAHS-positive and SAHS-negative groups (either women or men), higher average values are present in those affected by SAHS. In this regard, no statistically significant correlation was found between any of the features used in the LR models and age (all the absolute Spearman’s correlation coefficients were lower than 0.18 and the corresponding p-values higher than 0.11).
In summary, we showed that SE and MsE analyses of HRV can be used to help in SAHS detection. The complementarity of the two of them was also exposed. The ability of MsE to distinguish gender specificities in HRV was suggested too. Higher diagnostic ability was reached when modelling SAHS from entropy measures of women and men separately. A LR model built with five SE and MsE features from women achieved the highest performance in SAHS detection (85.2% Acc, 0.951 AROC for an AHI threshold = 10 e/h). This suggests that SAHS may be more easily modelled from HRV in the case of women. Our results show the utility of the SE and MsE analyses to help in SAHS detection, as well as indicate that, when using HRV, SAHS may be more accurately modelled if data are separated by gender.

Acknowledgments

This research was supported by project TEC2011-22987 from Ministerio de Economía y Competitividad and FEDER, the Proyecto Cero 2011 on Ageing from Obra Social La Caixa, Fundación General CSIC and CSIC, and the project VA059U13 from the Consejería de Educación de la Junta de Castilla y León. G. C. Gutiérrez-Tobal was in receipt of a PIRTU grant from the Consejería de Educación de la Junta de Castilla y León and the European Social Fund.
PACS Codes: 87.85.Ng; 87.19.Hh; 87.19.lo

Author Contributions

Gonzalo C. Gutiérrez-Tobal designed the study, analysed the data, interpreted the results, and drafted the manuscript. Daniel Álvarez and Roberto Hornero designed the study, analysed the data and interpreted the results. Javier Gomez-Pilar took part in the collection of data, analysed the data and interpreted the results. Félix del Campo took part in the diagnosis of subjects and the collection of data, and interpreted the results. All authors have read and approved the final manuscript.

Conflicts of Interest

The authors declare no conflict of interest.

References

  1. Lopez-Jiménez, F.; Kuniyoshi, F.H.S.; Gami, A.; Somers, V.K. Obstructive Sleep Apnea. Chest 2008, 133, 793–804. [Google Scholar]
  2. Patil, S.P.; Schneider, H.; Schwartz, A.R.; Smith, P.L. Adult obstructive sleep apnea: Pathophysiology and diagnosis. Chest 2007, 132, 325–337. [Google Scholar]
  3. Epstein, L.J.; Kristo, D.; Strollo, P.J.; Friedman, N.; Malhotra, A.; Patil, S.P.; Ramar, K.; Rogers, R.; Schwab, R.J.; Weaver, E.M.; et al. Clinical guideline for the evaluation, management and long-term care of obstructive sleep apnea in adults. J. Clin. Sleep Med. 2009, 5, 263–276. [Google Scholar]
  4. Bennett, J.A.; Kinnear, W.J.M. Sleep on the cheap: The role of overnight oximetry in the diagnosis of sleep apnoea hypopnoea syndrome. Thorax 1999, 54, 958–959. [Google Scholar]
  5. Iber, C.; Ancoli-Israel, S.; Chesson, A.L.; Quan, S.F. The AASM Manual for the Scoring of Sleep and Associated Events; American Academy of Sleep Medicine: Westchester, IL, USA, 2007. [Google Scholar]
  6. Flemons, W.W.; Littner, M.R.; Rowley, J.A.; Gay, P.; Anderson, W.M.; Hudgel, D.W.; McEvoy, R.D.; Loube, D.I. Home diagnosis of sleep apnea: A systematic review of the literature. Chest 2003, 124, 1543–1579. [Google Scholar]
  7. Flemons, W.W.; Douglas, N.J.; Kuna, S.T.; Rodenstein, D.O.; Wheatley, J. Access to diagnosis and treatment of patients with suspected sleep apnea. Am. J. Respir. Crit. Care Med. 2004, 169, 668–672. [Google Scholar]
  8. Acharya, U.R.; Joseph, K.P.; Kannathal, N.; Lim, C.M.; Suri, J.S. Heart rate variability: A review. Med. Biol. Eng. Comput. 2006, 44, 1031–1051. [Google Scholar]
  9. Guilleminault, C.; Winkle, R.; Connolly, S.; Melvin, K.; Tilkian, A. Cyclical variation of the heart rate in sleep apnoea syndrome: Mechanisms and usefulness of 24 h electrocardiography as a screening technique. Lancet 1984, 323, 126–131. [Google Scholar]
  10. Bonsignore, M.R.; Romano, S.; Marrone, O.; Chiodi, M.; Bonsignore, G. Different heart rate patterns in obstructive apneas during NREM sleep. Sleep 1997, 20, 1167–1174. [Google Scholar]
  11. Penzel, T.; Kantelhardt, J.W.; Grote, L.; Peter, J.H.; Bunde, A. Comparison of detrended fluctuation analysis and spectral analysis for heart rate variability in sleep and sleep apnea. IEEE Trans. Biomed. Eng. 2003, 50, 1143–1151. [Google Scholar]
  12. Gula, L.J.; Krahn, A.D.; Skanes, A.; Ferguson, K.A.; George, C.; Yee, R.; Klein, G.J. Heart rate variability in obstructive sleep apnea: A prospective study and frequency domain analysis. Ann. Noninvasive Electrocardiol. 2003, 8, 144–149. [Google Scholar]
  13. Penzel, T.; Wessel, N.; Riedl, M.; Kantelhardt, J.W.; Rostig, S.; Glos, M.; Suhrbier, A.; Malberg, H.; Fietze, I. Cardiovascular and respiratory dynamics during normal and pathological sleep. Chaos 2007, 17, 015116. [Google Scholar]
  14. Gapelyuk, A.; Riedl, M.; Suhrbier, A.; Kraemer, J.F.; Bretthauer, G.; Malberg, H.; Kurths, J.; Penzel, T.; Wessel, N. Cardiovascular regulation in different sleep stages in the obstructive sleep apnea syndrome. Biomed. Technik. (Biomed. Eng.) 2011, 56, 207–213. [Google Scholar]
  15. Goldberger, A.L. Is the normal heartbeat chaotic or homeostatic? News Physiol. Sci. 1991, 6, 87–91. [Google Scholar]
  16. Wessel, N.; Riedl, M.; Kurths, J. Is the normal heart rate “chaotic” due to respiration? Chaos 2009, 19, 028508. [Google Scholar]
  17. Poza, J.; Hornero, R.; Abásolo, D.; Fernández, A.; García, M. Extraction of spectral based measures from MEG background oscillations in Alzheimerʼs disease. Med. Eng. Phys. 2007, 29, 1073–1083. [Google Scholar]
  18. Chang, Y.C.; Wu, H.T.; Chen, H.R.; Liu, A.B.; Yeh, J.J.; Lo, M.T.; Tsao, J.H.; Tang, C.-J.; Tsai, I.-T.; Sun, C.-K. Application of a Modified Entropy Computational Method in Assessing the Complexity of Pulse Wave Velocity Signals in Healthy and Diabetic Subjects. Entropy 2014, 16, 4032–4043. [Google Scholar]
  19. Alcaraz, R.; Rieta, J.J. Sample entropy of the main atrial wave predicts spontaneous termination of paroxysmal atrial fibrillation. Med. Eng. Phys. 2009, 31, 917–922. [Google Scholar]
  20. Hornero, R.; Álvarez, D.; Abásolo, D.; del Campo, F.; Zamarrón, C. Utility of approximate entropy from overnight pulse oximetry data in the diagnosis of the obstructive sleep apnea syndrome. IEEE Trans. Biomed. Eng. 2007, 54, 107–113. [Google Scholar]
  21. Al-Angari, H.M.; Sahakian, A.V. Use of sample entropy approach to study heart rate variability in obstructive sleep apnea syndrome. IEEE Trans. Biomed. Eng. 2007, 54, 1900–1904. [Google Scholar]
  22. Costa, M.D.; Peng, C.K.; Goldberger, A.L. Multiscale analysis of heart rate dynamics: Entropy and time irreversibility measures. Cardiovasc. Eng. 2008, 8, 88–93. [Google Scholar]
  23. Costa, M.D.; Goldberger, A.L.; Peng, C.K. Multiscale entropy analysis of biological signals. Phys. Rev. E 2005, 71, 021906. [Google Scholar]
  24. Costa, M.D.; Peng, C.K.; Goldberger, A.L.; Hausdorff, J.M. Multiscale entropy analysis of human gait dynamics. Physica A 2003, 330, 53–60. [Google Scholar]
  25. Escudero, J.; Abásolo, D.; Hornero, R.; Espino, P.; López, M. Analysis of electroencephalograms in Alzheimer’s disease patients with multiscale entropy. Physiol. Meas. 2006, 27, 1091–1106. [Google Scholar]
  26. Takahashi, T.; Cho, R.Y.; Mizuno, T.; Kikuchi, M.; Murata, T.; Takahashi, K.; Wada, Y. Antipsychotics reverse abnormal EEG complexity in drug-naive schizophrenia: A multiscale entropy analysis. Neuroimage 2010, 51, 173–182. [Google Scholar]
  27. Hans, P.; Dewandre, P.Y.; Brichant, J.F.; Bonhomme, V. Comparative effects of ketamine on Bispectral Index and spectral entropy of the electroencephalogram under sevoflurane anaesthesia. Br. J. Anaesth. 2005, 94, 336–340. [Google Scholar]
  28. Shen, J.L.; Hung, J.W.; Lee, L.S. Robust entropy-based endpoint detection for speech recognition in noisy environments. ICSLP 1998, 98, 232–235. [Google Scholar]
  29. Abásolo, D.; Hornero, R.; Espino, P.; Álvarez, D.; Poza, J. Entropy analysis of the EEG background activity in Alzheimer’s disease patients. Physiol. Meas. 2006, 27, 241–253. [Google Scholar]
  30. Alvarez, D.; Hornero, R.; Marcos, J.V.; Wessel, N.; Penzel, T.; Glos, M.; del Campo, F. Assessment of Feature Selection and Classification Approaches to Enhance Information from Overnight Oximetry in the Context of Apnea Diagnosis. Int. J. Neural Syst. 2013, 23, 1–18. [Google Scholar]
  31. Bonnemeier, H.; Wiegand, U.K.; Brandes, A.; Kluge, N.; Katus, H.A.; Richardt, G.; Potratz, J. Circadian profile of cardiac autonomic nervous modulation in healthy subjects. J. Cardiovasc. Electrophysiol. 2003, 14, 791–799. [Google Scholar]
  32. Hosmer, D.W.; Lemeshow, S. Applied Logistic Regression; John Wiley & Sons: London, UK, 1999. [Google Scholar]
  33. Berry, R.B.; Budhiraja, R.; Gottlieb, D.J.; Gozal, D.; Iber, C.; Kapur, V.K.; Marcus, C.L.; Mehra, R.; Parthasarathy, S.; Quan, S.F.; et al. Rules for scoring respiratory events in sleep: Update of the 2007 AASM manual for the scoring of sleep and associated events. J. Clin. Sleep Med. 2012, 8, 597–619. [Google Scholar]
  34. Baselli, G.; Cerutti, S.; Civardi, S.; Lombardi, F.; Malliani, A.; Merri, M.; Pagani, M.; Rizzo, G. Heart rate variability signal processing: A quantitative approach as an aid to diagnosis in cardiovascular pathologies. Int. J. Biol. Med. Comput. 1987, 20, 51–70. [Google Scholar]
  35. Benitez, D.; Gaydecki, P.A.; Zaidi, A.; Fitzpatrick, A.P. The use of the Hilbert transform in ECG signal analysis. Comput. Biol. Med. 2001, 31, 399–406. [Google Scholar]
  36. Welch, P.D. The use of fast Fourier transform for the estimation of power spectra: A method based on time averaging over short, modified periodograms. IEEE Trans. Audio Electroacoust. 1967, 15, 70–73. [Google Scholar]
  37. Reyes del Paso, G.A.; Langewitz, W.; Mulder, L.J.; Roon, A.; Duschek, S. The utility of low frequency heart rate variability as an index of sympathetic cardiac tone: A review with emphasis on a reanalysis of previous studies. Psychophysiology 2013, 50, 477–487. [Google Scholar]
  38. Sztajzel, J. Heart rate variability: A noninvasive electrocardiographic method to measure the autonomic nervous system. Swiss Med. Wkly. 2004, 134, 514–522. [Google Scholar]
  39. Inouye, T.; Shinosaki, K.; Sakamoto, H.; Toi, S.; Ukai, S.; Iyama, A.; Katsuda, Y.; Hirano, M. Quantification of EEG irregularity by use of the entropy of the power spectrum. Electroencephalogr. Clin. Neurophysiol. 1991, 79, 204–210. [Google Scholar]
  40. Sleigh, J.W.; Steyn-Ross, D.A.; Steyn-Ross;, M.L.; Grant, C.; Ludbrook, G. Cortical entropy changes with general anaesthesia: Theory and experiment. Physiol. Meas. 2004, 25, 921–934. [Google Scholar]
  41. Costa, M.; Goldberger, A.L.; Peng, C.K. Multiscale entropy analysis of complex physiologic time series. Phys. Rev. Lett. 2002, 89, 068102. [Google Scholar]
  42. Pincus, S.M. Approximate entropy as a measure of system complexity. Proc. Natl. Acad. Sci. USA 1991, 88, 2297–2301. [Google Scholar]
  43. Richman, J.S.; Moorman, J.R. Physiological time-series analysis using approximate entropy and sample entropy. Am. J. Physiol. Heart Circ. Physiol. 1999, 278, H2039–H2049. [Google Scholar]
  44. Alcaraz, R.; Rieta, J.J. A review on sample entropy applications for the non-invasive analysis of atrial fibrillation electrocardiograms. Biomed. Signal. Process. Control. 2010, 5, 1–14. [Google Scholar]
  45. Eckert, D.J.; Malhotra, A. Pathophysiology of adult obstructive sleep apnea. Proc. Am. Thoracic Soc. 2008, 5, 144–153. [Google Scholar]
  46. Gutiérrez-Tobal, G.C.; Hornero, R.; Álvarez, D.; Marcos, J.V.; del Campo, F. Linear and nonlinear analysis of airflow recordings to help in sleep apnoea-hypopnoea syndrome diagnosis. Physiol. Meas. 2012, 33, 1261–1275. [Google Scholar]
  47. Gutiérrez-Tobal, G.C.; Álvarez, D.; Marcos, J.V.; del Campo, F.; Hornero, R. Pattern recognition in airflow recordings to assist in the sleep apnoea–hypopnoea syndrome diagnosis. Med. Biol. Eng. Comput. 2013, 51, 1367–1380. [Google Scholar]
  48. Riedl, M.; Müller, A.; Kraemer, J.F.; Penzel, T.; Kurths, J.; Wessel, N. Cardio-Respiratory Coordination Increases during Sleep Apnea. PLoS One 2014, 9, e93866. [Google Scholar]
  49. Marcos, J.V.; Hornero, R.; Álvarez, D.; del Campo, F.; Zamarrón, C.; López, M. Utility of multilayer perceptron neural network classifiers in the diagnosis of the obstructive sleep apnoea syndrome from nocturnal oximetry. Comput. Methods Progr. Biomed. 2008, 92, 79–89. [Google Scholar]
  50. Marcos, J.V.; Hornero, R.; Álvarez, D.; del Campo, F.; Zamarrón, C. Assessment of four statistical pattern recognition techniques to assist in obstructive sleep apnoea diagnosis from nocturnal oximetry. Med. Eng. Phys. 2009, 31, 971–978. [Google Scholar]
  51. Alvarez, D.; Hornero, R.; Marcos, J.V.; del Campo, F. Multivariate analysis of blood oxygen saturation recordings in obstructive sleep apnea diagnosis. IEEE Trans. Biomed. Eng. 2010, 57, 2816–2824. [Google Scholar]
  52. Al-Angari, H.M.; Sahakian, A.V. Automated recognition of obstructive sleep apnea syndrome using support vector machine classifier. IEEE Trans. Inf. Technol. Biomed. 2012, 16, 463–468. [Google Scholar]
  53. Caseiro, P.; Fonseca-Pinto, R.; Andrade, A. Screening of obstructive sleep apnea using Hilbert-Huang decomposition of oronasal airway pressure recordings. Med. Eng. Phys. 2010, 32, 561–568. [Google Scholar]
  54. Fiz, J.A.; Jane, R.; Solà-Soler, J.; Abad, J.; García, M.; Morera, J. Continuous analysis and monitoring of snores and their relationship to the apnea-hypopnea index. Laryngoscope 2010, 120, 854–862. [Google Scholar]
  55. Karunajeewa, A.S.; Abeyratne, U.R.; Hukins, C. Multi-feature snore sound analysis in obstructive sleep apnea-hypopnea syndrome. Physiol. Meas. 2011, 32. [Google Scholar] [CrossRef]
  56. Roche, F.; Pichot, V.; Sforza, E.; Duverney, D.; Costes, F.; Garet, M.; Barthélémy, J.C. Predicting sleep apnoea syndrome from heart period: A time-frequency wavelet analysis. Eur. Respir. J. 2003, 22, 937–942. [Google Scholar]
  57. Ravelo-García, A.G.; Saavedra-Santana, P.; Juliá-Serdá, G.; Navarro-Mesa, J.L.; Navarro-Esteva, J.; Álvarez-López, X.; Gapelyuk, A.; Penzel, T.; Wessel, N. Symbolic dynamics marker of heart rate variability combined with clinical variables enhance obstructive sleep apnea screening. Chaos 2006, 24, 024404. [Google Scholar]
  58. Penzel, T.; McNames, J.; de Chazal, P.; Raymond, B.; Murray, A.; Moody, G. Systematic comparison of different algorithms for apnoea detection based on electrocardiogram recordings. Med. Biol. Eng. Comput. 2002, 40, 402–407. [Google Scholar]
  59. Penzel, T.; Moody, G.B.; Mark, R.G.; Goldberger, A.L.; Peter, J.H. The apnea-ECG database. In Computers in Cardiology 2000, Proceedings of Conference in Computers in Cardiology, Cambridge, MA, USA, 24–27 September 2000; pp. 255–258.
  60. Peduzzi, P.; Concato, J.; Kemper, E.; Holford, T.R.; Feinstein, A.R. A simulation study of the number of events per variable in logistic regression analysis. J. Clin. Epidemiol. 1996, 49, 1373–1379. [Google Scholar]
  61. Kapsimalis, F.; Kryger, M.H. Gender and obstructive sleep apnea syndrome, part 1: Clinical features. Sleep 2002, 25, 412–419. [Google Scholar]
  62. Constant, I.; Laude, D.; Murat, I.; Elghozi, J.L. Pulse rate variability is not a surrogate for heart rate variability. Clin. Sci. 1999, 97, 391–397. [Google Scholar]
  63. Gil, E.; Orini, M.; Bailón, R.; Vergara, J.M.; Mainardi, L.; Laguna, P. Photoplethysmography pulse rate variability as a surrogate measurement of heart rate variability during non-stationary conditions. Physiol. Meas. 2010, 31, 1271. [Google Scholar]
Figure 1. Normalized power spectral density of HRV in the whole set of SAHS-negative (blue) and SAHS-positive (red) subjects.
Entropy 17 00123f1
Figure 2. Normalized power spectral density of HRV in women (solid lines) and men (dashed lines) for the SAHS-positive and SAHS-negative groups.
Entropy 17 00123f2
Figure 3. Averaged MsE curves for 25 scales of the SAHS-negative (blue) and SAHS-positive (red) whole groups.
Entropy 17 00123f3
Figure 4. Average MsE curves of HRV in women (solid lines) and men (dashed lines) for the SAHS-positive and SAHS-negative groups. Black asterisks over SAHS-positive curves mark statistical significant differences (Mann-Whitney U test) with the corresponding SAHS-negatives (p-value < 0.01). Grey asterisks mark p-values in the range 0.01–0.05.
Entropy 17 00123f4
Table 1. Demographic and clinical data from the subjects under study.
Women
Men
SAHS-NegativeSAHS-PositiveSAHS-NegativeSAHS-Positive
#Subjects28264193
Age (years)49.2 ± 8.658.3 ± 14.346.0 ± 13.151.1 ± 11.7
BMI (kg/m2)26.8 ± 6.928.8 ± 5.828.8 ± 5.629.2 ± 2.9
AHI (e/h)3.3 ± 2.332.8 ± 24.74.1 ± 2.533.0 ± 22.5
Table 2. Spectral entropy features from VLF, LF, HF, and VLF-HF bands for women and men (mean ± standard deviation). P-values obtained from the Mann-Whitney U test.
Women
Men
SAHS-NegativeSAHS-Positivep-valueSAHS-NegativeSAHS-Positivep-value
SEVLF0.959 ± 0.0200.971 ± 0.011<0.010.958 ± 0.0200.966 ± 0.018<0.01
SELF0.984 ± 0.0110.959 ± 0.028<10−40.983 ± 0.0120.960 ± 0.035<10−4
SEHF0.979 ± 0.0210.970 ± 0.0220.1580.983 ± 0.0150.976 ± 0.0230.219
SEVLF-HF0.899 ± 0.0600.863 ± 0.051<0.050.900 ± 0.0530.873 ± 0.061<0.05
Table 3. Features automatically selected by the FSBE algorithm for women, men, and the whole set of subjects. Common features for the three cases are in bold.
Number of FeaturesFeatures Selected
Women5SEVLF, SELF, SampEn1, SampEn2, and SampEn7
Men12SEVLF, SELF, SEVLF-HF, SampEn2, SampEn10, SampEn13, SampEn16, SampEn17, and SampEn20- SampEn23
All15SEVLF, SELF, SEVLF-HF, SampEn2, SampEn7, SampEn9, SampEn11, SampEn13, SampEn14, SampEn17, and SampEn19- SampEn23
Table 4. Diagnostic ability of the three LR models trained with the optimal features from women (LRFSBE-W), men (LRFSBE-M), and all subjects (LRFSBE-All). Results were computed through a loo-cv procedure.
Se(%)Sp(%)Acc(%)PPV(%)NPV(%)LR+LR−AROC
LRFSBE-W80.889.385.287.583.37.60.2150.951
LRFSBE-M87.156.177.681.865.71.980.2300.895
LRFSBE-All79.859.472.377.263.11.970.3400.885
Table 5. Differences in the conventional spectral features of women and men (mean ± standard deviation). PVLF: spectral power in the VLF band. PLF: spectral power in the LF band. PHF: spectral power in the HF band. PLF/HF: PLF/PHF ratio.
Women
Men
SAHS-NegativeSAHS-Positivep-ValueSAHS-NegativeSAHS-Positivep-Value
PVLF0.425 ± 0.1530.489 ± 0.1700.0760.437 ± 0.1670.503 ± 0.168<0.05
PLF0.236 ± 0.0520.241 ± 0.0680.8970.250 ± 0.0510.250 ± 0.0680.640
PHF0.234 ± 0.0870.199 ± 0.1180.0580.228 ± 0.1020.183 ± 0.108<0.01
PLF/HF1.164 ± 0.5141.639 ± 1.0650.1301.407 ± 0.8741.898 ± 1.247<0.05
Table 6. Comparison with previous works focused on automatic classification of SAHS. MLP: multi-layer perceptron artificial neural network, LDA: linear discriminant analysis, QDA: quadratic discriminant analysis, KNN: K-nearest neighbours, LR: logistic regression, SVM: support vector machine, Loo: leave one out.
StudySignal#SubjectsClassifier#FeaturesValidationAHI ThresholdSe (%)Sp (%)Acc (%)AROC
Roche et al. 2003 [56]HRV147Tree8k-fold1064.2+75.6+69.3+
Marcos et al. 2008 [49]SpO2187MLP3Hold-out1089.879.485.50.900
Marcos et al. 2009 [50]SpO2187LDA
QDA
KNN
LR
6
6
6
6
Hold-out
Hold-out
Hold-out
Hold-out
10
10
10
10
86.6
91.1
88.1
85.1
80.4
78.3
84.8
87.0
84.1
85.8
86.7
85.8
0.925
0.913
0.822
0.930
Caseiro et al. 2010 [53]Airflow41Threshold1581.095.087.8+0.877
Álvarez et al. 2010 [51]SpO2148LR4Loo1092.085.489.70.967
Fiz et al. 2010 [54]Snoring37LR9
5
15
87.0
80.0
71.4
90.9
81.1+
86.5+
0.850
0.920
Karunajeewa et al. 2011 [55]Snoring41LR11Loo1089.392.390.2+0.967
Al-Angari et al. 2012 [52]
SpO2
Respiratory effort
HRV
100SVM2
5
5


5
5
5
91.8
85.7
79.6
98.0
92.2
78.4
95.0
89.0
79.0


Gutiérrez-Tobal et al. 2012 [46]Airflow148LR3Loo1088.070.882.40.903
Ravelo-Garcia et al. 2014 [57]HRV97LR5k-fold1088.782.986.6+0.941
This study (LRFSBE-W)HRV54LR5Loo1080.889.385.20.951
This study (LRFSBE-M)HRV134LR13Loo1087.156.177.60.895
This study (LRFSBE-All)HRV188LR15Loo1079.859.472.30.885
+Computed from reported data.

