1. Introduction
Atrial fibrillation (AF) is the most commonly clinically-encountered arrhythmia. For paroxysmal AF, on the one hand, a focal trigger inside the pulmonary veins (PV) has been shown to be the dominant mechanism for its initiation [
1]. The technique of isolating PV by catheter ablation has therefore been established [
2]. On the other hand, persistent AF is more related to the maintenance of the mechanisms rather than to the trigger [
3,
4,
5]. It can be shown that the AF substrate of patients with persistent AF has a shorter cycle length and a higher degree of disorganized activity than that of patients with paroxysmal AF [
6]. Nademanee [
7] was the first to propose these areas with high frequency disorganized activity as ablation target sites and was able to achieve a respectable success rate. However, these results could not be reproduced by any other group, even in a combined approach of antral PV isolation and complex fractionated atrial electrogram (CFAE) ablation [
8]. Still, there are several limitations in CFAE ablation. First, the interpretation of CFAE varies due to the absence of objective detection algorithms. Second, the role of CFAE in the initiation and continuation of persistent AF is still unclear. In addition, the genesis of CFAE may be affected by anatomical conditions or by other temporary effects. Algorithms to identify the dominant frequency and the mean cycle length of the local activity (CFEmean, St. Jude Medical, Minneapolis, MN, USA) have been developed in order to improve the categorization of the AF substrate.
The process for identifying these sites has been studied in recent years, and several methods, measures and approaches have been described. Nevertheless, they do not satisfy the sensitivity and specificity requirements. Kumagai [
9] described different patterns of activation, and others have shown and quantified different characteristics of atrial electrograms (A-EGM) in both the time and frequency domains [
10,
11,
12,
13]. Some of the cited algorithms are implemented into commercially available mapping systems, so they can be used for daily AF ablation routines. However, their performance is not optimal, and they often require initial parameter manual setting. This manual configuration makes them user dependent and, thus, subjective. To overcome this problem, several new approaches and methodologies have been developed so as to measure and quantify the complexity of A-EGM. Kremen
et al. [
14] introduced a novel methodology based on several A-EGM measures extracted from the raw A-EGM signal. Combining the information provided by these measures, it enabled a better and robust enough classification, which was not possible with the use of one single A-EGM measure. Ciaccio
et al. [
15] used extrinsic and intrinsic features of the A-EGM shape to characterize the level of fractionation in CFAE sequences. Lin
et al. [
16] showed that a linear analysis (mean fractionation interval and dominant frequency) and a nonlinear-based waveform similarity analysis of the local A-EGM could determine the area in which CFAE sites, which are important for AF maintenance, are localized.
According to the latest studies, the level of fractionation has been shown to be promisingly well estimated by the use of complexity measures. Ng
et al. [
17] showed that Shannon entropy (ShEn) can be used to quantify the complexity of A-EGM and therefore provides an objective and automated method for the identification of CFAE sites that are indicated for AF ablation. Ganesan
et al. [
18] introduced ShEn as a tool that could assist the mapping of the AF rotor. Jacquemet
et al. showed that micro-scale obstacles cause significant changes to electrogram waveforms and that conduction velocity, electrogram amplitude and also the degree of fractionation can be used to discriminate the nature of the substrate and the characteristics of fibrosis, giving rise to slower conduction [
19]. Many previous works, e.g., [
19,
20] suspect that when the changes in the substrate become more acute, the A-EGMs become more irregular and, thus, more complex, and for this reason, it can be analyzed in terms of complexity. We suspect that SampEn is expected to be increased when the AF substrate is changing or if AF is triggered or sustained at a site under the measurement catheter. In order to evaluate the changes in the substrate, we introduced artificial individual classes of A-EGM fractionation for the purposes of this study. Current expert opinion is that CFAE can be either substrate based or caused by temporary effects (changes in cell repolarization time).
To the best of our knowledge, a direct relationship between the subjective perception of A-EGM fractionation and quantification in a continuous or semi-continuous scale has never been performed. Additionally, the data used for the analysis in these studies are often given and classified by a single source, even though the evaluation is performed by more than one independent physician (clinician or the same working group).
In this work, we propose the use of sample entropy (SampEn) for the quantification of the CFAE fractionation degree in two different A-EGM databases. The A-EGM recorded in the Czech Republic (CZ database) have been classified by at least three different clinicians, while the A-EGM database recorded in Germany (GE database) was classified by two clinicians. SampEn has been chosen because it is a well-characterized complexity measure with robust performance in other cardiac applications, e.g., in beat to beat (RR) intervals, heart rate variability (HRV) signals and ECG signals [
21,
22,
23,
24], and it is one of the few complexity measures that can deal with the analysis and complexity of CFAEs.
Moreover, SampEn can be used not only to segment the main CFAE, but also to quantify the substrate changes in a continuous way by discerning among four different classes of CFAE fractionation levels. The analysis described is based only on A-EGM records instead of surface ECGs [
25,
26,
27,
28].
2. Materials and Methods
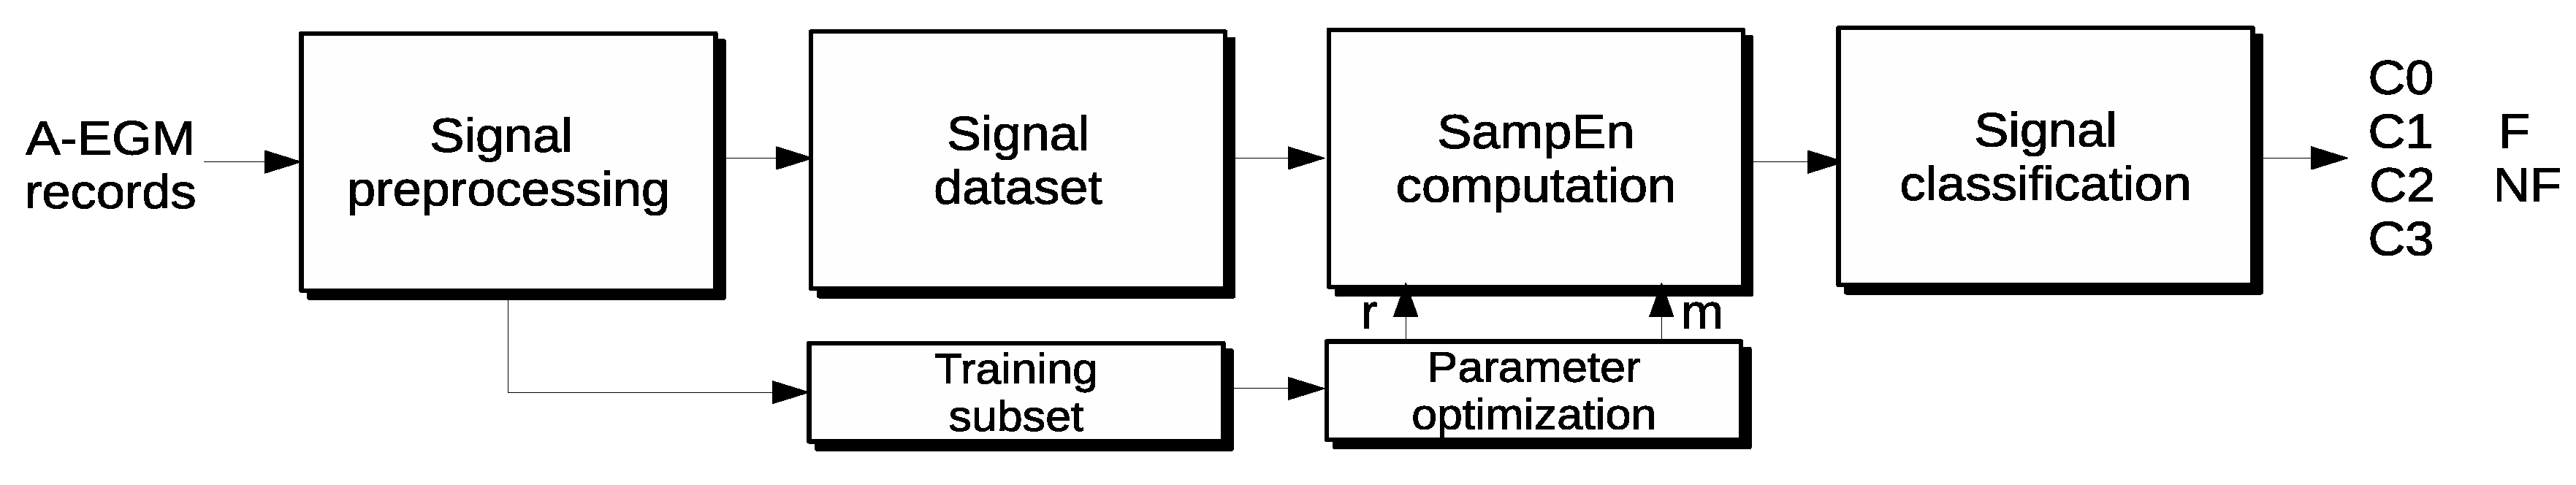
The core of the method proposed is the computation of the SampEn metric for A-EGM records. To improve the standard SampEn results, a novel parameter optimization stage is included. This new step calculates the results for a range of m and r values in order to find the best combination. The optimization is performed in terms of maximal segmentation between the main CFAE classes and minimum SampEn variability in a database training subset. Specifically, a K-fold bootstrap algorithm for variability reduction over the ROC area (AUC) curves is used so as to find the optimal parameter set. Then, the best parameter combination obtained can be used for SampEn computation over the entire input database to obtain the final classification.
A statistical test was used to assess the accuracy of the partition. A Mann–Whitney test and ROC computation as a function of sensitivity and specificity were used to evaluate the segmentation capabilities of the method proposed. The classification goal was to discern among the main A-EGM record types and also between individual levels of fractionation. The general scheme of the method proposed is shown in
Figure 1, and a more detailed description of each stage is developed in the following subsections, including the validation experimental database.
Figure 1.
Block diagram of the new methodology proposed, from the raw atrial electrograms (A-EGM) input signal preprocessing stage, up to the classification results.
Figure 1.
Block diagram of the new methodology proposed, from the raw atrial electrograms (A-EGM) input signal preprocessing stage, up to the classification results.
2.1. Sample Entropy
Sample entropy (SampEn) was introduced to counteract the well-known Approximate entropy (ApEn) weaknesses [
29]. SampEn is less sensitive to data series length and input parameters; it does not compute self-matches and yields better relative consistency. SampEn was defined as the negative natural logarithm for conditional properties that a series of data points of length
m would repeat at
.
Given a time series
of length
N, sequences of
m-length vectors are formed and compared. Two of these vectors
commencing at
and of length
m are considered alike if the distance between them
is below a threshold
r. Then, the matching ratios
A and
B can be computed as:
Specifically, the dissimilarity measure used for SampEn metrics can then be defined as:
Finally, SampEn is computed as the negative natural logarithm of the conditional probabilities defined in Equations (
1) and (
3):
SampEn m and r Parameter Optimization
SampEn parameters
m and
r configure how matches are addressed. The accuracy and the confidence of the SampEn estimates depend on the number of matches. It can be increased by choosing small
m or large
r values, but since entropy is defined under the assumptions
and
, choosing extreme values can lead to incorrect results. A large
r value can yield a SampEn estimate smaller than it should be. Choosing a small
m value can hide physical processes that are relevant at larger scales [
24].
The parameter optimization method proposed searches for the best
m and
r configuration in the vicinity of usual values (
or
). The
m parameter initially spans from 1–10. The
r parameter ranges from 0.1–0.7 in 0.05 steps. SampEn values are computed for each possible resulting combination. Using a labeled training subset, ROC curves are respectively computed for each combination between classes of interest (C0 ∪ C1
vs. C2 ∪ C3 in this case). To further improve the robustness of the results, a
K-fold bootstrap stage is included, with
K=10. The optimal pair of parameters is chosen to be the pair that additionally satisfies maximum area under the curve (AUC), which can be interpreted as the probability that a randomly-chosen CFAE is correctly classified as fractionated or non-fractionated A-EGM and minimum mean variability at most of the different
K folds. The optimal combination is searched according to the selection criteria value (SCV) described in (
7). Analytically, the parameters are obtained from the following expression:
the SampEn value being computed according to (
6) for signal
q in fold
s. In this way, the variability of the measure for each group is minimized, whereas AUC is maximized.
2.2. Validation
The proposed algorithm was validated following the steps described for SampEn and ROC computation. The specificity and sensitivity values for the optimal pair of parameters were obtained from records of the experimental databases. Segmentation capabilities were assessed using a Mann–Whitney U-test, the corresponding sensitivity and specificity ROC parameters and the area under ROC (AUC). This optimal parameter set was then validated using the rest of the records from the experimental database not used for training.
In addition, the results obtained were also compared to those yielded by the standard methodology, complex fractionated (CFE) mean [
30], which is a standard mapping procedure. The CFEmean algorithm (St. Jude Medical) measures the mean cycle length during atrial fibrillation. The baseline signal noise level is usually set between 0.02 and 0.04 mV in order to avoid noise detection. Each
is detected with a deflection width of 10 ms after a refractory period of 30–50 ms. The mean cycle length (CL) of a 5-s electrogram is calculated and displayed color-coded on the left atrium (LA) anatomical shell [
31]. According to previous studies [
2,
31], regions with mean
ms can be defined as CFAEs.
2.3. Experimental Dataset
Two different A-EGM databases recorded at two independent cardiology departments in two different EU countries were used separately. These databases were also combined to form a mixed third database. Each database contains at least four classes of CFAE, each class representing a different fractionation level. Signals in both databases were preselected manually by skilled electrophysiologists (EP) to select high quality CFAE signals with no ventricular far field influence, no artifacts caused by obvious catheter movements and visually-detectable presence of signal noise [
14,
32]. These classes can also be roughly separated at a higher conceptual level into two main classes, non-fractionated (NF) A-EGM and fractionated (F) A-EGMs. Recordings with a strong far field were excluded before annotation because they were out of the scope of the study.
The first database was recorded and independently annotated by three different EP that perform radio frequency ablation (RFA) of AF on a regular basis in the Czech Republic [
14]. The second one was recorded and annotated by two different EP working at a German unit [
32]. Both databases were post-processed with the same algorithms for baseline wander and high frequency noise removal. They were also resampled to an equal sampling frequency (
). Epochs of 1500 ms were analyzed in order to keep consistency on the parameters that can influence SampEn computation [
24,
29,
33].
There are different types of A-EGM during AF, as described in [
34]. The signals in both databases were classified into four levels of fractionation [
35]. On the one hand, fractionated signals were classified by experts into three levels of fractionation (C1, C2 and C3). On the other hand, non-fractionated A-EGM signals were considered as Level 0 (C0). Classes C0 and C1 were assumed not to trigger or maintain AF, as EP would consider C0 and C1 as sites not recommended for RFA. They were termed as non-fractionated (NF). Signals in C2 and C3 could indicate sites of substrate changes that could either trigger or sustain AF. This characterization is similar to those described in other works, such as [
14,
32]. These four classes were introduced to enable objective quantification for the study purpose and are summarized as follows:
C0: Non-fractionated A-EGM.
C1: Fractionated A-EGM with periodic activity.
C2: A mixture of periodic fractionated and periodic non-fractionated A-EGM.
C3: High frequency A-EGM with continuous activity. No regular activation can be seen.
2.3.1. German Database
The German (GE) A-EGM database contains signals from 11 patients who suffered from AF. Eight patients suffered from persistent AF and three patients from paroxysmal AF. All patients were indicated for catheter ablation. Intracardiac A-EGM recordings from a multipolar circular catheter, such as Lasso (10 polar, Biosense Webster, Diamond Bar, USA), Optima (14 polar, St. Jude Medical, St. Paul, USA) or Orbiter (14 polar, Bard Electrophysiology, Lowell, USA), were performed after PV isolation.
This database consists of 429 signals. Each signal has a duration of 5 s (only the first 1500 ms were used for consistency with the other database) and was recorded at a sampling rate of 1.2 KHz. The data were filtered by the allurement system with a band pass filtering at [30, 250] Hz, and the remaining baseline wander and high noise were reduced by wavelet decomposition.
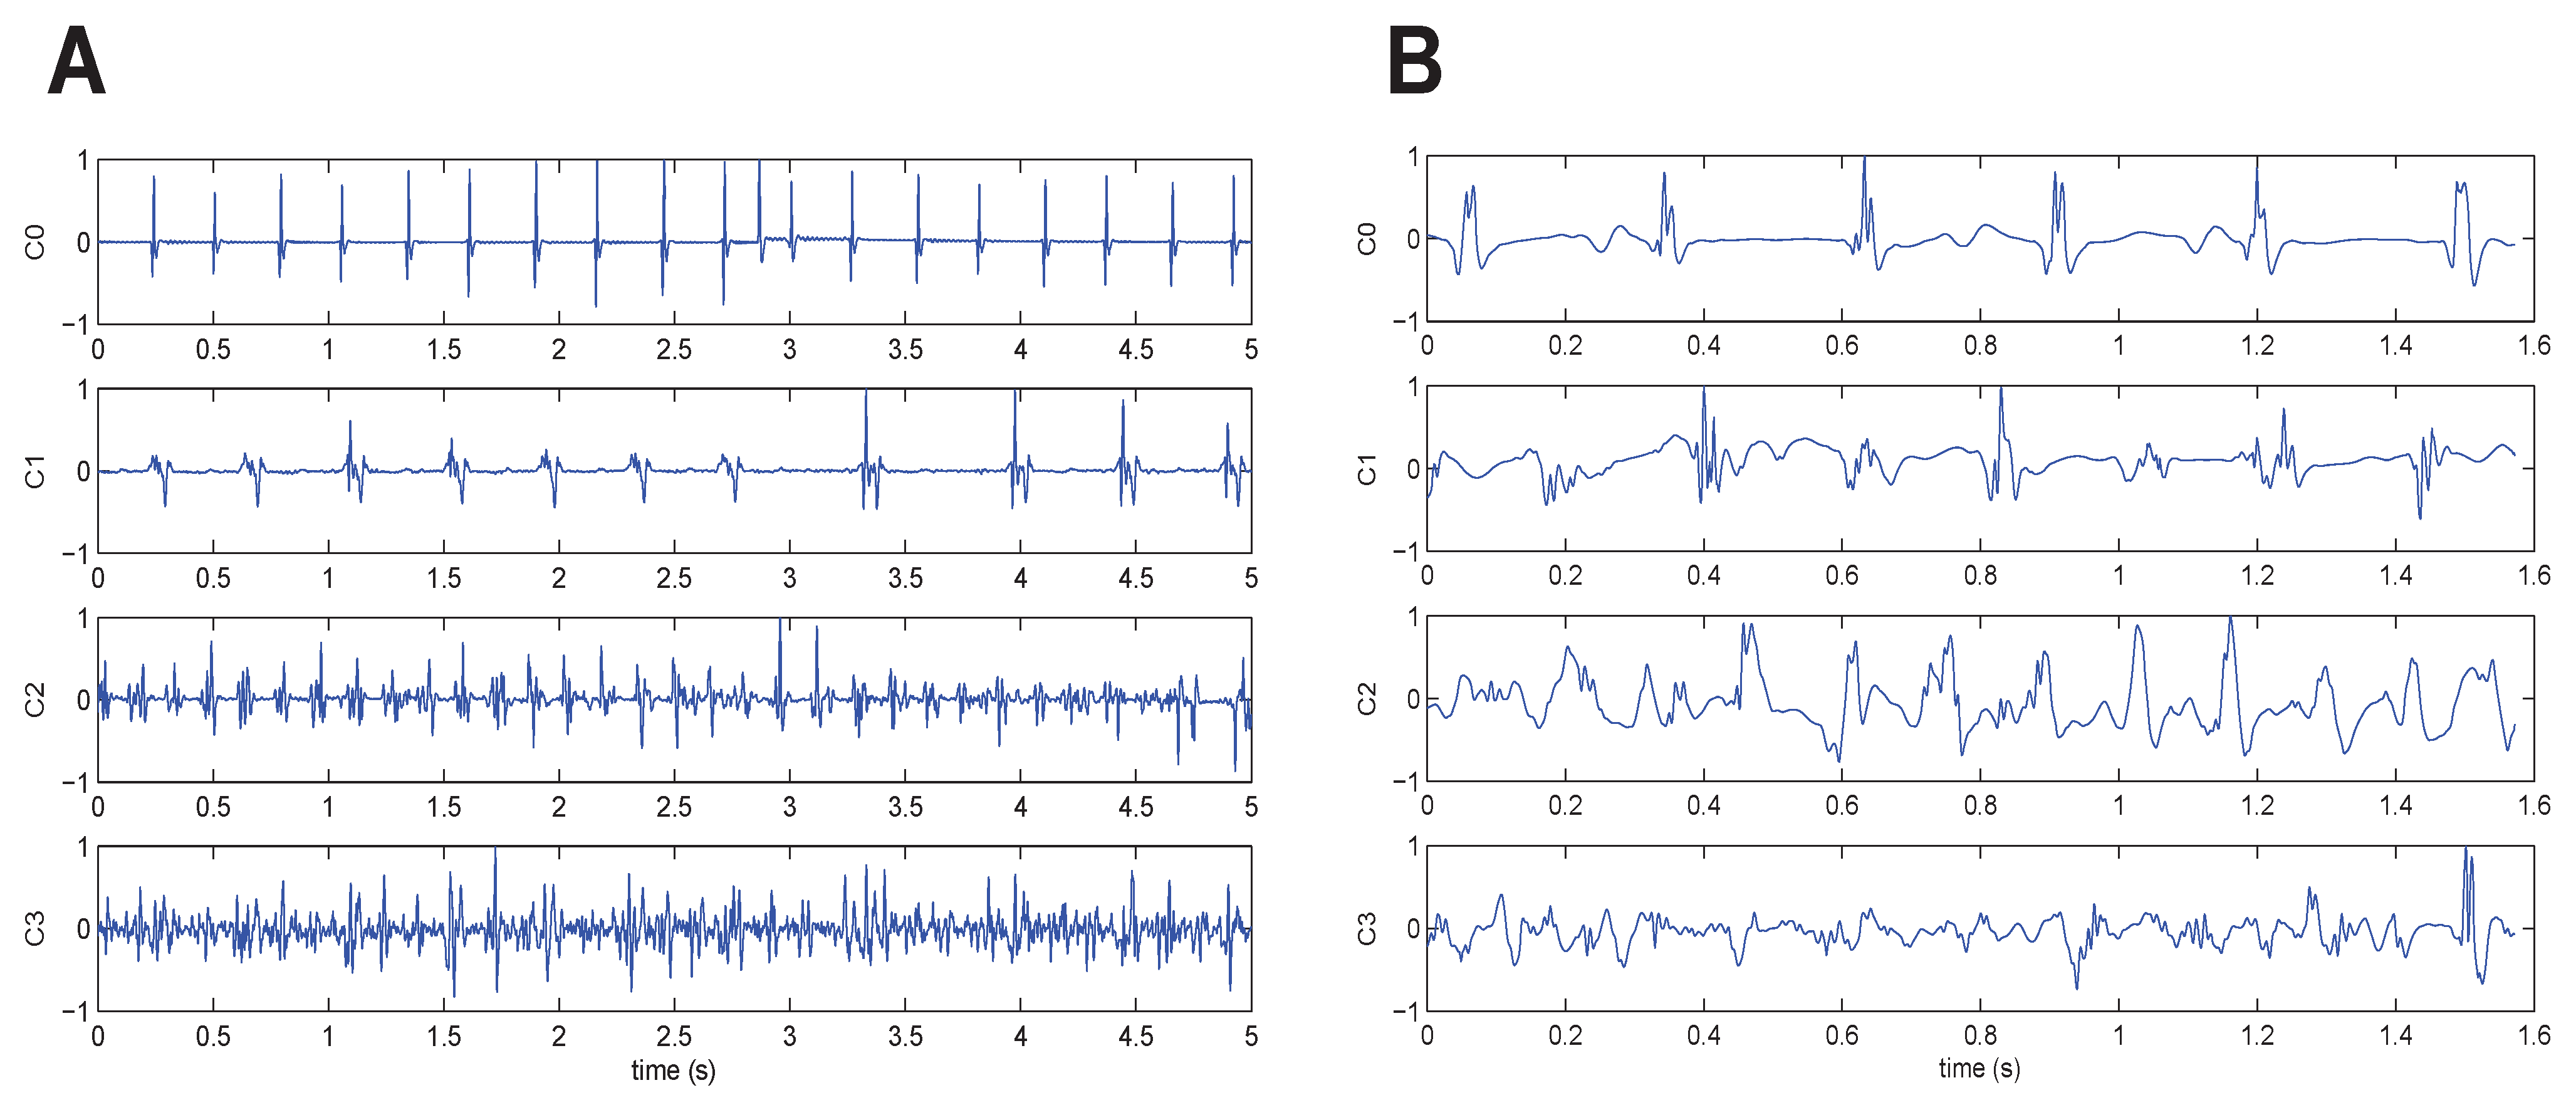
The 429 signals were divided into the four classes as follows: 153 C0 signals, 75 C1 signals, 148 C2 signals and 53 C3 signals. The inter-observer agreement was 100%, because only records with such an agreement level were included in the dataset. An example of one signal belonging to each class is given in
Figure 2A.
Figure 2.
One signal from each fractionation level, ranging from C0 (top) to C3 (bottom). Original raw signals after baseline wander removal. (A) German (GE) database and (B) Czech (CZ) database.
Figure 2.
One signal from each fractionation level, ranging from C0 (top) to C3 (bottom). Original raw signals after baseline wander removal. (A) German (GE) database and (B) Czech (CZ) database.
2.3.2. Czech Database
The Czech database (CZ) consists of 113 A-EGM, preselected by experts from a larger database of A-EGM from the Czech Republic. This database was recorded during AF mapping procedures performed on patients that were indicated for RFA of AF [
14].
The signals were recorded by CardioLab7000, Prucka Inc. during AF procedures at a sampling rate of 997 Hz and resampled to 1 KHz. Each preselected A-EGM signal in this dataset has a duration of 1500 ms.
The EP expert signal selection was driven by the goal to get a good signal-to-noise ratio for later evaluation of the degree of A-EGM fractionation by an expert.
The 113 signals were divided into the four classes as follows: 22 C0 signals, 42 C1 signals, 36 C2 signals and 13 C3 signals. The inter-observer agreement of ranking to classes was higher than 90% for Classes C0, C2 and C3 and 79% for Class C1. An example of one signal belonging to each class is given in
Figure 2B.
2.3.3. Mixed Database
A mixed database (termed BT) was created for training purposes in the SampEn parameter optimization process. This database contains 75% of the signals in each class from the CZ database (as it has the lowest number of signals per class) and the same number of signals from each class of the GE database, so as to provide a weighted database. The BT database was made up of 158 signals. Class C0 contained 30 signals, C1 contained 64 signals, C2 contained 54 signals and C3 contained 20 signals.
3. Experiments and Results
The method proposed was applied to the experimental dataset described in
Section 2.3.3. First, a labeled training subset was randomly chosen for SampEn parameter optimization. The resulting
values were estimated in terms of the best segmentation obtained between non-fractionated (C0 ∪ C1) and fractionated (C2 ∪ C3) A-EGM groups and minimum SampEn variability.
Table 1 shows the
values corresponding to the maximum SCV at each fold. For most of the folds, 88% of the AUC was achieved when
and
. Only three folds (
K = 2, 6, 8) do not correspond to these parameter values. In any case, the results are very robust, since the minimum performance achieved was an AUC of at least 89%, 81% specificity and 75% sensitivity.
Table 1.
Selection criteria value (SCV), AUC and sample entropy (SampEn) parameters obtained for the training subset using the optimization scheme described. Sensitivity (Se) and specificity (Sp) values are shown for the corresponding parameters in each row. The K-fold column refers to each of the folds considered from 1–10.
| K-fold | SCV | AUC (%) | m | r | Sp (%) | Se (%) |
|---|
| 1 | 1.278 | 88.6 | 4 | 0.65 | 85.1 | 76.4 |
| 2 | 1.299 | 90.9 | 8 | 0.65 | 80.6 | 78.7 |
| 3 | 1.331 | 89.2 | 4 | 0.65 | 88.1 | 76.4 |
| 4 | 1.380 | 90.9 | 4 | 0.65 | 91.0 | 77.5 |
| 5 | 1.195 | 89.1 | 4 | 0.65 | 86.6 | 78.7 |
| 6 | 1.161 | 91.2 | 8 | 0.65 | 88.1 | 76.4 |
| 7 | 1.140 | 88.3 | 4 | 0.65 | 88.1 | 75.3 |
| 8 | 1.266 | 84.7 | 2 | 0.65 | 89.6 | 77.5 |
| 9 | 1.238 | 90.0 | 4 | 0.65 | 83.6 | 79.8 |
| 10 | 1.295 | 88.5 | 4 | 0.65 | 85.7 | 77.8 |
The segmentation capabilities of the method proposed were then assessed using these
parameters over the entire remaining dataset (the one containing all CZ and GE signals not used for training). The statistical test applied was a Mann–Whitney test. Non-Fractionated A-EGM (NF) included C0 and C1 levels, whereas fractionated (F) A-EGM corresponded to C3 and C4 levels. The results of this step are shown in
Table 2. This table enlists results about the F and NF classes, such as mean, median, standard deviation (SD) and 95% confidence intervals (CI). It can be seen that mean/median values of each group at each database are located far away and none of their CI overlap. The Mann–Whitney statistical test provided a significance level lower than 0.001 for each comparison.
Table 2.
SampEn statistics for the fractionated/non-fractionated (F/NF) A-EGM for . DB stands for database. Results are summarized using mean and median SampEn values, standard deviation (SD), confidence intervals (CI), AUC, sensitivity (Se), specificity (Sp) and the p-value of the Mann–Whitney statistical test.
| DB | class | mean | median | SD | 95% CI | AUC (%) | Se (%) | Sp (%) | p |
|---|
| BT | NF | 0.054 | 0.049 | 0.003 | [0.047,0.061] | 89.3 | 86.9 | 77.5 | 0.001 |
| | F | 0.115 | 0.108 | 0.005 | [0.105,0.125] | 89.3 | 86.9 | 77.5 | 0.001 |
| CZ | NF | 0.050 | 0.050 | 0.003 | [0.044,0.055] | 88.7 | 79.5 | 89.1 | 0.001 |
| | F | 0.090 | 0.086 | 0.003 | [0.083,0.097] | 88.7 | 79.5 | 89.1 | 0.001 |
| GE | NF | 0.043 | 0.023 | 0.003 | [0.038,0.048] | 93.4 | 94.5 | 82.9 | 0.001 |
| | F | 0.137 | 0.134 | 0.003 | [0.130,0.143] | 93.4 | 94.5 | 82.9 | 0.001 |
A number of different training subsets were used for comparative purposes. Although the optimal
m and
r values obtained were not equal, the segmentation capability of the SampEn remained unchanged. Two examples of these results are shown in
Table 3.
Table 3.
SampEn statistics for the F/NF A-EGM for individual parameters optimized individually on the CZ and GE databases. DB stands for database and params for parameters . Results are summarized using mean and median values, standard deviation (SD), confidence intervals (CI), area under ROC (AUC), sensitivity (Se), specificity (Sp) and the Mann–Whitney statistical probability (p).
| DB | Class | params | mean | median | SD | 95% CI | AUC (%) | Se (%) | Sp (%) | p |
|---|
| CZ | NF | (5,0.15) | 0.120 | 0.131 | 0.007 | [0.106,0.133] | 90.9 | 82.0 | 79.2 | 0.001 |
| F | | 0.224 | 0.227 | 0.008 | [0.208,0.240] | 90.9 | 82.0 | 79.2 | 0.001 |
| GE | NF | (4,0.15) | 0.202 | 0.162 | 0.011 | [0.180,0.225] | 88.5 | 87.8 | 78.5 | 0.001 |
| F | | 0.452 | 0.454 | 0.008 | [0.437,0.468] | 88.5 | 87.8 | 78.5 | 0.001 |
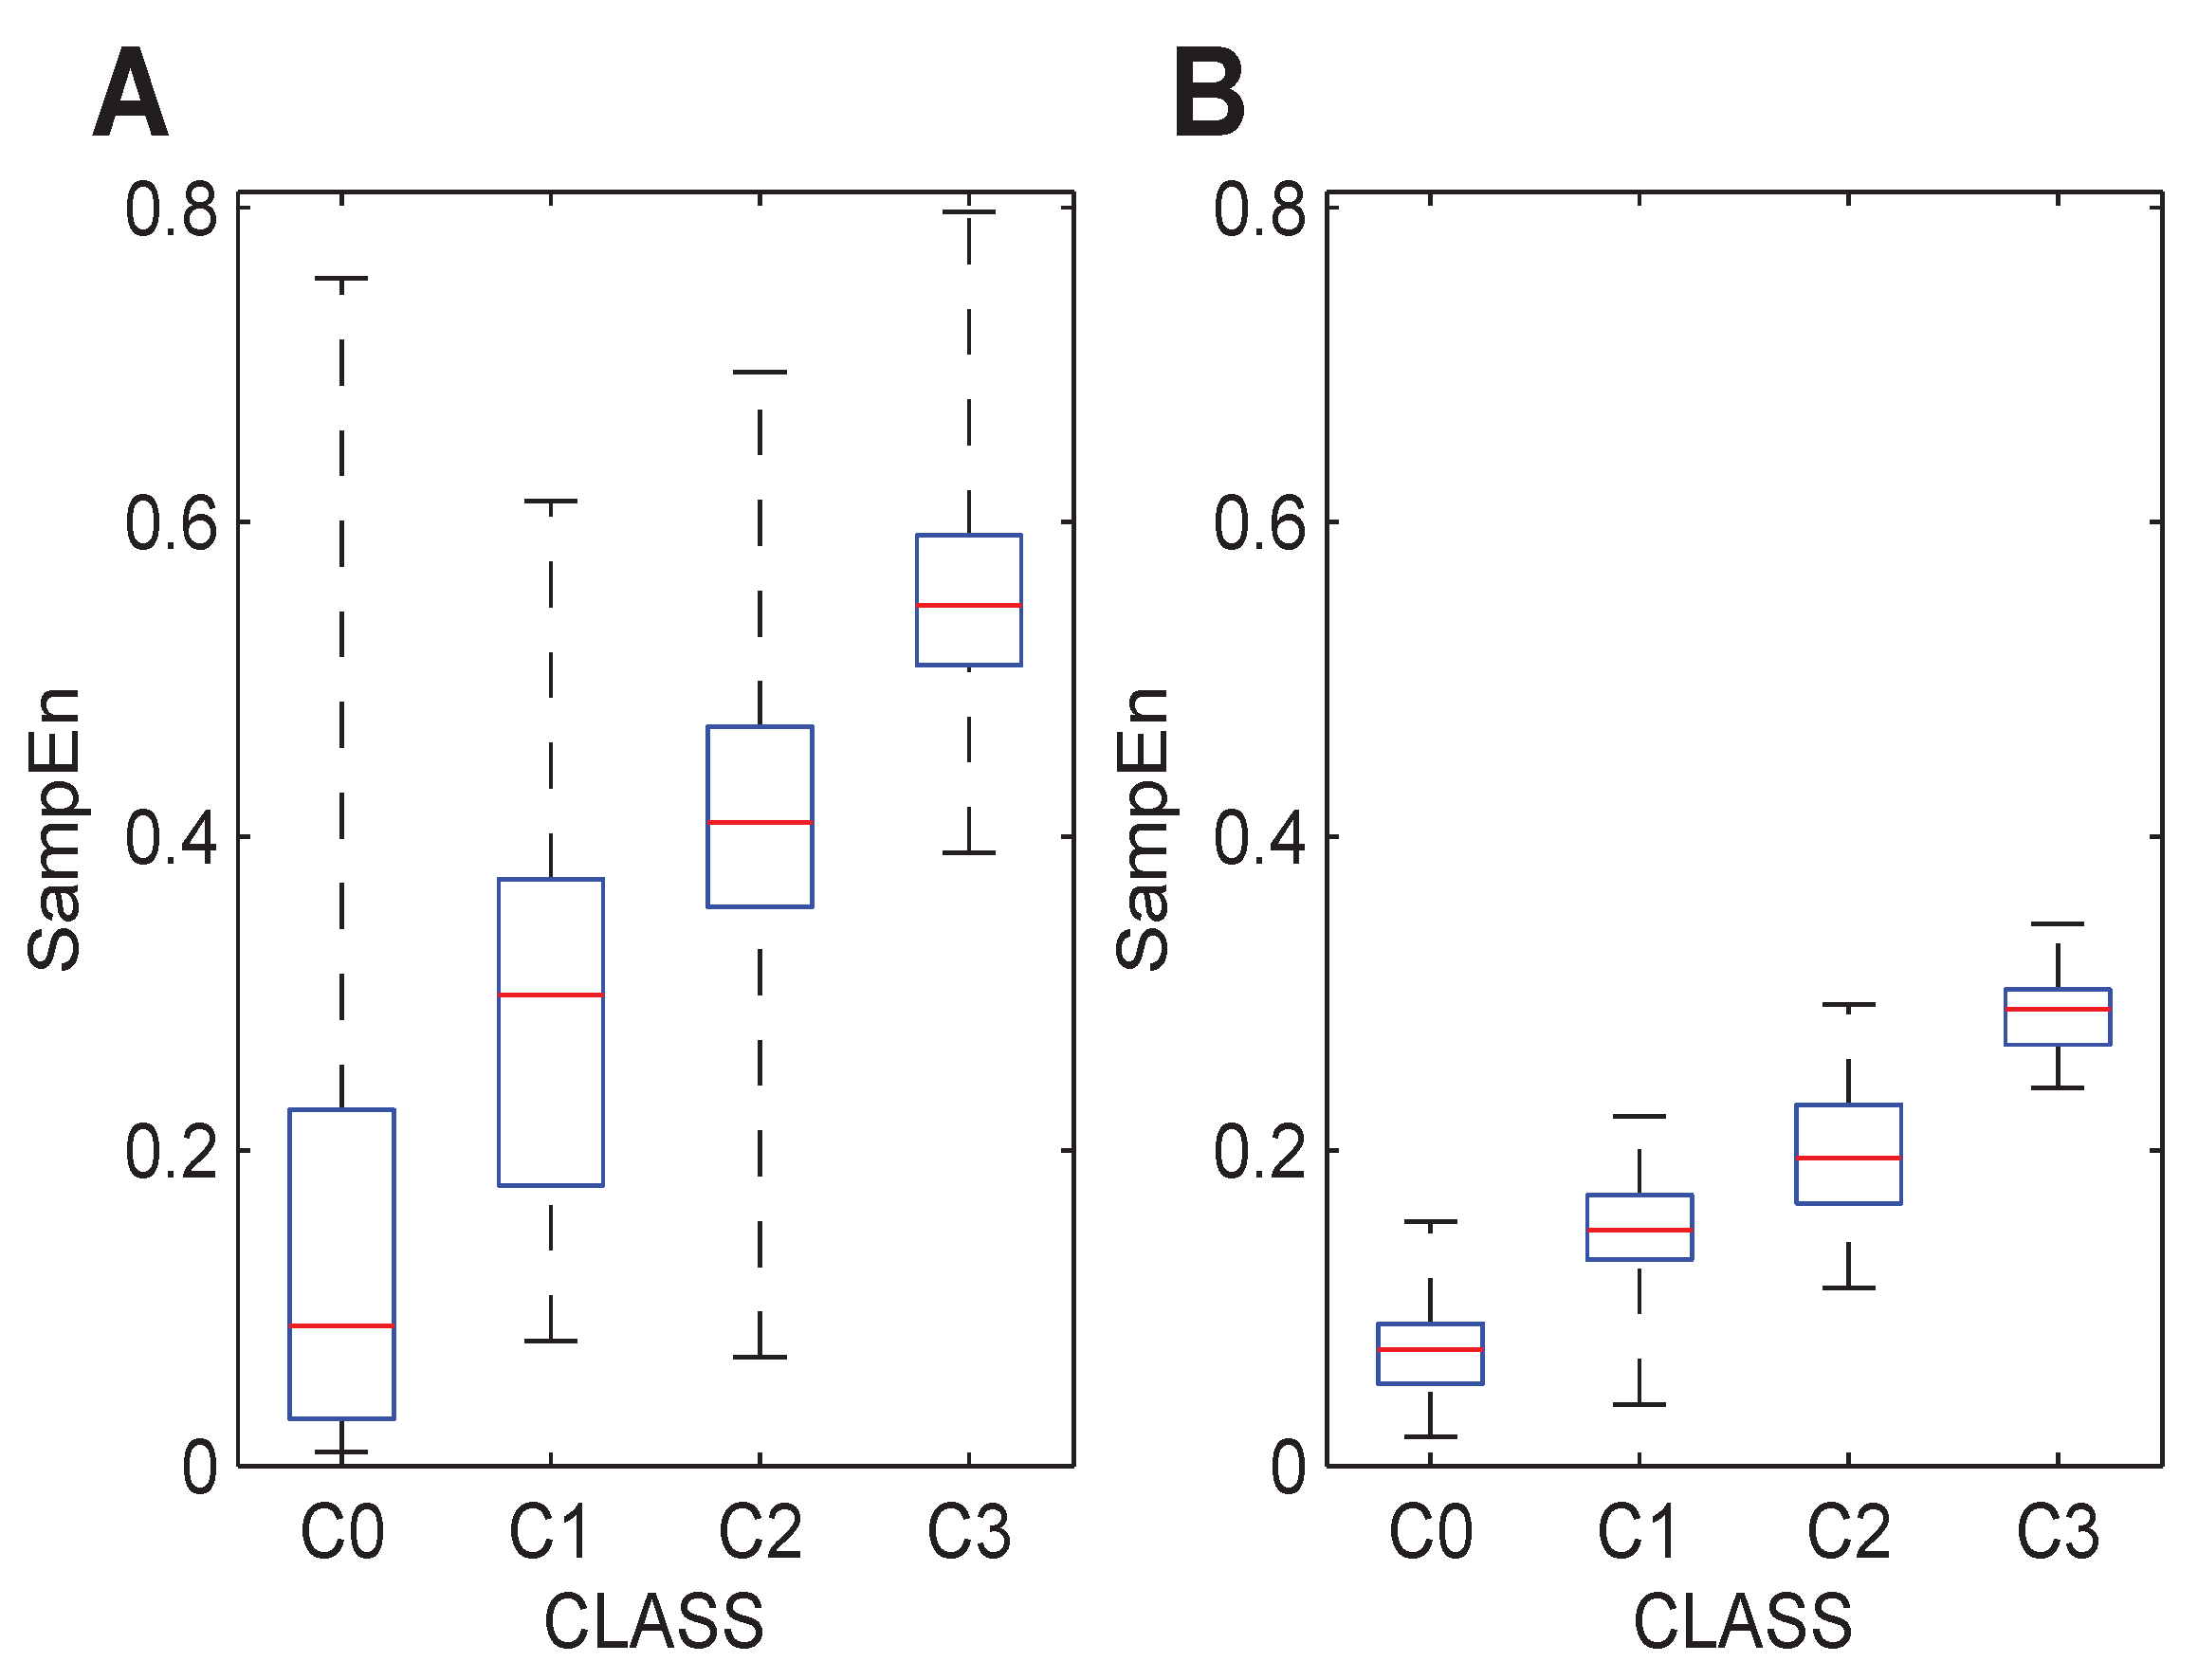
The three databases were analyzed with the initially-optimized parameters, but considering the individual Classes C0, C1, C2 and C3 instead of the global F and NF groups. Graphically,
Figure 3 and
Figure 4 show the results for each database and each class. From these boxplots, it can be stated that the entropy of the signals estimated by the SampEn metric significantly increases. These trends can also be observed with different parameter configurations, as depicted in
Figure 4. This is in agreement with expectations, since manual expert ranking of the A-EGM signals coincides with these results qualitatively. The numerical results corresponding to these figures are shown in
Table 4.
Figure 3.
Boxplot distribution of the SampEn values computed to the initially-optimized parameters for individual levels of fractionation, (4,0.65). (A) The BT database. (B) The GE database. (C) The CZ database.
Figure 3.
Boxplot distribution of the SampEn values computed to the initially-optimized parameters for individual levels of fractionation, (4,0.65). (A) The BT database. (B) The GE database. (C) The CZ database.
Figure 4.
Boxplot distribution of the SampEn values computed with the individual optimized parameters for each of the levels of fractionation present in each database. (A) The GE database (4,0.15). (B) The CZ database (5,0.15).
Figure 4.
Boxplot distribution of the SampEn values computed with the individual optimized parameters for each of the levels of fractionation present in each database. (A) The GE database (4,0.15). (B) The CZ database (5,0.15).
Table 4.
SampEn statistics for individual classes (4,0.65).
Table 4.
SampEn statistics for individual classes (4,0.65).
| DB | Class | mean | median | 95% CI |
|---|
| BT | C0 | 0.032 | 0.021 | [0.020, 0.045] |
| | C1 | 0.065 | 0.061 | [0.058, 0.072] |
| | C2 | 0.102 | 0.097 | [0.093, 0.111] |
| | C3 | 0.149 | 0.138 | [0.127, 0.172] |
| CZ | C0 | 0.029 | 0.028 | [0.024, 0.035] |
| | C1 | 0.061 | 0.058 | [0.055, 0.066] |
| | C2 | 0.082 | 0.083 | [0.075, 0.088] |
| | C3 | 0.113 | 0.114 | [0.100, 0.125] |
| GE | C0 | 0.030 | 0.014 | [0.024, 0.036] |
| | C1 | 0.070 | 0.064 | [0.062, 0.077] |
| | C2 | 0.119 | 0.115 | [0.113, 0.125] |
| | C3 | 0.186 | 0.187 | [0.176, 0.196] |
Finally, the results were compared to those obtained using a standard CFEmean measure.
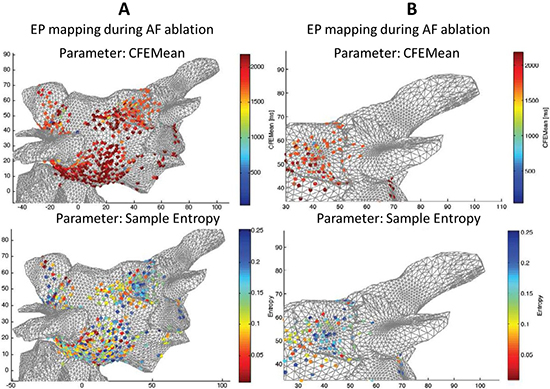
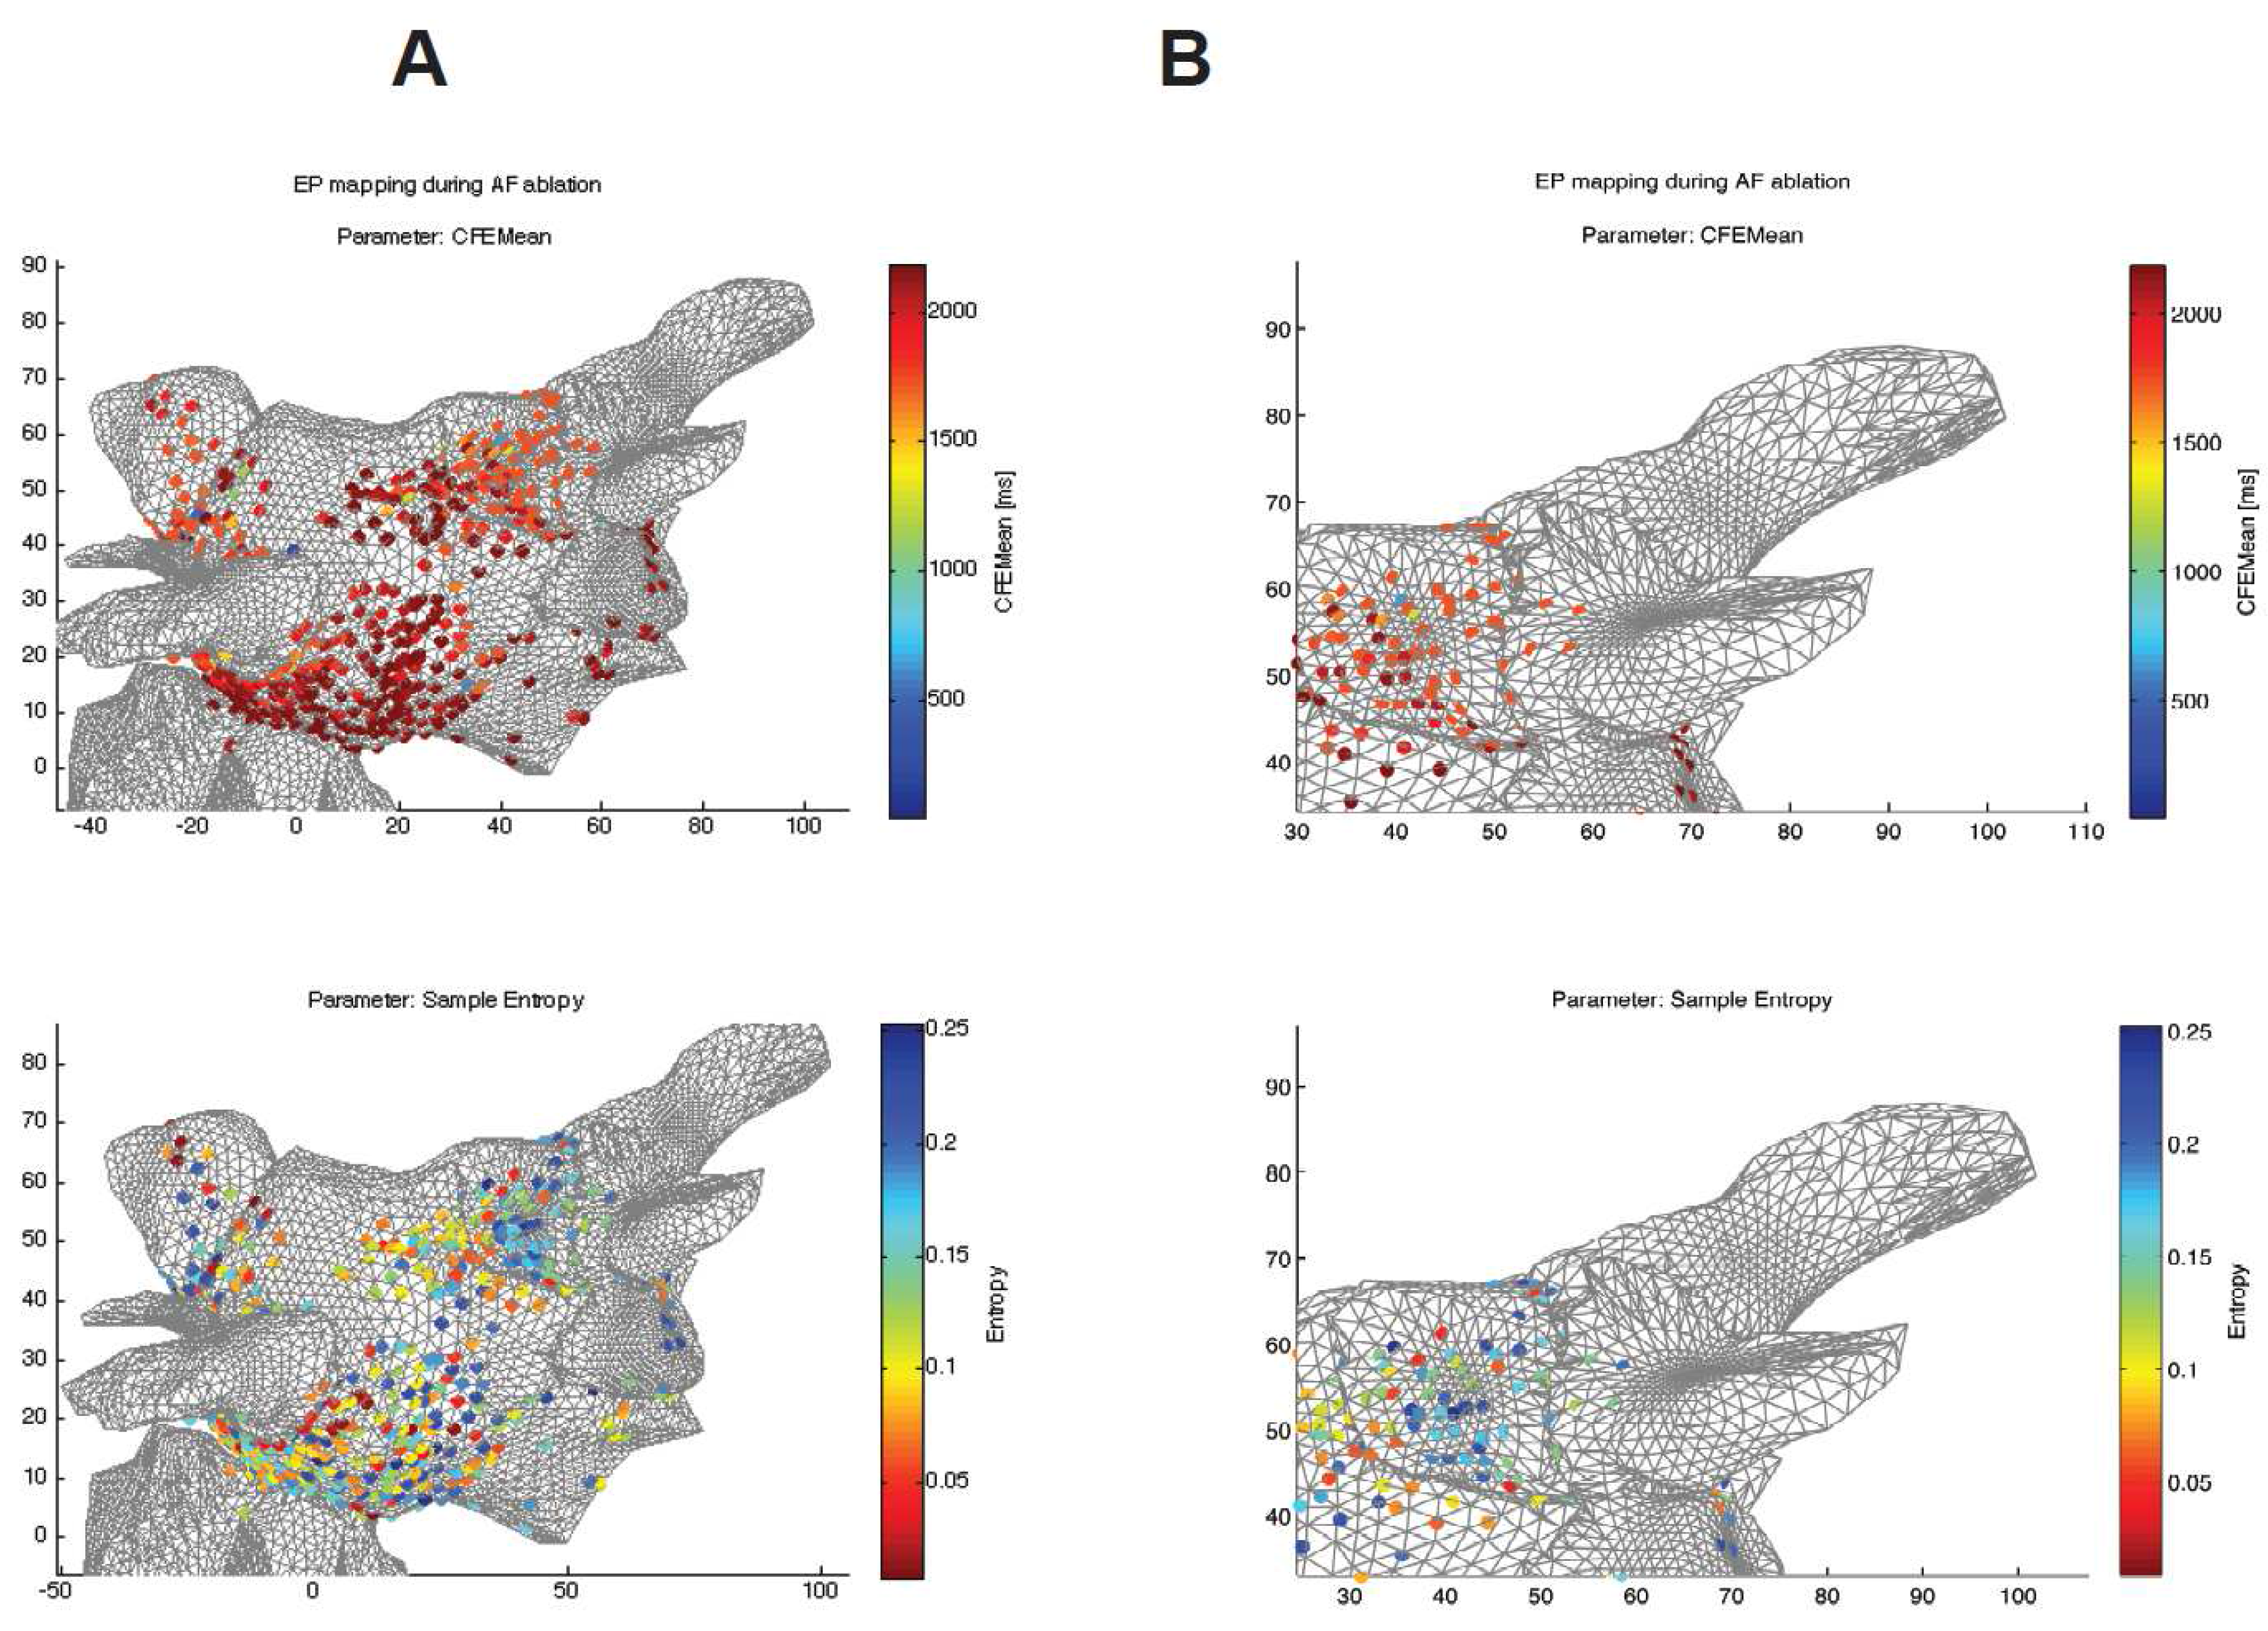
Figure 5 shows topographical atrial maps of a selected patient. It compares two different indices calculated from the raw signals recorded at sites shown in the figure in 3D coordinates.
Figure 5 shows that the SampEn measures reveal broader and more specific areas with a higher level of complexity of CFAEs, whereas the CFEMean indices show single spots with lower complexity around them (see the details of the pulmonary vein in
Figure 5B).
Figure 5.
Comparison between both algorithms used for a specific patient undergoing radio frequency ablation (RFA) of atrial fibrillation (AF). SampEn with optimized parameters () (bottom) and CFEMean (St. Jude Medical) measurements mapped on a 3D model of heart tissue. The blue color in both measures reveals areas with a higher level of complexity of complex fractionated atrial electrograms (CFAEs). (A) 3D atrial topographical map, whole mapped area, frontal view. (B) A detail of the area around the pulmonary vein.
4. Discussion
The results obtained confirm the goodness of the SampEn-based method to segment classes in A-EGM records. With the parameters computed from a small training subset, it is possible to distinguish between F and NF groups and even among C0, C1, C2 and C3 classes. In addition, the specific parameter configuration is not very important, since different values yield almost identical performance. This fact also confirms the robustness of the approach.
The findings are in consonance with the work of Ng [
17], where CFAEs were found to have higher entropy than non-CFAEs. This work deals with the complete A-EGM signal, while [
17] uses fractional intervals computed over the A-EGM signal and also uses Shannon entropy rather than SampEn entropy. It can be seen that different complexity measures working over different signals produce similar results, thus giving a good evaluation of the system. This work suggests that CFAEs are more complex and random or irregular than non-CFAEs, which is supported by the results that are obtained here. It is important to note that the results are similar even though the analyzed signals are not the same.
With regard to the analysis of the sensitivity and specificity results in
Table 1, the results achieved can be considered as really satisfactory based on current similar studies. Although the results are somewhat lower than those achieved in the work of Alcaraz [
26], they were dealing with distinguishing between paroxysmal AF and persistent AF in records of at least 10 s in length of surface ECG. In our work, intracardiac electrograms were recorded over a period of only 5 s during AF and the RFA procedure. As the records become shorter, it becomes more difficult to apply entropy metrics with significant results. Moreover, the recorded electrograms were classified into one of four groups, irrespective of the type of AF.
Concerning the optimization of parameters, the rationale to devise a method to select
m and
r parameters was the fact that no specific guidelines exist for parameter selection. In this regard, only some general values of
m and
r have been recommended by Pincus [
36] and Lake [
37]. A criteria based on searching for maximum AUC and minimum variability was defined (
7), but providing evidence that the exact values are not crucial to guarantee a good classification performance, since different databases and different parameter arrangements were successfully tested.
From a multicenter point of view, Levels C2 and C3, fractionated electrograms, show different mean or median values in the CZ and GE databases. This may be due to differences in the way the experts in the two countries carried out their annotations. When the parameters in each database are optimized, it can be seen that the SampEn values increase, which unveils lower scale variations that are masked with the training dataset optimum parameters. However, the CZ database still exhibits an increase in complexity due to changes in the substrate, normally distributed SampEn values and non-overlapping interquartile ranges (). The same behavior is observed for the GE database, though the distribution is not normal here, and the C0 and C1 interquartile ranges overlap. The median value of one level is not contained inside the interquartile range of the next level, resulting in clear separation of the levels.
Regarding quantification of substrate changes,
Figure 3 and
Figure 4 show that the complexity of the signal increases in accordance with experts’ ranking of the level of complexity of the A-EGM signal. This can be assumed to be related to a change in the substrate characteristics. These results agree with the literature, as higher complexity levels are produced by more irregular and chaotic systems, and a varying substrate is thought to be a more irregular one. This idea is also supported by the study of Hoekstra [
38], where epicardial A-EGMs were analyzed by means of correlation dimension, correlation entropy and their coarse-grained variations. Hoekstra
et al. showed that the complexity of epicardial A-EGMs increases with the type of fibrillation. Interestingly, the results are similar, although this work deals with endocardial recordings rather than with epicardial recordings, and in addition, different complexity measures were considered.
5. Conclusions
This work describes a way to classify A-EGM signals into two main classes, non-fractionated and fractionated A-EGM, and into individual groups, C0, C1, C2 and C3. This method can support the EP decision process during RF ablation of AF. The quantitative and qualitative results also demonstrate that SampEn is an appropriate entropy measure to perform this task, with powerful discrimination capabilities to evaluate AF substrate changes.
Although signals from different databases may have the same length, sample frequency and have undergone the same post-processing steps, the physician’s way of recording, pre-processing and classifying these A-EGM records strongly influence the annotation process, since the optimal SampEn parameters are not the same for each database. However, when analyzing each database with the optimal parameters for a different training subset, the results are still very robust, namely the method is generalizable and transferable to a large variety of situations in the context of A-EGM signal processing.
In summary, we propose the use of SampEn for real-time support during navigation radio frequency ablation of atrial fibrillation based on CFAE. Only 1.5 s need to be analyzed. This method could become a clinical tool in these applications to improve the outcome of patients that have to undergo these procedures by means of a more accurate procedure.


 ,
, 


