Article

A Novel Method for PD Feature Extraction of Power Cable with Renyi Entropy

School of Electrical Engineering, Northeast Dianli University, Jilin 132012, China
*
Author to whom correspondence should be addressed.
Entropy 2015, 17(11), 7698-7712; https://0-doi-org.brum.beds.ac.uk/10.3390/e17117698
Submission received: 8 September 2015 / Revised: 19 October 2015 / Accepted: 10 November 2015 / Published: 13 November 2015
(This article belongs to the Special Issue Wavelets, Fractals and Information Theory I)

Abstract

:
Partial discharge (PD) detection can effectively achieve the status maintenance of XLPE (Cross Linked Polyethylene) cable, so it is the direction of the development of equipment maintenance in power systems. At present, a main method of PD detection is the broadband electromagnetic coupling with a high-frequency current transformer (HFCT). Due to the strong electromagnetic interference (EMI) generated among the mass amount of cables in a tunnel and the impedance mismatching of HFCT and the data acquisition equipment, the features of the pulse current generated by PD are often submerged in the background noise. The conventional method for the stationary signal analysis cannot analyze the PD signal, which is transient and non-stationary. Although the algorithm of Shannon wavelet singular entropy (SWSE) can be used to analyze the PD signal at some level, its precision and anti-interference capability of PD feature extraction are still insufficient. For the above problem, a novel method named Renyi wavelet packet singular entropy (RWPSE) is proposed and applied to the PD feature extraction on power cables. Taking a three-level system as an example, we analyze the statistical properties of Renyi entropy and the intrinsic correlation with Shannon entropy under different values of α . At the same time, discrete wavelet packet transform (DWPT) is taken instead of discrete wavelet transform (DWT), and Renyi entropy is combined to construct the RWPSE algorithm. Taking the grounding current signal from the shielding layer of XLPE cable as the research object, which includes the current pulse feature of PD, the effectiveness of the novel method is tested. The theoretical analysis and experimental results show that compared to SWSE, RWPSE can not only improve the feature extraction accuracy for PD, but also can suppress EMI effectively.

1. Introduction

The internal partial discharge (PD) of XLPE cable refers to a phenomenon of discharge that takes place in the insulating structure of XLPE cable in a power system. The discharge can do damage to the insulating structure in the nearby area. If the PD exists for a long time, it may decrease the major electrical insulation level and eventually lead to insulation breakdown of the cable. The sampling of the PD signal mainly uses the broadband electromagnetic coupling method in which a high frequency current transformer (HFCT) is used to sample the pulse current from the cable shielding layer to the ground when PD takes place. The research suggests that due to the electromagnetic interference caused by the mass amount of cables in the tunnel, with the impedance mismatching between HFCT and the data acquisition equipment, the signal features (mainly between 1 MHz and 30 MHz) of the pulse current produced by PD are often submerged by background noise, and the detection results processed by software and hardware are still not good enough. If we can propose a method that can extract the signal feature of PD under strong background noise, it will promote the technological development of the fault diagnosis of XLPE cable.
As an analysis method of a non-stationary signal, Shannon wavelet singular entropy (SWSE) has been applied in transient signal feature extraction gradually, and some interesting results have been obtained [1]. However, the study shows that the accuracy of transient feature extraction with SWSE mainly depends on the meticulousness of frequency resolution by wavelet transform (WT) for the measured signal. Due to the corresponding frequency-band unevenness of the WT scale and the growth of frequency resolution roughness with a decrease in the WT scale, as several high frequency components of the signal are divided into the same frequency band, SWSE will decrease more than the expected value, which can result in the inaccuracy of PD detection. Therefore, [2] makes a clinical diagnosis on the basis of magnetic resonance brain images via the discrete wavelet packet transform (DWPT) with Tsallis entropy and a generalized support vector machine. For bearing fault diagnosis, DWPT and Shannon entropy are applied to obtain an accurate result [3]. By combining DWPT with sample entropy, a diagnosis has been applied for non-fluent voices [4]. The works in [5,6,7,8] present a voice feature extraction method using DWPT. In [9,10], DWPT is applied to extract the signal feature of an electric power system. In [11,12], a combination method is proposed to improve the ability of recognizing power quality disturbances based on wavelet packet entropies.
Consideringthe short durationand low energy of the pulse current caused by PD and electromagnetic interference (EMI), in this paper, based on the combination of DWPT and Renyi entropy, a novel method using Renyi wavelet packet singular entropy (RWPSE) is proposed, and it is applied to the PD feature extraction. The effectiveness of the method is also proven by theoretical analysis and experiments.

2. Shannon Wavelet Singular Entropy

2.1. The Definition of Shannon Wavelet Singular Entropy

SWSE is the combination of discrete wavelet transform (DWT), singular value decomposition (SVD) and Shannon entropy [13].
The algorithm procedure is listed as follows:
(1) On the assumption that the measured signal x ( n ) is decomposed into S layers with DWT, then we get S wavelet coefficients (or reconstructed signals). A sliding window is set upon the wavelet coefficients D = { d i ( k ) , k = 1 , , L , i = 1 , , S } to form a matrix; L is the length of original data; the width of the sliding window is 2 w L ; the slide factor is 1 δ w . Therefore, the matrix that is constituted by the data sequence in the sliding window during the period ( 1 + m δ ) ~ ( w + m δ ) is:
W ( m ; w ; δ ) = ( d 1 ( 1 + m δ ) d 1 ( 2 + m δ ) d 1 ( w + m δ ) d 2 ( 1 + m δ ) d 2 ( 2 + m δ ) d 2 ( w + m δ ) d S ( 1 + m δ ) d S ( 2 + m δ ) d S ( w + m δ ) )
where m = 1 , 2 , , M is the sliding number of the sliding window, M = ( L w ) / δ .
(2) According to SVD theory, W ( m , w , δ ) is deformed as follows:
W ( m , w , δ ) = U Λ V
where λ s ( s = 1 , 2 , , g , g min ( S , w ) ) of diagonal matrix Λ is singular value, and λ 1 λ 2 λ g 0 [14].
(3) At last, the calculation of SWSE during ( 1 + m δ ) ~ ( w + m δ ) is regarded as:
W S WS E ( m ) = j = 1 g p m ( j ) ln p m ( j )
where p m ( j ) = λ j s = 1 g λ s .

2.2. The Limitation of Shannon Wavelet Singular Entropy

DWT is the basis of SWSE besides Shannon entropy. After, the measured signal x ( n ) is decomposed and reconstructed in each frequency band, and the frequency band of single-branch reconstructed signals D i ( k ) and A i ( k ) is:
{ D i ( k ) : [ 2 ( i + 1 ) f s , 2 i f s ] A i ( k ) : [ 0 , 2 ( i + 1 ) f s ] i = 1 , 2 , , m
where f s is the sampling frequency.
For convenience, A m ( n ) is expressed as D m + 1 ( n ) , so x ( n ) = i = 1 m + 1 D i ( n ) . With the resolution increase of DWT, The low frequency component is refined by the frequency divider continually, except the high frequency component.
From Equation (4) and when the main components of the signal are concentrated in the high frequency band, this will influence the accuracy of the SWSE calculation, as the DWT resolution on the high frequency band is too rough, and the most high-frequency components that have a similar frequency are in the same scale, which is proven as follows.
On the assumption that the i-th branch reconstructed single D i ( n ) contains k i different frequency components, so:
{ p m ( i ) = λ i i = 1 m λ i q i ( j ) = λ i j j = 1 k i λ i j
λ i is the singular value of the i-th branch reconstructed signal D i ( n ) ; λ k i is the singular value of the j-th frequency components in D i ( n ) ; p m ( i ) is simplified as p i .
In accordance with the correlation properties of reconstructed signals through DWT, the stronger the dependency of the reconstructed signal on the neighbor nodes, the more similar the frequency components are. When the reconstructed signals of nodes are approximately in accord, the corresponding singular value will be close to zero. On the contrary, if the frequency components of reconstructed signals on nodes have a great difference, the singular value of the main diagonal will increase correspondingly.
According to Equation (3), the SWSE is calculated as:
W S WS E ( p 1 , , p m ) = i = 1 m p i ln p i
From Equations (4) and (6), the conventional SWSE does not perform detailed statistics on k i different frequency components of D i ( n ) ; therefore, the frequency component of each reconstructed signal is so complicated, that the sum of its singular value is greater than the singular value corresponding to D i ( n ) without frequency sub-dividing, which is p i j = 1 k i q i ( j ) , and q i ( j ) is simplified as q i j . The calculating process of all frequency components with the SWSE algorithm is listed as follows.
W S WS E ( q 11 , , q 1 k 1 , , q m 1 , , q m k m ) = i = 1 m j = 1 k i q i j ln q i j = [ i = 1 m p i ln p i + i = 1 m j = 1 k i ( q i j ln q i j ) i = 1 m p i ln p i ] = W S WS E ( p 1 , , p m ) i = 1 m j = 1 k i ( q i j ln q i j ) + i = 1 m p i ln p i W S WS E ( p 1 , , p m ) i = 1 m j = 1 k i ( q i j ln q i j ) + i = 1 m ( j = 1 k i q i j ) ln p i = W S WS E ( p 1 , , p m ) i = 1 m p i j = 1 k i q i j p i ( ln q i j ln p i ) = W S WS E ( p 1 , , p m ) + i = 1 m p i W S WS E ( q i 1 p 1 , , q i k i p m )
Compared to Equation (6), Equation (7) has an extra part i = 1 m p i W S W S E ( q i 1 p 1 , q i k i p m ) , according to the non-negativity of Shannon entropy, when W S WS E ( q i 1 p 1 , q i k i p m ) 0 ,
W S WS E ( q 11 , , q 1 k 1 , , q m 1 , , q m k m ) > W S WS E ( p 1 , , p m )
From the above analysis, when a reconstructed signal contains the multi-frequency components after DWT, its SWSE is smaller than the expected value of all frequency components. This shows that the extent of detail of the partition for the frequency band by DWT has an influence on the accuracy of the description for signal complexity with SWSE. Therefore, if all of the frequency components of the measured signal can be assigned to the frequency band corresponding to certain wavelet scales, the complexity description will be the most accurate. However, the DWT frequency bands are not evenly segmented, and the roughness of the frequency band partition will increase with the scale reducing. When multiple high-frequency components of the measured signal are assigned to the same frequency band, SWSE is smaller than the expected value. When the measured signal contains complex frequency components in the high frequency band, especially a transient signal, SWSE cannot characterize the signal complexity accurately.

3. Renyi Wavelet Packet Singular Entropy

3.1. The Definition of Renyi Entropy

Renyi entropy is an extension of Shannon entropy. Renyi entropy is equivalent to Shannon when α = 1 . In many cases, the Renyi entropy has better statistical properties than the Shannon entropy when α 1 . Renyi entropy is defined as follows [15].
W R E ( m ) = { 1 1 α ln ( n p m α ( j ) ) α > 0 , α 1 n p m ( j ) ln p m ( j ) α = 1

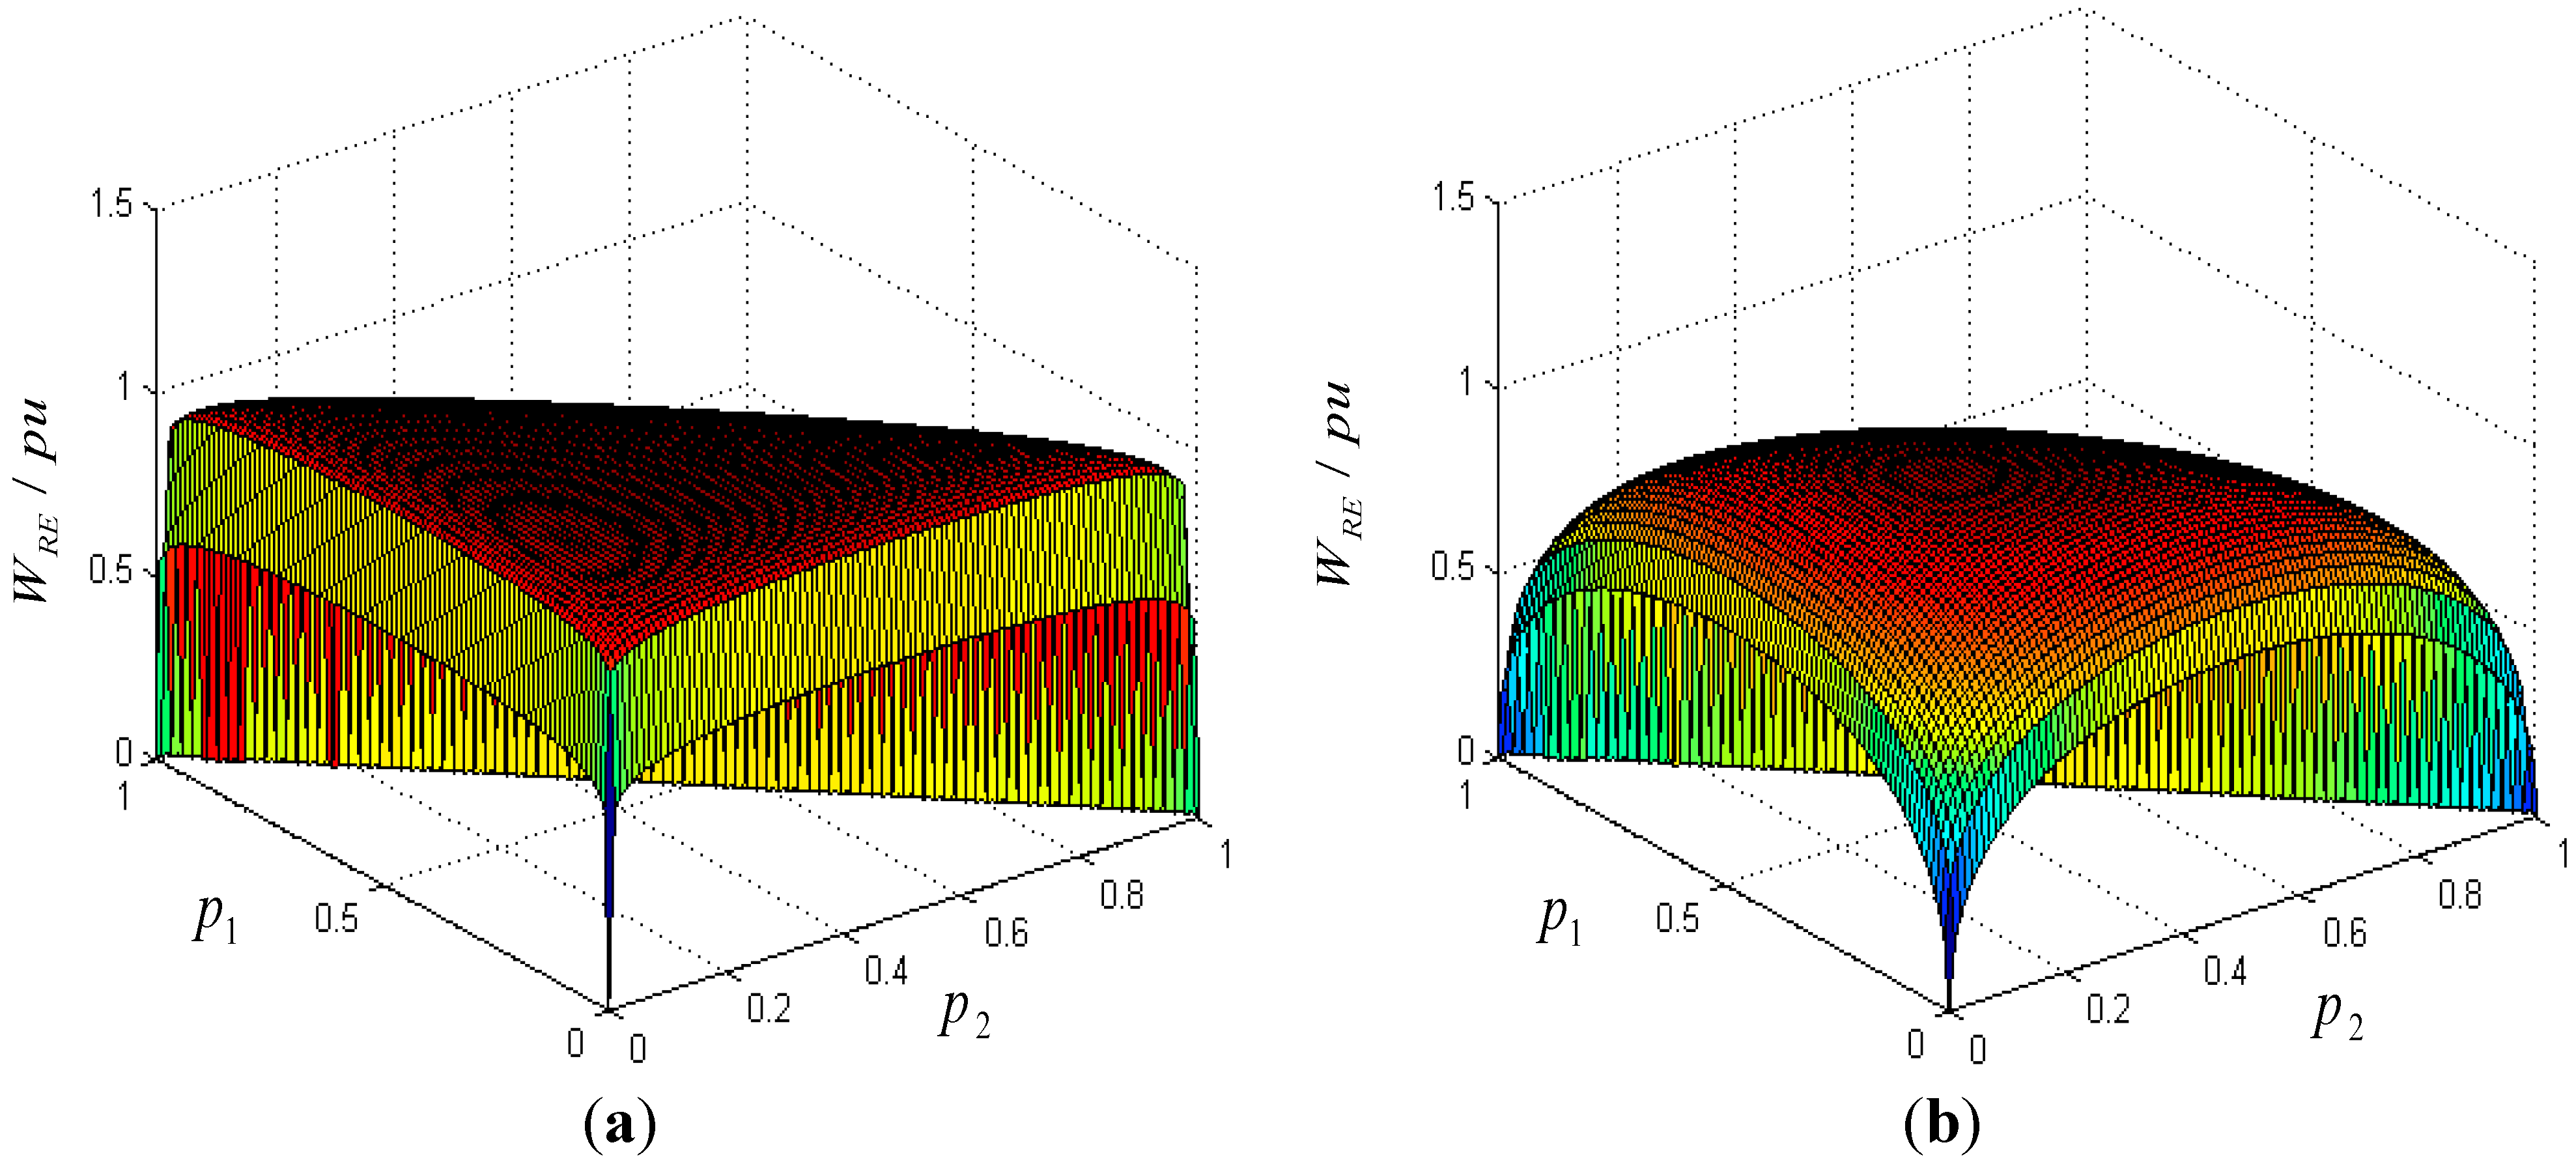
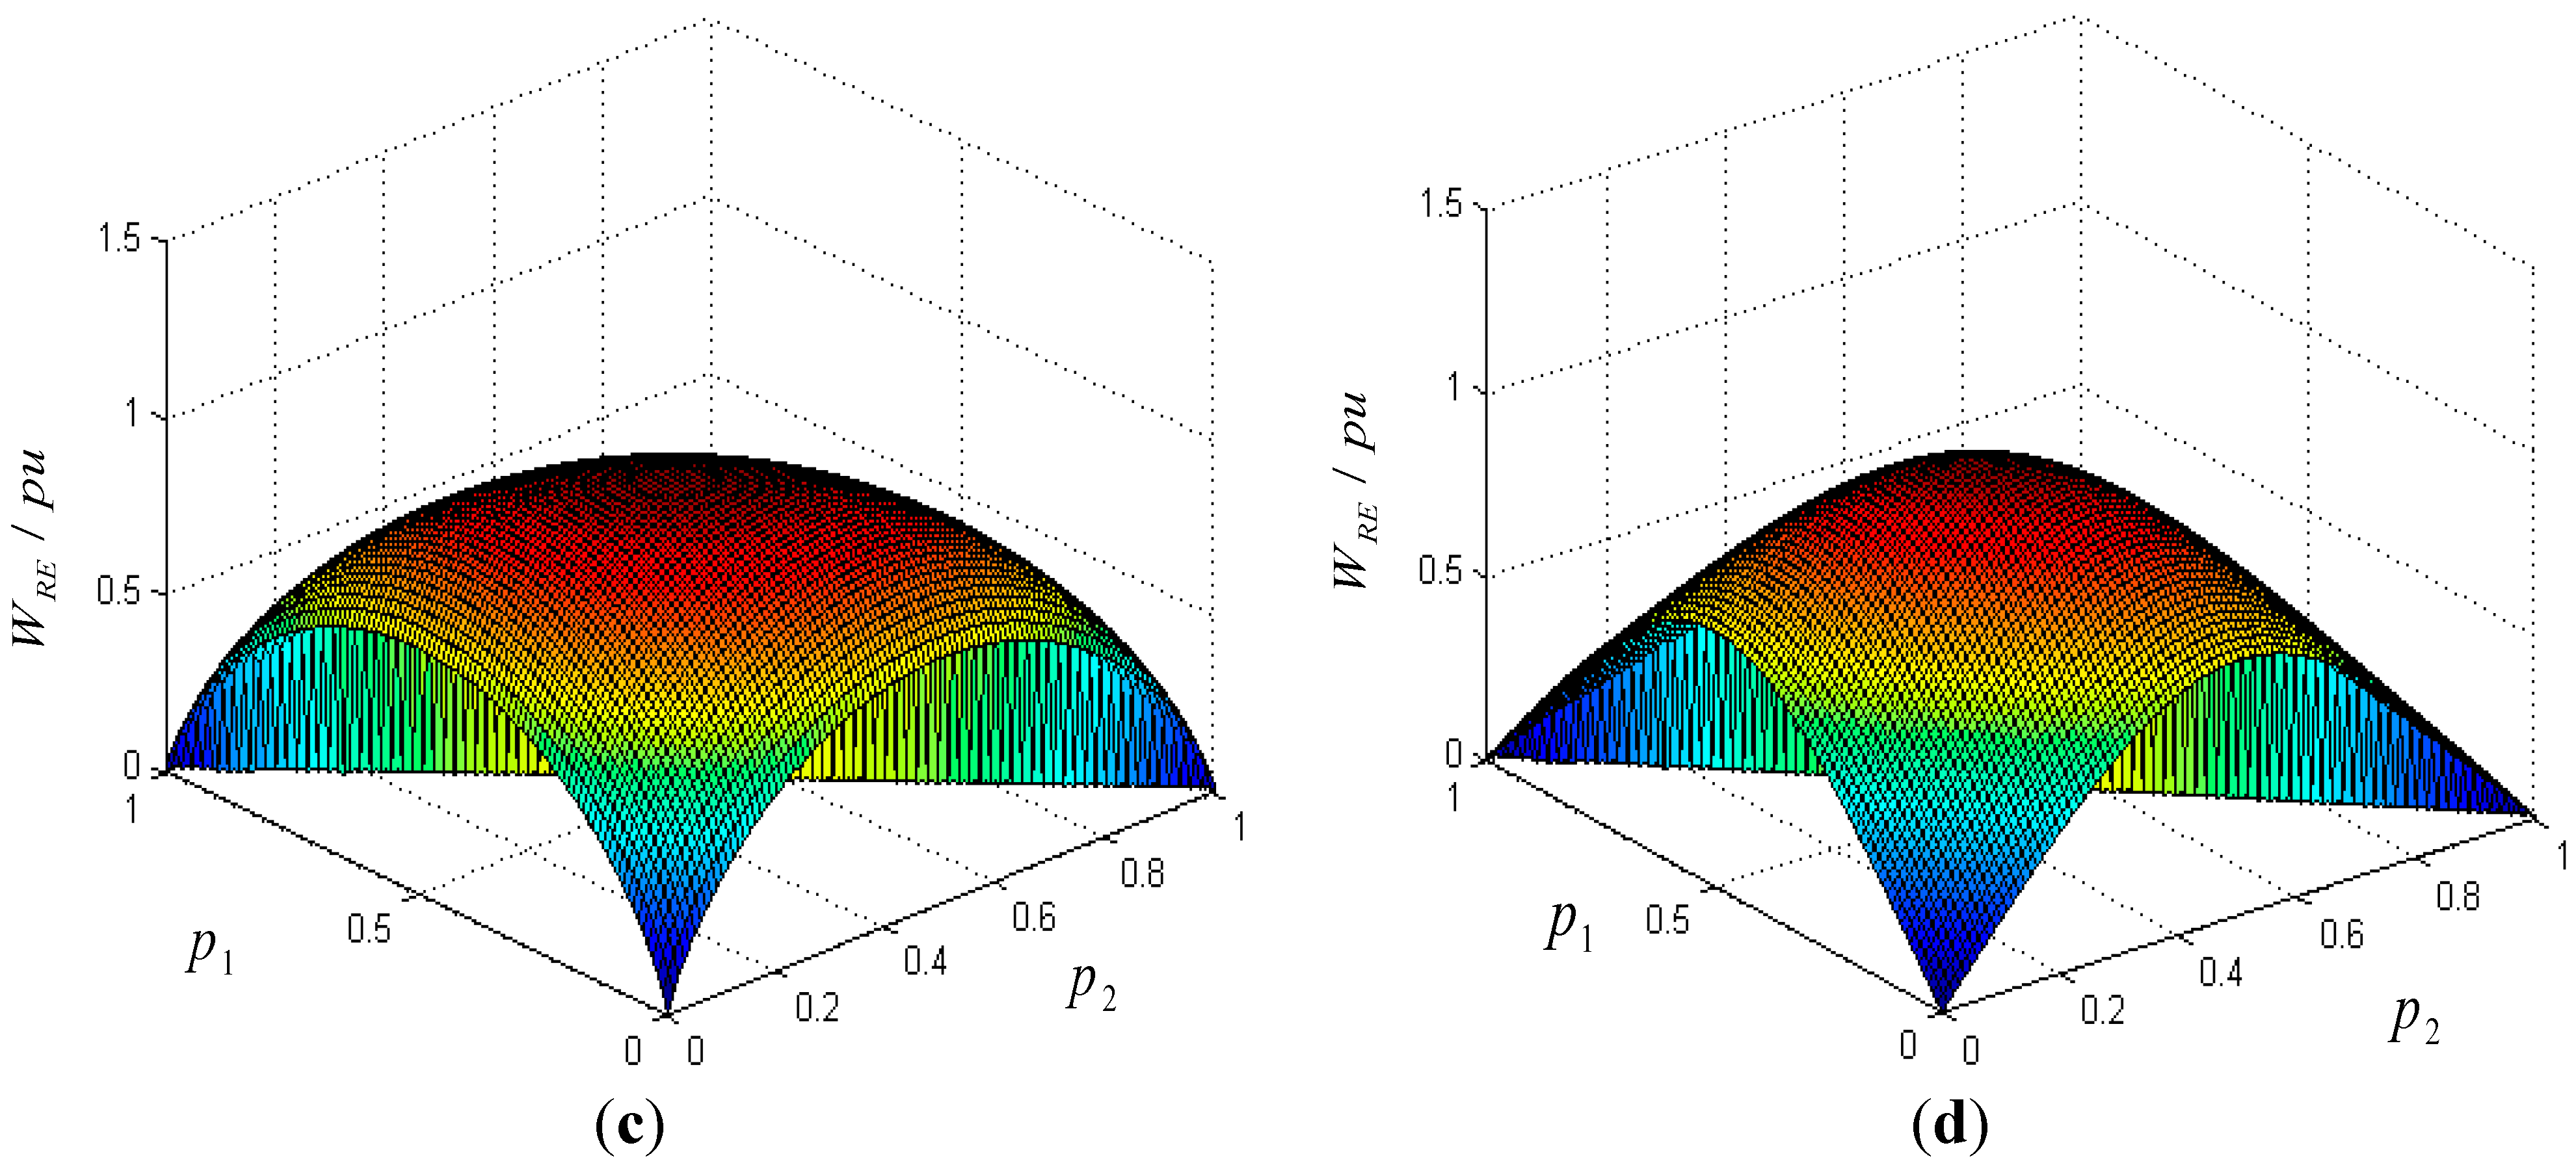
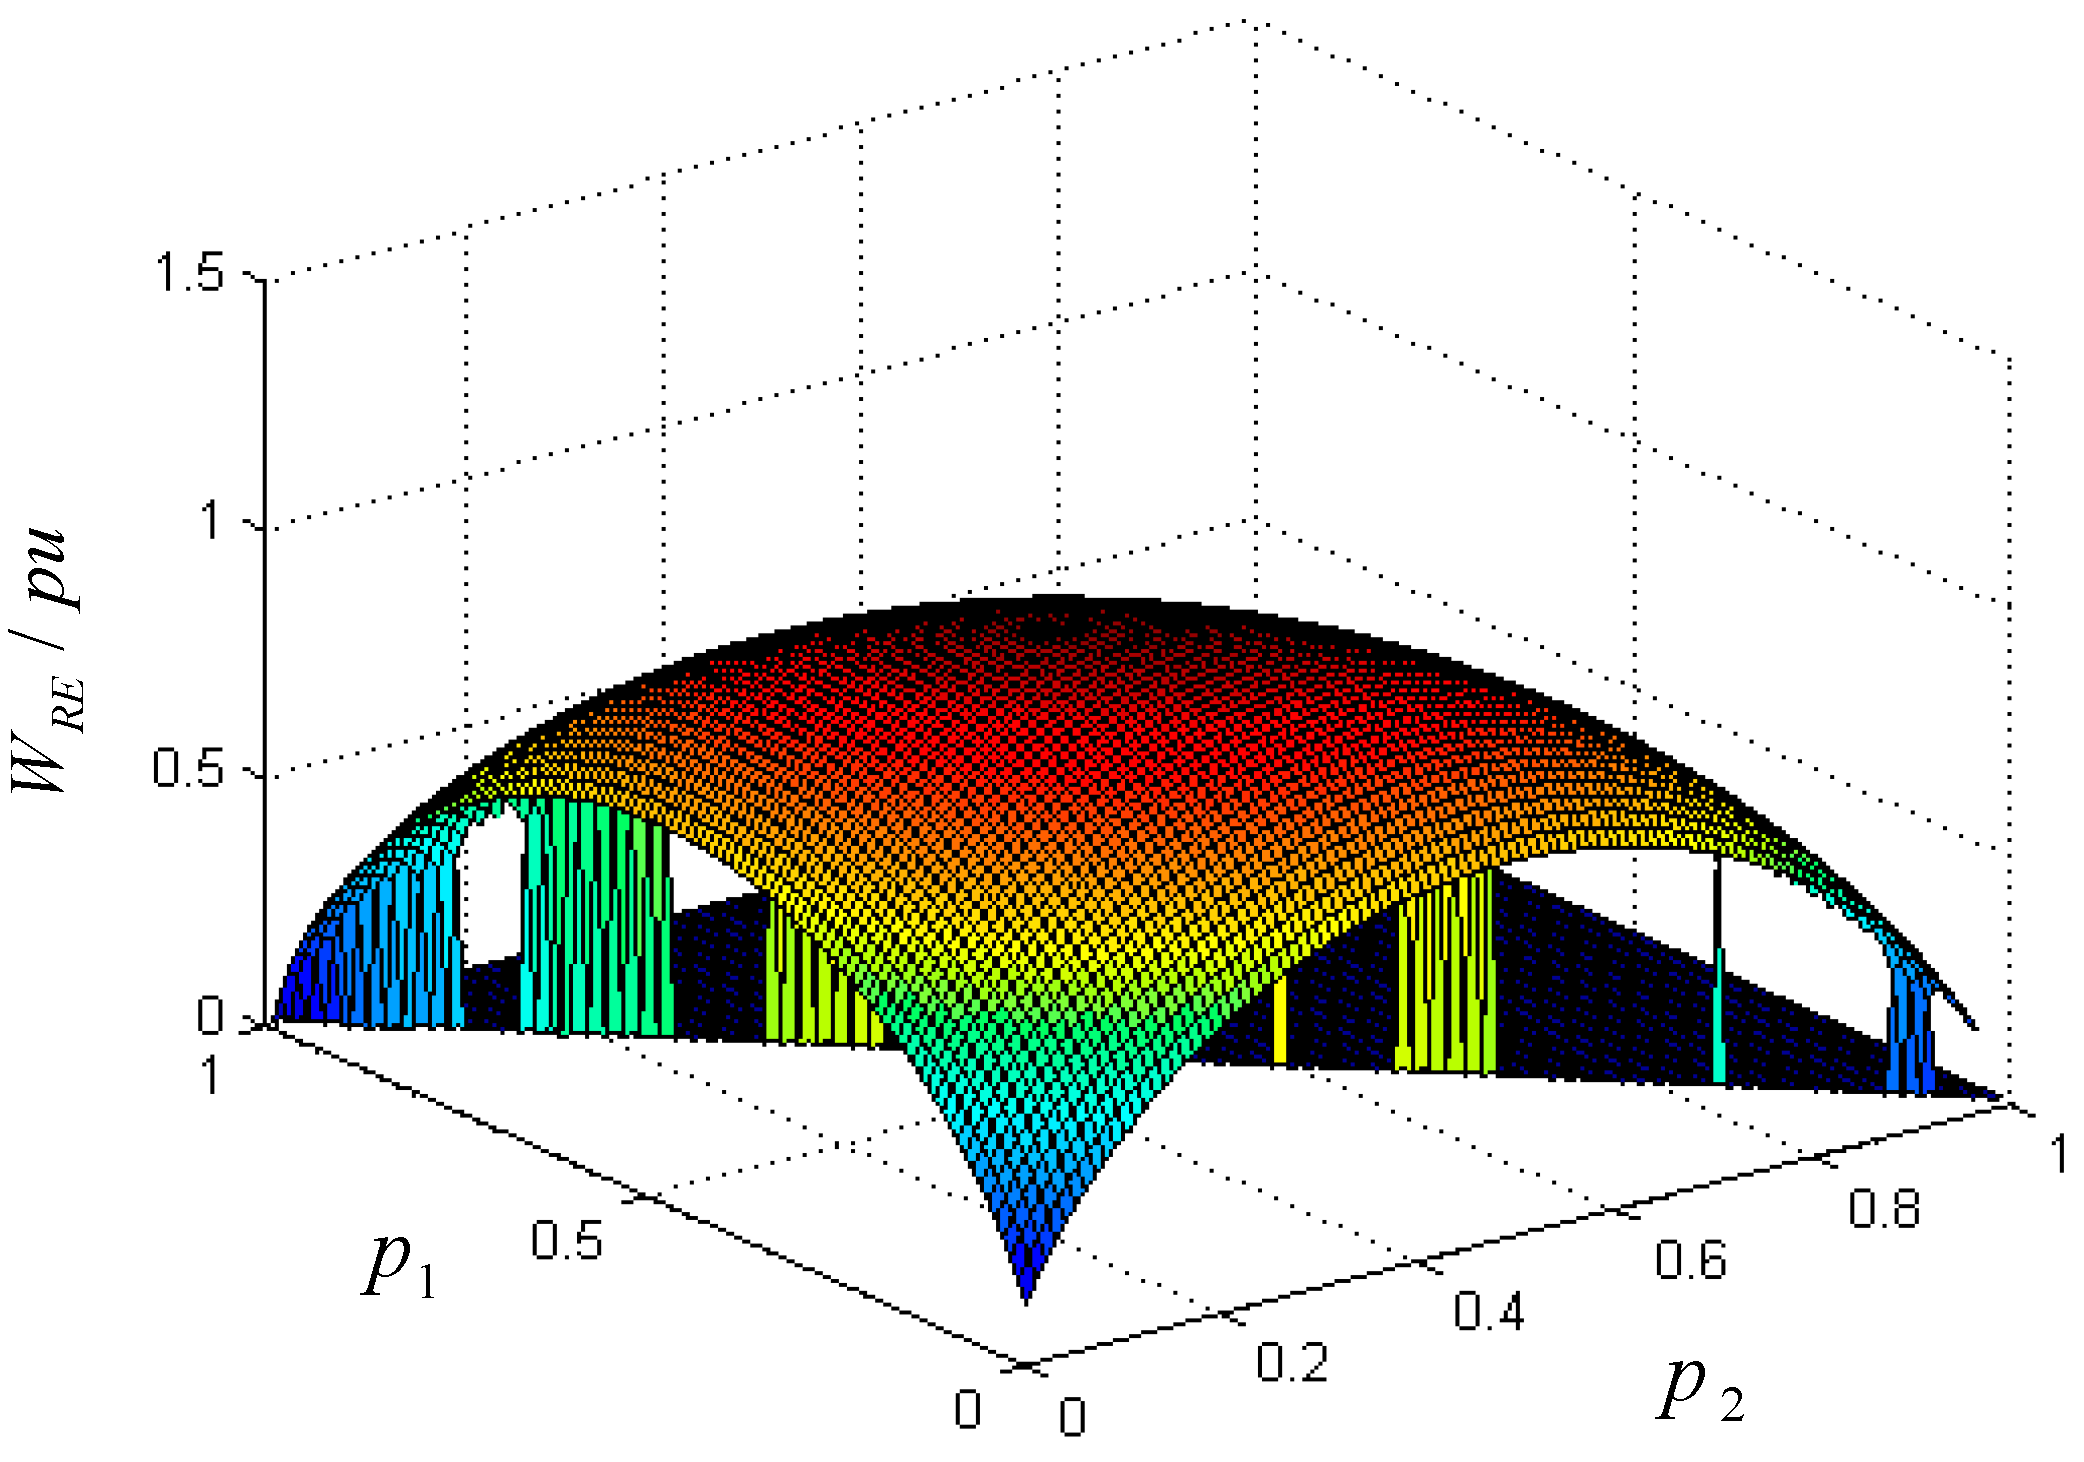
3.2. The Statistical Properties of Renyi Entropy

The selection of α plays an important role in the statistical properties of Renyi entropy. Taking a three-level system as the analysis object, according to Equation (9), the statistical results are calculated, and the corresponding relation between Renyi entropy with α and the probability distribution are shown in Figure 1a–d. According to Figure 1a–d, when α > 0 and α 0 , with the increase of α , the statistical range of Renyi entropy will expand for the system state of a small probability event, and the statistical sensitivity of the small probability event will reduce correspondingly. On the contrary, with the decrease of α , the statistical range of the small probability event is reduced, and the statistical sensitivity is increased. When α 1 , Renyi entropy is in accord with Shannon entropy. Because W S E = i = 1 n p i ln p i , when p i = 0 , the value of the Shannon entropy may be missing, as shown in Figure 2. At this point, the Shannon entropy statistics will fail. Therefore, p i ln p i = 0 is usually defined when p i = 0 .
For a signal containing transient (or complex high frequency) components, the components of the signal are characterized by low energy, and there is a small probability event relative to the background noise. Considering this, Renyi entropy can get better results in extracting the signal feature with the appropriate α .
Figure 1. Relation between Renyi entropy with different values of α and the probability distribution: (a) α = 0.1 ; (b) α = 0.5 ; (c) α = 0.99 ; (d) α = 2 .
Entropy 17 07698 g001aEntropy 17 07698 g001b
Figure 2. Relation between Shannon entropy and the probability distribution.
Entropy 17 07698 g002

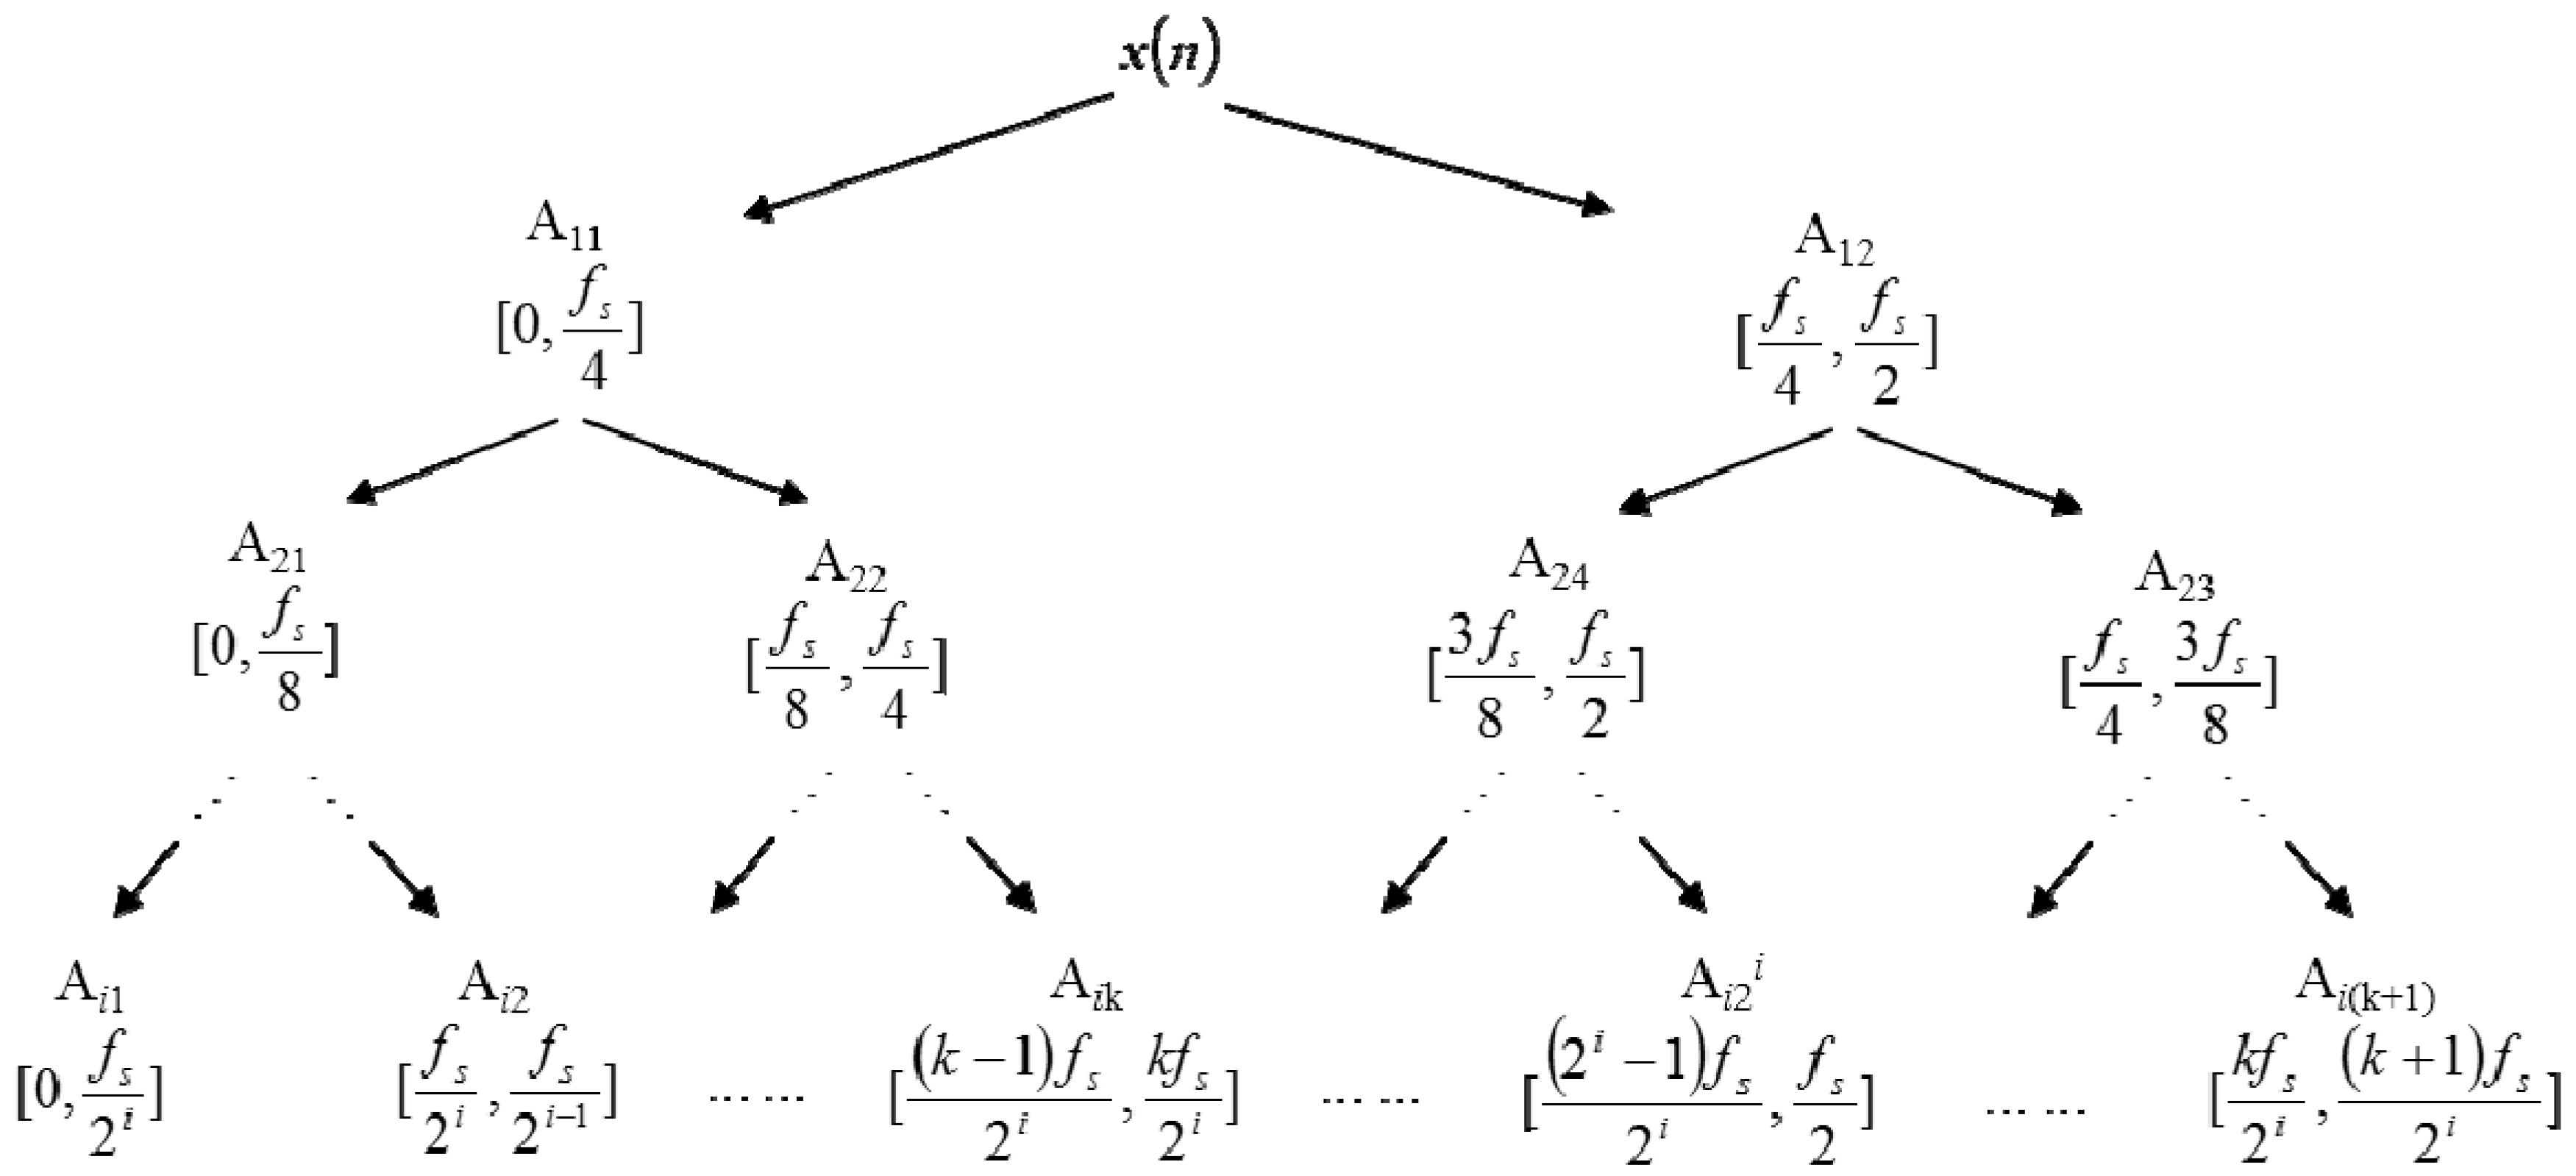
3.3. The Definition of Renyi Wavelet Packet Singular Entropy

From Section 2.2, the high-frequency resolution roughness of DWT is the basic reason causing the inaccuracy of the signal complexity description with SWSE. Therefore, we introduce DWPT to improve the high-frequency resolution. The discrete wavelet packet recursive decomposition is listed as follows.
{ d i , 2 k ( t ) = 2 k g ( x ) d i 1 , k ( 2 t x ) d i , 2 k 1 ( t ) = 2 k h ( x ) d i 1 , k ( 2 t x ) d 0 , 0 ( t ) = x ( t )
Where h ( x ) is a high-pass filter, g ( x ) is a low-pass filter and d i , k ( x ) is the reconstructed signal of the node k on the layer i by DWPT, and the discrete wavelet packet decomposition is to divide each sub-band into two parts and transmit them to the lower levels until each sub-band corresponds to a frequency component of the signal, as shown in Figure 3.
Figure 3. Framework of discrete wavelet packet transform (DWPT).
Entropy 17 07698 g003
From Figure 3, DWPT is to divide the frequency band i into the 2 i sub-frequency band, so as to improve the resolution of the low and high frequency. Compared to DWT, a closer analysis is operated in the frequency domain, which overcomes the DWT’s limitations of the high-frequency resolution roughness. In view of the above analysis, DWPT and Renyi entropy are introduced instead of DWT and Shannon entropy, and the RWPSE algorithm is proposed as follows.
(1) By using DWPT, the signal x ( n ) is decomposed and reconstructed on the m layer, and the S branch reconstructed signals are obtained to build the matrix D L × S = { d i ( k ) , k = 1 , , L , i = 1 , , S } ; L is the length of x ( n ) . A sliding window is defined as W ( m , w , δ ) on D L × S ; w is the window width; δ is the sliding factor.
(2) According to the SVD theory, the SVD of W ( m , w , δ ) is defined as follows.
W ( m , w , δ ) = U Λ V
In Equation (11), the main diagonal elements of the matrix Λ , λ s ( s = 1 , 2 , , g , g min ( M , w ) ) are the singular values of W ( m , w , δ ) , and λ 1 λ 2 λ g 0 .
(3) RWPSE is calculated during ( 1 + m δ ) ~ ( w + m δ ) according to Equation (12).
W R W P S E ( m ) = 1 1 α ln j = 1 g ( p m ( j ) ) α
where p m ( j ) = λ j j = 1 g λ j .

4. The Application of RWPSE in PD Detection

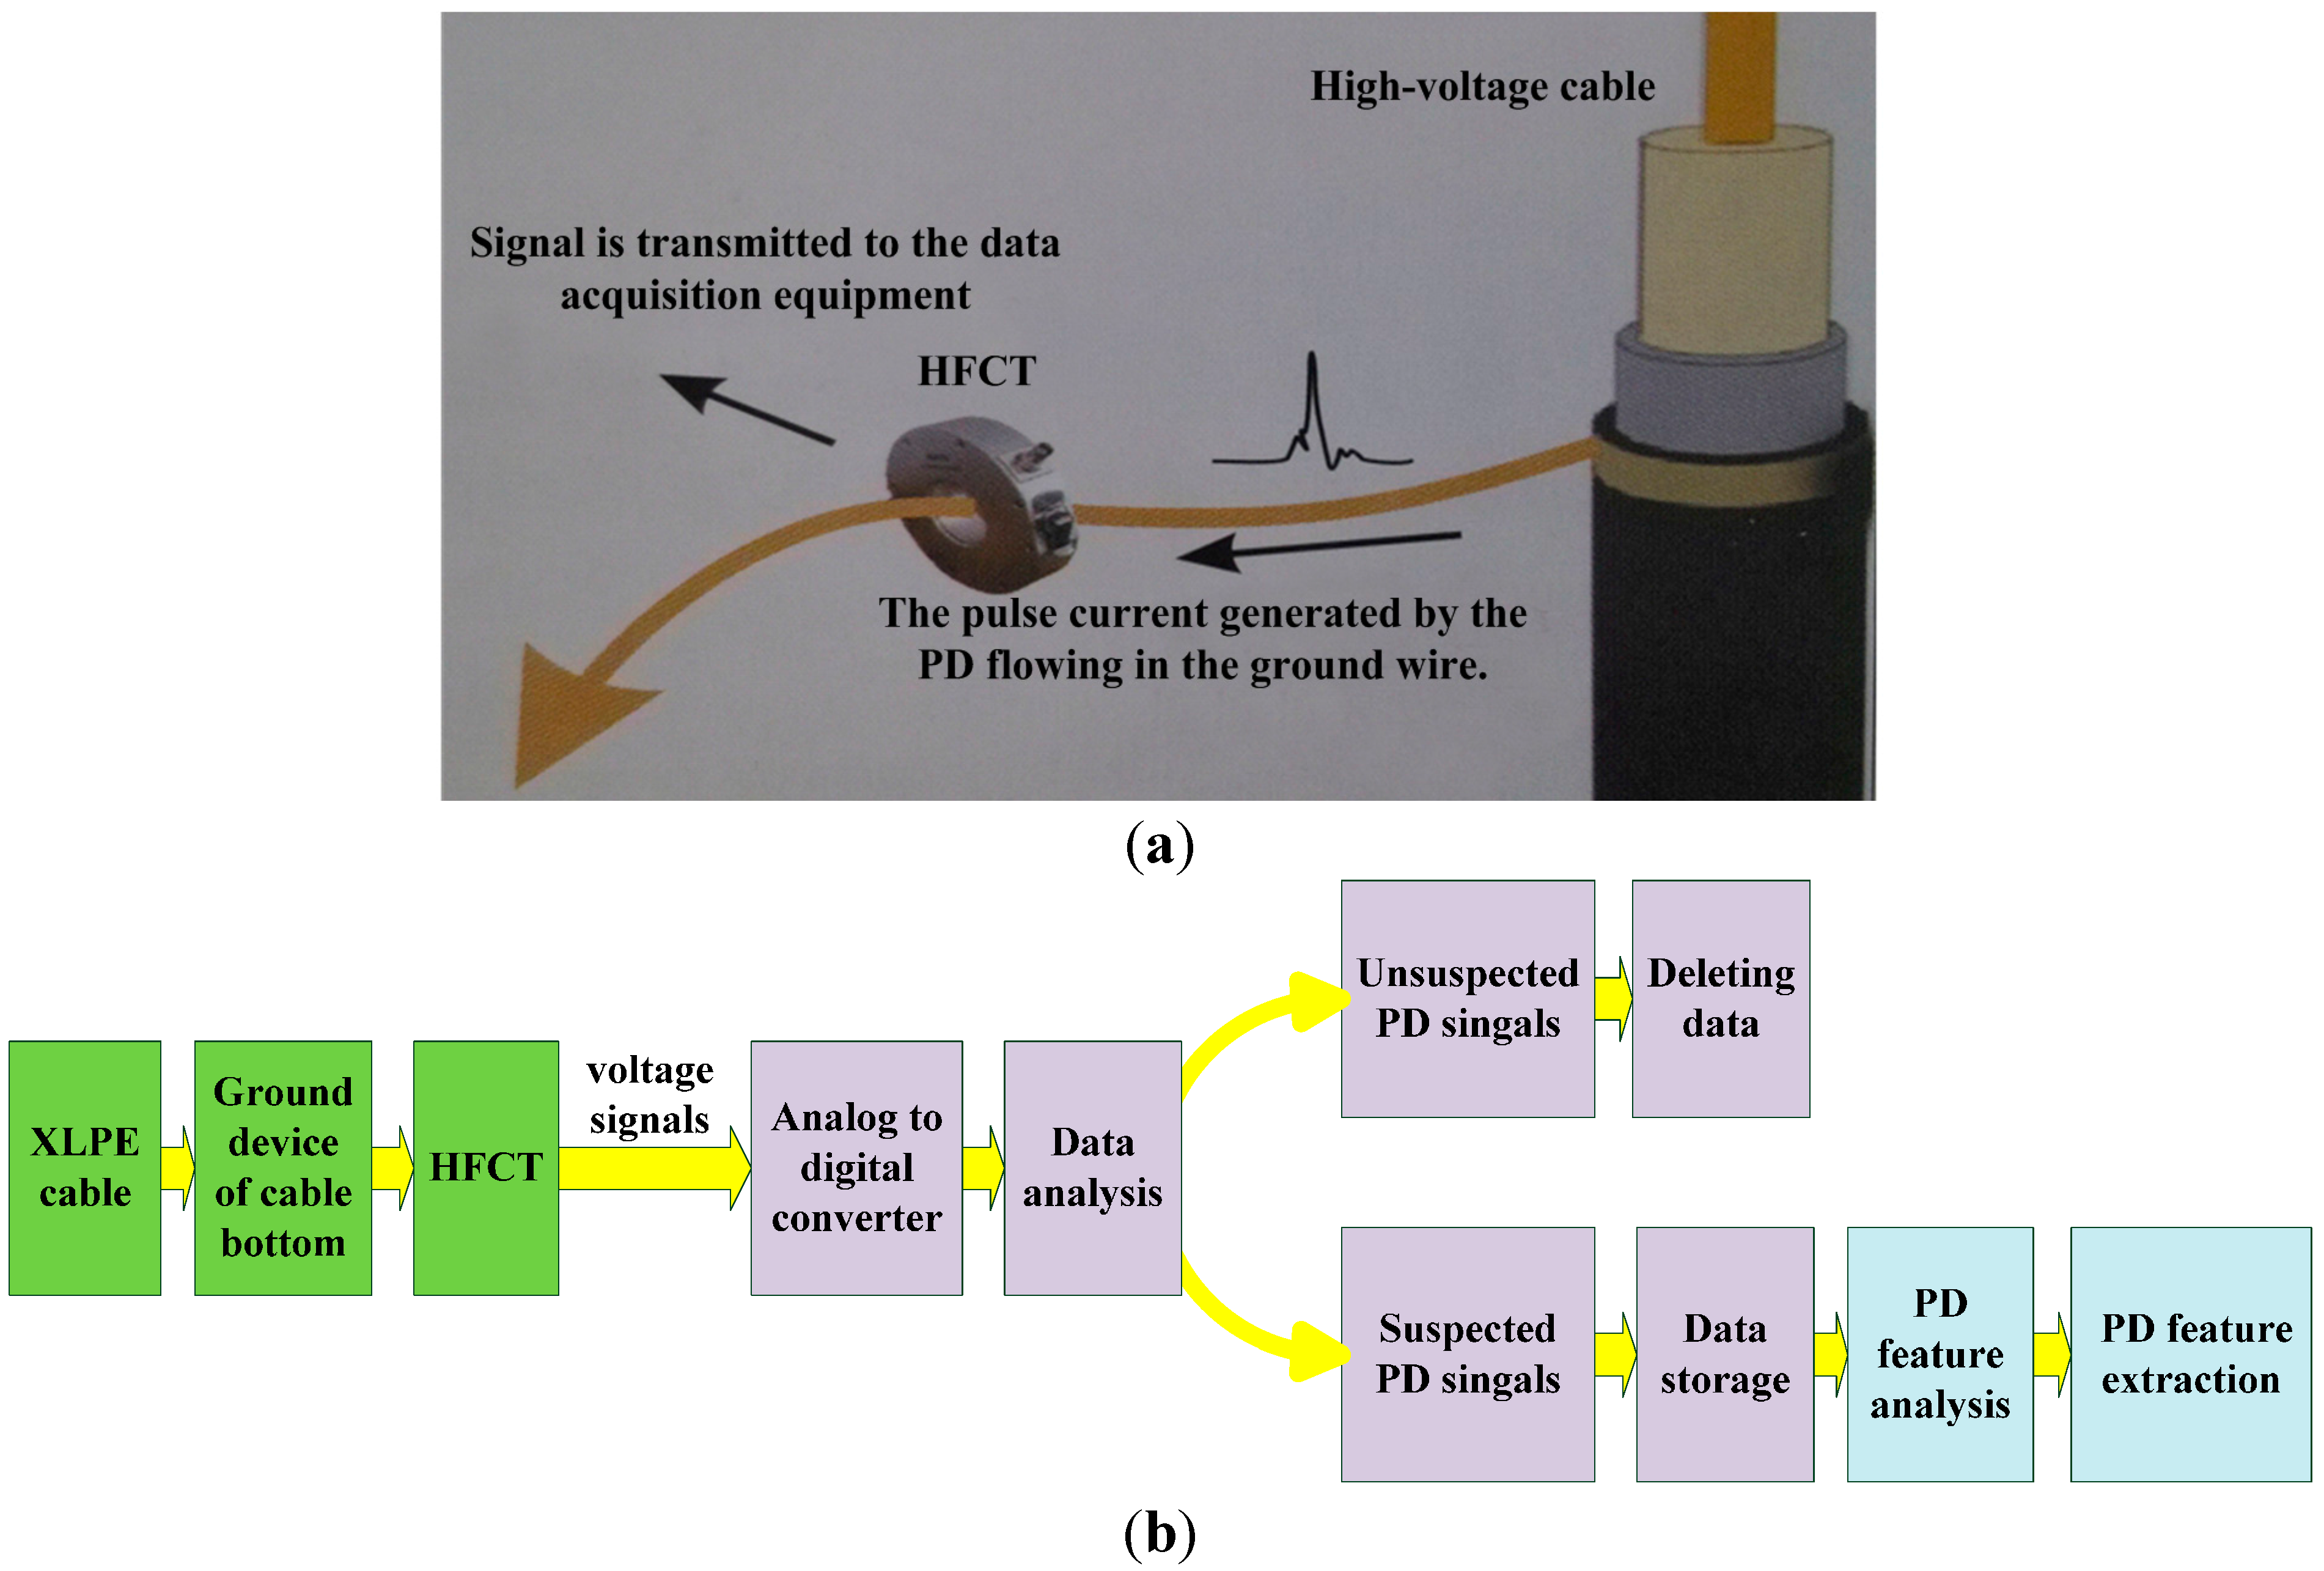
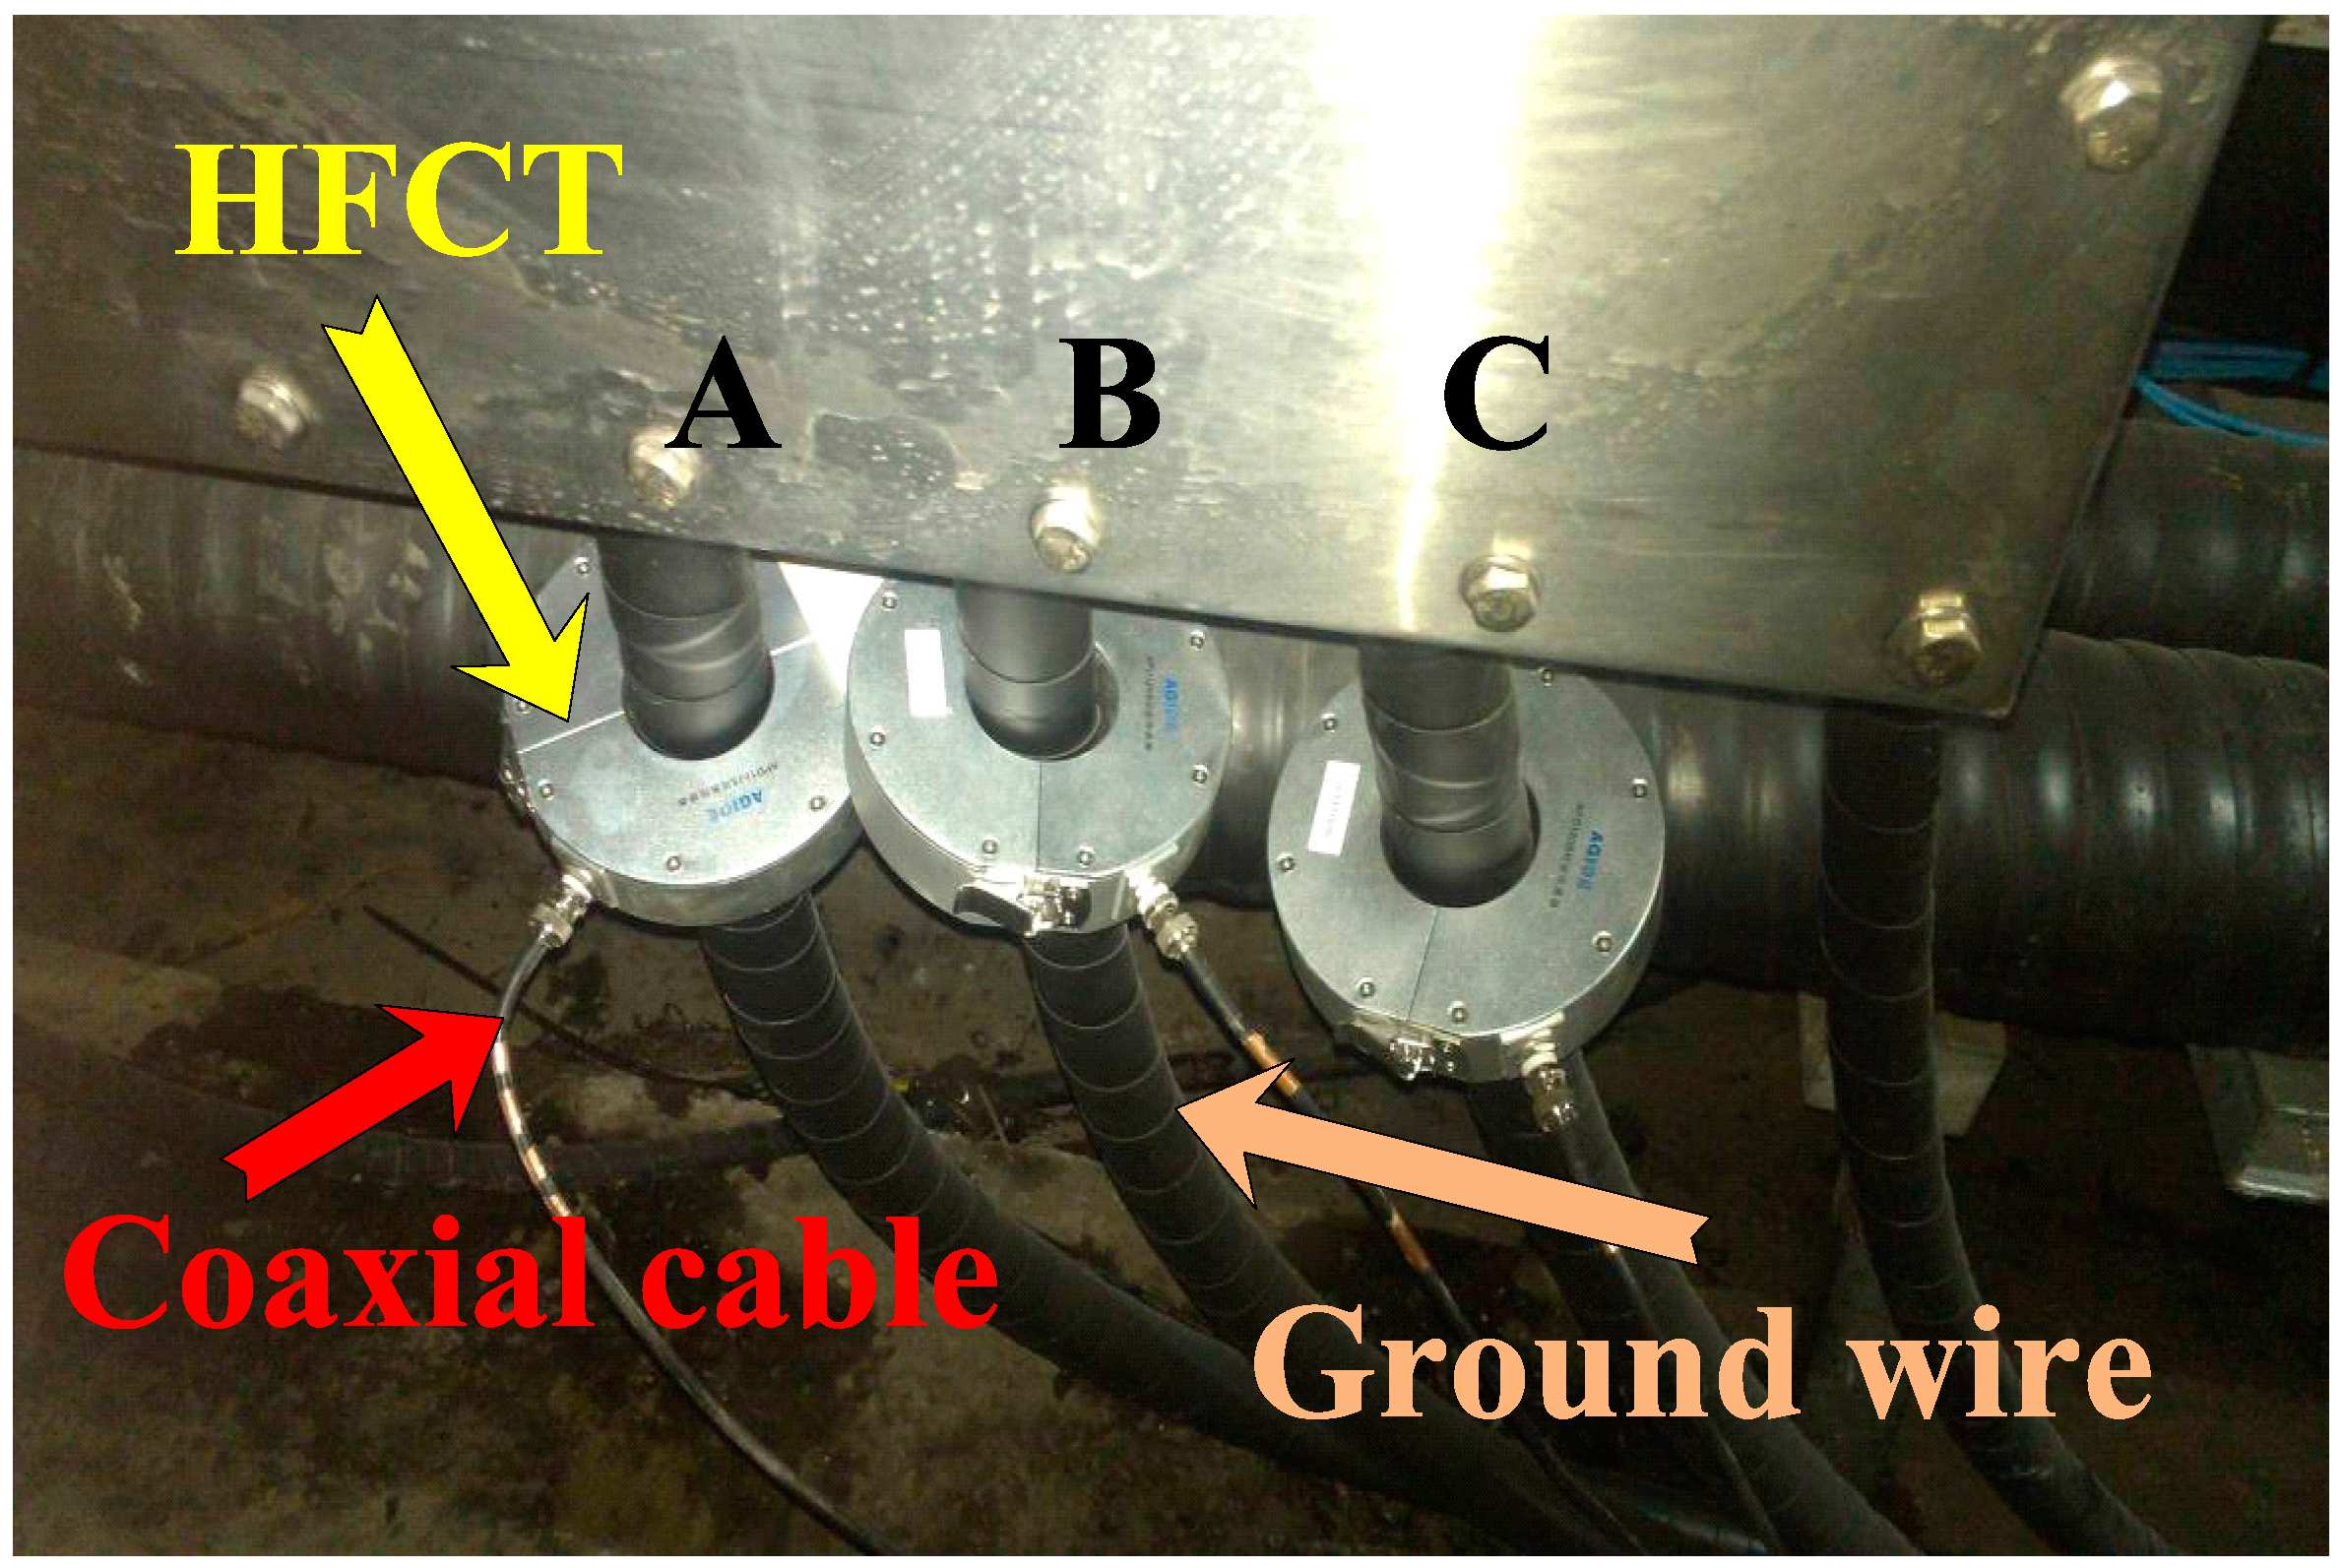
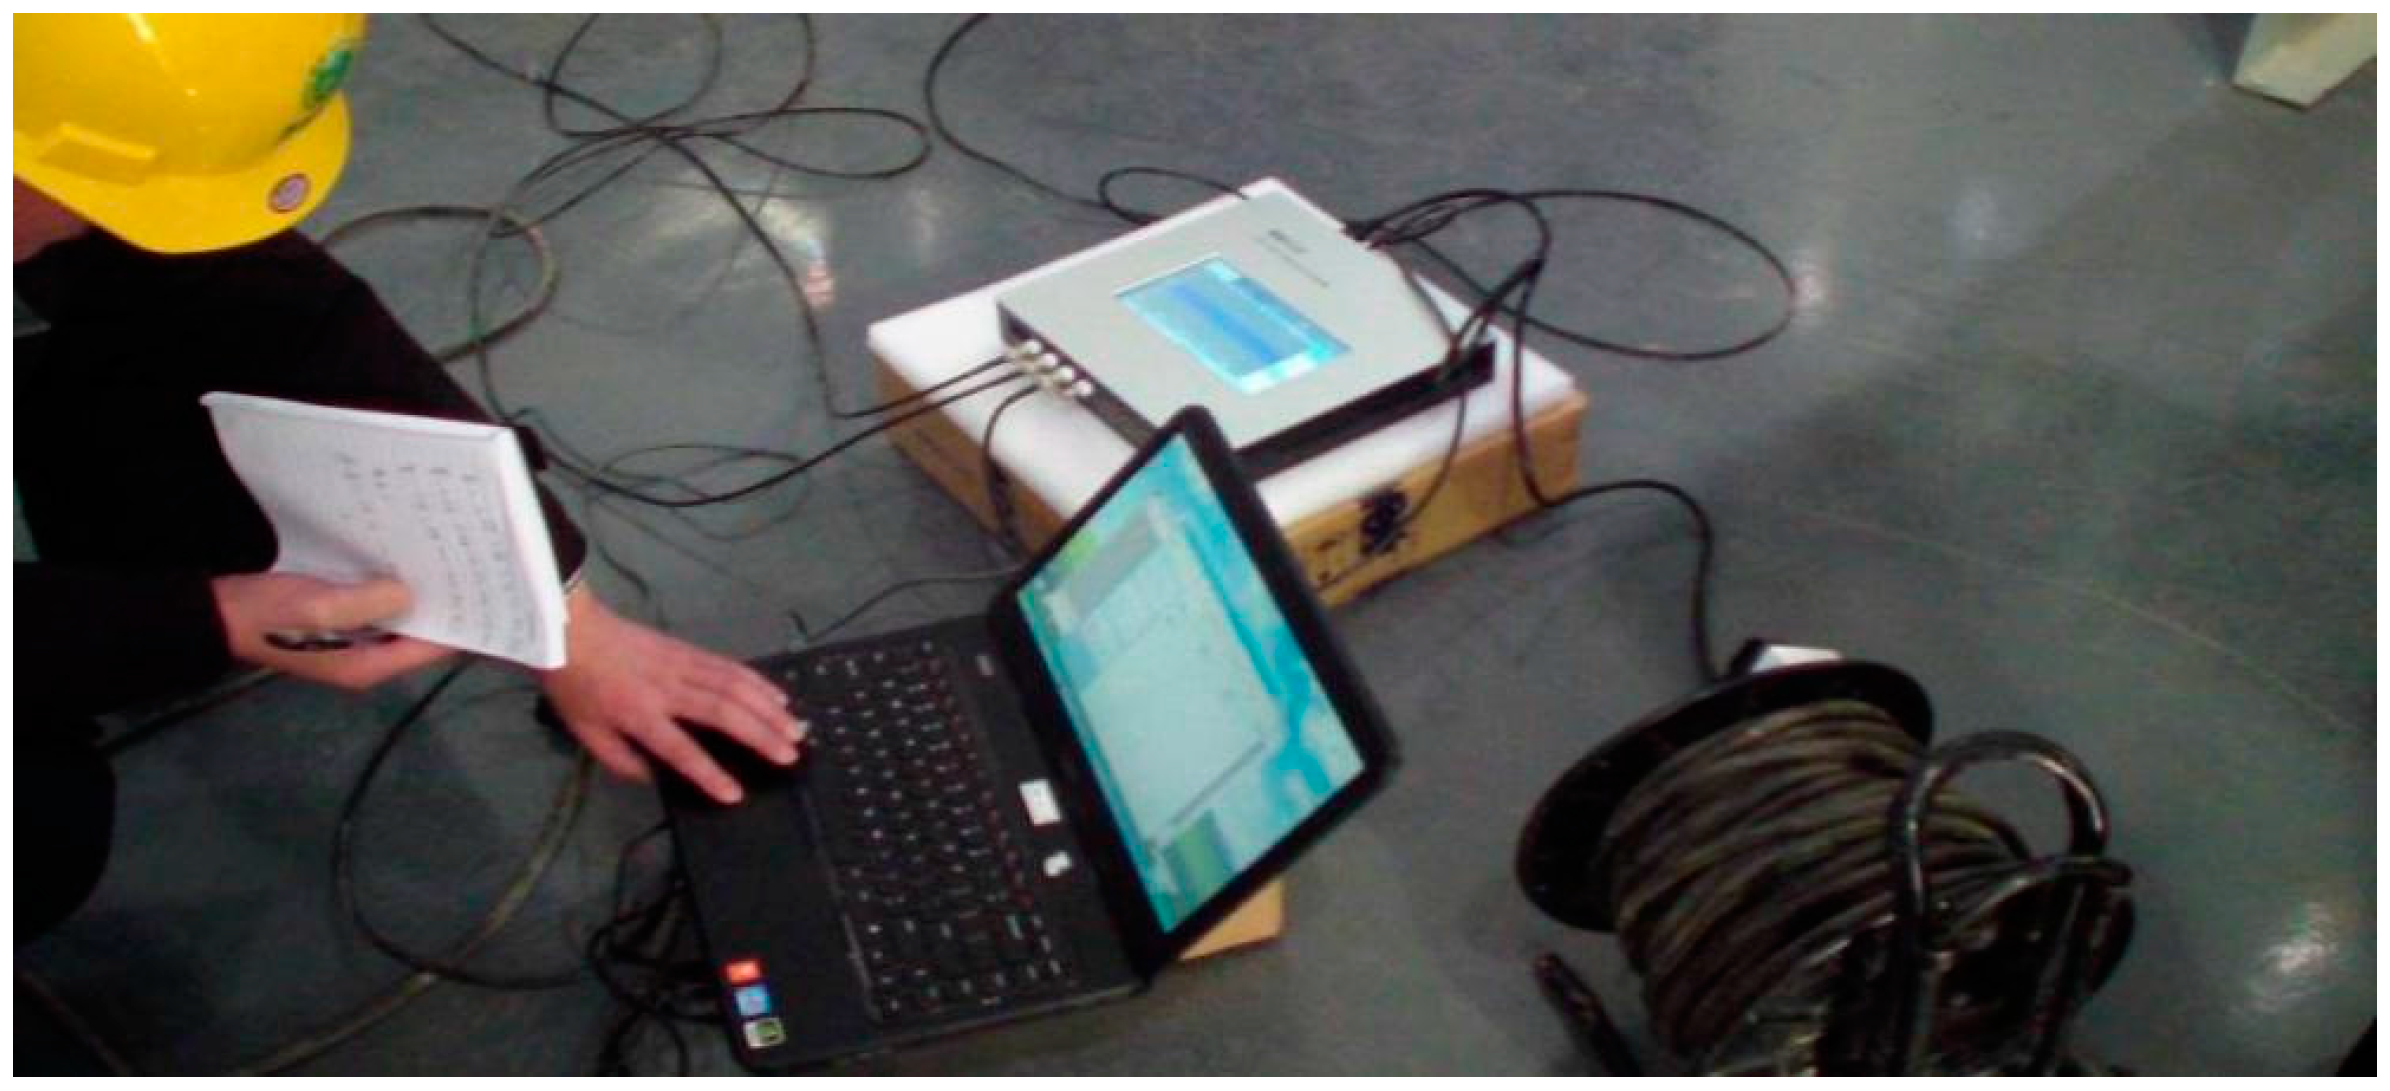
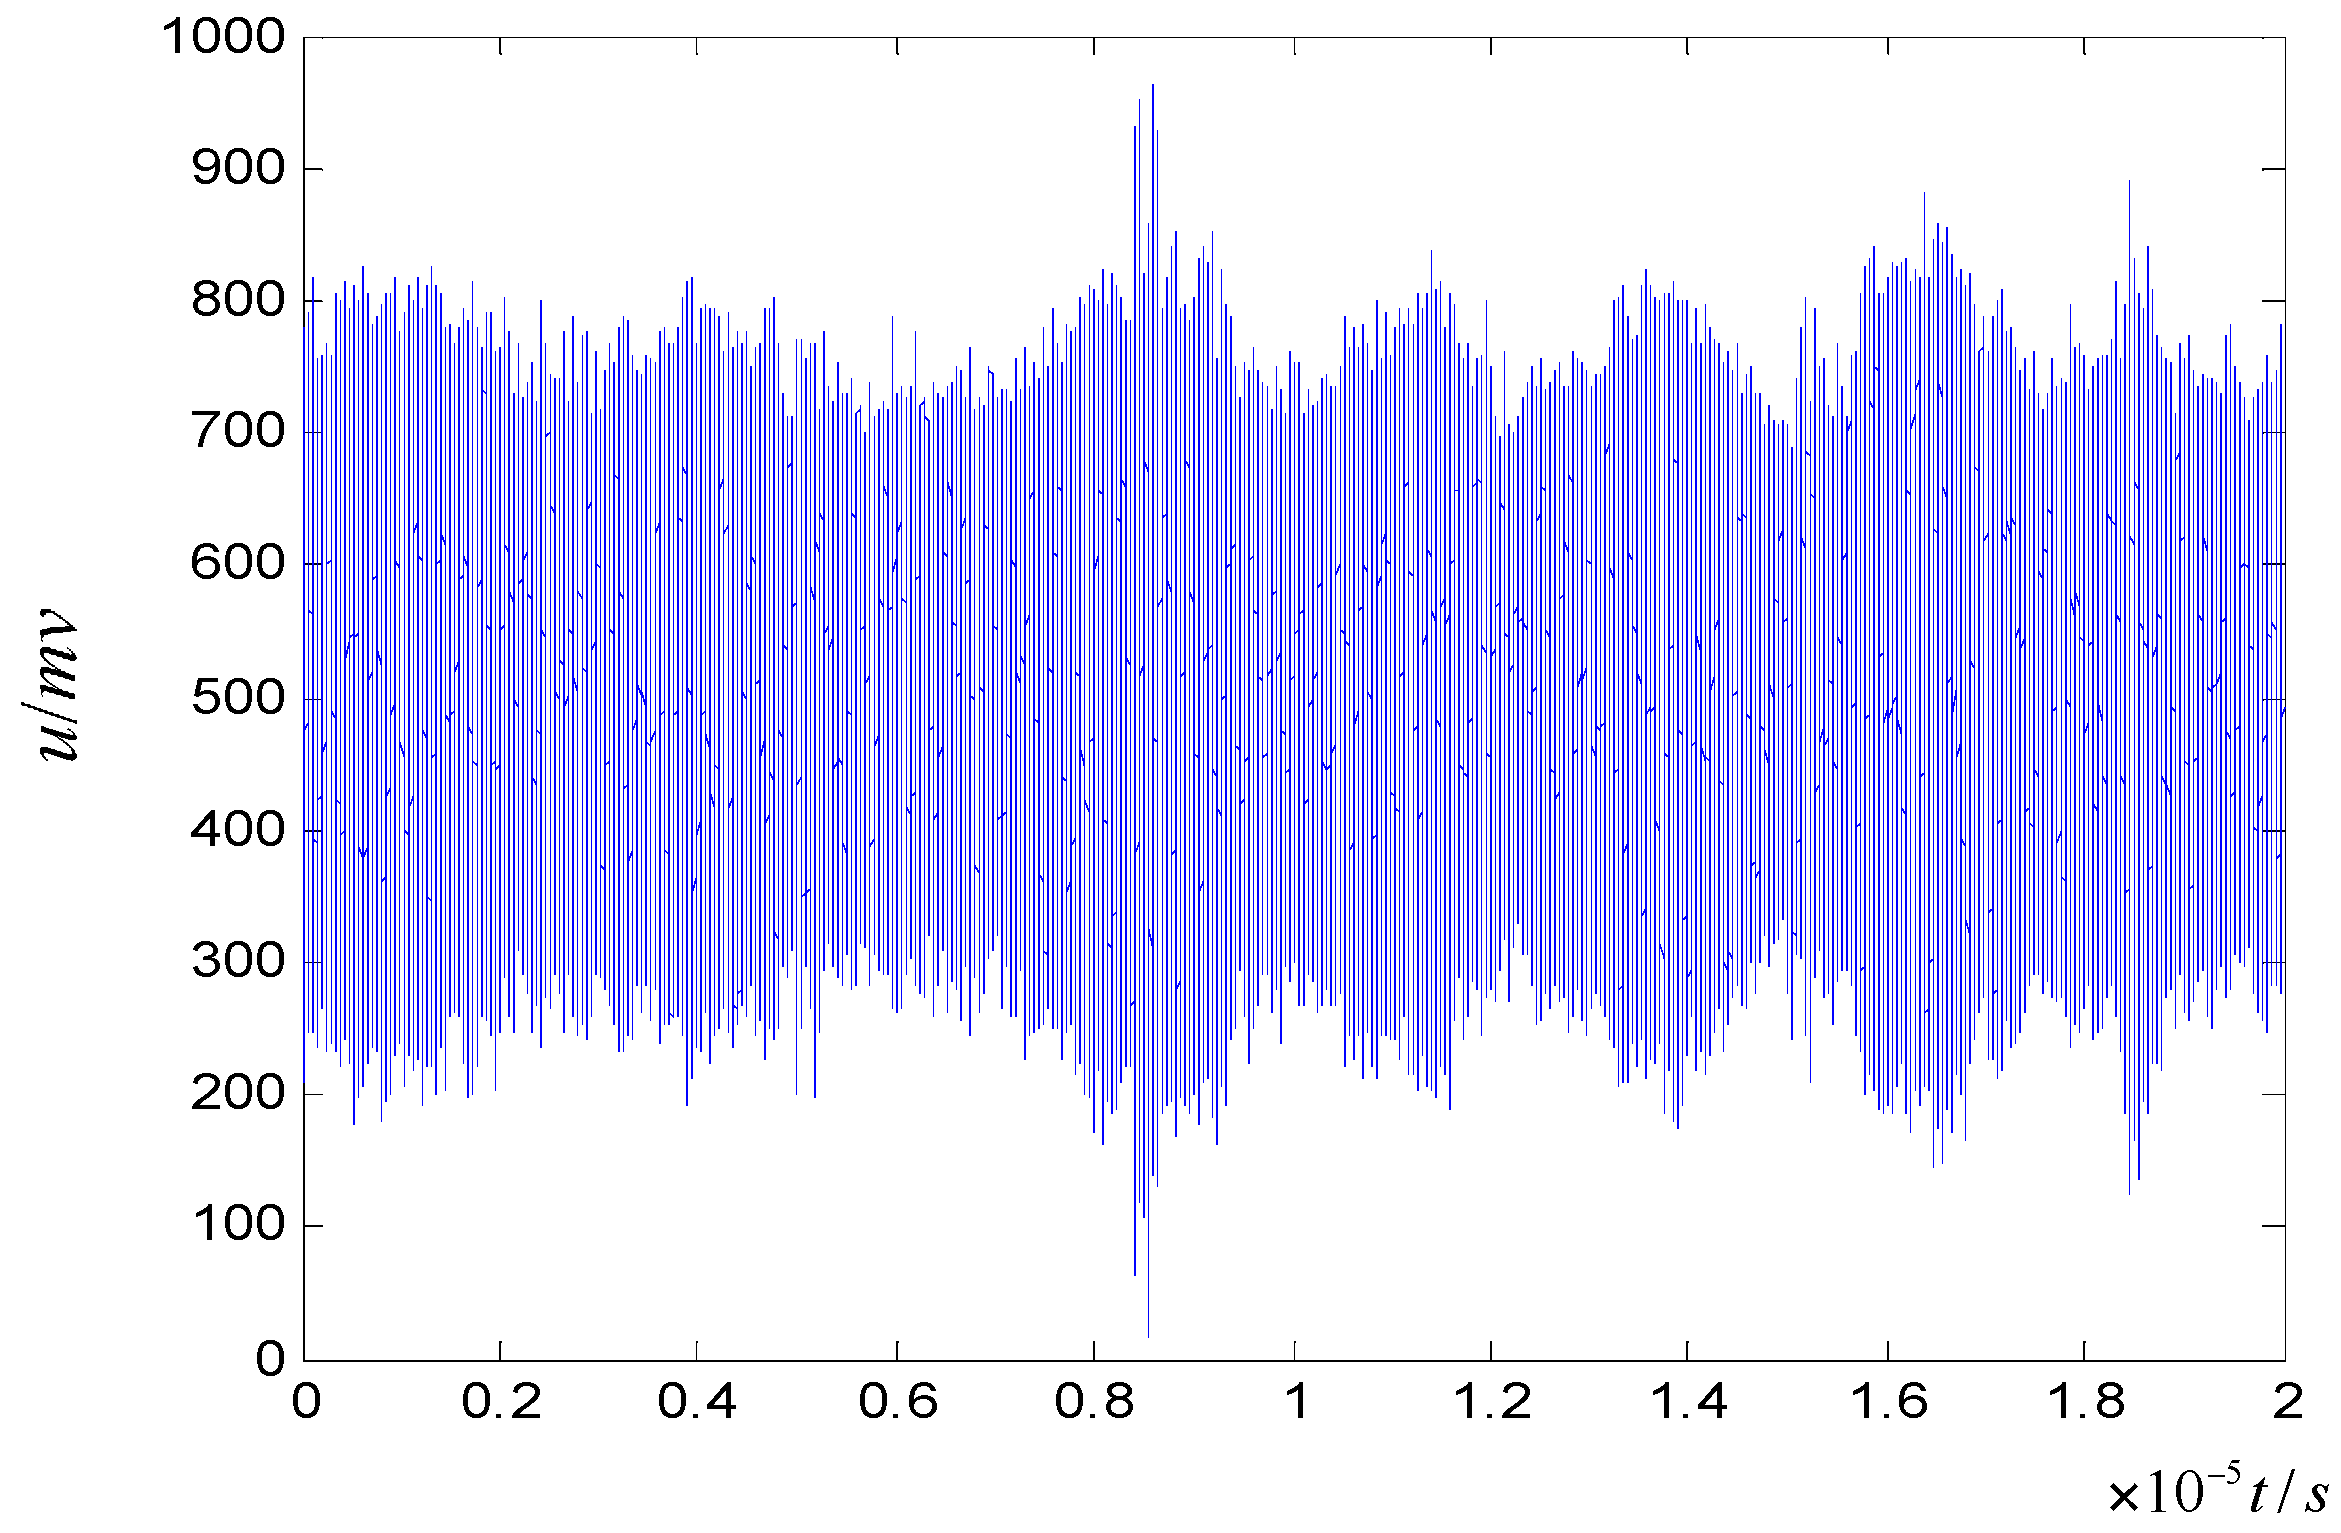
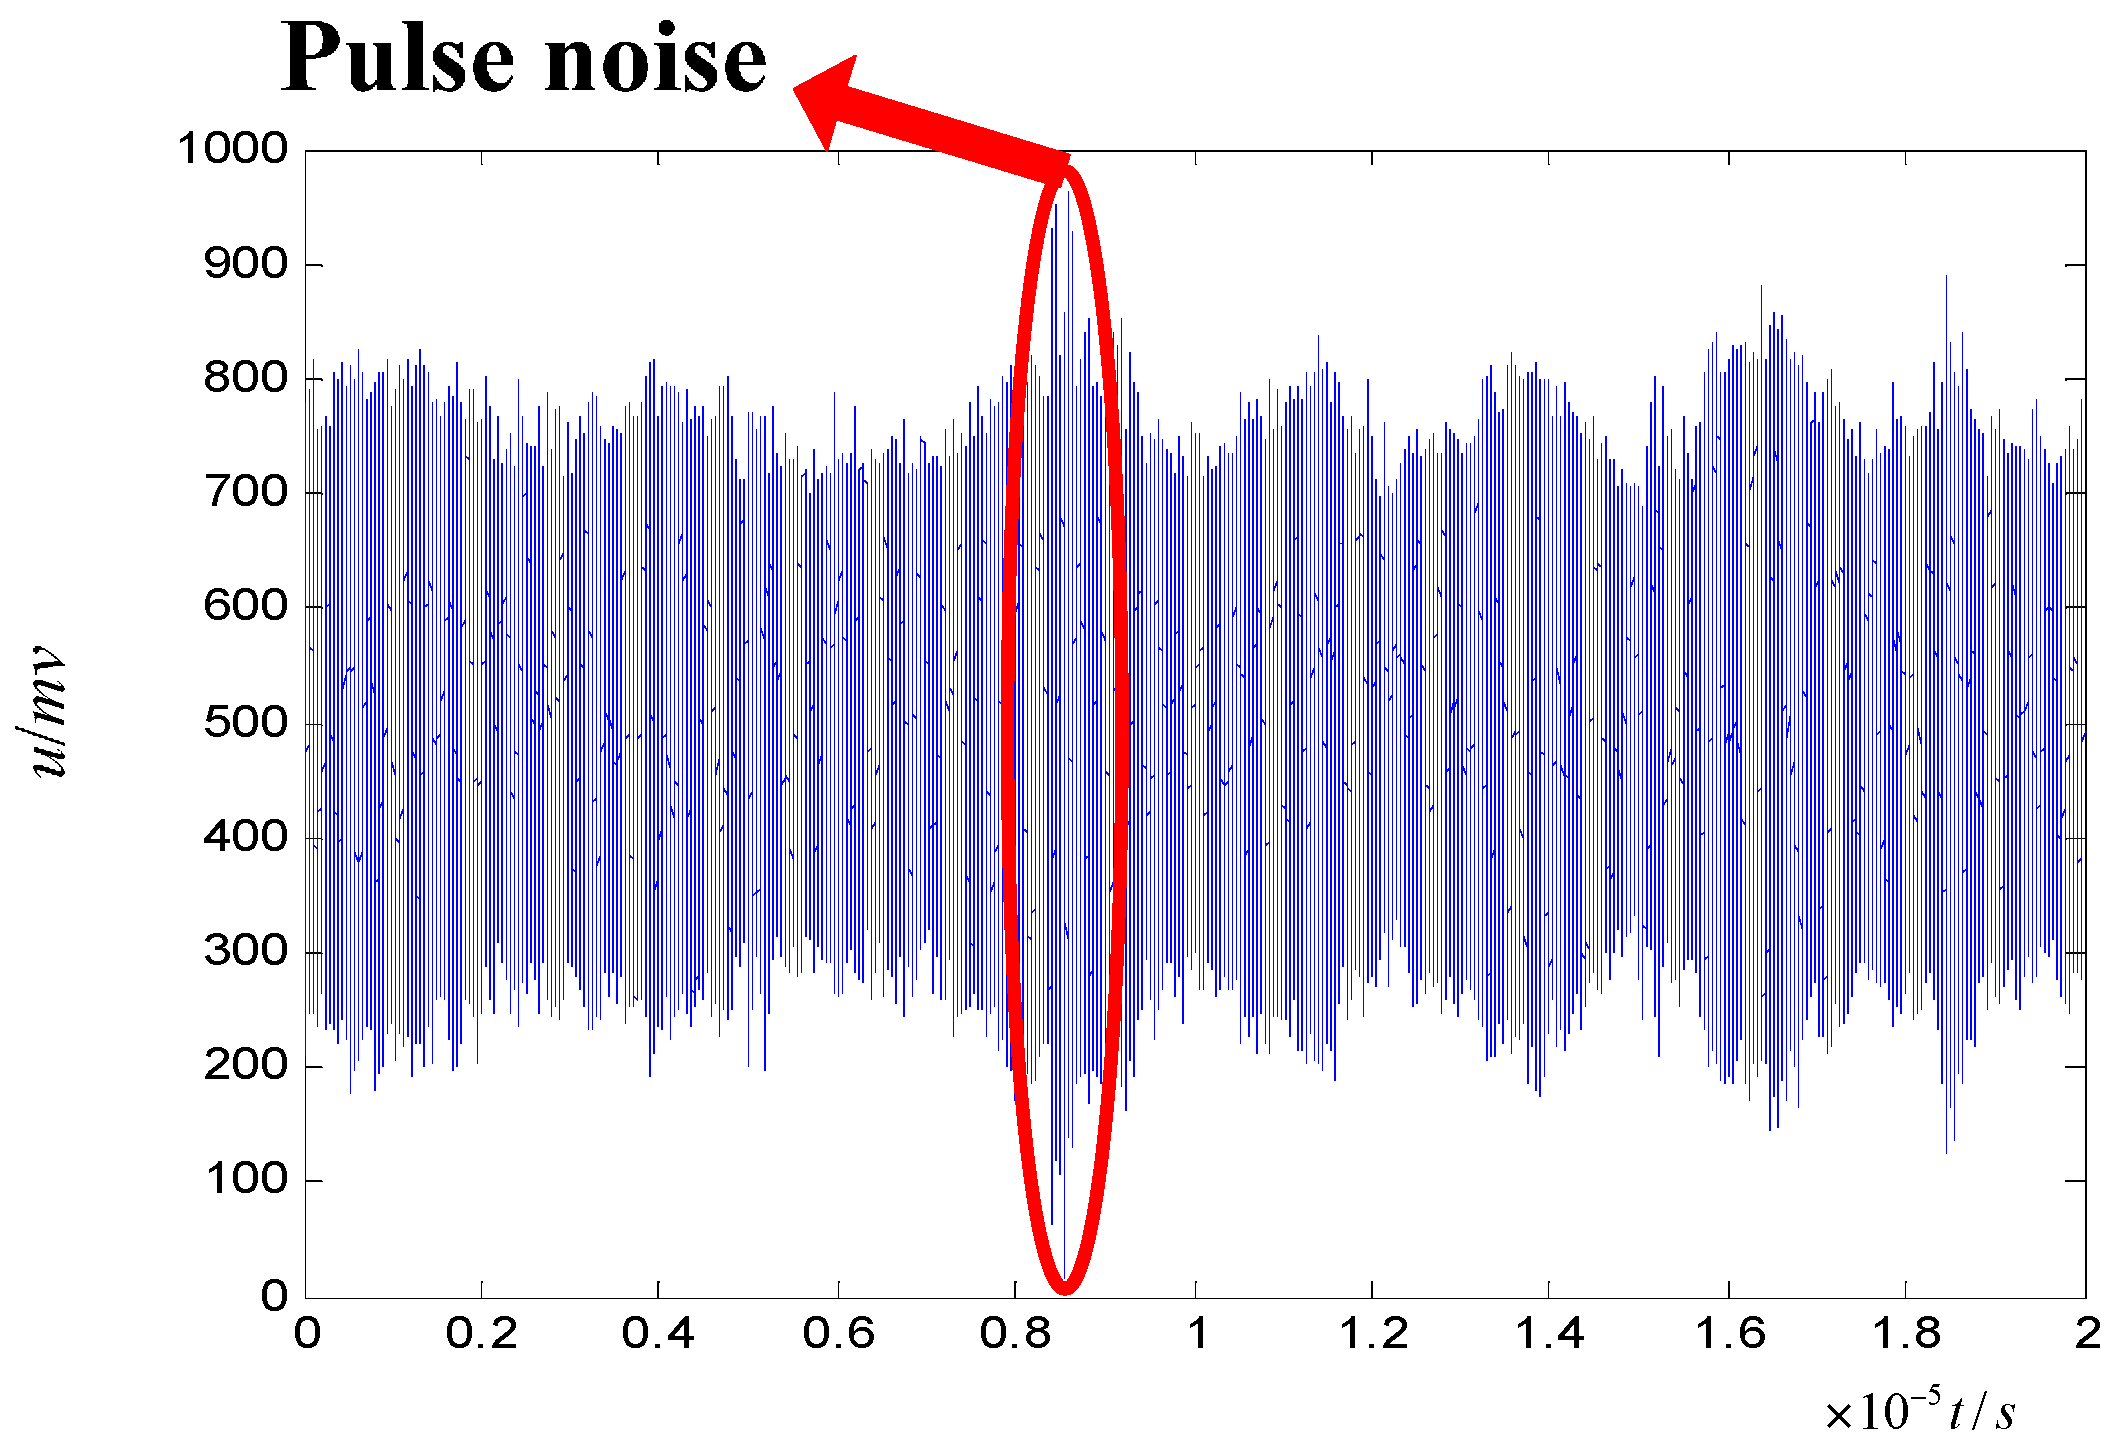
4.1. The Collection of the PD Signal of a Cable Using HFCT

When PD occurs in XLPE cable (Table 1), a high-frequency pulse current will be generated and flows from the high potential of the cable core to the low potential of the metal sheath and passes to the ground through the cross-connection box or ground wire. Therefore, HFCT (bandwidth 0.1~100 MHz) is connected to a cross-connection box or ground wire, and the pulse current signal can be collected based on the principle of electromagnetic coupling and stored in acquisition equipment through coaxial cable. The PD detection process is shown in Figure 4.
Table 1. Specification of the cable.
ModelCable coreCross-sectional areaInsulation layerMetal sheathThe voltage rating
YJLW03Copper splicing wire800 mm²XLPEAluminum127 kV/220 kV
Figure 4. Partial discharge (PD) detection process. (a) Working principle diagram of the high-frequency current transformer (HFCT); (b) Schematic diagram of the PD detection system.
Entropy 17 07698 g004
As shown in Figure 5, the HFCT is installed on the three-phase ground wire of the cross-connection box and is connected to the acquisition terminal APD-120D consisting of the analog to digital (A\D) converter module and the data storage through the coaxial cable. The data collection on the spot is shown in Figure 6.
Figure 5. On-site installation of the HFCT.
Entropy 17 07698 g005
Figure 6. Data collection on the spot.
Entropy 17 07698 g006

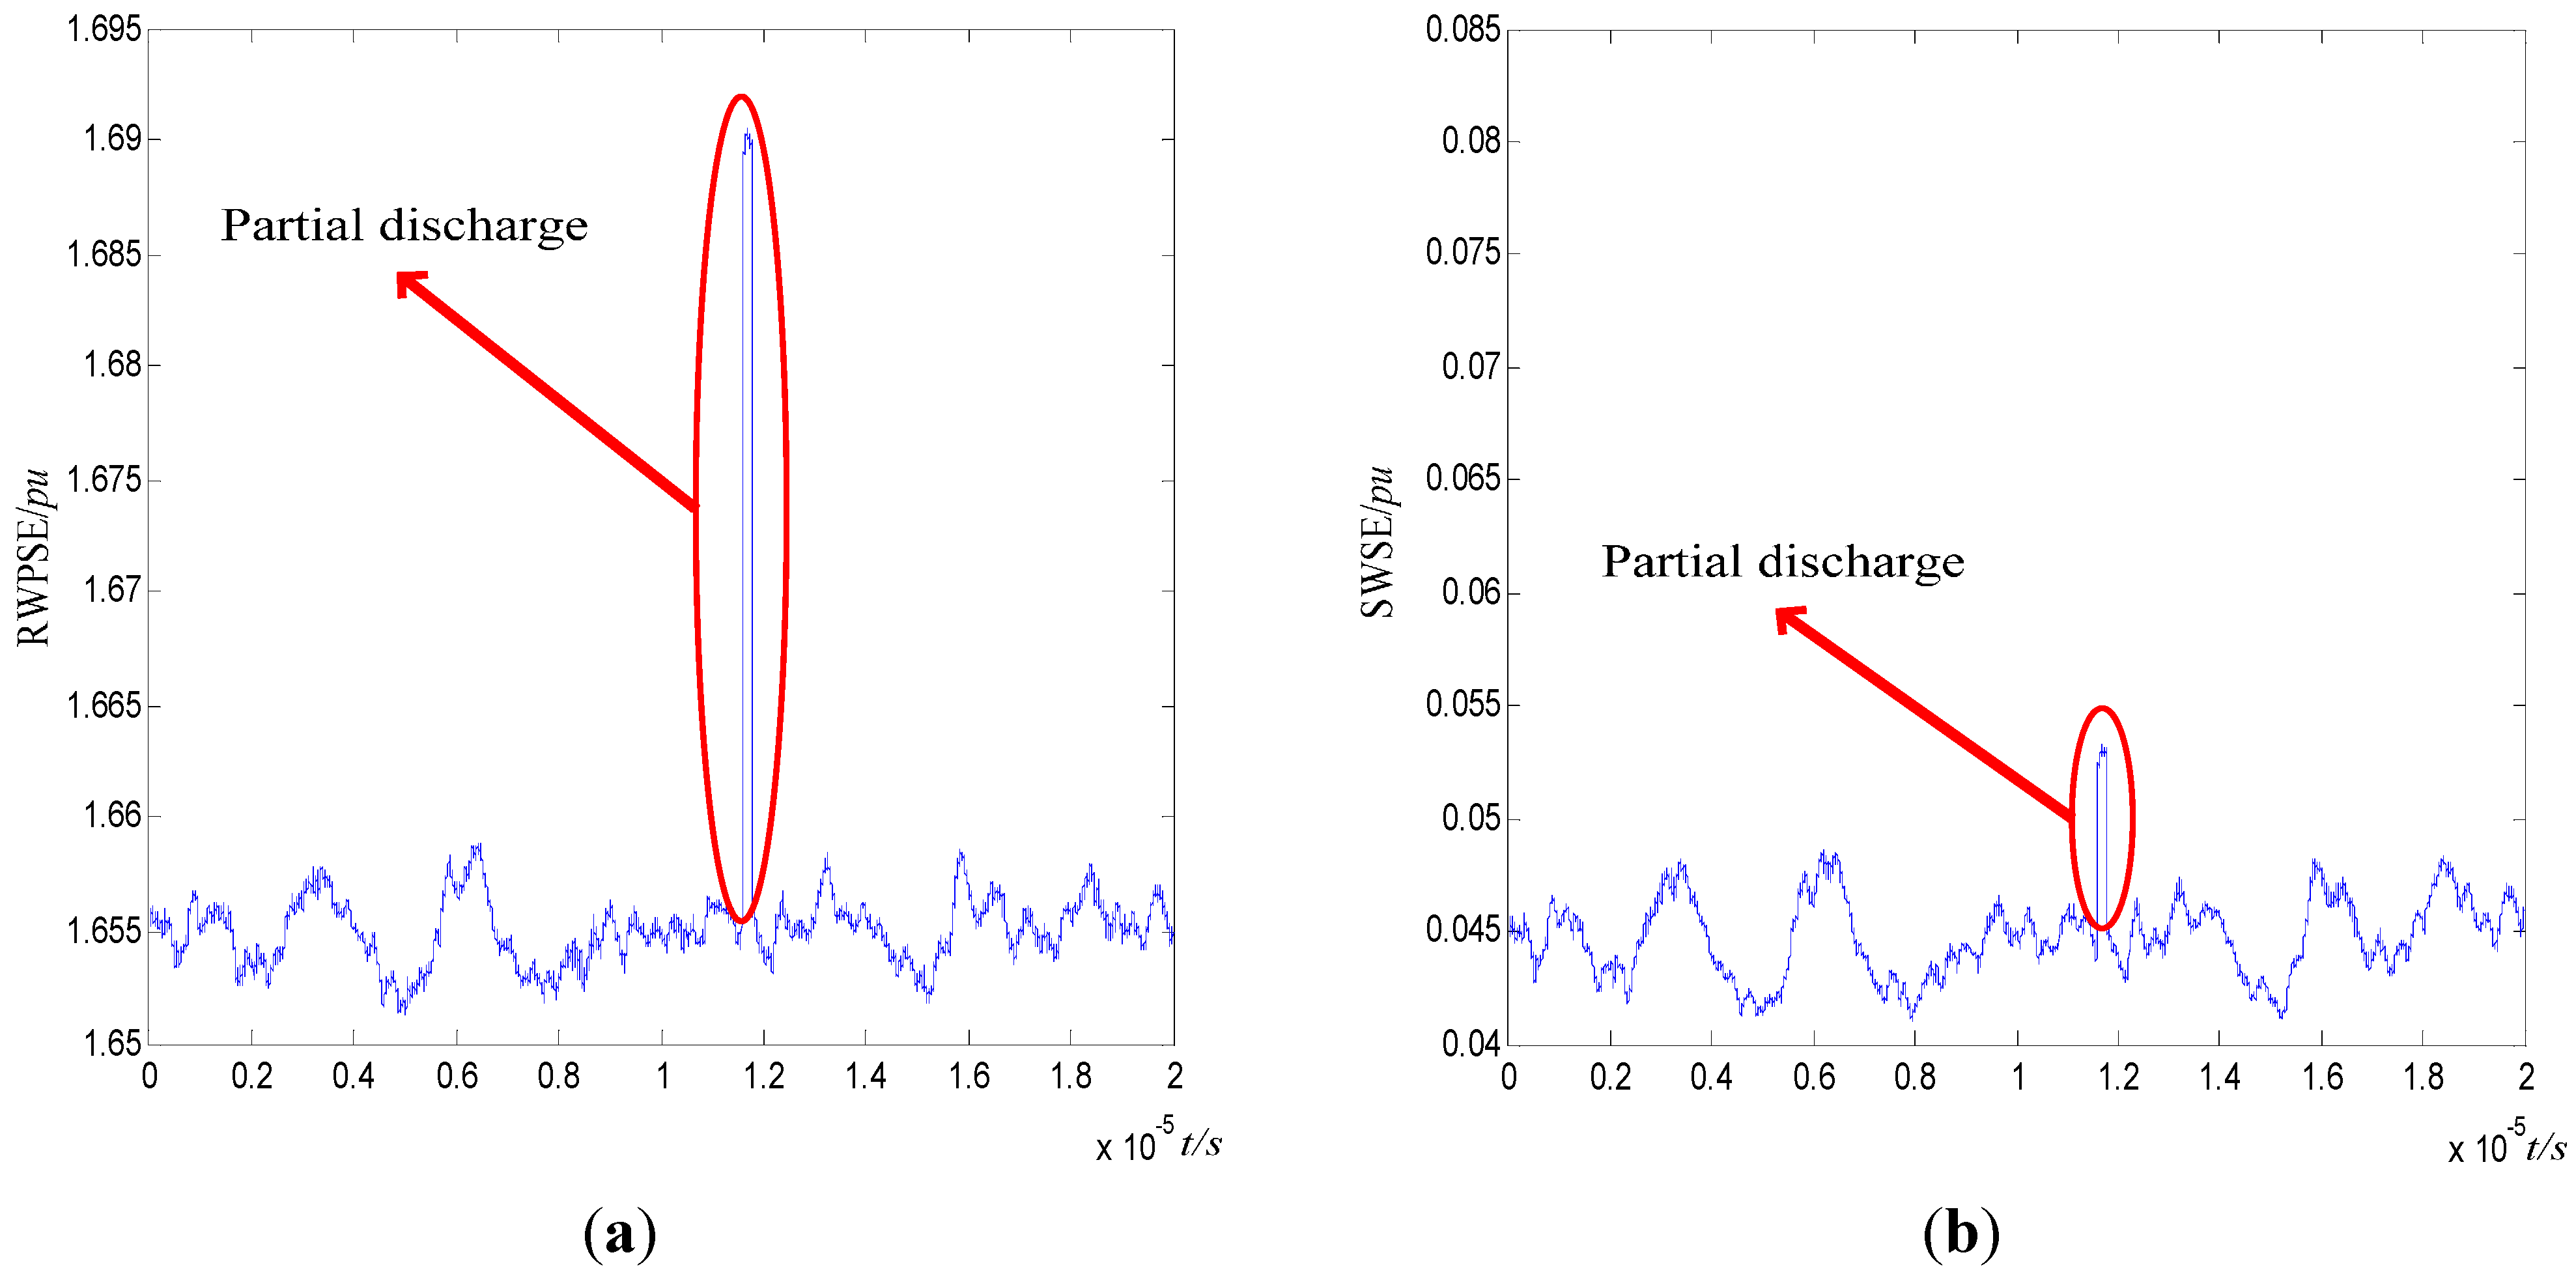
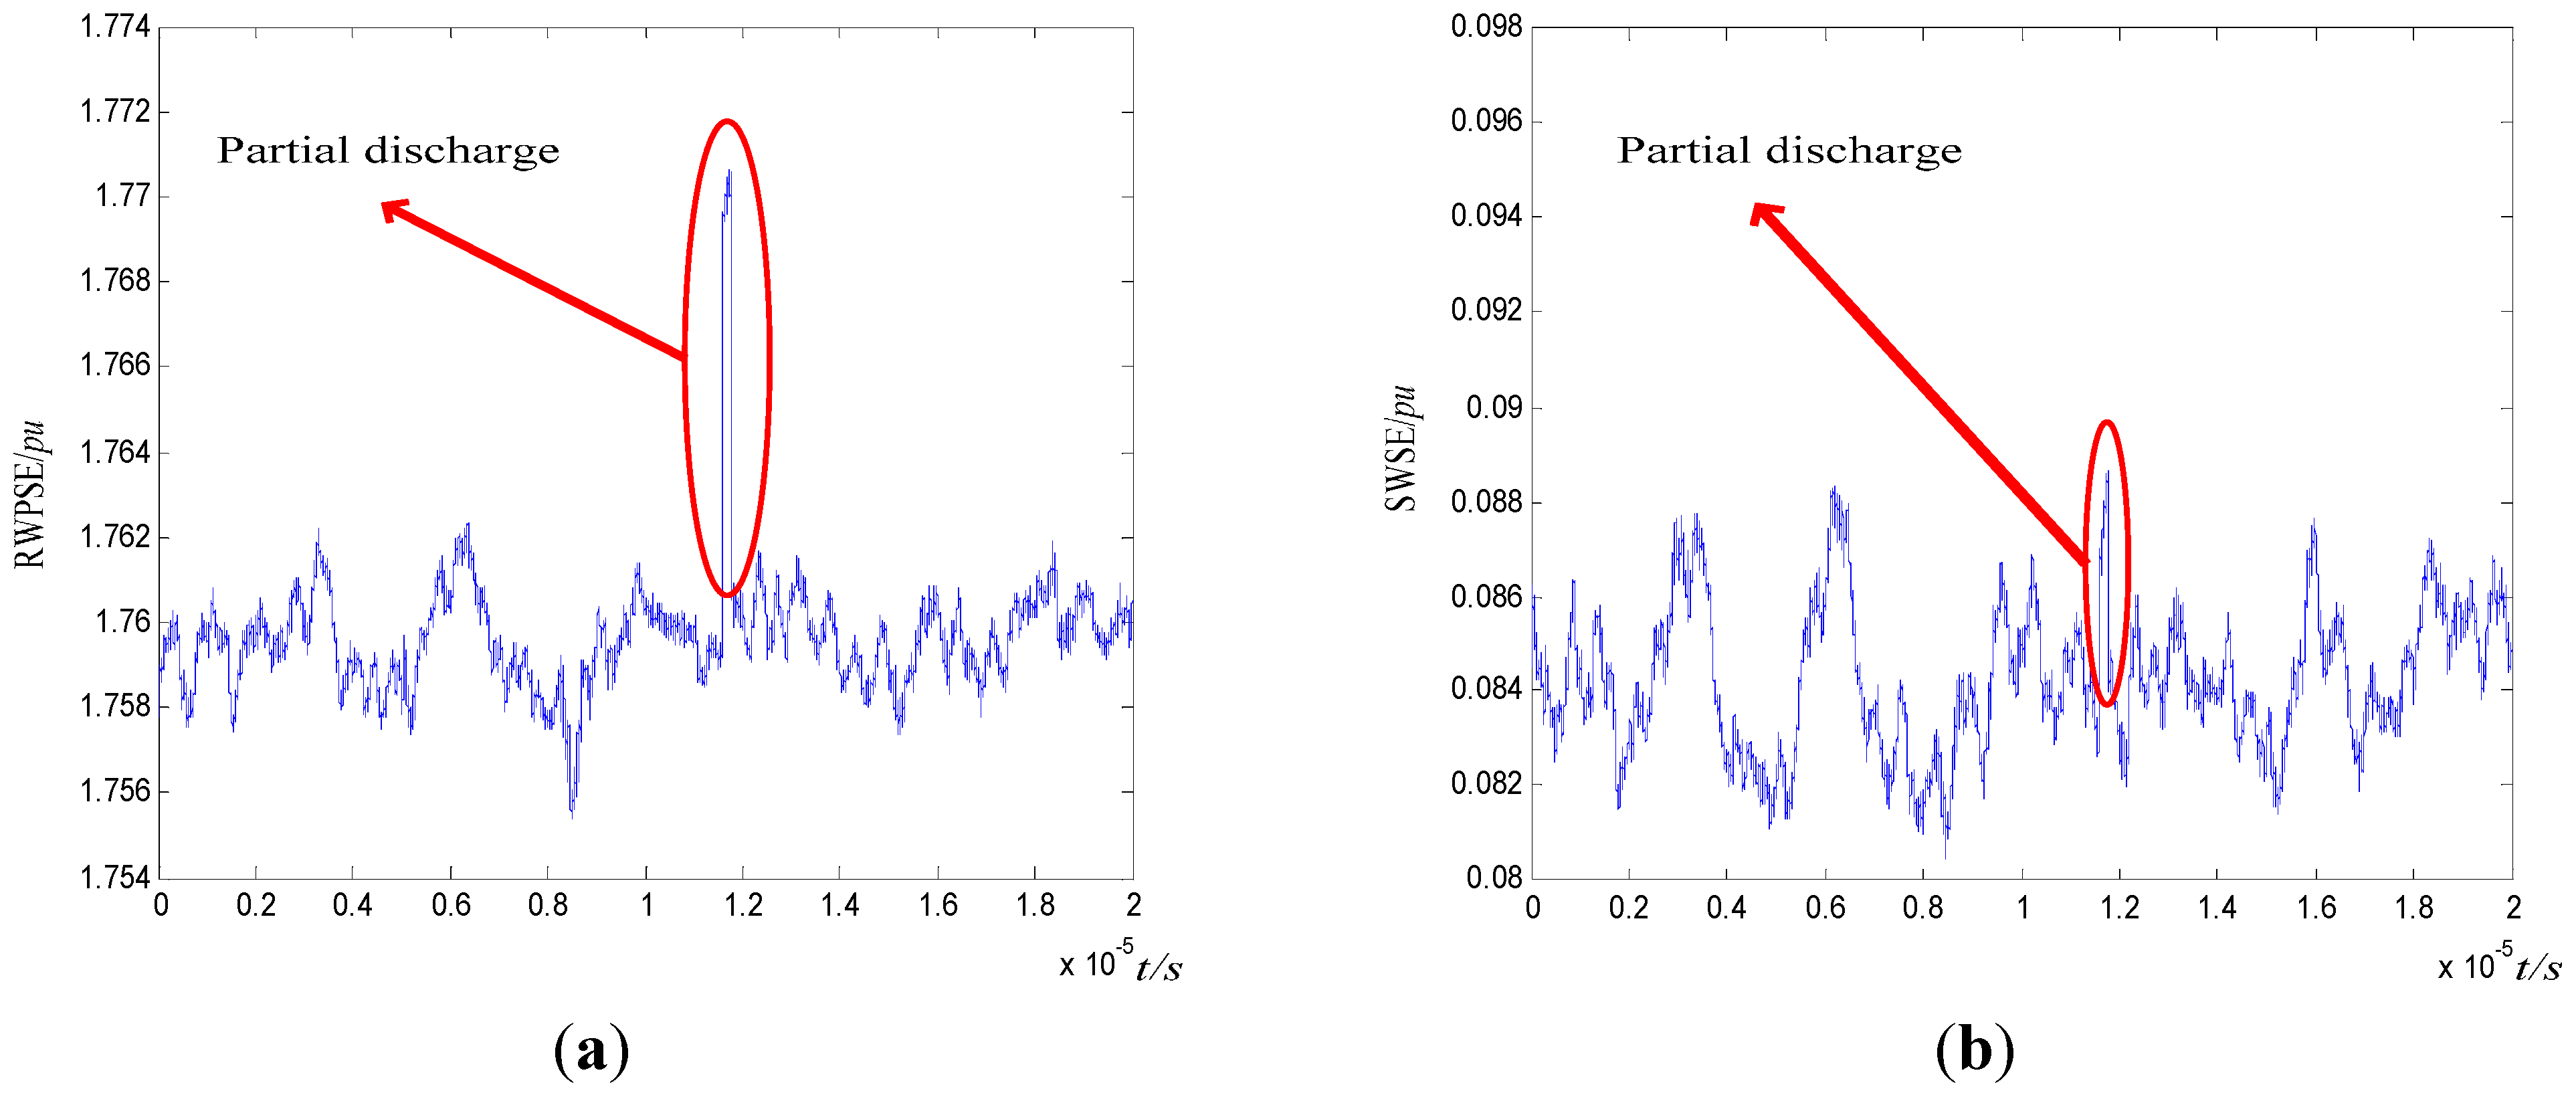
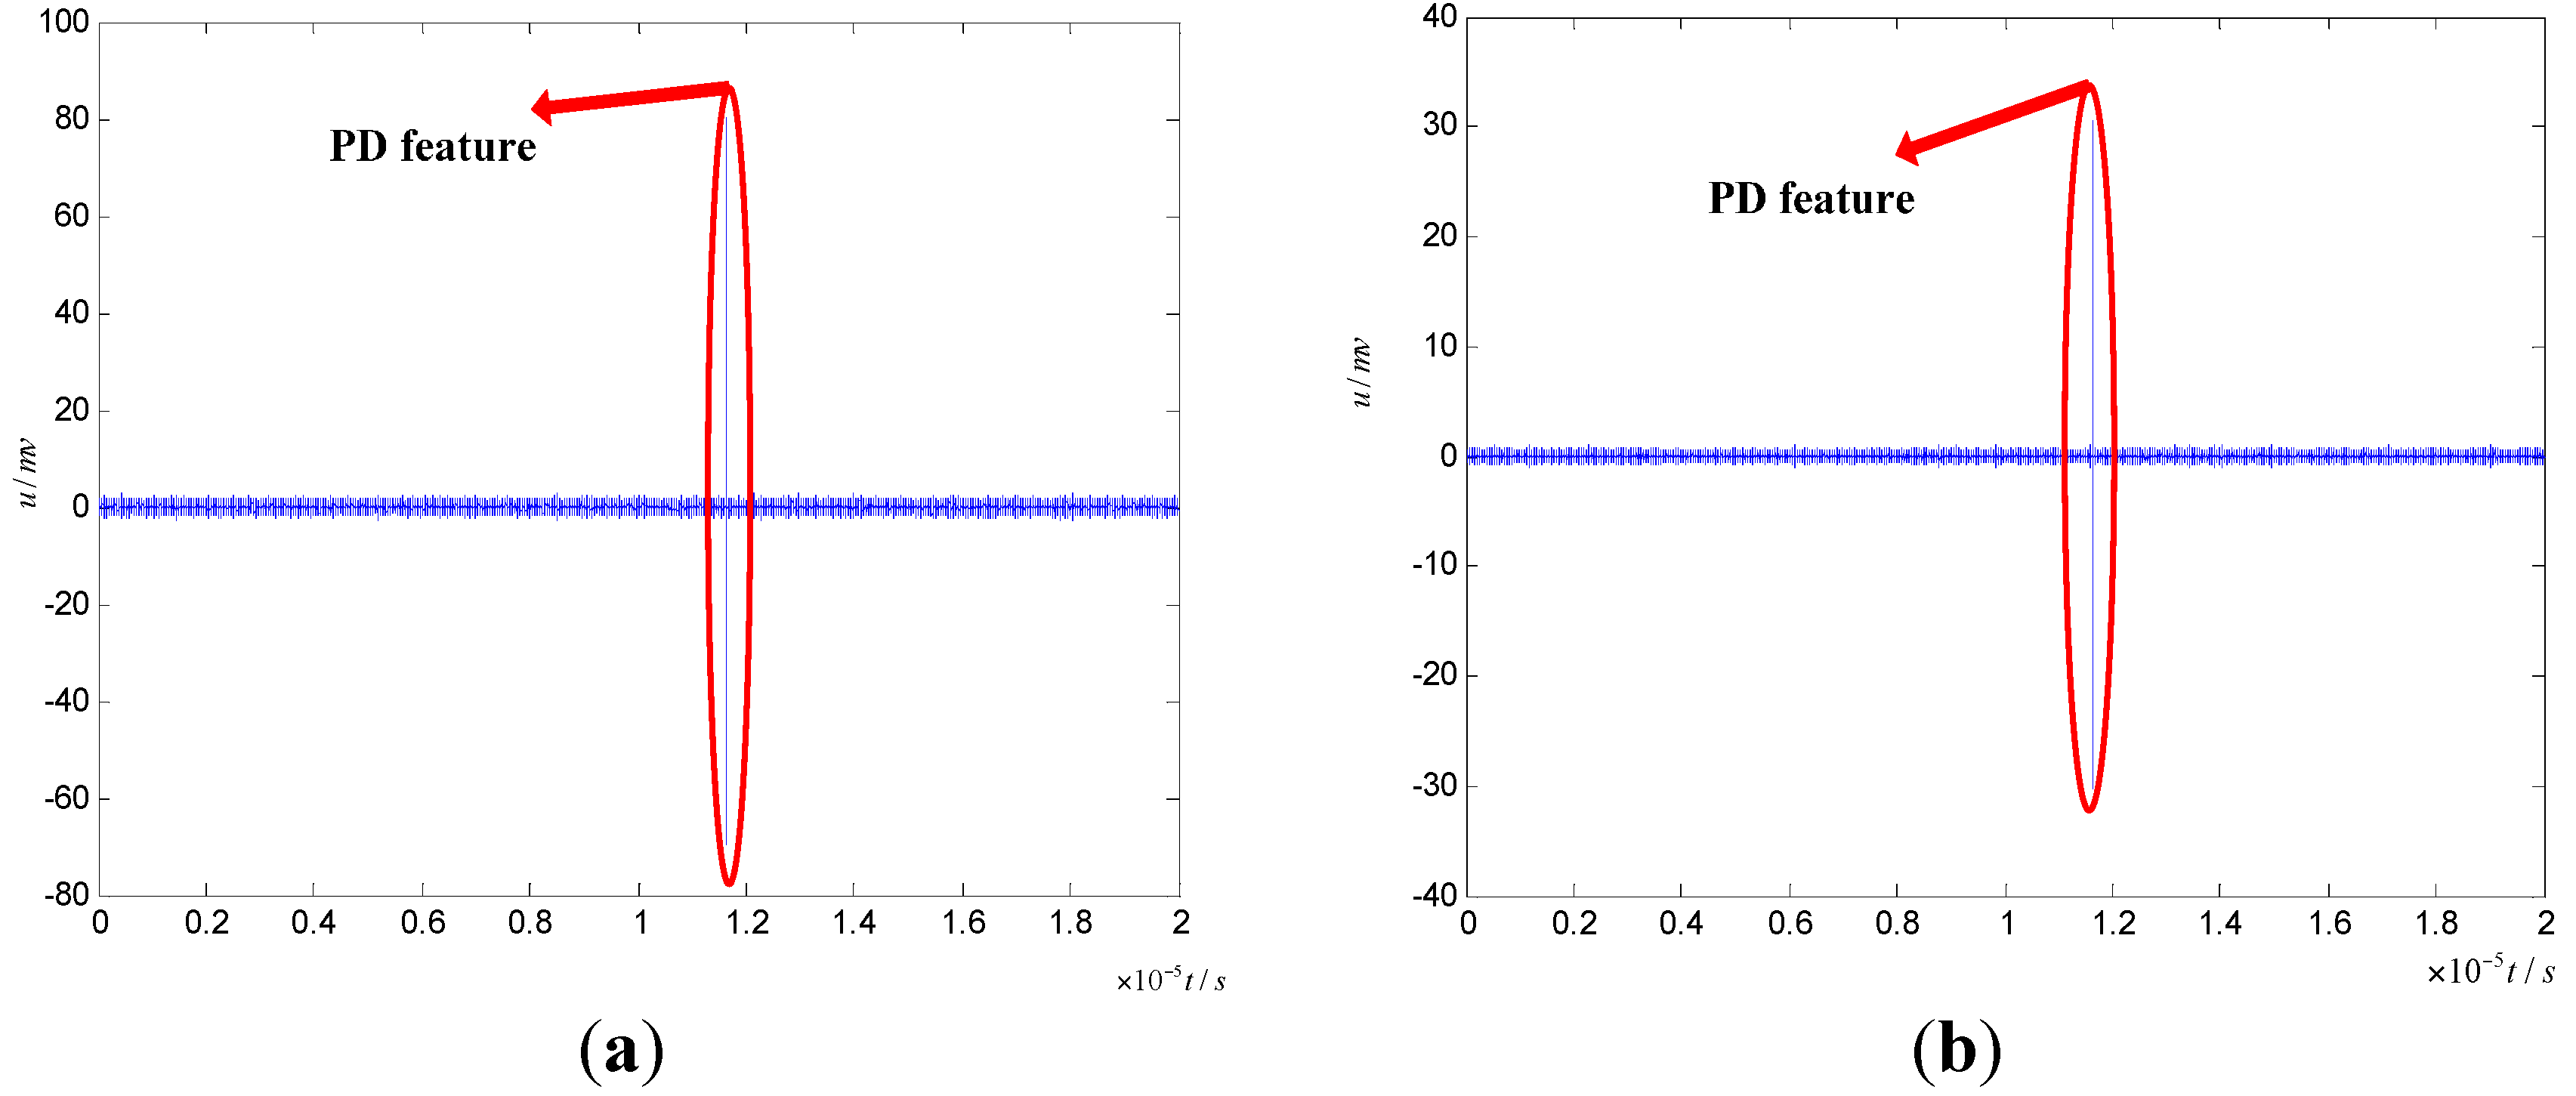
4.2. The Feature Extraction of the PD Signal with RWPSE

(1) Using HFCT and data acquisition equipment to collect the PD signal and the sampling frequency set at 100 MHz, the original PD signal is shown in Figure 7.
Figure 7. PD signal collected by HFCT.
Entropy 17 07698 g007
(2) The original signal is decomposed on Scale 3 by using DWPT, the eight reconstructed signals are obtained. The corresponding frequency band of reconstructed signals are 0~6.25 MHz, 6.25~12.5 MHz, 12.5~18.75 MHz, 18.75~25 MHz, 25~31.25 MHz, 31.25~37.5 MHz, 37.5~43.75 MHz, 43.75~50 MHz.
(3) A sliding window W ( m , w , δ ) , w = 2000 and δ = 5 , is built on the matrix of the reconstructed signals. The diagonal matrix Λ is obtained after SVD is operated in the sliding window; where λ s ( s = 1 , 2 , , g , g min ( S , w ) ) are the main diagonal elements of Λ , and λ 1 λ 2 λ g 0 .
(4) According to the probability of the occurrence of noise and PD and considering the SNR in the original signal, α is set at 0.1 on the basis of the analysis conclusions of Renyi entropy in Section 3.2. From Equation (12), RWPSE is calculated during ( 1 + m δ ) ~ ( w + m δ ) , and the corresponding curve is drawn in Figure 8a. Meanwhile, SWSE is calculated and shown in Figure 8b.
Figure 8. Performance comparison of feature extraction between Renyi wavelet packet singular entropy (RWPSE) and Shannon wavelet singular entropy (SWSE): (a) RWPSE; (b) SWSE.
Entropy 17 07698 g008
From Figure 8, it is known that the feature amplitude of PD extracted by RWPSE is significantly higher than SWSE, which shows that RWPSE has a stronger capability to extract the sophisticated features of PD.
In order to test the anti-interference capability of RWPSE, Gaussian white noise is added to the original signal. The extraction results of PD using RWPSE and SWSE are respectively shown in Figure 9a,b. From Figure 9b, it is known that the PD feature obtained by SWSE is submerged in the background noise, where the noise peak is about 0.007 pu, and the peak of the PD feature is about 0.006 pu. The peak of the PD feature obtained by the RWPSE is 0.013 pu, but the noise peak is only about 0.006 pu, which proves that the anti-interference capability of RWPSE is better than SWSE.
Figure 9. Anti-interference performance comparison between RWPSE and SWSE. (a) RWPSE; (b) SWSE.
Entropy 17 07698 g009

4.3. Analysis of Experimental Results

According to a large amount of historical experimental data using HFCT, we find that the frequency band of background noise is about 0~800 kHz, and the frequency band of the PD signal is 1~30 MHz, which has an obvious difference in the frequency domain. The PD signal is often submerged in strong background noise. Therefore, it is not scientific that the signal amplitude in the time domain is taken as a critical standard to judge PD. The proper way is that analyzing reconstructed signals of high-frequency judges the probability of PD occurrence. In view of the above, the original signal is decomposed by DWT, and reconstructed signals are obtained in different frequency bands. By comparing with Figure 7 and Figure 10, a low-frequency reconstructed signal in 0~0.78 MHz is similar to the original signal in Figure 7. The high-frequency reconstructed signals in 12.5~18.75 MHz and 25~31.25 MHz are shown in Figure 11a,b. From Figure 11, two high-frequency reconstructed signals show an obvious fluctuation during 11.6 and 11.8 μ s , and the signal amplitude is small at all other times, which means that the fluctuation of the original during 8 and 8.5 μ s is pulse noise, and the suspected PD exists during 11.6 and 11.8 μ s . From the above, the conclusion of RWPSE is being proven right.
Figure 10. Low-frequency reconstructed signal in 0~0.78 MHz.
Entropy 17 07698 g010
Figure 11. High-frequency reconstructed signals: (a) in 12.5~18.75 MHz; (b) in 25~31.25 MHz.
Entropy 17 07698 g011

5. Conclusions

The XLPE cable PD signal obtained by HFCT is easily interfered by EMI and has transient characteristics. As a traditional method of transient signal analysis, SWSE can be used to analyze the transient signals to a certain extent, but its accuracy and anti-interference capability are influenced by the high-frequency resolution roughness of DWT and the statistical properties of Shannon entropy. Based on DWPT and Renyi entropy, the RWPSE algorithm is proposed to solve the problem of the SWSE theoretically. DWPT improves the resolution on the low and high frequency bands and obtains better partial enlargement in the high-frequency band, which overcomes the DWT’s limitations of the high-frequency resolution roughness. In the aspect of statistical properties, because of the introduction of α , Renyi entropy is more flexible than the Shannon entropy, and it can select the appropriate α for the different signal features. Based on the above advantages of the RWPSE, it is applied to the PD feature extraction of XLPE cable, and the results are compared to those of SWSE. The experimental results show that RWPSE has more advantages in the PD feature extraction and EMI suppression. The next work will focus on the intrinsic correlation between the value of α of RWPSE and the accuracy of the detection of transient signals.

Acknowledgments

The financial support received from the “Double Ten Project” Jilin Provincial Science & Technology Department, China (Grant No. 20140201005GX), and the Doctoral Scientific Research Foundation of Northeast Dianli University, China (Grant No. BSJXM-201403), is gratefully acknowledged.

Author Contributions

Jikai Chen conceived of the idea. Yanhui Dou and Zhenhao Wang performed the experiments and data analysis. Jikai Chen and Guoqing Li wrote the paper. All authors have read and approved the final manuscript.

Conflicts of Interest

The authors declare no conflict of interest.

References

  1. Liu, Q.; Wang, Z.P.; Zheng, Z.H. Application of wavelet singular entropy theory in transient protection and accelerated trip of transmission line protection. Autom. Electr. Power Syst. 2009, 33, 79–83. [Google Scholar]
  2. Zhang, Y.D.; Dong, Z.C.; Wang, S.H.; Ji, G.L.; Yang, J.Q. Preclinical diagnosis of Magnetic Resonance (MR) brain images via discrete wavelet packet transform with Tsallis entropy and generalized eigenvalue proximal support vector machine. Entropy 2015, 17, 1795–1813. [Google Scholar] [CrossRef]
  3. Chen, X.G.; Liu, D.; Xu, G.H.; Jiang, K.S.; Liang, L. Application of wavelet packet entropy flow manifold learning in bearing factory inspection using the ultrasonic technique. Entropy 2015, 15, 341–351. [Google Scholar] [CrossRef] [PubMed]
  4. Pavle, B.; Dani, J. Fault detection of mechanical drives under variable operating conditions based on wavelet packet Renyi entropy signatures. Mech. Syst. Signal Process. 2012, 31, 369–381. [Google Scholar] [CrossRef]
  5. Xing, Y.F.; Wang, Y.S.; Shi, L.; Guo, H.; Chen, H. Sound quality recognition using optimal wavelet-packet transform and artificial neural network methods. Mech. Syst. Signal Process. 2016, 66–67, 875–892. [Google Scholar] [CrossRef]
  6. Fatemeh, S.; Shyamala, D.; Azreen, A.; Azrul, J.; Asri, R.A.R. Multi-level basis selection of wavelet packet decomposition tree for heart sound classification. Comput. Biol. Med. 2013, 43, 1407–1414. [Google Scholar] [CrossRef] [PubMed] [Green Version]
  7. Banu, G.; Huseyin, H.; Ahmet, M.K. Wavelet packet based analysis of sound fields in rooms using coincident microphone arrays. Appl. Acoust. 2007, 68, 778–796. [Google Scholar] [CrossRef]
  8. Eui, Y.K.; Young, J.L.; Sang, K.L. Heath monitoring of a glass transfer robot in the mass production line of liquid crystal display using abnormal operating sounds based on wavelet packet transform and artificial neural network. J. Sound Vib. 2012, 331, 3412–3427. [Google Scholar] [CrossRef]
  9. Wang, Z.S.; Shaoru, B.; Lei, M.; Zhao, C.G.; Liu, Y.; Zhao, Z.F. Feature extraction and classification of load dynamic characteristics based on lifting wavelet packet transform in power system load modeling. Int. J. Electr. Power Energy Syst. 2014, 62, 353–363. [Google Scholar] [CrossRef]
  10. Walid, G.M.; El-Hawary, M.E. A new reactive, distortion and non-active power measurement method for nonstationary waveforms using wavelet packet transform. Electr. Power Syst. Res. 2009, 79, 1408–1415. [Google Scholar] [CrossRef]
  11. Liu, Z.G.; Yan, C.; Wen, H.L. Combined power quality disturbances recognition using wavelet packet entropies and s-transform. Entropy 2015, 17, 5811–5828. [Google Scholar] [CrossRef]
  12. Chen, J.K.; Li, G.Q. Tsallis wavelet entropy and its application in power singal analysis. Entropy 2014, 16, 3009–3025. [Google Scholar] [CrossRef]
  13. He, Z.Y.; Liu, Z.G.; Qian, Q.Q. Study on wavelet entropy theory and adaptability of its application in power system. Power Syst. Technol. 2004, 28, 17–21. [Google Scholar]
  14. Divjot, K.T.; Sonika, J. A semi blind DWT-SVD video watermarking. Proced. Comput. Sci. 2015, 46, 1661–1667. [Google Scholar] [CrossRef]
  15. Bagci, G.B. The validity of the third law of thermodynamics for the Renyi and homogeneous entropies. Physica A 2015, 437, 405–407. [Google Scholar] [CrossRef]

