
A Refined Multiscale Self-Entropy Approach for the Assessment of Cardiac Control Complexity: Application to Long QT Syndrome Type 1 Patients

 ,
,  ,
,  and
and 
Abstract
:
1. Introduction
2. Methods
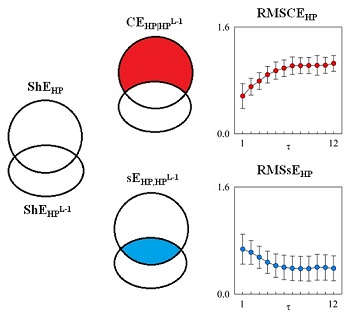
2.1. MSCE and RMSCE
2.2. Estimate of RMSCE and RMSsE
3. Experimental Protocol and Data Analysis
3.1. Study Population and Signal Acquisition
3.2. Series Extraction and Data Analysis
3.3. Statistical Analysis
4. Results

| NMC | AMC | SMC | ||||
|---|---|---|---|---|---|---|
| DAY | NIGHT | DAY | NIGHT | DAY | NIGHT | |
| μHP [ms] | 694 ± 112 | 879 ± 131 * | 830 ± 161 § | 1018 ± 142 *,§ | 757 ± 94 | 951 ± 113 * |
| σ2HP [ms2] | 1108 ± 564 | 2033 ± 1659 | 1651 ± 1057 | 1927 ± 1595 | 1520 ± 1506 | 2169 ± 2151 |
| μQT [ms] | 316 ± 42 | 356 ± 29 * | 420 ± 55 § | 447 ± 45 *,§ | 407 ± 43 § | 445 ± 29 *,§ |
| σ2QT [ms2] | 167 ± 311 | 82 ± 79 | 447 ± 652 § | 92 ± 82 * | 132 ± 84 # | 83 ± 58 |
| μQTc [ms·s−0.5] | 380 ± 30 | 383 ± 28 | 462 ± 34 § | 445 ± 31 *,§ | 469 ± 33 § | 459 ± 25 *,§ |


| Short Time Scale τ = 1 | Medium Time Scale 2 ≤ τ ≤ 4 | Long Time Scale 5 ≤ τ ≤ 12 | ||||
|---|---|---|---|---|---|---|
| r | p | r | p | r | p | |
| HP, NMC DAY | −0.277 | 0.359 | −0.12 | 0.696 | −0.389 | 0.189 |
| HP, AMC DAY | 0.0451 | 0.895 | 0.29 | 0.387 | 0.221 | 0.513 |
| HP, SMC DAY | −0.241 | 0.268 | −0.623 * | 1.51·10−3 * | −0.686 * | 3.03·10−4 * |
| HP, NMC NIGHT | 0.192 | 0.53 | 0.167 | 0.586 | 0.0502 | 0.871 |
| HP, AMC NIGHT | −0.0483 | 0.888 | −0.21 | 0.536 | −0.348 | 0.295 |
| HP, SMC NIGHT | −0.302 | 0.144 | −0.0358 | 0.871 | −0.273 | 0.208 |
| QT, NMC DAY | −0.322 | 0.284 | −0.356 | 0.232 | −0.444 | 0.128 |
| QT, AMC DAY | 0.461 | 0.154 | −0.271 | 0.421 | −0.567 | 0.0687 |
| QT, SMC DAY | 0.0683 | 0.757 | −0.346 | 0.106 | −0.553 * | 6.21·10−3 * |
| QT, NMC NIGHT | −0.303 | 0.315 | −0.376 | 0.206 | −0.462 | 0.112 |
| QT, AMC NIGHT | −0.394 | 0.231 | −0.446 | 0.169 | −0.0189 | 0.956 |
| QT, SMC NIGHT | −0.225 | 0.301 | −0.213 | 0.328 | −0.523 * | 1.04·10−2 * |
5. Discussion
5.1. RMSCE and RMSsE Carry Non-Redundant Information
5.2. RMSCE and RMSsE Reflect DAY-NIGHT Variations
5.3. RMSCE and RMSsE Distinguish LQT1 Individuals with Different Severity of Symptoms
6. Conclusions
Acknowledgments
Author Contributions
Conflicts of Interest
References
- Pincus, S.M. Approximate entropy as a measure of system complexity. Proc. Natl. Acad. Sci. USA 1991, 88, 2297–2311. [Google Scholar] [CrossRef] [PubMed]
- Richman, J.S.; Moorman, J.R. Physiological time-series analysis using approximate entropy and sample entropy. Am. J. Physiol. 2000, 278, H2039–H2049. [Google Scholar]
- Porta, A.; Baselli, G.; Liberati, D.; Montano, N.; Cogliati, C.; Gnecchi-Ruscone, T.; Malliani, A.; Cerutti, S. Measuring regularity by means of a corrected conditional entropy in sympathetic outflow. Biol. Cybern. 1998, 78, 71–78. [Google Scholar] [CrossRef] [PubMed]
- Bandt, C.; Pompe, B. Permutation entropy: A natural complexity measure for time series. Phys. Rev. Lett. 2002, 88, 174102. [Google Scholar] [CrossRef] [PubMed]
- Porta, A.; Faes, L.; Nollo, G.; Bari, V.; Marchi, A.; de Maria, B.; Takahashi, A.C.M.; Catai, A.M. Conditional self-entropy and conditional joint transfer entropy in heart period variability during graded postural challenge. PLoS ONE 2015, 10, e0132851. [Google Scholar] [CrossRef] [PubMed]
- Lizier, J.T.; Pritam, S.; Prokopenko, M. Information dynamics in small-world networks. Artif. Life 2011, 17, 293–314. [Google Scholar] [CrossRef] [PubMed]
- Wibral, M.; Lizier, J.T.; Vogler, S.; Priesemann, V.; Galuske, R. Local active information storage as a tool to understand distributed neural information processing. Front. Neuroinformatics 2014, 8. [Google Scholar] [CrossRef] [PubMed]
- Porta, A.; Guzzetti, S.; Montano, N.; Pagani, M.; Somers, V.K.; Malliani, A.; Baselli, G.; Cerutti, S. Information domain analysis of cardiovascular variability signals: Evaluation of regularity, synchronisation and co-ordination. Med. Biol. Eng. Comput. 2000, 38, 180–188. [Google Scholar] [CrossRef] [PubMed]
- Lizier, J.T.; Prokopenko, M.; Zomaya, A.Y. Local measures of information storage in complex distributed computation. Inform. Sci. 2012, 208, 39–54. [Google Scholar] [CrossRef]
- Faes, L.; Porta, A.; Rossato, G.; Adami, A.; Tonon, D.; Corica, A.; Nollo, G. Investigating the mechanisms of cardiovascular and cerebrovascular regulation in orthostatic syncope through an information decomposition strategy. Auton. Neurosci. Basic Clin. 2013, 178, 76–82. [Google Scholar] [CrossRef] [PubMed]
- Costa, M.; Goldberger, A.L.; Peng, C.-K. Multiscale entropy analysis of complex physiologic time series. Phys. Rev. Lett. 2002, 89, 068102. [Google Scholar] [CrossRef] [PubMed]
- Valencia, J.F.; Porta, A.; Vallverdù, M.; Clarià, F.; Baranowski, R.; Orlowska-Baranowska, E.; Caminal, P. Refined multiscale entropy: Application to 24-h Holter recordings of heart period variability in healthy and aortic stenosis subjects. IEEE Trans. Biomed. Eng. 2009, 56, 2202–2213. [Google Scholar] [CrossRef] [PubMed]
- Bari, V.; Valencia, J.F.; Vallverdù, M.; Girardengo, G.; Marchi, A.; Bassani, T.; Caminal, P.; Cerutti, S.; George, A.L.; Brink, P.A.; et al. Multiscale complexity analysis of the cardiac control identifies asymptomatic and symptomatic patients in long QT syndrome type 1. PLoS ONE 2014, 9, e93808. [Google Scholar] [CrossRef] [PubMed]
- Baumert, M.; Javorka, M.; Seeck, A.; Faber, R.; Sanders, P.; Voss, A. Multiscale entropy and detrended fluctuation analysis of QT interval and heart rate variability during normal pregnancy. Comput. Biol. Med. 2012, 42, 347–352. [Google Scholar] [CrossRef] [PubMed]
- Turianikova, Z.; Javorka, K.; Baumert, M.; Calkovska, A.; Javorka, M. The effect of orthostatic stress on multiscale entropy of heart rate and blood pressure. Physiol. Meas. 2011, 32, 1425–1437. [Google Scholar] [CrossRef] [PubMed]
- Humeau, A.; Mahé, G.; Chapeau-Blondeau, F.; Rousseau, D.; Abraham, P. Multiscale analysis of microvascular blood flow: A multiscale entropy study of laser Doppler flowmetry time series. IEEE Trans. Biomed. Eng. 2011, 58, 2970–2973. [Google Scholar] [CrossRef] [PubMed] [Green Version]
- Hu, J.; Gao, J.; Tung, W.-W.; Cao, Y. Multiscale analysis of heart rate variability: A comparison of different complexity measures. Ann. Biomed. Eng. 2010, 38, 854–864. [Google Scholar] [CrossRef] [PubMed]
- Brink, P.A.; Crotti, L.; Corfield, V.; Goosen, A.; Durrheim, G.; Hedley, P.; Heradien, M.; Geldenhuys, G.; Vanoli, E.; Bacchini, S.; et al. Phenotypic variability and unusual clinical severity of congenital long-QT syndrome in a founder population. Circulation 2005, 112, 2602–2610. [Google Scholar] [CrossRef] [PubMed]
- Brink, P.A.; Schwartz, P.J. Of founder populations, long QT syndrome, and destiny. Heart Rhythm 2009, 6, S25–S33. [Google Scholar] [CrossRef] [PubMed]
- Takens, F. Detecting strange attractors in fluid turbulence. In Dynamical Systems and Turbulence; Rand, D., Young, L.S., Eds.; Springer: Berlin, Germany, 1981; pp. 366–381. [Google Scholar]
- Runge, J.; Heitzig, J.; Petoukhov, V.; Kurths, J. Escaping the curse of dimensionality in estimating multivariate transfer entropy. Phys. Rev. Lett. 2012, 108, 258701. [Google Scholar] [CrossRef] [PubMed]
- Porta, A.; Baselli, G.; Lombardi, F.; Cerutti, S.; Antolini, R.; Del Greco, M.; Ravelli, F.; Nollo, G. Performance assessment of standard algorithms for dynamic R-T interval measurement: Comparison between R-Tapex and R-Tend approach. Med. Biol. Eng. Comput. 1998, 36, 35–42. [Google Scholar] [CrossRef] [PubMed]
- Bazett, H.C. An analysis of the time-relations of electrocardiograms. Heart 1920, 7, 353–370. [Google Scholar] [CrossRef]
- Task Force of the European Society of Cardiology; The North American Society of Pacing and Electrophysiology. Heart rate variability—Standards of measurement, physiological interpretation and clinical use. Circulation 1996, 93, 1043–1065. [Google Scholar] [CrossRef] [PubMed]
- Koepchen, H.P. Physiology of rhythms and control systems: An integrative approach. In Rhythms in Physiological Systems; Haken, H., Koepchen, H.P., Eds.; Springer: Berlin, Germany, 1991; pp. 3–20. [Google Scholar]
- Porta, A.; Baselli, G.; Guzzetti, S.; Pagani, M.; Malliani, A.; Cerutti, S. Prediction of short cardiovascular variability signals based on conditional distribution. IEEE Trans. Biomed. Eng. 2000, 47, 1555–1564. [Google Scholar] [PubMed]
- Molnar, J.; Weiss, J.S.; Rosenthal, J.E. The missing second: What is the correct unit for the Bazett corrected QT interval? Am. J. Cardiol. 1995, 75, 537–538. [Google Scholar] [CrossRef]
- Pueyo, E.; Smetana, P.; Caminal, P.; de Luna, A.B.; Malik, M.; Laguna, P. Characterization of QT interval adaptation to RR interval changes and its use as a risk-stratifier of arrhythmic mortality in Amiodarone-treated survivors of acute myocardial infarction. IEEE Trans. Biomed. Eng. 2004, 51, 1511–1520. [Google Scholar] [CrossRef] [PubMed]
- Ahnve, S.; Vallin, H. Influence of heart rate and inhibition of autonomic tone on the QT interval. Circulation 1982, 65, 435–439. [Google Scholar] [CrossRef] [PubMed]
- Magnano, A.R.; Holleran, S.; Ramakrishnan, R.; Reiffel, J.A.; Bloomfiled, D.M. Autonomic nervous system influences on QT interval in normal subjects. J. Am. Coll. Cardiol. 2002, 39, 1820–1826. [Google Scholar] [CrossRef]
- Shimizu, W.; Tsuchioka, Y.; Karawana, S.; Nagata, K.; Mukai, J.; Yamagata, T.; Matsuura, H.; Kajiyama, G.; Matsuura, Y. Differential effect of pharmacological autonomic blockade on some electrophysiological properties of the human ventricle and atrium. Br. Heart J. 1994, 71, 34–37. [Google Scholar] [CrossRef] [PubMed]
- Porta, A.; Baselli, G.; Caiani, E.; Malliani, A.; Lombardi, F.; Cerutti, S. Quantifying electrocardiogram RT-RR variability interactions. Med. Biol. Eng. Comput. 1998, 36, 27–34. [Google Scholar] [CrossRef] [PubMed]
- Negoescu, R.; Dinca-Panaitescu, S.; Filcescu, V.; Ionescu, D.; Wolf, S. Mental stress enhances the sympathetic fraction of QT variability in an RR-independent way. Integr. Phys. Beh. Sci. 1997, 32, 220–227. [Google Scholar] [CrossRef]
- Rickards, A.F.; Norman, J. Relation between QT interval and heart rate. New design of physiologically adaptive cardiac pacemaker. Br. Heart J. 1981, 45, 56–61. [Google Scholar] [CrossRef] [PubMed]
- Milne, J.R.; Ward, D.E.; Spurrell, R.A.; Camm, A.J. The ventricular paced QT interval—The effects of rate and exercise. Pacing Clin. Electrophysiol. 1982, 5, 352–358. [Google Scholar] [CrossRef] [PubMed]
- Browne, K.F.; Prystowsky, E.; Heger, J.J.; Zipes, D.P. Modulation of Q-T interval by the autonomic nervous system. Pacing Clin. Electrophysiol. 1983, 6, 1050–1055. [Google Scholar] [CrossRef] [PubMed]
- Porta, A.; Tobaldini, E.; Gnecchi-Ruscone, T.; Montano, N. RT variability unrelated to heart period and respiration progressively increases during graded head-up tilt. Am. J. Physiol. 2010, 298, H1406–H1414. [Google Scholar] [CrossRef] [PubMed]
- Bari, V.; Marchi, A.; de Maria, B.; Girardengo, G.; George, A.L.; Brink, P.A.; Cerutti, S.; Crotti, L.; Schwartz, P.J.; Porta, A. Low-pass filtering approach via empirical mode decomposition improves short-scale entropy-based complexity estimation of QT interval variability in long QT syndrome type 1 patients. Entropy 2014, 16, 4839–4854. [Google Scholar] [CrossRef]
- Lewis, M.J.; Short, A.L. Sample entropy of electrocardiographic RR and QT time-series data during rest and exercise. Physiol. Meas. 2007, 28, 731–744. [Google Scholar] [CrossRef] [PubMed]
- Bar, K.-J.; Koschke, M.; Berger, S.; Schulz, S.; Tancer, M.; Voss, A.; Yeragani, V.K. Influence of Olanzapine on QT variability and complexity measures of heart rate in patients with schizophrenia. J. Clin. Psychopharm. 2008, 28, 694–698. [Google Scholar] [CrossRef] [PubMed]
- Baumert, M.; Starc, V.; Porta, A. Conventional QT variability measurement vs. template matching techniques: Comparison of performance using simulated and real ECG. PLoS ONE 2012, 7, e41920. [Google Scholar] [CrossRef] [PubMed]
- Porta, A.; Faes, L.; Masé, M.; D'Addio, G.; Pinna, G.D.; Maestri, R.; Montano, N.; Furlan, R.; Guzzetti, S.; Nollo, G.; et al. An integrated approach based on uniform quantization for the evaluation of complexity of short-term heart period variability: Application to 24 h Holter recordings in healthy and heart failure humans. Chaos 2007, 17, 015117. [Google Scholar] [CrossRef] [PubMed]
- Porta, A.; Gnecchi-Ruscone, T.; Tobaldini, E.; Guzzetti, S.; Furlan, R.; Montano, N. Progressive decrease of heart period variability entropy-based complexity during graded head-up tilt. J. Appl. Physiol. 2007, 103, 1143–1149. [Google Scholar] [CrossRef] [PubMed]
- Pomeranz, B.; Macaulay, R.J.B.; Caudill, M.A.; Kutz, I.; Adam, D.; Gordon, D.; Kilborn, K.M.; Barger, A.C.; Shannon, D.C.; Cohen, R.J.; Benson, H. Assessment of autonomic function in humans by heart-rate spectral-analysis. Am. J. Physiol. 1985, 248, H151–H153. [Google Scholar] [PubMed]
- Porta, A.; Girardengo, G.; Bari, V.; George, A.L.; Brink, P.A.; Goosen, A.; Crotti, L.; Schwartz, P.J. Autonomic control of heart rate and QT variability influences arrhythmic risk in long QT syndrome type 1. J. Am. Coll. Cardiol. 2015, 65, 367–374. [Google Scholar] [CrossRef] [PubMed]
- Schwartz, P.J.; Vanoli, E.; Crotti, L.; Spazzolini, C.; Ferrandi, C.; Goosen, A.; Hedley, P.; Heradien, M.; Bacchini, S.; Turco, A.; et al. Neural control of heart rate is an arrhythmia risk modifier in long QT syndrome. J. Am. Coll. Cardiol. 2008, 51, 920–929. [Google Scholar] [CrossRef] [PubMed]
- Crotti, L.; Spazzolini, C.; Porretta, A.P.; Dagradi, F.; Taravelli, E.; Petracci, B.; Vicentini, A.; Pedrazzini, F.; La Rovere, M.T.; Vanoli, E.; et al. Vagal reflexes following an exercise stress test: A simple clinical tool for gene-specific risk stratification in the long QT syndrome. J. Am. Coll. Cardiol. 2012, 60, 2515–2524. [Google Scholar] [CrossRef] [PubMed]
- Baselli, G.; Porta, A.; Pagani, M. Coupling arterial windkessel with peripheral vasomotion: Modeling the effects on low-frequency oscillations. IEEE Trans. Biomed. Eng. 2006, 53, 53–64. [Google Scholar] [CrossRef] [PubMed]
© 2015 by the authors; licensee MDPI, Basel, Switzerland. This article is an open access article distributed under the terms and conditions of the Creative Commons Attribution license (http://creativecommons.org/licenses/by/4.0/).
Share and Cite
Bari, V.; Girardengo, G.; Marchi, A.; De Maria, B.; Brink, P.A.; Crotti, L.; Schwartz, P.J.; Porta, A. A Refined Multiscale Self-Entropy Approach for the Assessment of Cardiac Control Complexity: Application to Long QT Syndrome Type 1 Patients. Entropy 2015, 17, 7768-7785. https://0-doi-org.brum.beds.ac.uk/10.3390/e17117768
Bari V, Girardengo G, Marchi A, De Maria B, Brink PA, Crotti L, Schwartz PJ, Porta A. A Refined Multiscale Self-Entropy Approach for the Assessment of Cardiac Control Complexity: Application to Long QT Syndrome Type 1 Patients. Entropy. 2015; 17(11):7768-7785. https://0-doi-org.brum.beds.ac.uk/10.3390/e17117768
Chicago/Turabian StyleBari, Vlasta, Giulia Girardengo, Andrea Marchi, Beatrice De Maria, Paul A. Brink, Lia Crotti, Peter J. Schwartz, and Alberto Porta. 2015. "A Refined Multiscale Self-Entropy Approach for the Assessment of Cardiac Control Complexity: Application to Long QT Syndrome Type 1 Patients" Entropy 17, no. 11: 7768-7785. https://0-doi-org.brum.beds.ac.uk/10.3390/e17117768