Article

Clustering Heterogeneous Data with k-Means by Mutual Information-Based Unsupervised Feature Transformation

Department of Electronic Engineering, City University of Hong Kong, Tat Chee Avenue, Kowloon, Hong Kong
*
Author to whom correspondence should be addressed.
Entropy 2015, 17(3), 1535-1548; https://0-doi-org.brum.beds.ac.uk/10.3390/e17031535
Submission received: 8 December 2014 / Revised: 9 March 2015 / Accepted: 17 March 2015 / Published: 23 March 2015

Abstract

:
Traditional centroid-based clustering algorithms for heterogeneous data with numerical and non-numerical features result in different levels of inaccurate clustering. This is because the Hamming distance used for dissimilarity measurement of non-numerical values does not provide optimal distances between different values, and problems arise from attempts to combine the Euclidean distance and Hamming distance. In this study, the mutual information (MI)-based unsupervised feature transformation (UFT), which can transform non-numerical features into numerical features without information loss, was utilized with the conventional k-means algorithm for heterogeneous data clustering. For the original non-numerical features, UFT can provide numerical values which preserve the structure of the original non-numerical features and have the property of continuous values at the same time. Experiments and analysis of real-world datasets showed that, the integrated UFT-k-means clustering algorithm outperformed others for heterogeneous data with both numerical and non-numerical features.

1. Introduction

Most conventional clustering methods can only handle either numerical data or non-numerical data [110], however, many real world datasets are heterogeneous, consisting of a mixture of both. As an example one of the most widely used clustering method, k-means, cannot handle heterogeneous data properly because the Euclidean distance between vectors of mixed numerical and non-numerical data cannot be measured directly [1]. To perform heterogeneous data clustering, several algorithms have been proposed, these can broadly be divided into two types: (1) those that cluster heterogeneous data directly and (2) those that cluster heterogeneous data based on feature transformation.
For the first type, based on hierarchical clustering, algorithms include the similarity-based agglomerative clustering (SBAC) [11], extended self-organizing map [12] and the clustering algorithm based on variance and entropy (CAVE) [13]. Among them, SBAC uses the Goodall dissimilarity measurement [14] which measures distance and density for numerical and non-numerical data. Meanwhile, the extended self-organizing map and CAVE construct distance hierarchies which are applicable for heterogeneous data. However, hierarchical clustering is computationally intensive and not appropriate for high-dimensional datasets. Compared with hierarchical clustering, centroid-based clustering is less computationally intensive and more efficient to apply. As a typical centroid-based clustering for heterogeneous data, k-prototypes employs a dissimilarity measurement which calculates the Euclidean and Hamming distance for the numerical and non-numerical data respectively and then integrates the two distances [15]. However, the weighting of the Hamming distance needs to be set and modified manually. At the same time, combining the Euclidean and Hamming distance linearly is problematic as the physical meanings of the two distances are different. To solve this problem, Kullback–Leibler information fuzzy c-means combined with Gauss-multinomial distribution (KL-FCM-GM) has been proposed [16]. This method employs the negative log-likelihood of the Gaussian distribution combined with a fuzziness item as dissimilarity measurement to cluster mixed data in a comprehensive way. By taking the negative log of the probability density function, KL-FCM-GM can avoid having to combine the Euclidean and Hamming distance directly. However, the KL-FCM-GM still needs a parameter to control the amount of fuzziness. Also, the assumption of a Gauss-multinomial distribution may be inappropriate for the numerical parts of some datasets. In 2013, an improved k-prototypes [17] clustering method which is based on fuzzy k-prototypes [18] was proposed. This method can optimize the weight for each feature (numerical or non-numerical) iteratively. However, the improved k-prototypes still requires the combination of the Euclidean and Hamming distances to measure the dissimilarity.
The other type of clustering algorithms for heterogeneous data employ feature transformation to unify the format of the data and then clustering algorithms dealing with one feature format (numerical or non-numerical) can be applied. For example, SpectralCAT [19] transforms numerical features into non-numerical features for heterogeneous data clustering. However, this kind of transformation removes the distances between data contained in the original numerical data and hence, may cause information loss [12]. On the other hand, feature calibration (FC) is a classical method which can transform non-numerical features into numerical features [20], it is a supervised algorithm which employs the probability distributions of the class labels to substitute the original non-numerical values. However, clustering is an unsupervised problem which does not employ the information from class labels. As a result, FC is not appropriate for heterogeneous data clustering.
In this study, we propose a mutual information (MI)-based unsupervised feature transformation (UFT), which can transform non-numerical features into numerical features, with conventional k-means algorithm for heterogeneous data clustering. Although Gaussian mixture models (GMM) [21] can also be used with UFT for heterogeneous data clustering, they can have issues associated with initialization dependence and instability [22]. As the feature transformation procedure of UFT depends on adding distance to every value of the original non-numerical features, the transformed numerical values provide more choices of initializations which can make the GMM even less stable. For comparison, GMM was also used together with UFT in the experimental part of real-world datasets. Although hierarchical clustering algorithms can also be used with UFT for heterogeneous data clustering, they are computationally intensive for datasets with large sample sizes. Furthermore, hierarchical clustering algorithms are sensitive to outliers and cannot update the clustering structure while processing data. As a result, the k-means clustering algorithm was chosen in this study. This integrated UFT-k-means has three key advantages: (1) other than the number of clusters (k), no other parameter is required for the clustering procedure; (2) UFT for non-numerical features is mutual information (MI)-based and therefore robust; (3) UFT can provide optimal numerical values for the original non-numerical features and avoids the use of the Hamming distance in the dissimilarity measurement for clustering. Furthermore, by unifying the data to be purely numerical, the UFT can enable principle component analysis (PCA) which can be useful for data visualization of heterogeneous data. The rest of this paper is organized as follows: Section 2 introduces the UFT and integrated UFT-k-means. Section 3 shows the results and analysis of experiments. Section 4 concludes this study.

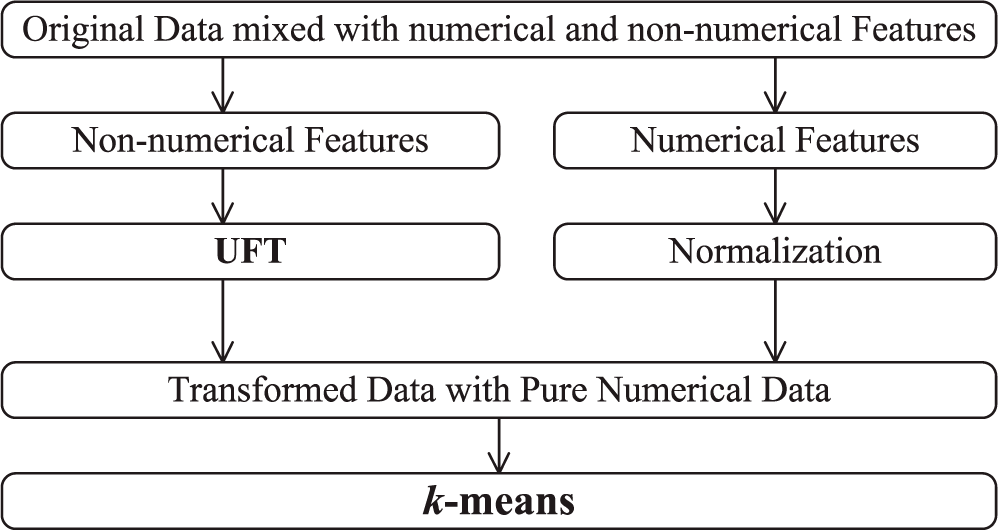
2. Unsupervised Feature Transformation (UFT) and UFT-k-means

The proposed UFT aims at finding a numerical substitution X ˜ for a non-numerical feature X, which satisfies the condition of I ( X ˜ ; X ) = H ( X ). This condition assures the MI between the transformed numerical feature and the original non-numerical feature to be the same in terms of the entropy of the original non-numerical feature. As H(X) = I (X; X), from the perspective of information theory, the transformed numerical feature contains the same information as the original non-numerical feature. This condition is critical because it ensures that the original feature information is preserved, when non-numerical features are transformed into numerical features. It is also worth noting that the transformation is independent of class label. This is critical because the bias introduced by class label can be reduced.
Assume X ˜ is numerical substitution for non-numerical feature X = {xi | i = 1,…, n}, then:
p ( x ˜ , x = x i ) = p X ˜ | x = x i ( x ˜ ) p X ( x = x i ) .
Use Pi to denote PX(x=xi), then:
I ( X ˜ ; X ) = i = 1 n X ˜ | x = x i p ( x ˜ , x = x i ) log ( p ( x ˜ , x = x i ) p X ˜ ( x ˜ ) p X ( x = x i ) ) d x ˜ = i = 1 n p i [ X ˜ | x = x i p X ˜ | x = x i ( x ˜ ) log ( p X ˜ | x = x i ( x ˜ ) ) d x ˜ X ˜ | x = x i p X ˜ | x = x i ( x ˜ ) log ( p X ˜ ( x ˜ ) ) d x ˜ ] .
Assume that every group of numerical substitution for non-numerical value obeys a Gaussian distribution and the substitution for non-numerical feature also obeys a Gaussian distribution. The reasons behind the choice of Gaussian distribution are: (1) it can describe common probability distributions of numerical data in real-world situations; (2) it has useful properties which can simplify the expressions of MI and entropy; (3) compared with other distributions which also describe numerical data (such as uniform distribution), the parameters of Gaussian distribution are easier to estimate without the prior knowledge of data range. These assumptions can be expressed as X ˜ | x = x i ~ N ( μ i , σ i ), i ∊{1,…,n} and X ˜ ~ N ( μ , σ ). Then:
P X ˜ | x = x i ( x ˜ ) = 1 2 π σ i 2 exp ( ( x ˜ μ i ) 2 2 σ i 2 ) , i { 1 , , n }
p X ˜ ( x ˜ ) = 1 2 π σ 2 exp ( ( x ˜ μ ) 2 2 σ 2 ) .
Based on the Gaussian distribution assumption, two parts of Equation (2) can be simplified as Equation (5):
I ( X ˜ ; X ) = i = 1 n p X ( x = x i ) X ˜ | x = x i p X ˜ | x = x i ( x ˜ ) log ( p X ˜ | x = x i ( x ˜ ) p X ˜ ( x ˜ ) ) d x ˜ = 1 2 i = 1 n p X ( x = x i ) [ log ( σ 2 σ i 2 ) + σ i 2 σ 2 + ( μ i μ ) 2 σ 2 1 ] .
Let I ( X ˜ ; X ) = H ( X ), then:
1 2 i = 1 n p i [ log ( σ 2 σ i 2 ) + σ i 2 σ 2 + ( μ i μ ) 2 σ 2 1 ] = i = 1 n p i log ( p i ) .
Because σ 2 = p X ˜ ( x ˜ ) ( x ˜ μ ) 2 d x ˜:
σ 2 = i p i X ˜ | x = x i p X ˜ | x = x i ( x ˜ ) ( x ˜ μ ) 2 d x ˜ = i p i X ˜ | x = x i p X ˜ | x = x i ( x ˜ ) [ ( x ˜ μ i ) + ( μ i μ ) ] 2 d x ˜ . = i p i [ σ i 2 + ( μ i μ ) 2 ]
Then Equation (6) can be rewritten as:
1 2 i = 1 n p i [ log ( σ 2 σ i 2 ) + σ i 2 σ 2 + ( μ i μ ) 2 σ 2 1 ] = i = 1 n p i log ( p i ) i p i log ( σ 2 σ i 2 ) + i p i [ σ i 2 + ( μ i μ ) 2 ] σ 2 i p i = 2 i p i log ( p i ) . i p i log ( σ 2 σ i 2 ) = i p i log ( 1 p i 2 )
The solutions of the above equation are not unique. Here, we choose the following solutions for simplicity:
i { 1 , , n } , σ 2 σ i 2 = 1 p i 2 .
Because i p i [ σ i 2 + μ i 2 ] = σ 2 + μ 2, based on the above solutions, we obtain:
i p i [ p i 2 σ 2 + μ i 2 ] = σ 2 + μ 2 i p i μ i 2 = ( 1 i p i 3 ) σ 2 + μ 2 .
Because i p i μ i = μ, then:
( i p i μ i ) 2 = μ 2 i p i 2 μ i 2 + i j 2 p i p j μ i μ j = μ 2 .
Based on (10) minus (11), we obtain:
i p i μ i 2 i p i 2 μ i 2 i j 2 p i p j μ i μ j = ( 1 i p i 3 ) σ 2 i j p i p j ( μ i μ j ) 2 = ( 1 i p i 3 ) σ 2 .
Then for solving μi, we have two equations:
i j p i p j ( μ i μ j ) 2 = ( 1 i p i 3 ) σ 2 ;
i p i μ i = μ .
Equations (12) and (13) can only solve two variables, which means they are only suitable for the non-numerical features containing two values. The solution of the equations is not unique, when there are more than two values. To solve this problem, assumptions are added here. As μi is one-dimensional value, we assume μ1 > μ2 > μn and:
i { 1 , , n 1 } , μ i μ i + 1 = D
The assumption of (15) implies that the distances between neighboring pairs of μi are equal. The purpose of assumption (15) is to find the closed-form solution of Equations (13) and (14) and simplify the problem. Although the distance between each pair of means is fixed, the transformed distribution of each non-numerical value can still be controlled by standard deviation which can be solved correspondingly for every value of the original non-numerical features. Based on assumption (15), the solution can be obtained as follows:
D = σ ( 1 i p i 3 ) / i j p i p j ( i j ) 2 , i , j { 1 , , n }
Using (14) and (15), we obtain:
μ i = μ + [ ( n i ) k = 1 i ( n k ) p k ] D , i { 1 , , n }
From (16) and (17), we obtain
μ i = μ + σ [ ( n i ) k = 1 i ( n k ) p k ] ( 1 i p i 3 ) / i j p i p j ( i j ) 2 . i { 1 , , n }
And (9) shows the corresponding standard deviations:
σ i = p i σ . i { 1 , , n }
The values of numerical features in datasets should be normalized to unify the scale of data. Here we adopted a widely used way setting X* =(Xμ)/σ to normalize transformed numerical data. This method measures the relative position of data points related to the mean and standard deviation of the corresponding feature. Thus, the parameters μ and σ in (18) and (19) can be eliminated. As a result, (18) and (19) can be normalized as:
μ i * = ( μ i μ ) / σ = [ ( n i ) k = 1 i ( n k ) p k ] ( 1 i p i 3 ) / i j p i p j ( i j ) 2 . i { 1 , , n }
σ i * = σ i / σ = p i . i { 1 , , n }
Depending on X ˜ | x = x i ~ N ( μ i * , σ i * ) i ∊ {1,…n}, the numerical substitution X ˜ for the original non-numerical feature X can be generated. Besides, the values of transformed feature can be normalized at the same time. Combining the UFT with k-means, data mixed with numerical and non-numerical features can be unified to be purely numerical and then clustered effectively. Figure 1 shows the experimental design of UFT-k-means.
In this study, UFT-k-means was applied to heterogeneous data clustering and compared with k-prototypes, improved k-prototypes and KL-FCM-GM.

3. Experiments and Analysis

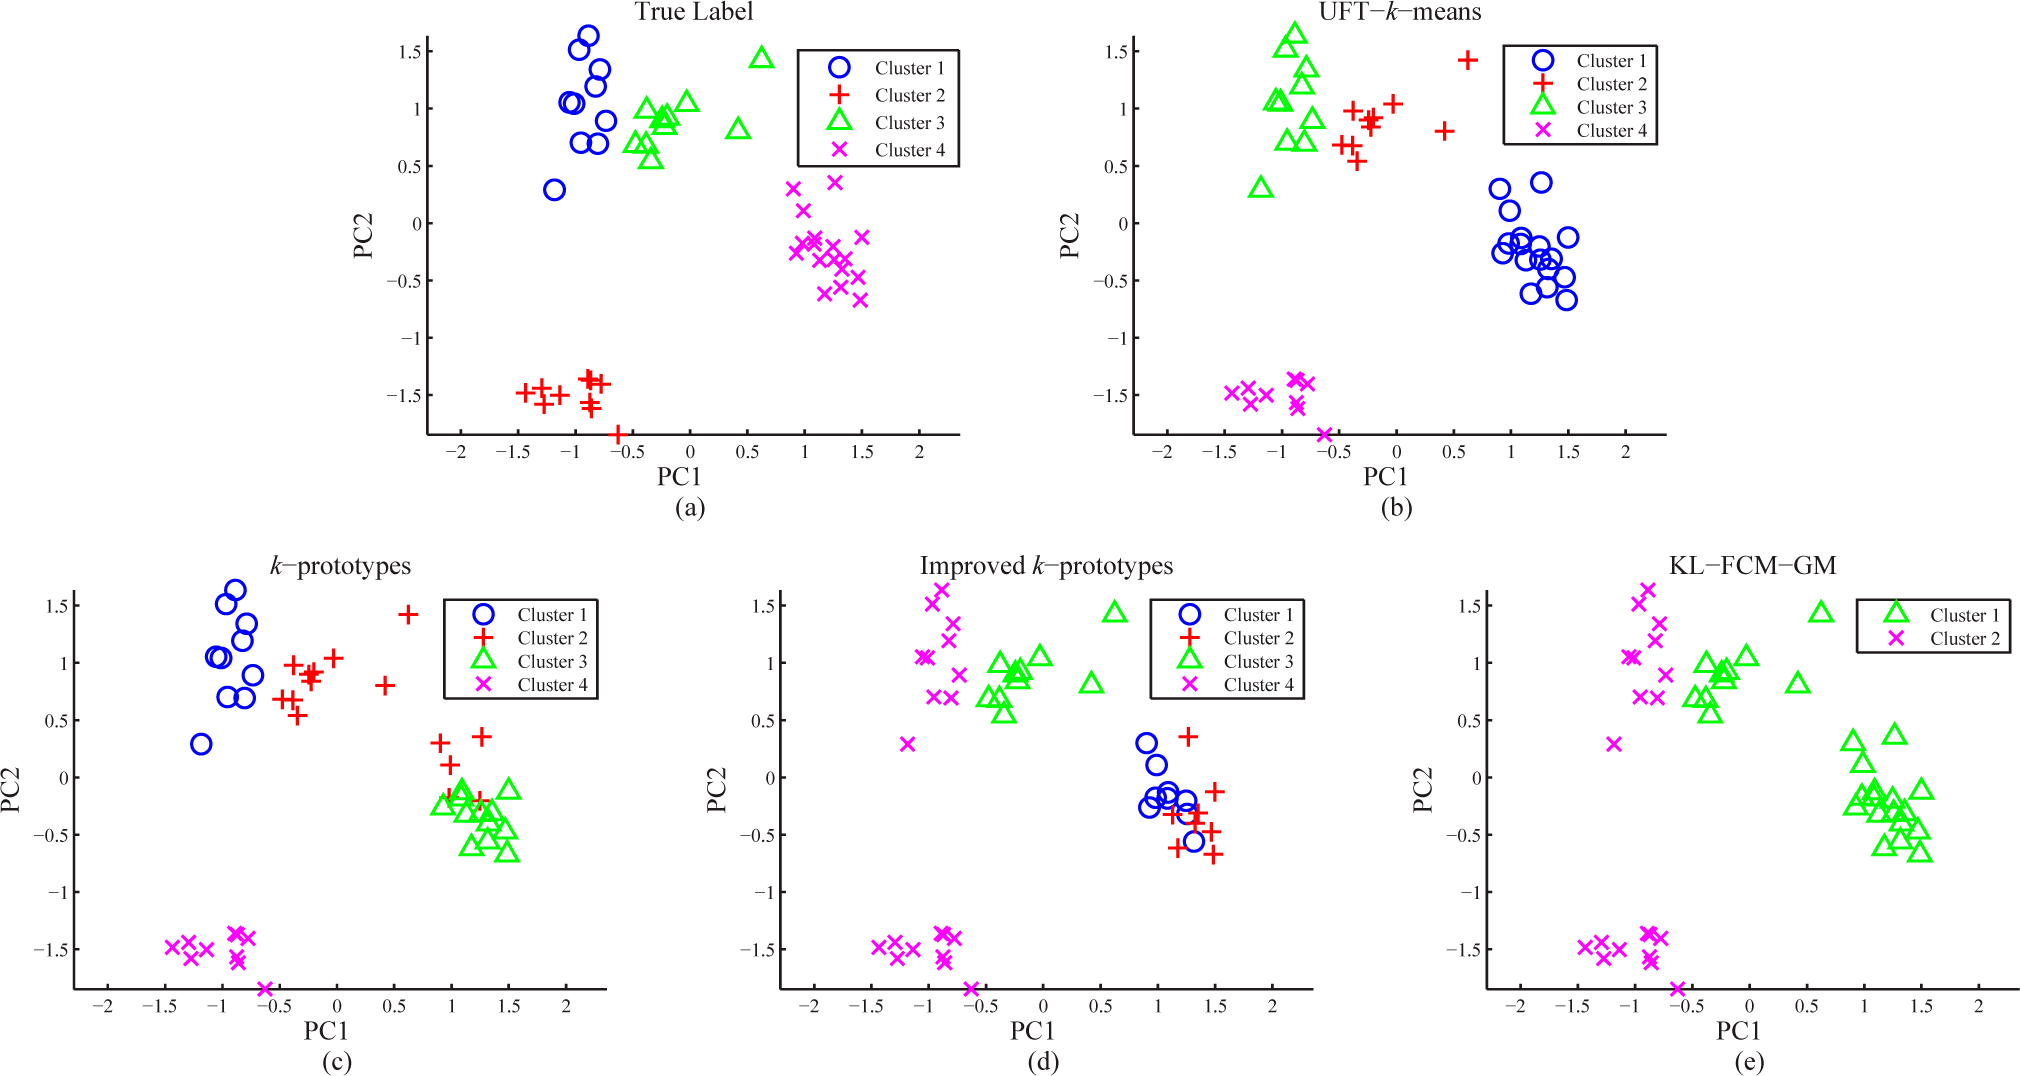
3.1. A Modified Real-World Dataset for Validation

The Seeds dataset, which is a benchmark dataset downloaded from UCI [23] and has seven numerical features, 210 samples and three classes, was analyzed to demonstrate the algorithm performance. To test the proposed UFT-k-means in a controlled manner, F2 and F3 of the Seeds dataset were discretized (bins = 3) to generate a heterogeneous dataset with numerical and non-numerical features. The results of clustering were compared between UFT-k-means and conventional methods (k-prototypes, improved k-prototypes and KL-FCM-GM). The parameters of k-prototypes, improved k-prototypes and KL-FCM-GM were chosen based on previously reported criteria. The specific searching ranges of parameters are: (1) for k-prototypes, the weight of non-numerical features, γ, was chosen within (0,10] [15]; (2) for improved k-prototypes, the exponent of feature significance, λ, should be more than 1 [17], in this study, the range was chosen as (1,5] because small modification of the exponent value may influence the clustering results to a large extent; (3) for KL-FCM-GM, the degree of fuzziness, λ, was chosen within (1,3] as suggested in [16]. The best performances and the corresponding parameter values are presented in Table 1.
Table 1 shows that, for the Seeds dataset with heterogeneous features, UFT-k-means outperformed the other clustering algorithms, this is because UFT transformed the non-numerical features into numerical features without information loss. Each transformed feature has the properties of a numerical feature whilst retaining the structure of the non-numerical feature. As a result, the transformed numerical dataset can provide reasonable estimates of the Euclidean distance of the original non-numerical values to k-means. Besides, another major benefit of the clustering procedure of UFT-k-means is that it is not biased by any parameters. For conventional k-prototypes, the algorithm is parameter dependent and the combination of Euclidean and Hamming distance may not be appropriate for the Seeds dataset with heterogeneous features. Although the improved k-prototypes employs a fuzzy method to control the ratio between Euclidean and Hamming distance, it still has the same disadvantages as k-prototypes. For KL-FCM-GM, the clustering accuracy is only 57.62% probably due to the unsuitable assumption of the Gauss-multinomial distribution for the numerical features of the Seeds dataset. Besides, KL-FCM-GM needs a parameter to control the fuzziness which may also influence the result of the clustering. The clustering results for different algorithms and the true labels of the Seeds dataset with heterogeneous features are compared in Figure 2. The first two principle components (PC1 and PC2) of the original numerical Seeds dataset were used in Figure 2 to illustrate the distribution of clusters.
Figure 2 shows that, among all the clustering algorithms compared, UFT-k-means provided the most similar clustering as the true labels of the Seeds dataset. For both k-prototypes and the improved k-prototypes, some of the points which originally belong to Cluster 1 were clustered as Cluster 3. Figure 2e shows that the clusters derived by KL-FCM-GM overlap with each other considerably illustrating how the KL-FCM-GM assumption of the Gauss-multinomial distribution, may not be appropriate for the numerical part of the Seeds dataset. The results suggest that UFT-k-means is an efficient clustering algorithm for heterogeneous data with numerical and non-numerical features.

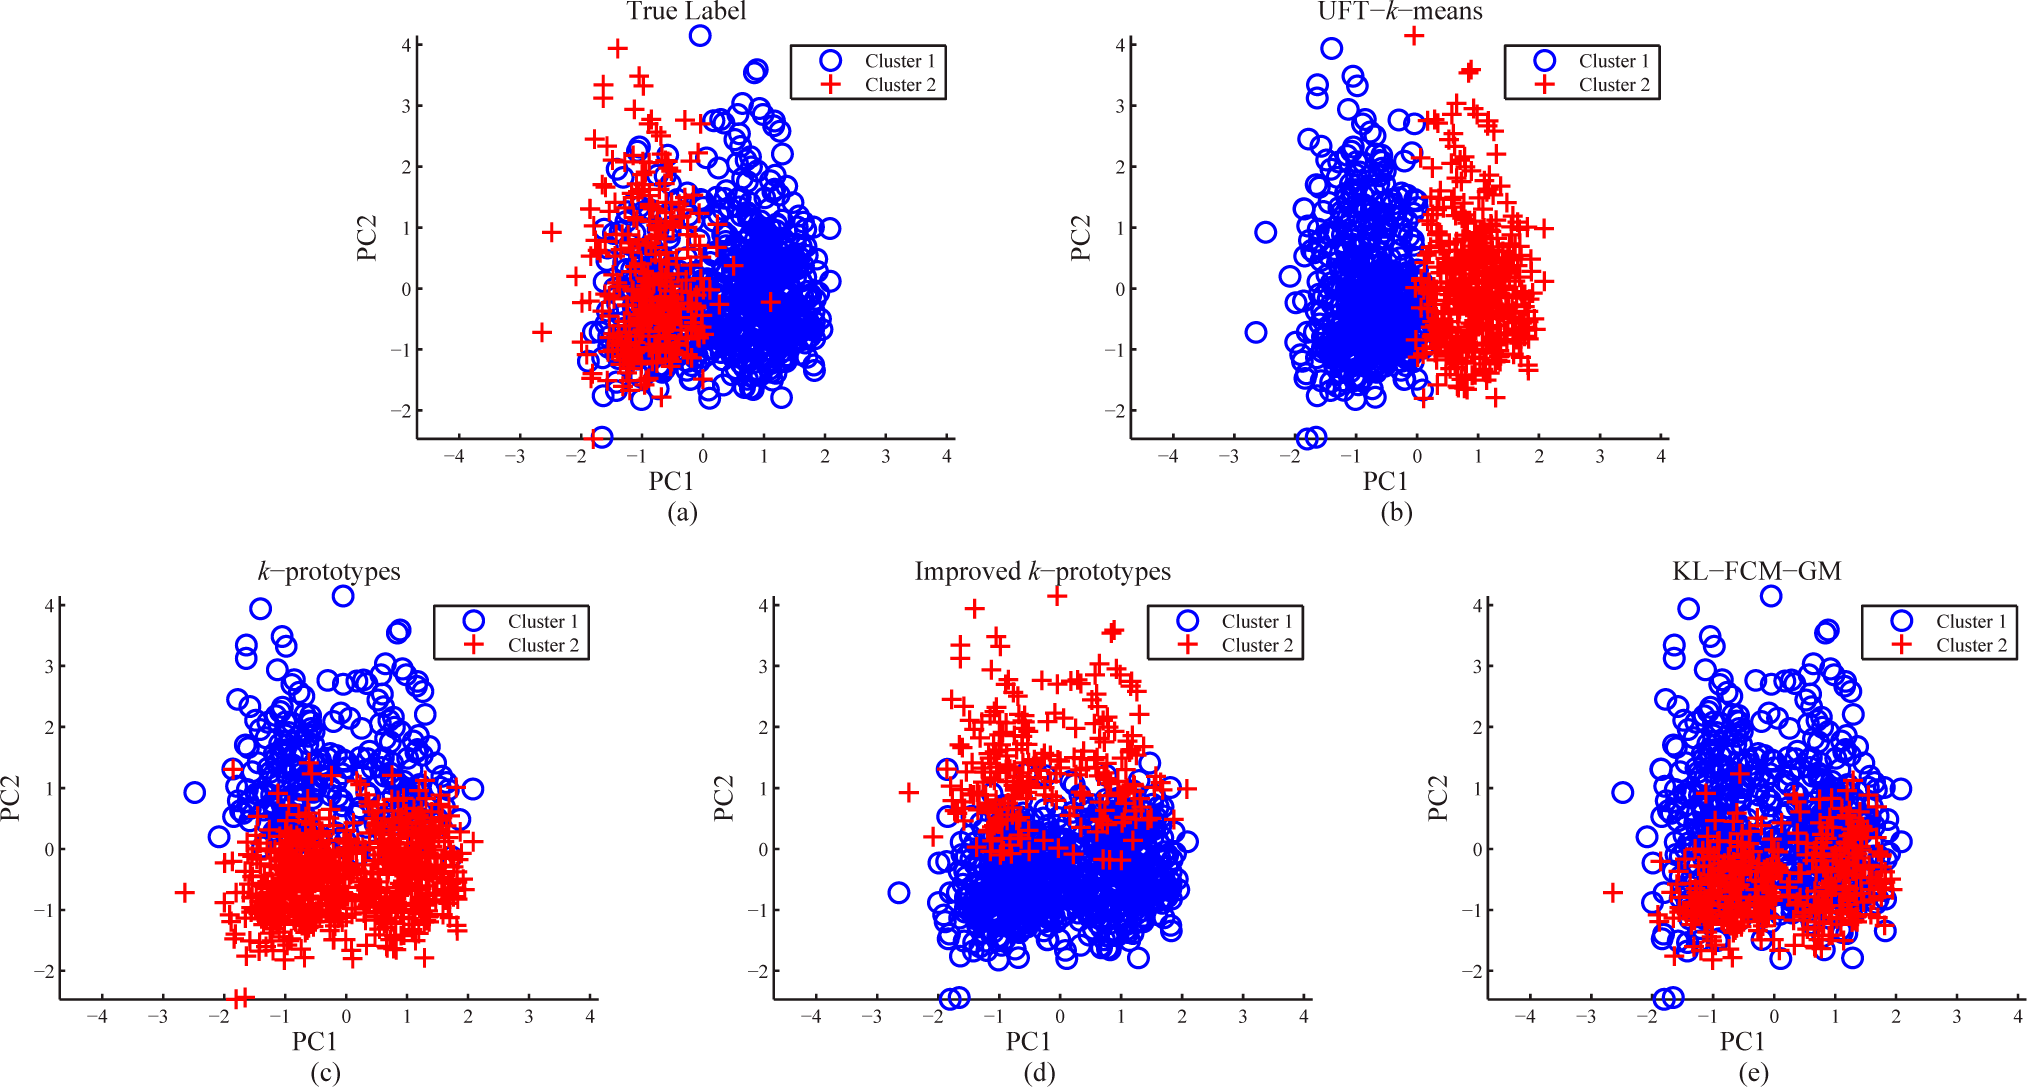
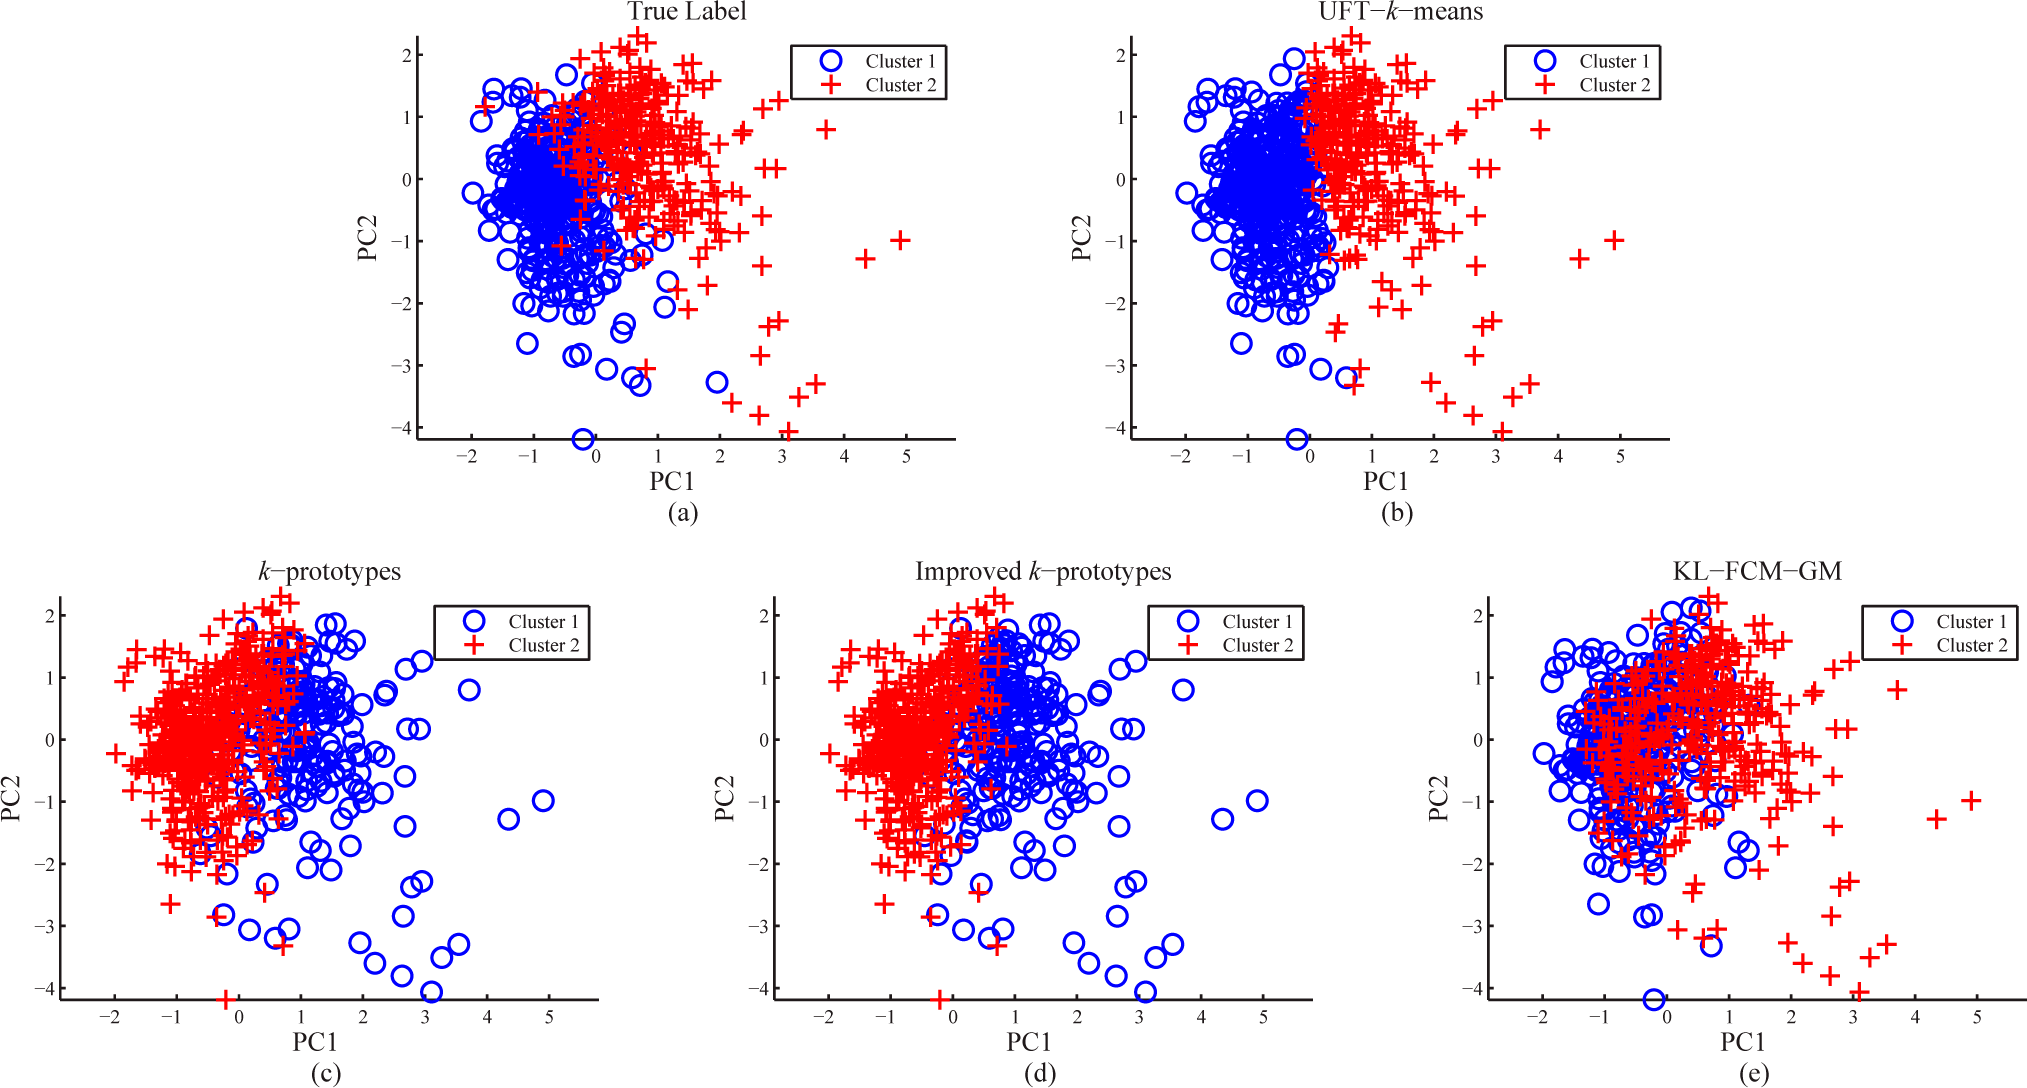
3.2. Real-World Datasets

Seven benchmark datasets (downloaded from UCI [23]) were used here to evaluate the performance of the proposed UFT-k-means compared with k-prototypes, improved k-prototypes and KL-FCM-GM. The data descriptions are shown in Table 2. Among them, the Soybean dataset is purely non-numerical and all the features were transformed into numerical features for UFT-k-means. For the Heart Cleveland dataset, there are 303 samples and six of them contain missing values. In this study, only the complete samples were kept in the dataset for clustering leaving 297 samples in Heart Cleveland dataset. In the Dermatology dataset, eight samples with missing values were also eliminated and 366 complete samples were kept for clustering. The choice of parameters in k-prototypes, improved k-prototypes and KL-FCM-GM are within the ranges mentioned in Section 3.1. The parameters were chosen iteratively and only those offered the best performance were kept for clustering. To avoid the influence of initializations, all of the algorithms were run 100 times with the average accuracies and standard deviations listed in Table 3.
Table 3 shows that UFT-k-means outperformed the other algorithms for all seven benchmark datasets. For UFT-GMM, the standard deviation values were more than that of other clustering algorithms for six out of seven datasets and the average accuracies were not outstanding. This is because compared with k-means, GMM is more initialization dependent and the numerical data transformed by UFT provided even more choices of initializations which make the UFT-GMM relatively less stable. Since the Soybean dataset is purely non-numerical, only the non-numerical dissimilarity measurement of k-prototypes, improved k-prototypes and KL-FCM-GM were implemented and their performance should be improved. However, their clustering accuracies were less than that of UFT-k-means for the Soybean dataset, this is because the dissimilarity between non-numerical values can only be measured as 0 or 1 and thus cannot provide different dissimilarities for different non-numerical values. For example, in a non-numerical feature, the dissimilarity between each pair of categories is always 1. The dissimilarities cannot be compared between all categories. Whereas, on the contrary, based on the structure of non-numerical feature, the UFT can transform non-numerical values into numerical values which provide different dissimilarities to different pairs of categories in the original non-numerical features. After UFT, k-means can then employ the transformed numerical values and calculate the Euclidean distance directly based on all of the features. As a result, the clustering of UFT-k-means is more reliable than the traditional methods for heterogeneous data.
To compare the clustering results derived by the different algorithms with the true labels, the Soybean, German and Australian datasets were used for illustration as shown Figures 3 and 5. The first two principle components (PC1 and PC2) from the non-numerical data transformed by UFT were used to illustrate the clusters obtained from all the algorithms. The figures also highlight the advantage of UFT, in that it can be used to visualize the results of non-numerical data and heterogeneous data clustering.
From Figure 3 it can be seen that only UFT-k-means provided four clear clusters as the true label. In Figure 3c, k-prototypes clustered some points which originally belong to Cluster 3 into Cluster 2. In Figure 3d, improved k-prototypes clustered the points which originally belong to two different clusters into Cluster 4. Cluster 1 and Cluster 2 overlap each other because the dissimilarity measurements of both k-prototypes and improved k-prototypes employ the Hamming distance which cannot provide different distances for different non-numerical values. For KL-FCM-GM, Figure 3e shows that the algorithm clustered the points which originally belong to four clusters into only two clusters.
Figure 4 shows that, although the true labels of the German dataset overlap, the data distributions of the two clusters are clearly shown. Among the algorithms compared in Figure 4, only UFT-k-means provides similar clusters to the true label. The two clusters in Figure 4b have a clear vertical boundary. Figures 4c,d show the results of k-prototypes and improved k-prototypes which cannot separate the two clusters with vertical boundaries, this is both because of the limitations of the Hamming distance and because the dissimilarity measurement of the mixed Euclidean distance with Hamming distance and the parameter of combination may not be optimal for the German dataset. Figure 4e shows the overlapping of clustering results by KL-FCM-GM with boundary running in orthogonal direction.
In Figure 5, for the Australian dataset, again the UFT-k-means provided the most similar clustering results with the true labels among all the algorithms. Because the information of the original non-numerical features is preserved, the clusters derived by UFT-k-means have a clear boundary. For k-prototypes and improved k-prototypes, Figures 5c,d show that some of the points which originally belong to Cluster 1 were clustered into Cluster 2 also because of the inappropriate combinations of Euclidean and Hamming distance. As Figure 5e shows, the two clusters derived by KL-FCM-GM overlap each other to a great degree.
All the figures show that among all the algorithms only UFT-k-means consistently provides clusters similar to those of the true labels. This is because UFT provided different dissimilarities to different pairs of categories in the original non-numerical features, by providing reasonable numerical values for the original non-numerical features; the transformed numerical features preserved the structures of the original non-numerical features and at the same time have the properties of numerical values. As a result, the data transformed by UFT can help k-means to measure the dissimilarity of heterogeneous data by using the Euclidean distance directly.
The results of the k-prototypes and improved k-prototypes show that the algorithms have problems distinguishing classes because of the limitations associated with the Hamming distance as it cannot provide different distances between different non-numerical values. At the same time, the parameter combining the Euclidean distance with the Hamming distance into the mixed dissimilarity measurement may not be optimal. For the KL-FCM-GM which relies on the assumption of Gauss-multinomial distribution for numerical features this may not be appropriate for the datasets shown.

4. Conclusions

Conventional k-means cannot cluster heterogeneous data with numerical and non-numerical features properly since the Euclidean distance between non-numerical values cannot be measured. To solve this problem, several centroid-based clustering algorithms have been proposed, such as k-prototypes, improved k-prototypes and KL-FCM-GM, but these still have some disadvantages. For k-prototypes, the dissimilarity measurement combined the Euclidean distance with the Hamming distance and a parameter which controls the ratio between the two distances, which needs to be set manually. Although the improved k-prototypes employs a fuzzy method to control the weight of different features, it still requires the combination of Euclidean distance with Hamming distance which cannot provide different distances between different non-numerical values. For KL-FCM-GM, the dissimilarity measurement is based on the assumption of a Gauss-multinomial distribution for numerical features. However, this assumption may not be appropriate for all the datasets.
In this study, we integrated the MI-based UFT which can transform non-numerical features into numerical features with the conventional k-means to cluster the heterogeneous data. The transformation of UFT is based on MI and can preserve the information contained in the original non-numerical features. At the same time, the transformed numerical features have the properties of numerical values and the structure of the original non-numerical features meaning the integrated UFT-k-means can cluster the heterogeneous data effectively. The results of simulation studies show that, the integrated UFT-k-means outperformed other clustering algorithms and provided reasonable clusters for one modified real-world dataset and five real-world benchmark datasets. Furthermore, the numerical data transformed by UFT can be used for PCA and visualize the results of clustering. As a result, the integrated UFT-k-means is an optimal choice for clustering heterogeneous data with numerical and non-numerical features.

Acknowledgments

The work described in this paper was fully supported by a grant from the Research Grants Council of the Hong Kong Special Administrative Region, China [Project No. CityU123312] and a grant from the Croucher Foundation. The authors would like to thank Beth Jelfs for reading an earlier version of the manuscript.

Author Contributions

Min Wei and Tommy W. S. Chow designed the research. Min Wei developed the algorithm, performed the simulation and analyzed the results. Min Wei, Tommy W. S. Chow and Rosa H. M. Chan reviewed and revised the algorithm, simulation and analysis. Min Wei wrote the main text of manuscript. All authors have reviewed, revised and finalized the manuscript.

Conflicts of Interest

The authors declare no conflict of interest.

References

  1. MacQueen, J. Some methods for classification and analysis of multivariate observations. In Proc. of the Fifth Berkeley Symposium on Mathematical Statistics and Probability; University of California Press: Oakland, CA, USA, 1967; pp. 281–297. [Google Scholar]
  2. Huang, Z.X. Extensions to the k-means algorithm for clustering large data sets with categorical values. Data Min. Knowl. Discov. 1998, 2, 283–304. [Google Scholar]
  3. Huang, Z.X.; Ng, M.K. A fuzzy k-modes algorithm for clustering categorical data. IEEE Trans. Fuzzy Syst. 1999, 7, 446–452. [Google Scholar] [Green Version]
  4. Arthur, D.; Vassilvitskii, S. k-means ++: The advantages of careful seeding. Proceedings of the Eighteenth Annual ACM-SIAM Symposium on Discrete Algorithms, New Orleans, LA, USA, 7–9 January 2007; pp. 1027–1035.
  5. Zhang, T.; Ramakrishnan, R.; Livny, M. BIRCH: An efficient data clustering method for very large databases. Proceedings of the 1996 ACM SIGMOD International Conference on Management of Data, Montreal, PQ, Cananda, 4–6 June 1996; pp. 103–114.
  6. Guha, S.; Rastogi, R.; Shim, K. CURE: An efficient clustering algorithm for large databases. Proceedings of the 1998 ACM SIGMOD International Conference on Management of Data, Seattle, WA, USA, 1–4 June 1998; pp. 73–84.
  7. Barbará, D.; Li, Y.; Couto, J. COOLCAT: an entropy-based algorithm for categorical clustering. Proceedings of the Eleventh International Conference on Information and Knowledge Management, McLean, VA, USA, 4–9 Novermber 2002; pp. 582–589.
  8. He, H.; Tan, Y. A two-stage genetic algorithm for automatic clustering. Neurocomputing 2012, 81, 49–59. [Google Scholar]
  9. Nielsen, F.; Nock, R.; Amari, S. On clustering histograms with k-means by using mixed α-divergences. Entropy 2014, 16, 3273–3301. [Google Scholar]
  10. De Domenico, M.; Insolia, A. Entropic approach to multiscale clustering analysis. Entropy 2012, 14, 865–879. [Google Scholar]
  11. Li, C.; Biswas, G. Unsupervised learning with mixed numeric and nominal data. IEEE Trans. Knowl. Data Eng. 2002, 14, 673–690. [Google Scholar]
  12. Hsu, C.-C.; Lin, S.-H.; Tai, W.-S. Apply extended self-organizing map to cluster and classify mixed-type data. Neurocomputing 2011, 74, 3832–3842. [Google Scholar]
  13. Hsu, C.-C.; Chen, Y.C. Mining of mixed data with application to catalog marketing. Expert Syst. Appl. 2007, 32, 12–23. [Google Scholar]
  14. Goodall, D.W. A new similarity index based on probability. Biometrics 1966, 22, 882–907. [Google Scholar]
  15. Huang, Z. Clustering large data sets with mixed numeric and categorical values. Proceedings of the 1st Pacific-Asia Conference on Knowledge Discovery and Data Mining, Singapore, Singapore, 23–24 February 1997; pp. 21–34.
  16. Chatzis, S.P. A fuzzy c-means-type algorithm for clustering of data with mixed numeric and categorical attributes employing a probabilistic dissimilarity functional. Expert Syst. Appl. 2011, 38, 8684–8689. [Google Scholar]
  17. Ji, J.; Bai, T.; Zhou, C.; Ma, C.; Wang, Z. An improved k-prototypes clustering algorithm for mixed numeric and categorical data. Neurocomputing 2013, 120, 590–596. [Google Scholar]
  18. Ji, J.; Pang, W.; Zhou, C.; Han, X.; Wang, Z. A fuzzy k-prototype clustering algorithm for mixed numeric and categorical data. Knowl.-Based Syst 2012, 30, 129–135. [Google Scholar]
  19. David, G.; Averbuch, A. SpectralCAT: Categorical spectral clustering of numerical and nominal data. Pattern Recognit. 2012, 45, 416–433. [Google Scholar]
  20. Flach, P. Machine Learning: The Art and Science of Algorithms that Make Sense of Data; Cambridge University Press: Cambridge, UK, 2012. [Google Scholar]
  21. McLachlan, G.J.; Basford, K.E. Mixture Models. Inference and Applications to Clustering; CRC Press: Boca Raton, FL, USA, 1988. [Google Scholar]
  22. Blundell, R.; Bond, S. Initial conditions and moment restrictions in dynamic panel data models. J. Econ. 1998, 87, 115–143. [Google Scholar]
  23. Bache, K.; Lichman, M. UCI machine learning repository. Available online: http://archive.ics.uci.edu/ml accessed on 20 March 2015.
Figure 1. The experimental design of UFT-k-means.
Entropy 17 01535f1
Figure 2. The true label and the clustering results derived by different algorithms for the Seeds dataset mixed with numerical and non-numerical features.
Entropy 17 01535f2
Figure 3. The true label and the clustering results derived by different algorithms for the Soybean dataset.
Entropy 17 01535f3
Figure 4. The true label and the clustering results derived by different algorithms for the German dataset.
Entropy 17 01535f4
Figure 5. The true label and the clustering results derived by different algorithms for the Australian dataset.
Entropy 17 01535f5
Table 1. Clustering accuracies for the Seeds dataset with heterogeneous features.
Clustering AlgorithmsAccuracy
UFT-k-means89.05%
k-prototypes86.67% (γ = 2)
Improved k-prototypes84.76% (λ = 2.5)
KL-FCM-GM57.62% (λ = 1.1)
Table 2. Data descriptions.
DatasetsSamplesClassesNumerical FeaturesNon-numerical FeaturesFeatures
Soybean47403535
Heart Statlog27026713
Heart Cleveland29756713
German1,000231720
Australia69026814
Zoo101711516
Dermatology366613334
Table 3. Clustering accuracies for different datasets varied among different clustering algorithms.
Clustering AlgorithmsAccuracy (%, Mean ± SD)
SoybeanHeart StatlogHeart ClevelandGermanAustralianZooDermatology
UFT-k-means96.17 ± 2.5789.64 ± 0.2665.32 ± 0.3375.14 ± 0.4691.19 ± 0.5184.85 ± 2.0563.02 ± 1.90
UFT-GMM78.51 ± 9.0783.80 ± 8.9061.13 ± 2.1870.07 ± 0.1072.04 ± 3.2874.80 ± 6.4152.69 ± 5.54
k-prototypes87.45 ± 3.8278.89 ± 2.6959.23 ± 1.0370.00 ± 0.0074.67 ± 0.0677.95 ± 2.8052.47 ± 3.74
Improved k-prototypes90.85 ± 4.0582.70 ± 4.0759.26 ± 1.0470.00 ± 0.0078.72 ± 0.2381.98 ± 4.6252.40 ± 3.02
KL-FCM-GM57.45 ± 4.3774.96 ± 4.8756.16 ± 1.0670.00 ± 0.0068.71 ± 1.1940.59 ± 0.0333.99 ± 8.02

