1. Introduction
In thermodynamics, the entropy of a system is a more complex notion than a measure of spatial disorder, and it is a quantity as fundamental as energy. Misconceptions about the macroscopic and microscopical definitions of entropy have existed since its definition, and debates about if the principles that govern evolution are minimizing or maximizing the entropy of the system are still open nowadays [
1]. Entropy calculations have been used in geophysics to study purely physical quantities, such as temperature or heat fluxes on Earth [
2], or for other planets, such as Mars or Titan [
3], but the study of entropy has gone beyond and has been applied to biogeophysical investigations [
4,
5], studying the clouds on Earth or even modeling bacterial photosynthesis [
6]. In this sense, it is believed by some authors that the entropy production principles “govern” not only the evolution of nonequilibrium physical and chemical systems, but also “guide” biological evolution [
1].
The entropy concept is an essential quantity in equilibrium thermodynamics, and the entropy production concept assumes this role in nonequilibrium thermodynamics. Regarding the investigations in climate or meteorological sciences, a planetary atmosphere is an open system remaining in a non-equilibrium state [
7], and the entropy production concept seems appropriate to study its displacement from equilibrium. As was noticed by Schneider and Kay [
8], “in these dissipative systems, the total entropy change in a system is the sum of the internal production of entropy in the system (which is always greater than or equal tozero), and the entropy exchange with the environment which may be positive, negative or zero”.
A planetary atmosphere is an evolving system with continuous temporal variations and is constantly out of equilibrium. The solar flux reaching the atmosphere, biological and abiotic fluxes coming from the surface and thermodynamic processes within the atmosphere impulse its state far from equilibrium. A useful measurement of the atmospheric disequilibrium is the entropy, and particularly interesting for life is the chemical disequilibrium in an atmosphere.
The Earth system is nowadays inside of the Habitable Zone, where liquid water exists, and its atmospheric composition and structure is a consequence of the existence of life among others. The future of the Earth’s system is uncertain, but it is believed that Mars was once in that same state. Until now, no life activity has been discovered on Mars, and its atmosphere is much more simple than ours, with a very low density and only a few compounds in significant amounts. Following the ideas of Boltzmann, the entropy of the atmosphere of Mars has to be lower than the atmosphere of the Earth, since it contains several times less compounds and less density. Despite the fact that our intuition might be correct, the chemical entropy of the Mars atmosphere has not been calculated previously.
The analysis of the entropy production of the Earth system has been carried out successfully [
9], and the amount of data of the variables involved is widely available in the literature. However, the determination of the entropy production for other planets is not always possible due to the lack of necessary data.
From the biogeochemical point of view, the importance of the entropy production and disequilibrium on Mars lies in the fact that far from equilibrium is where self-organizing structures can emerge in a system [
7]. The knowledge of the entropy production in a system can provide insights about its evolution and constrain the processes that take place in it.
In this paper, we evaluate the entropy production of the present day Martian atmosphere at the surface level. In Section 2, we present the formalism used to evaluate the chemical entropy production. In order to correctly evaluate the entropy production, it is necessary to understand the thermodynamic parameters involved in the calculation. We fully characterize the Gibbs free energy equation by taking into account the variations of temperature, pressure and molar fraction and obtain a correct expression for the reverse reaction rates.
It is known that the relatively high concentration of ozone in our atmosphere is mainly due to the existence of life on Earth, which has increased the levels of oxygen in the atmosphere ever since the Great Oxidation Event [
10]. The little amount of O
3 present in the atmosphere of Mars is due to purely photochemical processes or at least no other mechanism is known up to now, since life has not been discovered on the planet and there is no (or little) geological activity on the planet. In Section 3, we determine the entropy production of the recombination reaction of ozone in Earth and Martian environments and compare the results. The thermodynamic parameters necessary to calculate the entropy production on Mars were obtained using the Laboratoire de Meteorologie Dynamique (LMD) General Circulation Model [
11], and the data of temperature and pressure in the lower Martian atmosphere were taken from the Rover Environmental Monitoring Station (REMS) [
12,
13] on board the Curiosity rover [
14].
The results of the entropy production calculations are shown in Section 4 for all of the chemical reactions considered. We discuss the results and summarize the main conclusions in Section 5.
2. Entropy Production in the Mars Atmosphere
A planetary atmosphere is a mixture of gases with a particular distribution, and it is mainly governed by the solar flux reaching the atmosphere and other incoming and outgoing fluxes of energy and matter. It is common to refer to an atmosphere as a closed system where only energy is leaving the planet, the total mass of the atmosphere being constrained. However, it can be mixed with different compounds and quantities. The chemical entropy of a system after Boltzmann’s interpretation gives the number of possible ways in which the system can be distributed. Using the Clausius interpretation, heat properties of the atmosphere could be induced from the calculations of the chemical entropy.
The entropy production is linked to biogeological evolution, recognized as the vital force of life [
15]; in the words of Boltzmann, “life is not a struggle for energy or food but rather for entropy”. Far from equilibrium, self-organizing structures, such as hurricanes or life, can emerge. Self-organization is usually understood as the process by which systems of many components tend to reach a particular state, a set of cycling states or a small volume of their state space (attractor basins), with no external interference.
In a chemical system, entropy depends directly on the chemical reactions in the system, and the entropy production is directly related to the direction of the reaction. A chemical reaction can go in the forward direction, when the reactants are combined to give products, but it is possible to have the reverse reaction, as well, when products are recombined to produce the reactants. These reactions depend on the concentration of the compounds and the variables of the system, such as temperature, pressure or volume, as is explained by Le Chatelier’s principle.
Given a forward reaction with a reaction rate constant,
kf, the mathematical expression to determine the reverse reaction rate constant as a function of the forward reaction is usually written as:
This expression comes from the Gibbs free energy expression in chemical equilibrium. In chemical equilibrium Δ
G=0, and the equilibrium constant becomes
, where
kf refers to forward reaction and
kr to reverse reaction. The mathematical expressions are as follows:
where, as usual,
Q is renamed
Keq in equilibrium. In those equations, Δ
G0 is the Gibbs free energy at unit pressure,
i.e.,, Δ
G0 = Δ
G0(
p0,
T) (Equation 5.3.6 in Kondepudi and Prigogine [
16]). Usually, this expression is used independently of the pressure conditions, due to misconceptions in the nomenclature [
17–
19]. Assuming an ideal gas, following Kondepudi and Prigogine [
16] (Equation 5.3.7), the appropriate expression valid for any temperature and pressure is:
where
Hm is the molar enthalpy at standard conditions. Assuming that the heat capacity (
Cp) is with temperature, this equation can be solved obtaining:
From this last equation, we can obtain at equilibrium (Δ
G(
p, T) = 0 and
Q =
Keq) an expression useful for the values of the thermodynamic variables using the definition of reverse reaction,
:
This expression accounts for the changes of pressure and temperature on the system. Although it might be not very relevant for a low temperature environment like Mars, it is very important for high pressures and temperatures.
Visscher and Moses [
20] included recently a correction factor to consider the reactions with a number of reactants different from the products. In such a situation, the relation between the forward and backward reactions reads:
where
pT is the total pressure. Assuming an ideal gas,
, the complete reverse kinetics equation is:
The numerical value 1.38065 × 10
−22 comes from the units used in the process. The Boltzmann constant is given in CGS units (1.38065 × 10
−16) and is divided by the standard pressure (1 bar = 1 × 10
6 dyn/cm
2), making the units consistent. The values of reaction rate constants for Mars are found in [
21].
Once the reverse reaction rate is determined, we can calculate the entropy production of the reaction. The entropy production is the difference between the speed at which entropy is created by the forward reaction and destroyed by the reverse reaction. Then, it is a measurement of the velocity of the variation of entropy, a magnitude that is useful in far from equilibrium situations. The rate of reaction is defined as the speed at which a chemical reaction happens. According to Kondepudi and Prigogine (Equation 9.5.11 in [
16]), for a chemical reaction corresponding to an elementary step, the entropy production
due to its non-equilibrium steady state is given by:
where R is the Boltzmann gas constant, and the forward and backward rates (
Rk,f,
Rk,r, respectively) of the
k-th reaction can be deduced by each reaction formula (still assuming a simple reaction step). The values of
Rk,f,
Rk,r are easily calculated as
and
, where [
X] means the concentration of the compound
X.
In a situation where one of the products is exactly zero, for example
, the reverse reaction does not exist, and it makes no sense to talk about entropy production in this context. According to Kondepudi and Prigogine (below; Equation 9.5.11 in [
16]), this expression “is valid only for elementary steps where whose reaction rates are specified by the stoichiometry”. As
Equation (7) is derived from
Equation (5), which represents an approximation close to the equilibrium, the entropy production is a good approximation when close to the equilibrium.
According to
Equation (7), in a situation where the reverse reaction rate is extremely small, the value of the entropy production would go to infinity. However, once a small quantity of
is created, the reverse reaction can occur, and the entropy production can be calculated, being able to determine the entropy of the reaction,
. The value of
under those circumstances will be tending to infinity, but it will be a numerically finite value, meaning that the reverse reaction rate is so small, that the reverse reaction takes a long time to occur. The bigger the value, the bigger the velocity at which the reaction is tending to equilibrium. In time, the concentration of the compound
will increase, and the
value will be a smaller numerical value,
i.e., the equilibrium is being reached, and therefore, the entropy production (which is a velocity after all) decreases.
The infinite value is only obtained when the value of the products is exactly zero, in which case it is not possible to talk about a “reaction”. Even with the smaller value of the products, the entropy production will have a numerical value that represents the velocity of the reaction in reaching equilibrium.
It is important to notice that
Equation (7) can by applied only to pure chemical reactions. Photochemical reactions cannot be calculated using this expression, since the reverse reaction never happens. In this paper, we limit our study of the entropy production to the case of pure chemical reactions in the atmosphere of Mars, although photochemical reactions are considered to determine the concentrations of the compounds in the atmosphere in the model.
3. Entropy Production of the Ozone Recombination Reaction
The entropy production of chemical reactions depends on the concentration of the compounds, as well as on the temperature and pressure of the environment. In this section, we estimate the entropy production for the reaction O + O
2 + M ⇌ O
3 + M on Mars and Earth, with M = CO
2. It is known that the presence of oxygen, and then ozone, in the Earth’s atmosphere is a consequence of life [
10], but the concentration of ozone on Mars is purely photochemical.
We have performed calculations of the entropy production of the recombination reaction of ozone for a single altitude on Earth and Mars, to analyze the chemical disequilibrium in both systems. On Mars, we analyze the entropy production of this reaction at the surface level, while on Earth, we analyze the reaction at an altitude of 100 km, where the amount of atomic oxygen is reasonable and the temperature and pressure are similar to the Martian values, to be able to compare the results. Although on Earth, the main collisional partners (M) in the ozone recombination reaction are N2, O2 and O, we consider M = CO2 for Earth and Mars, because CO2 is the dominant species on Mars and because it provides a lower limit of the magnitude of the entropy production.
For the determination of the disequilibrium of the Martian atmosphere, we have used a validated photochemical model previously used to analyze the composition of the atmosphere. The current version of the model includes a description of the atmosphere ranging from the surface to 150 km, divided in 131 altitude layers, and consisting of 35 atmospheric species interacting in 35 reactions. The distribution of the vertical layers is irregular, to enable greater precision at the ground level. The first layer describes the first few meters above the ground, whereas the upper layers span several kilometers. The photochemical model used to develop the thermodynamic calculations has been used before in Mars atmospheric studies [
22], proving the consistency of the model, and is currently a module of the LMD General Circulation Model [
23].
The calculation of the entropy production using the 1D model or the General Circulation Model (GCM) is the same for short-term calculations. If one wants to study the effect of the reverse reaction for long periods (including seasonality) and the change in the concentration of the species in the atmosphere, then the GCM would be necessary. In the short term, the variations in the concentrations as a consequence of the reverse reactions will not be appreciable, but in the long term, those small changes will have an effect.
In this manuscript, we determine the entropy production near the surface of Mars, because it is the hottest layer of the planet. Even though we only report the entropy production at the surface level, we do take into account the upper layers of the atmosphere in the calculation of the concentrations of the species and consider the photochemistry.
Despite the fact that we determine the disequilibrium using a 1D model for Mars, the results can be seen as representative of the atmosphere. 1D models are widely used in atmospheric sciences to analyze chemical features of the atmosphere, and models have been developed and applied to studies of Martian [
19] or exoplanet atmospheres [
24,
25].
The concentration of the species used for each environment is listed in
Table 1. Values for the concentrations at the surface level in the Martian environment have been taken from the LMD General Circulation Model [
11] for a solar longitude (Ls) of 180
°. The solar longitude is the Mars to Sun angle, measured from the Northern Hemisphere. Ls is 0
° at the vernal equinox (beginning of northern spring), 90
° at summer solstice, 180
° at autumnal equinox and 270
° at winter solstice [
26]. Values for Earth have been taken for an altitude of 100 km from the Naval Research Laboratory Mass Spectrometer and Incoherent Scatter Radar Exosphere (NRLMSISE) model and the U.S. standard atmospheric profile for mid-latitudes [
27].
The concentrations of O, O
2, CO
2 and O
3 on Earth are several orders of magnitude larger than Mars, as explained because the processes creating ozone on Earth are different than those on Mars. The values of the concentrations on Mars are different for each layer. In
Table 1, we show the values for the surface level on Mars, but the atmospheric profile is not uniform, in the same way that it is not uniform on Earth. The initial atmospheric profile is generated by the GCM and used as an initialization of the 1D model. The values shown in the table are very close to those used for the initialization of the model, since the system is in steady state, and concentrations do not change much in one day. In principle, the 1D model gives results close to those of the GCM, provided that the simulation is not too long, because there is no transport and in particular no vertical redistribution of the chemical species. The use of the 1D model for a few days there is generally correct and simplifies the calculation.
The reaction rate constant for Reaction 1, O + O
2 + CO
2 ⇌ O
3 + CO
2, is given by (from JPL Evaluation 14 in [
28]):
which is valid for both Earth and Mars. The value of 2.075 is due to the fact that CO
2 is the collisional molecule; it is a correction to include the efficiency of CO
2 as a third body [
29], and it is the value currently used in the LMD-GCM.
This reaction rate constant for the forward reaction, i.e., the creation of ozone, is dependent on the total concentration (density) of the atmosphere. The total density of Mars at the surface level after the General Circulation Model is ρM = 4.37E + 10 molec/cm3 and for Earth at 100 km is ρE = 9.584E + 12 molec/cm3.
Assuming those concentrations, we can calculate the reverse reaction rate constant (i.e., the speed at which the ozone is destructed into molecular and atomic oxygen) for both environments.
Table 2 shows the reaction rate constants for forward and reverse reactions for the Martian environment. The reverse reaction (
kr) has been calculated using the proper dependence on the Gibbs free energy explained in
Equation (4) and using the usual expression in
Equation (1) (
kr,classic), where
kr,classic does not account for the temperature-dependent correction term. Our calculations show that the reverse reaction rate constant is smaller when it is calculated using the temperature dependence in the chemical potential. The temperature of Mars is below the standard temperature of 298 K, and therefore, the molecular velocities are slower. It is therefore logical to think that the rate of reaction will be slower in an environment where the temperature is lower. The reverse reaction rate constant is usually miscalculated because of the use of the Gibbs free energy for the standard state instead of the correct Gibbs free energy. We show in this table the importance of the correct characterization of the thermodynamic potentials.
According to
Equation (7), the entropy production for this particular reaction can be calculated as:
Using the values in
Tables 1 and
2, we can calculate the entropy production for Earth and Mars at any time. For example, at noon, the entropy production per second for a unitary volume for Reaction 1 on Mars is 6.86 ×10
7 J/mol/K and for Earth is 8.18 ×10
15 J/mol/K.
In
Figure 1, we show the entropy production per second for the O + O
2 + CO
2 ⇌ O
3 + CO
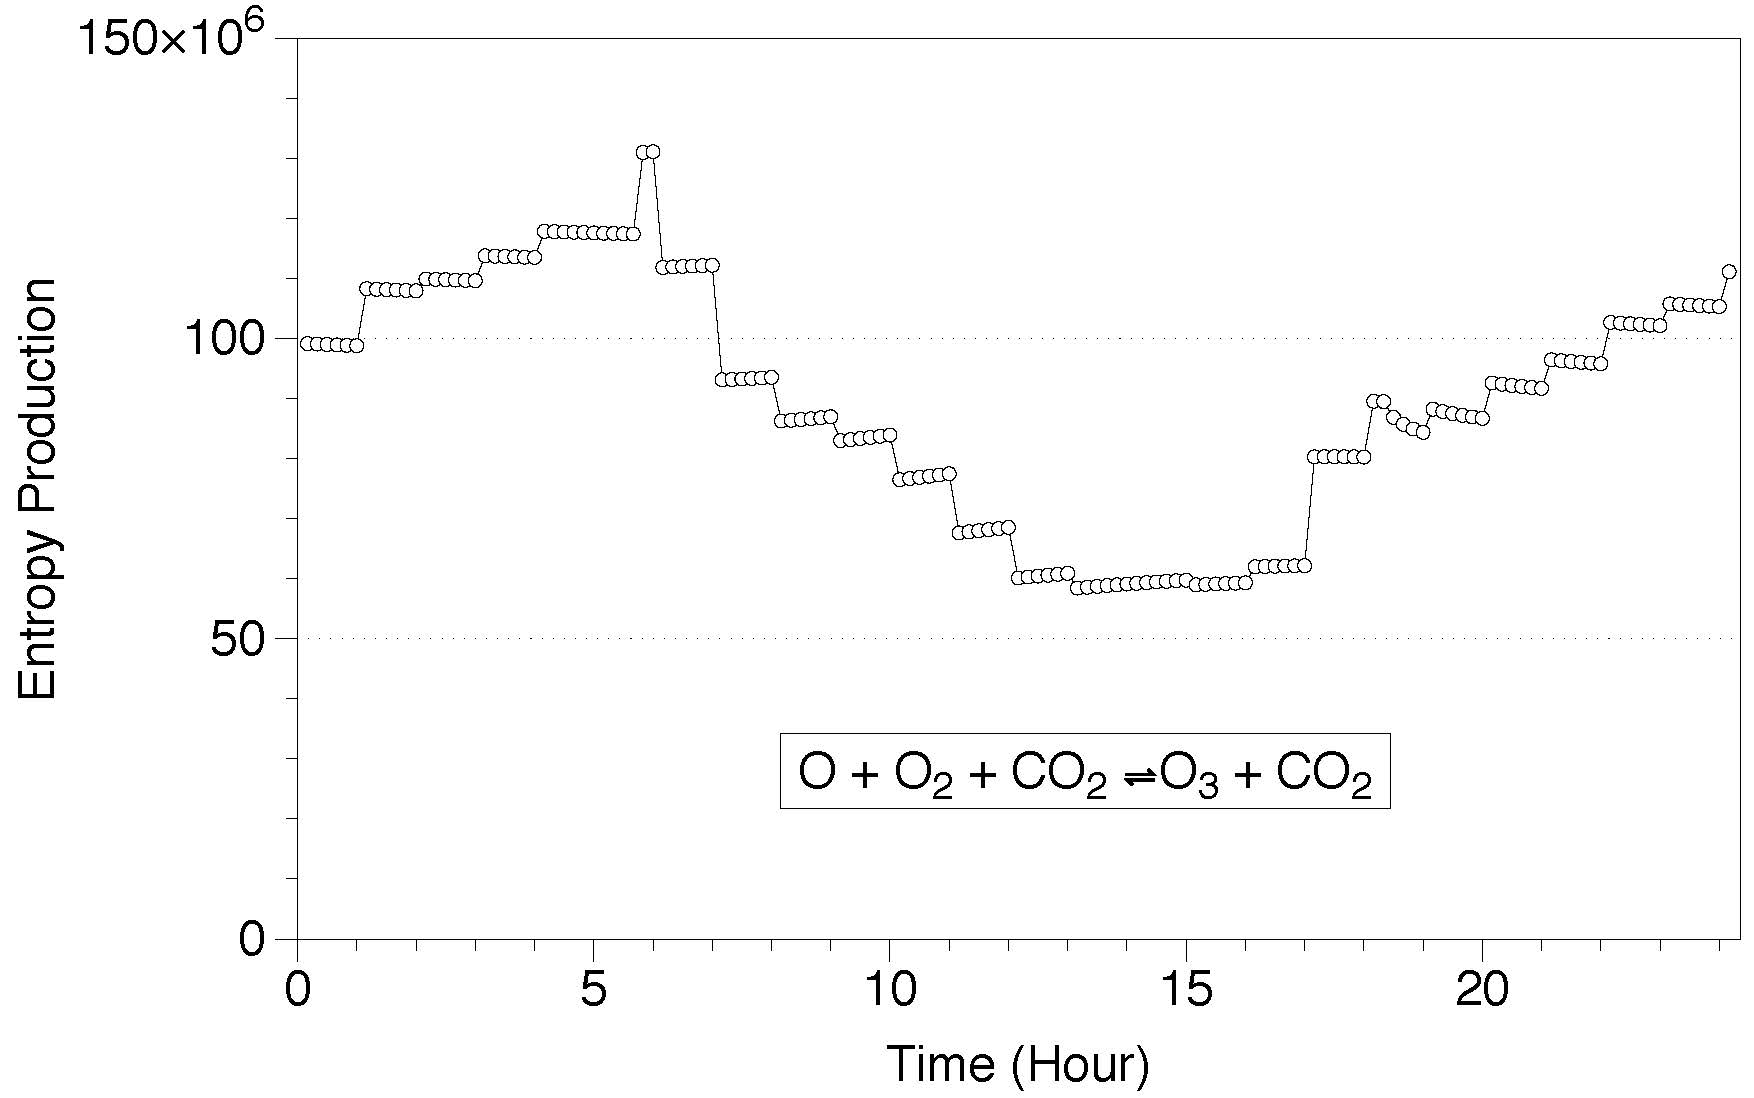
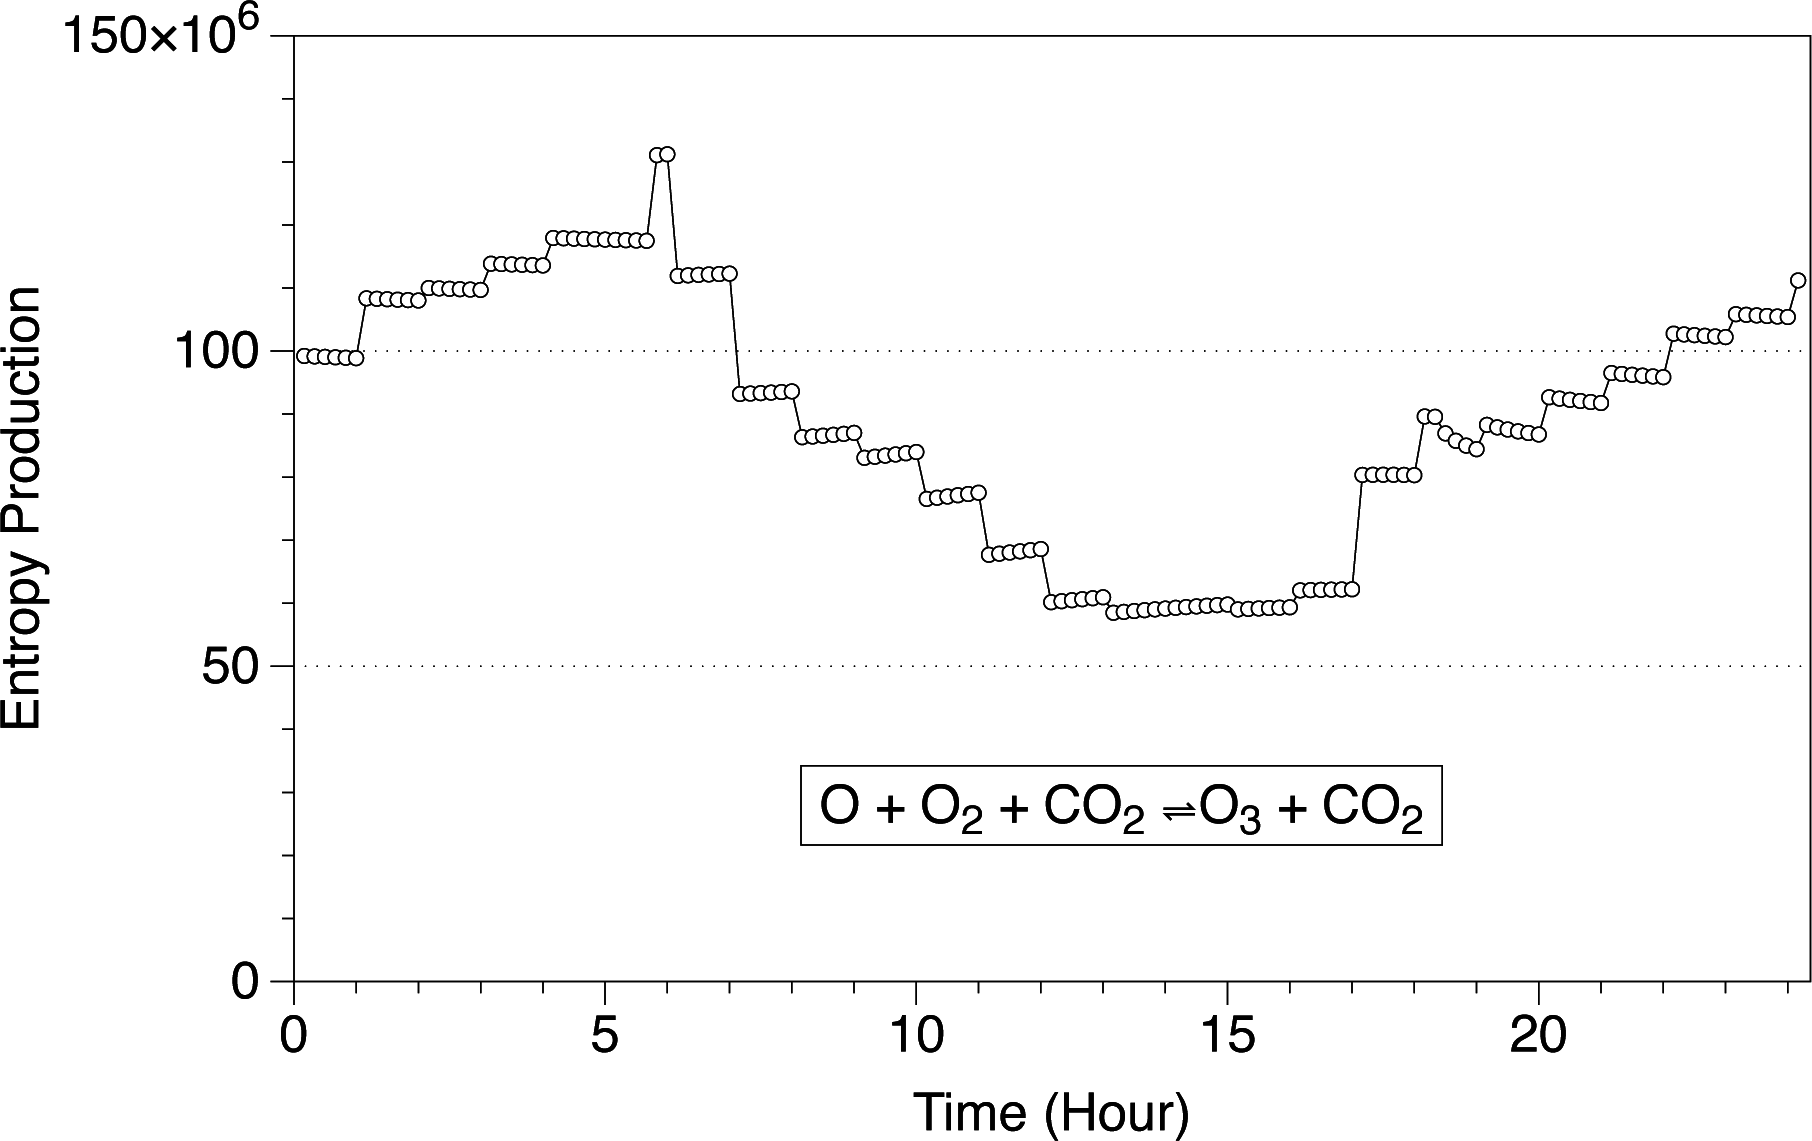
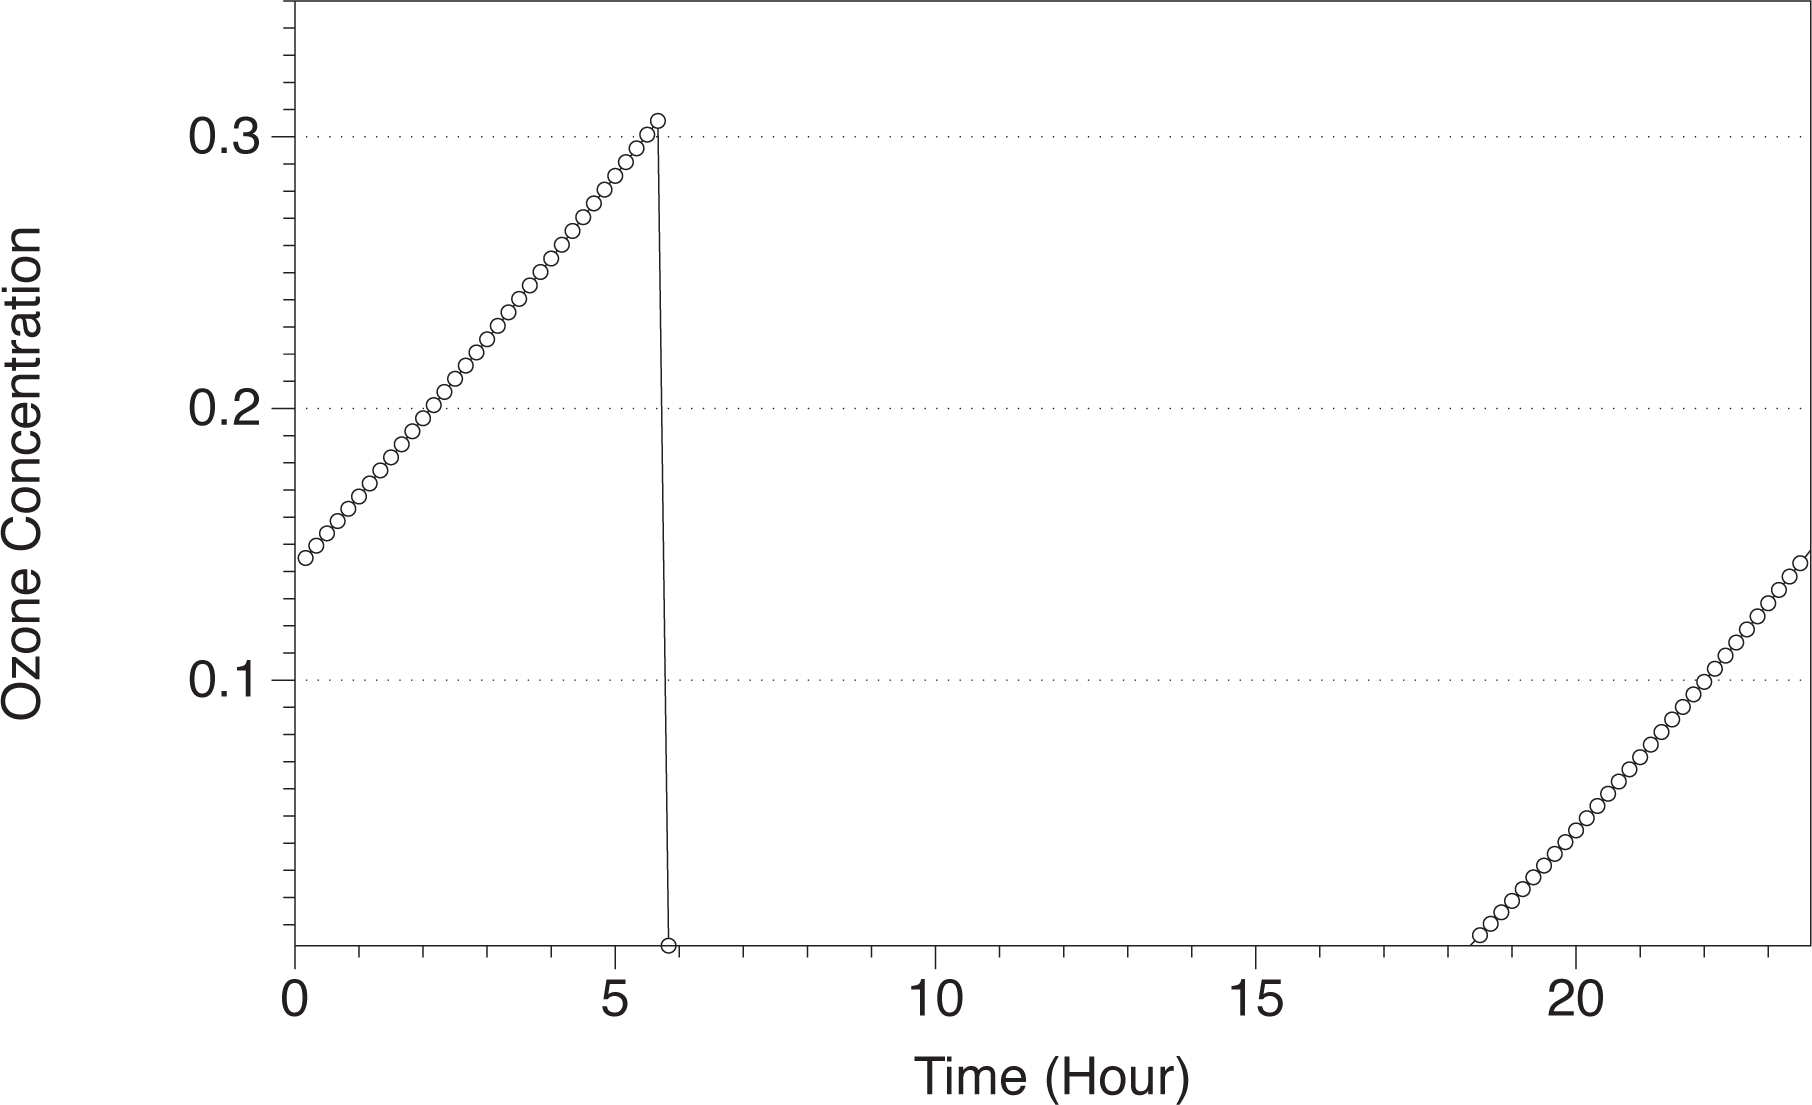
2 reaction at the surface level in the Martian atmosphere. The results are shown for Ls 180 as an example of the evolution of the chemical entropy within a day. The sign of the reaction is positive, meaning that the entropy is increasing as a consequence of this chemical reaction, and it changes during the day. The profile is regulated by the changes in thermodynamic variables and the composition of the atmospheric species. As can be seen, the system usually reaches equilibrium almost instantaneously for a given value of temperature and pressure, and the variation in entropy production is almost constant for a given temperature. However, some points at certain hours show a different behavior, as for example those points at Hour 6 and Hour 18. The non-constant behavior in the entropy production at those hours is a consequence of the changes in the concentration of the compounds and changes in the thermodynamic variables at the crater Gale. The chemistry is “disturbed” by the changes in temperature and pressure, and it takes a while until it goes back to normality. In
Figure 2, we show the concentration of ozone in the Martian atmosphere at the surface level at Ls 180. When the sun rises around Hour 6, the ozone concentration decreases drastically in two orders of magnitude as a consequence of photochemical reactions, creating a perturbation in the entropy production. At Hour 18, with sunset, the ozone concentration starts to increase, creating also a perturbation in the entropy production.
4. Results
In this section, we evaluate the chemical entropy production at the surface level in the Martian atmosphere for a set of 35 reactions. Some of them are exothermic, and this is taken into account in the calculations of the Gibbs free energy, necessary to determine the entropy production. As temperature, pressure and molar fractions are changing during the day, the entropy production, i.e., the rate at which entropy is produced, is also changing.
The composition of the Martian atmosphere is determined by physico-chemical processes. An example of the concentration of the compounds used in this work is shown in
Table 3 for Ls 180 at noon in molec/cm
3. Using our thermochemical model, we are able to determine the instant entropy production for the current Mars’ atmosphere. In
Table 4, the entropy production by chemical reactions for a set of 35 reactions is shown for Ls 180 at noon. The reactions used in this model are consistent with the Martian atmosphere and have been used previously to analyze the Martian atmosphere [
22].
With the calculations show in Section 3 and
Table 4, it is demonstrated that the entropy production per second on Earth for a single reaction (ozone recombination reaction,
σ = 8.18 ×10
15 J/mol/K) is several orders of magnitude larger than the total entropy production per second on Mars (35 reactions listed in
Table 4,
σ = 1.75×10
10 J/mol/K). In order to make a numerical comparison between the entropy production on the two planets, a model for the Earth atmosphere entropy production should be done, although it is clear that the entropy production of the Earth’s atmosphere will be greater than that on Mars.
5. Conclusions
We have demonstrated that the entropy production of the recombination reaction of ozone (O + O2 + CO2 ⇌ O3 + CO2) on Earth is several orders of magnitude larger than 35 chemical reactions on the Martian atmosphere. Note that the surface level is the hottest place in the atmosphere, but these results can be applied for every altitude on Mars. The low density and number of chemically-active species on Mars are responsible for the low entropy production of its atmosphere. On Earth, it is well known that the chemical disequilibrium in its atmosphere is due to living beings, but the small disequilibrium on Mars is believed to be a consequence of abiotic causes, such as the solar flux.
A large portion of life on Earth uses the molecular oxygen of the atmosphere in the respiration processes. During the day, oxygen is released to the atmosphere and is a consequence of photosynthetic life, and during the night, that oxygen is used by plants to complete the respiration process. Oxygen is necessary for photosynthesis and, at the same time, is increasing in our atmosphere as a consequence of it. The same applies for disequilibrium, which is a requirement for life, but is also a consequence of it [
30]. Disequilibrium is important in nature, and it is intimately related to life. One of the first requirements for the formation of living beings is disequilibrium, but this is not only limited to life. When a system is far from equilibrium, organized structures can emerge. Hurricanes are an example of a structure that needs disequilibrium to occur [
31]. In view of these results, the disequilibrium of Mars’ atmosphere is several orders of magnitude lower than on Earth, which could be interpreted as the small potential of the Mars atmosphere to create organized structures at a large scale as occurs on Earth. However, the existence of “complex” structures on Mars has been verified, such as dust devils. These little “hurricanes” are small compared to the Earth’s hurricanes and are pure dynamical processes; only physical processes are involved. Hurricanes on Earth involve water and the water cycle, but on Mars, only dust particles are involved. With the low chemical thermodynamic disequilibrium existing in the atmosphere of Mars nowadays, it seems very hard to create and maintain living structures on the surface.
The existence of disequilibrium as a biomarker has been proposed [
32–
35]. However, although it is true that in some cases, it can be related to life, such as the case of the Earth, abiotic processes can create and maintain chemical disequilibrium. Jupiter’s atmosphere is a mixture of gases with dynamical properties that can generate structures that are visible, even from the Earth, and no one believes that there is life on the planet. The determination of life cannot be done by simply analyzing the amount of disequilibrium of an atmosphere.
The entropy production in a system is a measurement of the disequilibrium of a system, which is a requirement for life. As has been noticed in the literature [
30,
36,
37], disequilibrium is needed to create and maintain life, since it is far from equilibrium, where self-organizing structures can emerge.
In order to calculate the chemical disequilibrium of the atmosphere of Mars, we have developed a 1D thermochemical model of the Martian atmosphere and calculated the forward and reverse reaction rate constants. As the thermodynamic variables of the system are changing, the values of the reaction rate constants are also changing. We determine the chemical potential of the compounds, including the correct dependence on pressure and temperature, and use those calculations to calculate the reverse rate of reactions. By comparison with previous approaches that do not include the changes in temperature and pressure, we find that the obtained reverse reaction rate constants are a few orders of magnitude lower at all altitudes in the atmosphere than previously thought.
We compare the disequilibrium in the atmosphere of Mars with one reaction in Earth’ atmosphere and conclude that that reaction on Earth is able to create more disequilibrium than the entire Martian atmosphere at all altitudes. The Mars system is not as far from equilibrium as the Earth is, and the complex structures that are possible to be created on Earth, such as life itself, might not be able to be created on Mars.
On Earth, chemical disequilibrium is a consequence of life on Earth, but it cannot be called a biomarker for other planets. Big complex structures are created on Jupiter and other planets by purely abiotic processes, which directly contradicts the idea that disequilibrium is a biomarker for that planet.


