Article

Neural Network Reorganization Analysis During an Auditory Oddball Task in Schizophrenia Using Wavelet Entropy

1
Biomedical Engineering Group, Universidad de Valladolid, Paseo Belén 15, 47011 Valladolid, Spain
2
IMUVA, Instituto de Investigación en Matemáticas, Universidad de Valladolid, Plaza de la Universidad, 1a, 47002 Valladolid, Spain
3
INCYL, Instituto de Neurociencias de Castilla y León, Universidad de Salamanca, Patio de las Escuelas 1, 37008 Salamanca, Spain
4
Facultad de Medicina, Universidad de Valladolid, Avenida Ramón y Cajal 7, 47007 Valladolid, Spain
*
Author to whom correspondence should be addressed.
Entropy 2015, 17(8), 5241-5256; https://0-doi-org.brum.beds.ac.uk/10.3390/e17085241
Submission received: 27 May 2015 / Revised: 11 July 2015 / Accepted: 20 July 2015 / Published: 27 July 2015
(This article belongs to the Special Issue Wavelet Entropy: Computation and Applications)

Abstract

:
The aim of the present study was to characterize the neural network reorganization during a cognitive task in schizophrenia (SCH) by means of wavelet entropy (WE). Previous studies suggest that the cognitive impairment in patients with SCH could be related to the disrupted integrative functions of neural circuits. Nevertheless, further characterization of this effect is needed, especially in the time-frequency domain. This characterization is sensitive to fast neuronal dynamics and their synchronization that may be an important component of distributed neuronal interactions; especially in light of the disconnection hypothesis for SCH and its electrophysiological correlates. In this work, the irregularity dynamics elicited by an auditory oddball paradigm were analyzed through synchronized-averaging (SA) and single-trial (ST) analyses. They provide complementary information on the spatial patterns involved in the neural network reorganization. Our results from 20 healthy controls and 20 SCH patients showed a WE decrease from baseline to response both in controls and SCH subjects. These changes were significantly more pronounced for healthy controls after ST analysis, mainly in central and frontopolar areas. On the other hand, SA analysis showed more widespread spatial differences than ST results. These findings suggest that the activation response is weakly phase-locked to stimulus onset in SCH and related to the default mode and salience networks. Furthermore, the less pronounced changes in WE from baseline to response for SCH patients suggest an impaired ability to reorganize neural dynamics during an oddball task.
PACS Codes:
89.70.Cf; 87.19.L; 87.19.le; 87.85.Ng

Graphical Abstract

1. Introduction

Schizophrenia (SCH) is a psychiatric disorder characterized by positive and negative symptoms, frequently accompanied by impaired cognitive processing [1]. An early SCH diagnosis is crucial, since the longer the period of untreated psychosis, the worse the outcome [2]. In this regard, SCH prevalence is estimated around 0.5%–1% [1], although this estimation could be overstated [3]. In addition, life expectancy is 11–20 years shorter in SCH patients compared to general population [4]. Therefore, SCH characterization is of paramount importance.
It has been proposed that cerebral substrates in SCH may be modified, at least in some cases, by a deficit in neural network reorganization during simple and complex tasks [5]. In this context, several studies addressed the characterization of neural disconnectivity abnormalities in SCH [6,7,8,9,10,11]. Most of these studies assessed brain differences by means of structural magnetic resonance imaging (MRI) [6,9], functional MRI [10] or diffusion tensor imaging [8,11]. It is noteworthy that neural mechanisms underlying cognitive dysfunctions in SCH are related to fast changes in the spatio-temporal patterns of neuronal modulation [12]. Thus, these techniques do not provide enough time resolution to study brain dynamics. On the other hand, electroencephalography (EEG) is a non-invasive technique, which provides high temporal resolution in the time range of milliseconds. Therefore, EEG can be then used to study fast interactions (e.g., changes from baseline to response windows). In this regard, event-related potentials (ERPs) have been used to assess cognitive processing in SCH. A P300 amplitude reduction [13] and an increase of P300 latency [14] have been usually reported in SCH. In addition, several studies showed the robust finding that mismatch negativity (MMN) response is diminished in patients with SCH [15,16]. MMN is an important paradigm for SCH research, because it could be linked to altered dopaminergic neurotransmission [17]. Nevertheless, it is necessary a deep study of the spectral and spatial brain dynamics to further understand the neural substrates underlying this pathology [12,18,19,20,21].
Different entropy measures have been used to describe the alterations in neural modulation associated with SCH. Takahashi et al. [22] computed the multiscale entropy. They identified abnormal EEG signal complexity patterns in anterior brain areas, which were related to disturbed cortical dynamics in SCH. Taghavi et al. [23] analyzed the EEG activity from SCH patients and healthy subjects using approximate entropy. In a recent study, Shannon’s entropy was used to classify controls and SCH patients from functional MRI [24]. The results did not show significant differences between both groups. However, they only studied resting state conditions, but no dynamical changes during a cognitive task. ERPs neural dynamics in SCH were analyzed by Bachiller et al. [25,26] by means of spectral entropy. In those studies, a widespread increase of signal regularity was obtained for SCH subjects [25,26].
It is noteworthy that most of the previous studies used an entropy definition based on short-time Fourier transform (STFT). Nevertheless, other time-frequency representations can be also considered. In this regard, continuous wavelet transform (CWT) has demonstrated to be a useful tool to perform the spectral characterization of ERPs [27]. CWT provides a good time resolution for high frequencies, as well as good frequency resolution for short time windows [28]. In addition, CWT is suitable for non-stationary time series, like biological signals [29]. In this study, wavelet entropy (WE) was calculated from CWT. WE is a particularization of Shannon’s entropy [30]. Hence, WE is useful to assess the dynamic irregularity patterns of electrophysiological signals, providing a measure of transient features for non-stationary ERP data [31].
The aim of the study was to characterize the neural network reorganization as a response to a cognitive task in SCH by means of WE. For this purpose, we analyzed the spectral changes elicited by an auditory oddball paradigm. Specifically, we assessed the dynamic irregularity patterns through synchronized-averaging (SA) and single-trial (ST) analyses. Few studies addressed the characterization of neural dynamics considering these two approaches jointly [32]. Furthermore, to the best of our knowledge, irregularity patters using these two approaches have never been studied in SCH.

2. Materials

2.1. Subjects

Twenty chronic SCH patients and 20 healthy controls with normal hearing participated in the study. SCH patients were diagnosed according to the Diagnostic and Statistical Manual of Mental Disorders, 5th edition [1] (DSM-V) criteria. The clinical status of the patients was scored using the Positive and Negative Syndrome Scale (PANSS) [33]. On the other hand, healthy controls (age- and gender-matched) were recruited through newspaper advertisements and remunerated for their cooperation. To discard major psychiatric antecedents (personal or family background) and current symptoms or treatments in the control group, semi-structured psychiatric interviews were performed prior to the study. The exclusion criteria can be summarized as follows: (i) neurologic illness or major head trauma that would result in abnormal EEG; (ii) electroconvulsive therapy; (iii) past or present alcohol or drug abuse, except for nicotine; (iv) for the patients, presence of any other current psychiatric process; and (v) for the controls, any current or past psychiatric diagnosis, or current treatment with drugs known to act on the central nervous system. Socio-demographic and clinical data for both groups are presented in Table 1.
It is noteworthy that all participants gave their informed consent prior to their participation in the study. Moreover, the study protocol was approved by the local Ethics Committee of University Hospitals from Valladolid and Salamanca (Spain) according to the code of ethics of the World Medical Association (Declaration of Helsinki).
Table 1. Socio-demographic and clinical characteristics. Values are shown as mean ± standard deviation (SD). NA represents “not applicable”.
CharacteristicSCH PatientsControls
Age (years)*35.45 ± 12.0733.35 ± 12.26
Gender (Male:Female)14:614:6
PANSS-Positive18.87 ± 4.39NA
PANSS-Negative20.93 ± 5.76NA
PANSS-Total74.47 ± 17.70NA
* Non-significant differences were found in age (Mann–Whitney U-test, p > 0.05).

2.2. Recording and Preprocessing of ERP Signals
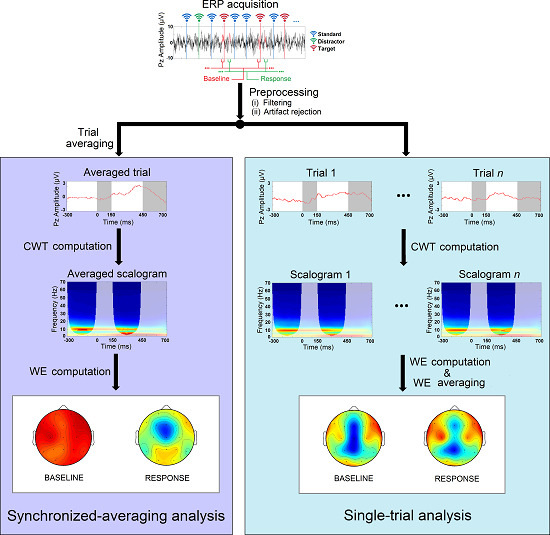
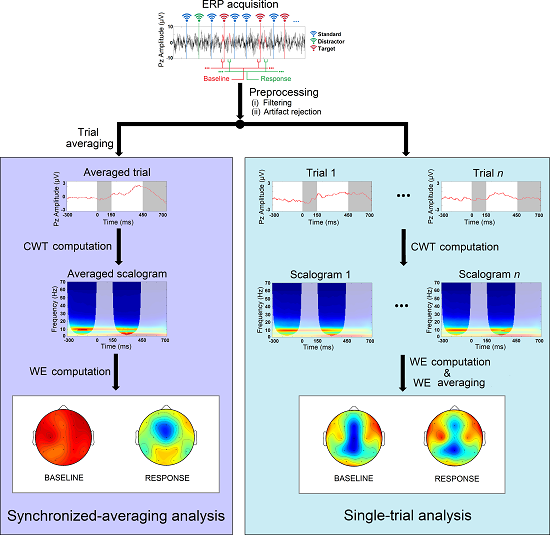
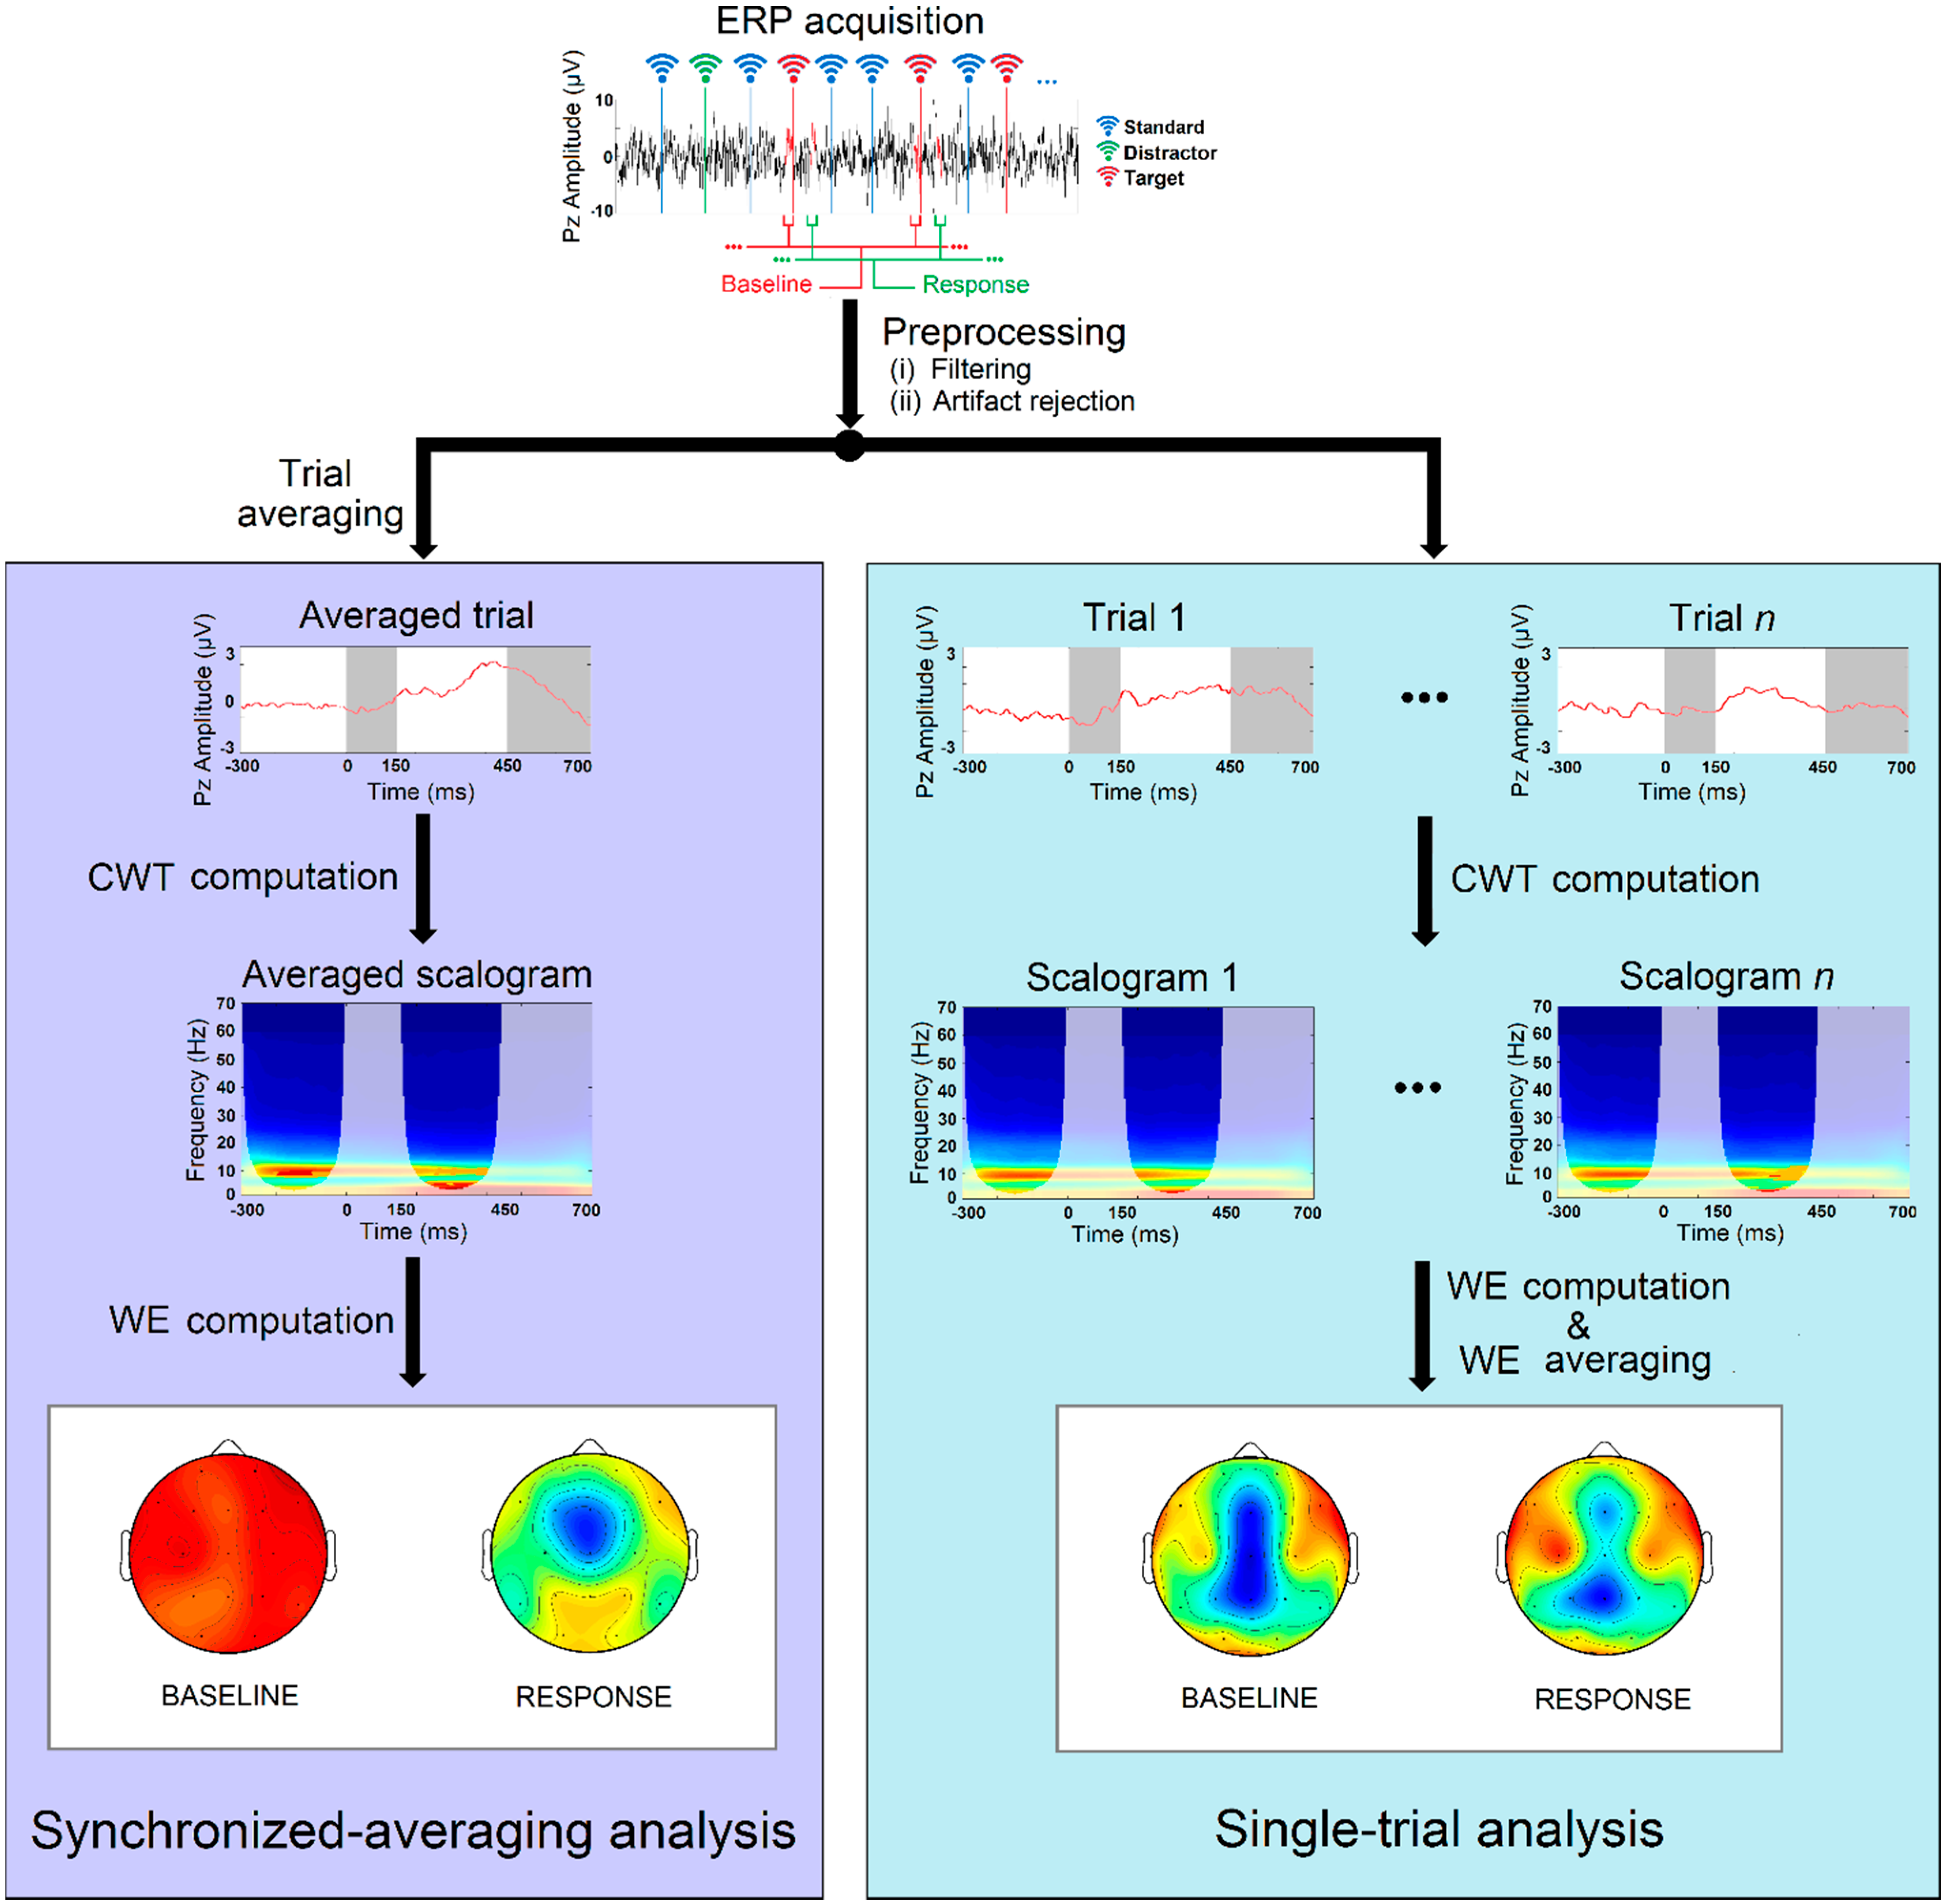
Data acquisition was carried out using an EEG system (BrainVision, Brain Products GmbH; Munich, Germany). Electrode placement followed the 10/20 system, with 17 electrodes at Fp1, Fp2, F3, F4, F7, F8, C3, C4, P3, P4, O1, O2, T5, T6, Fz, Pz and Cz. Impedances were kept below 5 kΩ during ERP acquisition. ERP recordings were performed while the participants were sat, relaxed and with their eyes closed. The auditory oddball task consisted in random series of 600 tones whose duration was 50 ms, intensity being 90 dB and inter-stimulus interval between tones randomly jittered between 1.16 and 1.44 s. Three different tones were presented: target (500 Hz tone), distractor (1000 Hz tone) and standard (2000 Hz tone) with probabilities of 0.20, 0.20 and 0.60, respectively.
ERP signals and stimulus markers were continuously recorded at a sampling frequency of 250 Hz, during 13 min of auditory oddball task. Data were re-referenced over Cz electrode to the average activity of all active sensors in order to minimize the effect of microsaccadic artifacts [34,35]. Then, signals were filtered using a band-pass finite impulse response filter with a Hamming window between 1 and 70 Hz. In addition, a 50 Hz notch filter was used in order to remove the power line artifact. Finally, a three-steps artifact rejection algorithm was applied to minimize oculographic and myographic artifacts [29]: (i) components related to eyeblinks, according to a visual inspection of the scalp maps and their temporal activations from independent component analysis (ICA), were discarded; (ii) segmentation into 1 s-length trials ranging from −300 ms before stimulus onset to 700 ms after stimulus onset; and (iii) automatic and adaptative trial rejection using a statistical-based thresholding method. Only target tones were considered for further analysis. The average number of selected trials for target condition was 80.85 ± 20.62 for SCH patients and 88.75 ± 10.12 for healthy controls (mean ± SD).

3. Methods

ERPs can be analyzed using two different approaches: SA analysis and ST analysis [36,37]. SA analysis is based on the averaging of all trials. It provides a measure of the evoked response, which is phase-locked to the stimulus onset. On the other hand, ST analysis is useful to jointly analyze the evoked and the induced response, which is non-phase-locked to the stimulus onset. This different behavior is related to the phase-resetting hypothesis, which implies an interaction between stimulus-related response and ongoing activity [38]. In summary, SA suppresses induced responses that are not time locked to the stimulus, while ST analyses retain both evoked and induced responses. These two methodologies can be helpful to further understand the neural network reorganization in SCH during an oddball task [36].
In SA analysis, the target trials were firstly averaged over time to obtain the evoked response. Then, WE was computed. In ST analysis, WE was calculated for each artifact-free trial. Then, WE was averaged across trials. A descriptive diagram of data acquisition and processing steps is shown in Figure 1, both for SA (left panel) and ST (right panel) analyses. It is noteworthy that both SA and ST analyses are based on similar processing steps, like time-frequency estimation, WE computation and statistical analysis. These methods are described in the following sections.
Figure 1. Descriptive diagram corresponding to SA and ST analyses.
Entropy 17 05241 g001

3.1. Continuous Wavelet Transform

ERP recordings are non-stationary signals, whose properties may change over time [39]. Hence, methods that require stationary time series, like Fourier transform, are not suitable to analyze their time-varying properties. CWT provides an alternative way to describe the dynamic properties of ERPs. Wavelet analysis relies on the introduction of an appropriate basis of functions. A wavelet is a zero mean function characterized by its localization in time (Δt) and frequency (Δf) [40]. In this study, the complex Morlet wavelet was chosen as “mother wavelet”, since it provides a biologically plausible fit to ERP data [36]. Complex Morlet wavelet is defined as follows [28]:
φ ( t ) = 1 π Ω b exp ( j 2 π Ω c t ) exp ( t 2 Ω b ) ,
where Ωb is the bandwidth parameter and Ωc represents the wavelet center frequency. In this study, both were set to 1, in order to obtain a balanced relationship between Δt and Δf at low frequencies [29].
A wavelet family is a set of elementary functions generated by dilations and translations of the mother wavelet [41]. Thus, the CWT of each trial is defined as the convolution of the trial, x(t), with a scaled and translated version of the complex Morlet wavelet:
CWT ( k , s ) = 1 s + x ( t ) φ * ( t k s ) d t ,
where s represents the dilation factor (s = {si, i = 1, …, M}), k is the translation factor and * denotes the complex conjugation. The dilation factor was set to include frequencies from 1 Hz (s1) to 70 Hz (sM) in equally-spaced intervals of 0.5 Hz [29].
The wavelet energy is a simple way to represent the magnitude of EEG oscillations at specific scales [41]. The wavelet scalogram (WS) summarizes the distribution of the signal energy in the time-frequency plane. It is obtained as the squared modulus of the wavelet coefficients [28]. In this study, WS was normalized (WSn) to range from 0 to 1. Thus, it can be interpreted as a probability density function:
WS n ( k , s ) = | CWT ( k , s ) | 2 s | CWT ( k , s ) | 2 .
Once the WSn was obtained for each target 1 s-length trial, two windows of interest were considered: (i) the baseline window, [−300, 0] ms before the stimulus onset; and (ii) the response window, [150,450] ms after stimulus onset [29].
On the contrary to the analyses based on Fourier transform, CWT has a variable time-frequency resolution [28]. Shorter time windows are related to higher frequencies, while longer time windows are associated with lower frequencies [28,42]. It is important to note that ERP signals are finite and short-time recordings. Therefore, edge effects are not negligible [40]. A cone of influence (COI) was defined in order to avoid edge effects [40]. In the present research, two windows were defined: baseline and response (see Figure 1). Thus, the spectral content must be only considered into the time-frequency regions delimited by their respective COIs. Specifically, spectral content between 4 Hz and 70 Hz was considered for further analysis. Thereby, delta band, between 1 and 4 Hz, was not analyzed, since it is associated with a wavelet duration of hundreds of milliseconds [29].

3.2. Wavelet Entropy

Shannon’s entropy was defined in 1958 [30]. Similarly, WE provides an estimation of the signal’s irregularity. The time-dependent WE can be defined as follows [41]:
WE ( k ) = 1 log ( M ) s WS n ( k , s ) log [ WS n ( k , s ) ] ,
In the present study, WE(k) was computed for all subjects from −300 ms to 700 ms from stimulus onset. Then, WE(k) was averaged in the time domain to obtain a single WE value on each window: baseline (i.e., from −300 ms to the stimulus onset) and response (i.e., from 150 ms to 450 ms post-stimulus). The following equation summarizes the averaging of WE for each window of interest:
WE w = 1 K k w WE ( k ) , w = { b, r }
where K represents the number of samples in the analyzed window and w denotes the corresponding window: baseline (b) or response (r). It is important to note that WE computation for SA analysis ( WE SA ) was directly obtained, because the synchronized trial averaging was previously carried out. However, in the case of WE for ST analysis ( WE ST ), WE values were averaged across trials (see Figure 1).
Thus, if a signal has few spectral components, there will be few non-zero energy components in the spectrogram. As a consequence, WE will be close to zero. On the other hand, a signal with several spectral components, like white noise, will have the energy distributed over the whole time-frequency plane. Thus, WSn will be similar for all resolution levels and the WE will yield a maximum value of 1.

3.3. Statistical Analysis

A descriptive analysis was initially performed to explore data distribution (normality and homoscedasticity). Variables did not meet the parametric assumptions. Hence, nonparametric tests were used to analyze the results. Wilcoxon signed-rank test was used to compare baseline and response values for within-group analyses. Mann–Whitney U-test was used for between-group analyses. Finally, in order to deal with the multiple-comparison problem, p-values obtained from both tests were corrected with the false discovery rate (FDR) method [43].

4. Results

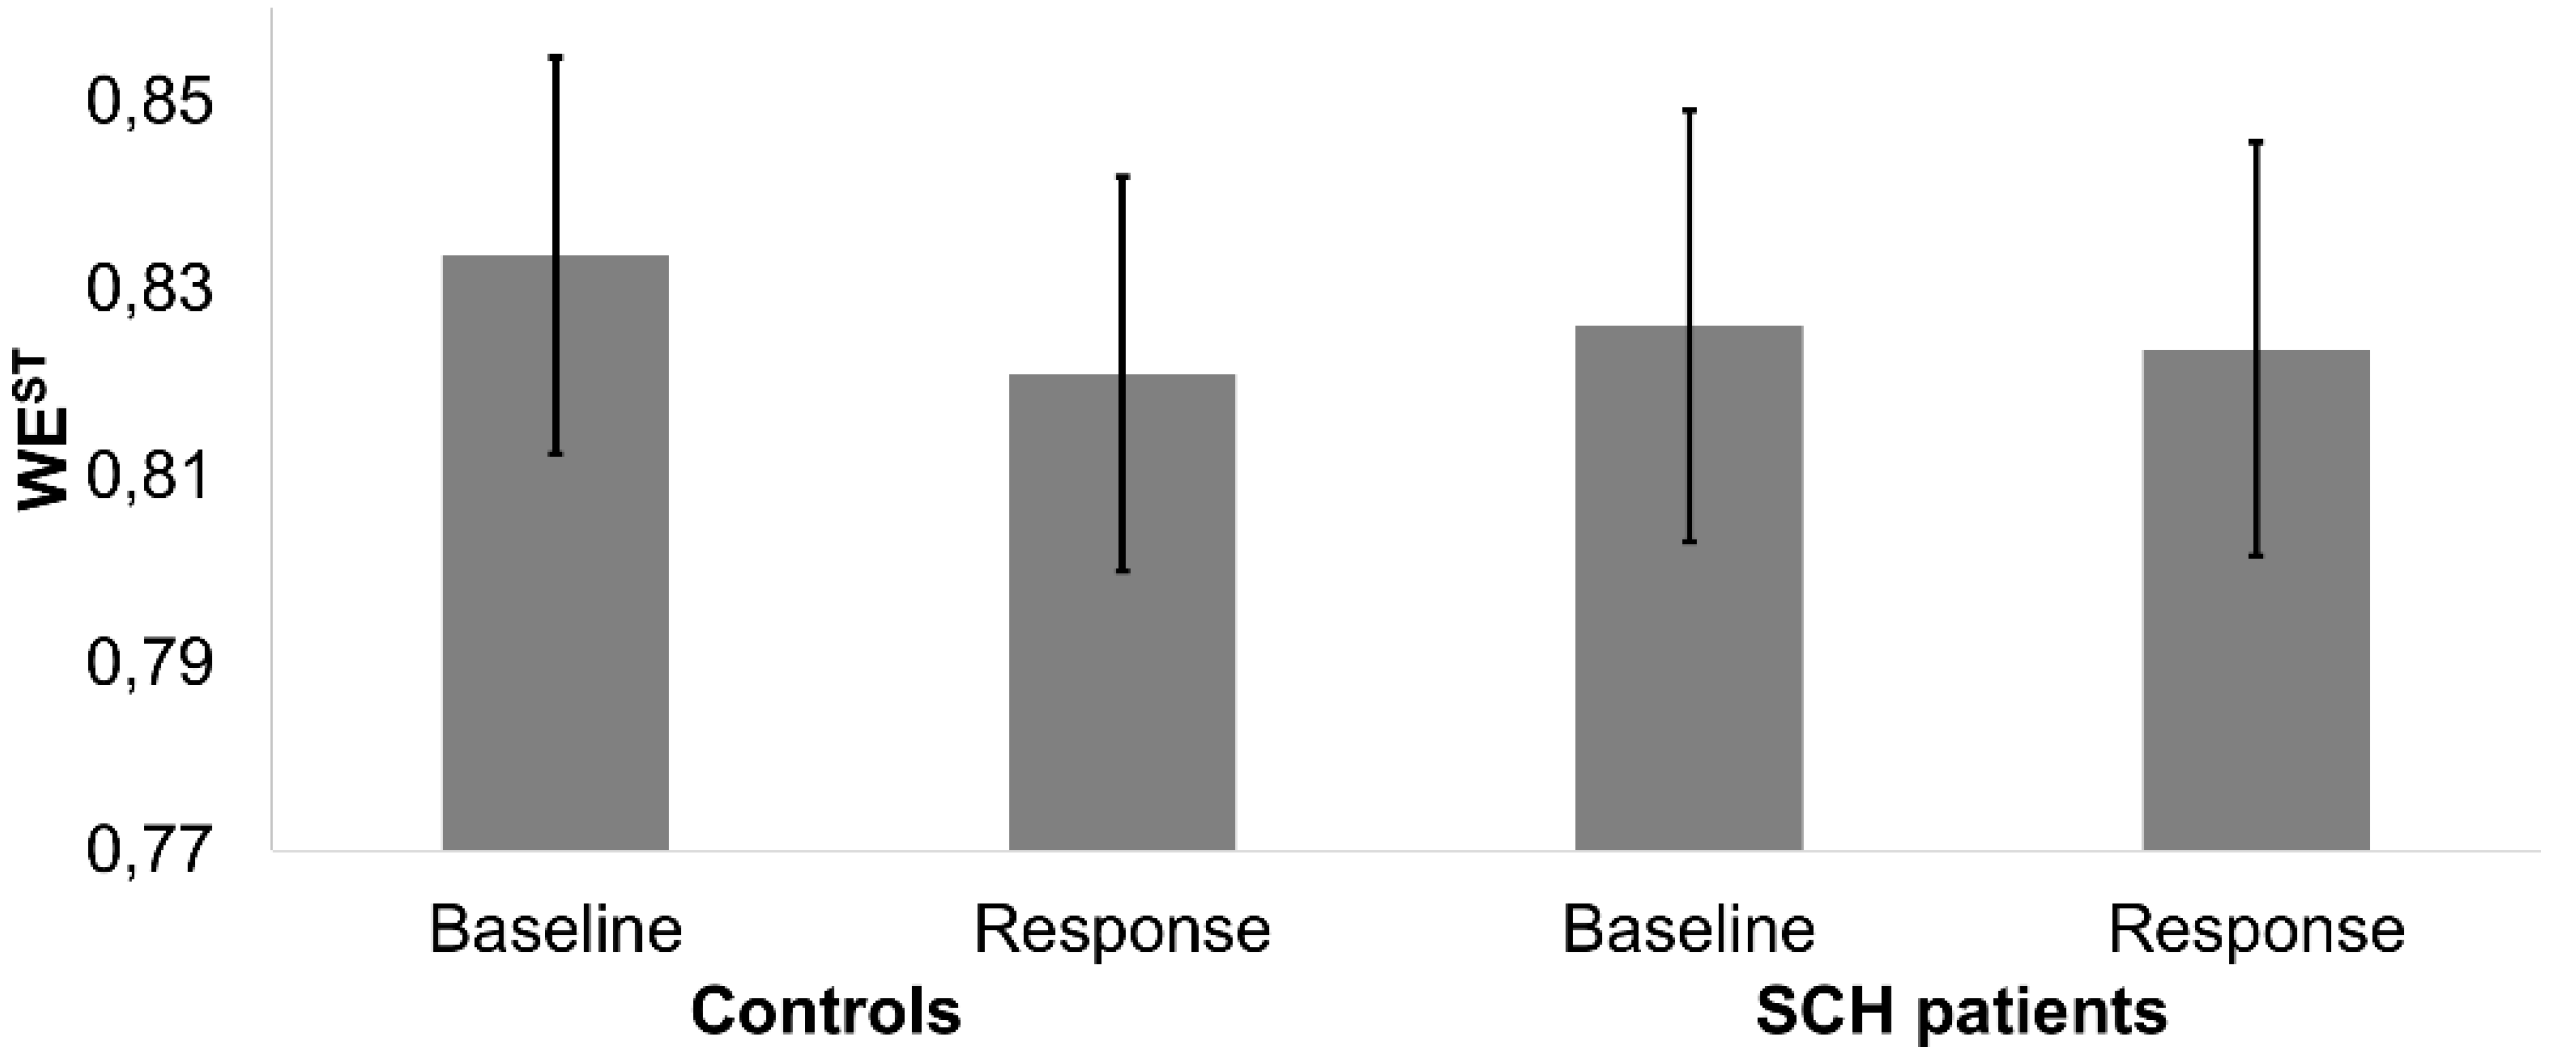
4.1. Single-Trial ERP Analysis

Initially, WE b ST and WE r ST were averaged over all sensors and trials to obtain a single value per subject. Figure 2 summarizes the global results of WE ST . Pairwise comparisons indicated that controls exhibited a statistically significant decrease of WE r ST compared to WE b ST (p = 7.21 × 10⁻³, Wilcoxon signed-rank test). Non-significant differences were found between baseline and response windows in SCH patients (p > 0.05, Wilcoxon signed-rank test). In addition, non-significant differences were found in WE b ST and WE r ST between both groups (p > 0.05, Mann–Whitney U-test).
Spatial analyses of the same (un-pooled) data are summarized in Figure 3. It depicts the WE b ST and WE r ST spatial distributions for both groups. Statistical analyses showed a widespread decrease of WE ST for controls from baseline to active response. Although this decrease can also be observed in SCH patients, it was less evident. Non-significant differences were found either in the baseline or in the response window between both groups. Nevertheless, between-group analysis showed a more pronounced WE ST decrease for controls than for SCH patients. Controls showed a widespread decrease of WE ST , while SCH patients only exhibit a slight and non-significant decrease. The most significant differences between both groups were found in central regions (Mann–Whitney U-test).
Figure 2. Mean and standard errors corresponding to the grand-average WE ST across subjects for each group (controls and SCH patients) in the baseline and the response windows.
Entropy 17 05241 g002
Figure 3. Sensor-level topographic maps of the statistics computed for WE ST between controls and SCH patients. Right column shows within-group differences from baseline to response windows (Wilcoxon signed-rank test), whereas bottom row shows between-group differences for each window (Mann–Whitney U-test). The corrected p-values are obtained controlling FDR.
Entropy 17 05241 g003

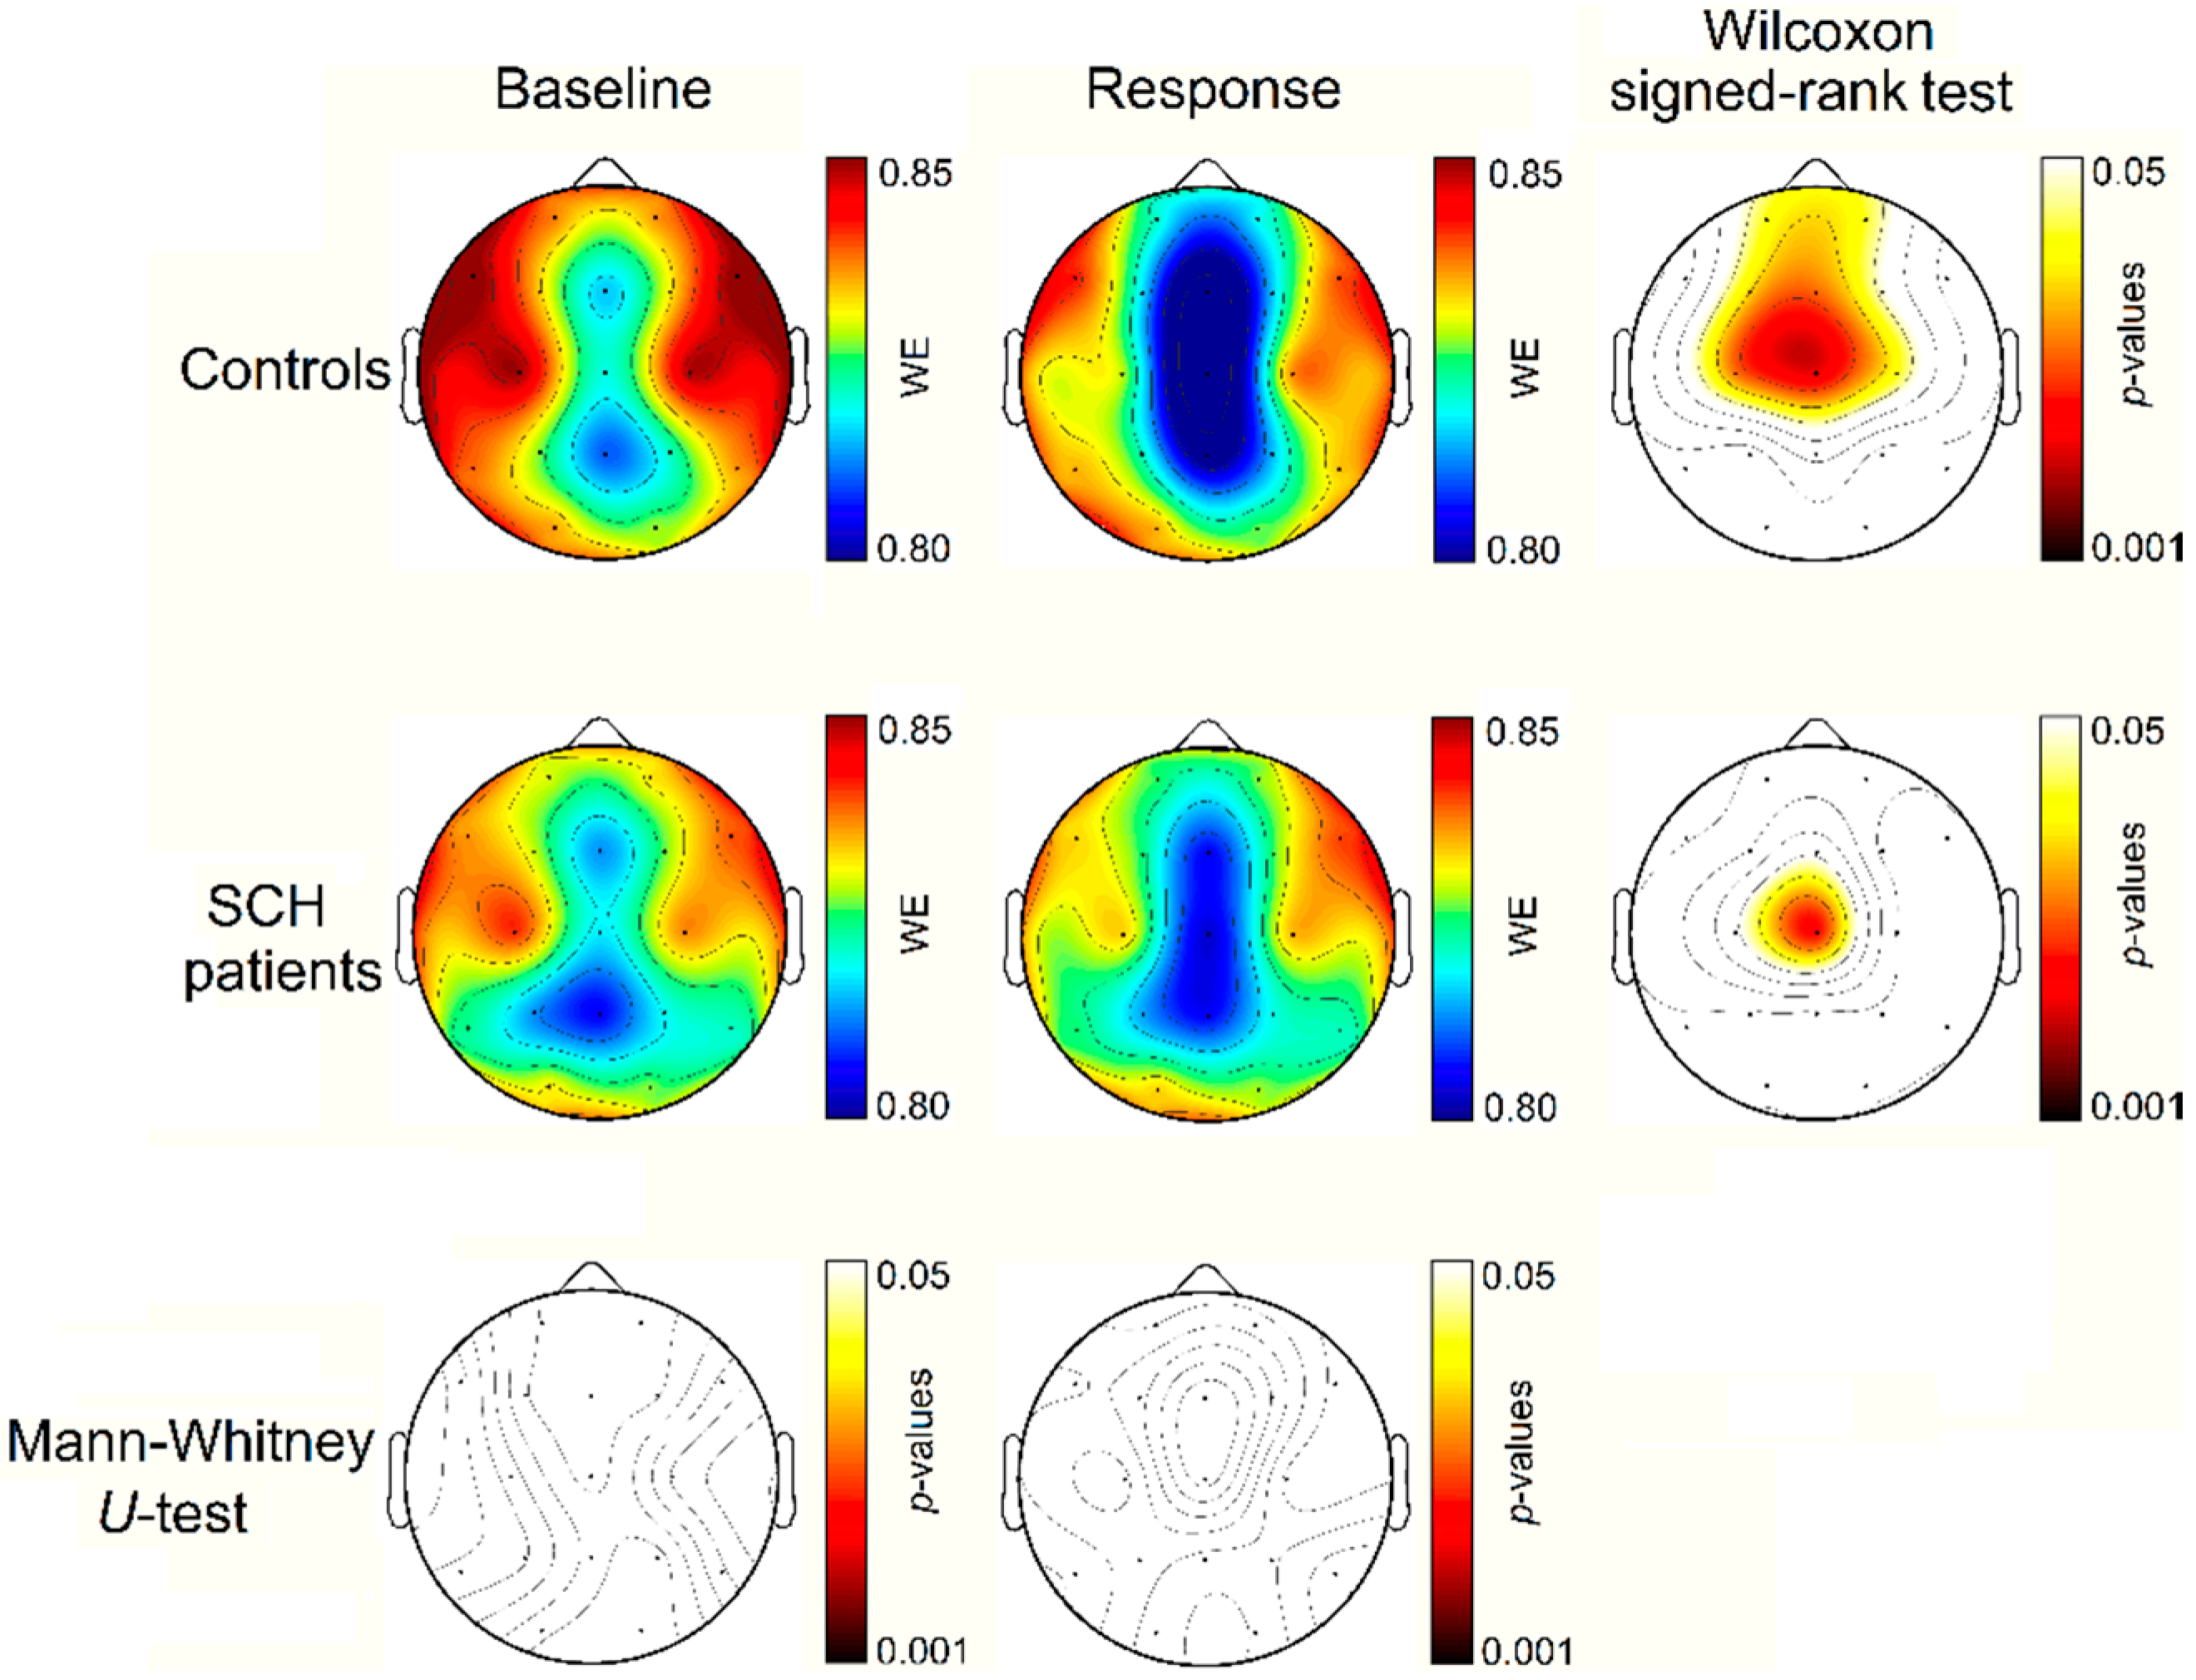
4.2. Synchronized-Averaging ERP Analysis

In a first step, WE b SA and WE r SA were averaged over all sensors to obtain a single value per subject. Figure 4 depicts the boxplots corresponding to the grand-averaged WE SA values for each group. In the case of the controls, WE r SA was significantly lower than WE b SA (p = 8.86 × 10⁻⁸, Wilcoxon signed-rank test). Significant differences were also found between baseline and response windows in SCH patients (p = 1.40 × 10⁻⁴, Wilcoxon signed-rank test). Between-group comparisons showed non-significant differences in WE b SA (p > 0.05, Mann–Whitney U-test). Nevertheless, comparisons for WE r SA values between both groups showed significant differences (p = 8.32 × 10⁻³, Mann–Whitney U-test).
Spatial patterns of un-pooled WE SA are summarized in Figure 5. WE b SA and WE r SA are depicted for both groups. Within-group analyses showed a widespread decrease of WE SA for controls from baseline to active response. This reduction affects to more regions that in ST analysis. Changes in WE SA were significant in all channels (Wilcoxon signed-rank test). This WE SA decrease can also be observed in SCH patients, but it was less widespread again. Regarding between-group analysis, non-significant differences were found in the baseline window, but these differences were significant in the response window, mainly in central and frontal electrodes (Mann-Whitney U-test). Decrease in WE SA values is more evident for controls group than for SCH patients. However, SCH patients also exhibit a widespread decrease of WE SA , though this reduction is less significant, especially in left parieto-occipital regions.
Figure 4. Mean and standard errors corresponding to the grand-average WE SA across subjects for each group (controls and SCH patients) in the baseline and the response windows.
Entropy 17 05241 g004

5. Discussion

In this study, we analyzed neural dynamics in SCH during an auditory oddball task by means of WE. We found that SCH patients showed lower changes in their irregularity patterns during the active response compared to controls for the two analyzed approaches: ST and SA. This abnormal spectral modulation suggests that a neural network reorganization deficit can be associated to SCH [44]. ST and SA analyses provided complementary information on the spatial patterns of neural network reorganization. SA approach captures stimulus-evoked processes whose oscillations were phase-synchronized from experimental events [36]. Neurophysiological evidences have linked evoked power to sensory registration procedures, as well as “top-down” cognitive processing during the active perception [36,37]. On the other hand, ST approach obtains event-related changes in ERP activity that are time-locked, but not phase-locked to the stimulus onset. Brain’s information processing is characterized by oscillations at various frequencies reflecting multiple neural processes at the same time [36]. Therefore, ST analysis may provide a measure of integrative and dynamically adaptive information processing [36,37].
Figure 5. Sensor-level topographic maps of the statistics computed for WE SA between controls and patients. Right column shows within-group differences from baseline to response windows (Wilcoxon signed-rank test), whereas bottom row shows between-group differences for each window (Mann–Whitney U-test). The corrected p-values are obtained controlling FDR.
Entropy 17 05241 g005
ST results showed a significant WE decrease from baseline to response window in controls (central and frontopolar areas) and SCH patients (only in central areas). Between-group analyses did not show statistically significant differences during the baseline and the response windows. These findings are consistent with previous studies, which found similar spatial patterns using spectral entropy [25,26] or analyzing the power in different frequency bands [45].
Regarding SA results, WE exhibits a similar behavior to ST analysis: (i) widespread decrease from baseline to response window for both groups; (ii) more pronounced modulation for controls compared to SCH patients; and (iii) non-significant between-group differences in the baseline window. However, SA analysis showed that several brain regions were involved in the neural network reorganization: central, frontal and temporal areas. This result can be due to the fact that only evoked response is considered in SA analysis. If the induced response was similar in baseline and response windows, it could contribute to reduce within-group differences in ST analysis. The oscillatory activity, which was observed in SA analysis, is related to the long-range cortical oscillatory events [46]. On the contrary, the smaller change in irregularity that we observed in ST analysis should correspond to a strong phase-locked variation, partially canceled out by some components non-phase-locked. Likewise, ST analysis is a useful tool to study phase/synchrony of ERPs [36]; nevertheless, WE is related to the power spectrum distribution. In this regard, phase synchronization was suggested as a key mechanism of dynamical neuronal communication, and can provide a useful measure of neural integration in sensory task-relevant procedures [47]. These findings are consistent with another study that showed greater differences between controls and SCH patients in the assessment of the evoked response than in the evaluation of the total response (induced and evoked) in delta band [32]. Therefore, the significant reduction of the irregularity in the evoked response for controls and the less evident difference in the evoked response for SCH patients reveals that activation response is weakly phase-locked to stimulus in schizophrenia.
It is important to understand the reasons of WE reduction from baseline to active response in ST and SA analyses. Previous studies found a reduction of the P300 amplitude in SCH patients, which was related to a decrease of relative power in alpha frequency band [42,48]. An increase of power in theta band during the P300 window has also been reported [49]. It was associated to the transitory coordination of EEG activity among distant regions [50]. In addition, high frequency bands are more influenced by the induced response than low frequency bands [51]. Thus, following these previous studies, it can be inferred that evoked response produced an increase in the concentration of low-frequency power (mainly around theta band [49]) at the expense of alpha and higher frequencies during the response window [42,48,51]. This result causes a reduction of the WS uniformity, mainly related to a decrease in power in the alpha band [48]. Although, the present study did not focus on spectral changes in specific frequency bands, these previous findings could provide a reasonable explanation for the decrease in WE that we observed. Low frequencies, like alpha band, are related to long-range interactions [20], suggesting that impaired activation response of long-range interactions might contribute to the pathological process. The lower irregularity reduction in the cognitive response of SCH patients seems to be associated with an abnormal information processing, as well as it could be related to the disrupted integrative functions of local and distributed neural circuits [32]. This result suggests that SCH is accompanied by a disrupted network reorganization of neural functions responsible of the P300 generation, mainly in long-range interaction.
Previous studies reported interesting findings regarding tone comparisons in SCH [25,52]. Their conclusions support the notion that bioelectrical responses to both distractor and target tones during an oddball task were attenuated in SCH patients compared to controls. In the present study, similar findings were found using WE. Thus, widespread significant differences were only found in the study of the target tone when comparing between-groups responses. In addition, higher differences between target and standard tones were obtained for controls than for SCH patients when target and standard tones were compared during the response window. Other studies reported similar results [25,36,52]. The standard tone is more likely to occur than the target tone, but lacks the novelty and relevance that characterize the target. Therefore, while the standard tone is similarly processed by SCH patients and controls, the target tone produces a diminished response in SCH patients compared to controls [25]. These outcomes are in line with the disconnection hypothesis in SCH. This hypothesis poses the idea that the SCH pathology is expressed at the modulation level of the associative plasticity for memory, which is more related to target than to non-target tones [5].
The default mode network (DMN) is an important brain network, which is active at rest, but de-activates during the performance of most cognitive tasks [53]. The middle-line of the brain includes the main cerebral areas associated with DMN [54]. A larger activity in this network is consistent with the spatial patterns at baseline window in both SA and ST approaches (Figure 3 and Figure 5). During the performance of a cognitive task, salience network is active. Some studies suggest that aberrant activity related to salience network can play a cardinal role in psychosis [55]. This network mainly includes insula an anterior cingulate cortex [55,56]. Figure 3 and Figure 5 show that the main differences in a cognitive response appear in these regions. However, this modulation process is more evident in the control group, suggesting that SCH patients show an impaired ability for reconfiguring functional brain networks during a cognitive task. It is noteworthy that our analyses are based on low-density EEG recordings. High-density EEG would be desirable to infer accurate spatial conclusions on neural networks, like DMN or salience networks.
Some limitations of the study merit special attention. It could be appropriate to increase the sample size, including patients with other pathologies different than SCH, like bipolar disorder. The study of the delta band could be interesting to complement the reported results. For that purpose, it would be necessary to change the acquisition protocol in order to increase the window length. Nevertheless, some studies reported the difficulty of including delta band, since the response window must contain a minimum number of oscillation periods to obtain an accurate spectral estimation [47,57,58]. Likewise, other entropy measures, like multiscale entropy, could provide further information on the neural dynamics associated with SCH. Other features related to connectivity or cross-frequency coupling could complement the information obtained from WE. In this regard, ST analysis would merit special attention, since a deeper study of the phase and synchrony of the signals would be required.

6. Conclusions

ST and SA analyses provided complementary information on dynamic patterns of irregularity during a cognitive task. The less pronounced difference in the cognitive response in ST analysis suggests that the active response is weakly phase-locked to stimulus in SCH, mainly in long-range interactions. It is noteworthy that both evoked and induced responses involve the coordinated activity of different brain regions, including dynamic neural networks associated with resting (DMN) and cognitive performance (salience network). In addition, WE proved to be an appropriate measure to characterize ERP dynamics. Hence, WE between-group differences evidenced that irregularity patterns observed in ERP can be associated with an abnormal network reorganization in SCH during an auditory oddball task.

Acknowledgments

This study was supported by “Ministerio de Economía y Competitividad” and FEDER (TEC2014-53196-R), “Consejería de Educación de la Junta de Castilla y León” (VA059U13), “Fondo de Investigaciones Sanitarias del Instituto de Salud Carlos III” (FIS PI1102303) and “Gerencia Regional de Salud de Castilla y León” (GRS 613/A/11; GRS 932/A/14). Finally, J. Gomez-Pilar and A. Bachiller were in receipt of a PIF-UVA grant from University of Valladolid.

Author Contributions

Javier Gomez-Pilar designed the study, analyzed the data, interpreted the results and drafted the manuscript. Alejandro Bachiller took part in the collection of data and analyzed the results. Jesús Poza, Carlos Gómez and Roberto Hornero designed the study and interpreted the results. Vicente Molina took part in the diagnosis of the subjects, the collection of data and the interpretation of the results. All authors have read and approved the final manuscript.

Conflicts of Interest

The authors declare no conflict of interest.

References

  1. American Psychiatric Association. Diagnostic and Statistical Manual of Mental Disorders, 5th ed.; DSM-5; American Psychiatric Publishing: Arlington, VA, USA, 2013; p. 991. [Google Scholar]
  2. Marshall, M.; Lewis, S.; Lockwood, A.; Drake, R.; Jones, P.; Croudace, T. Association between duration of untreated psychosis and outcome in cohorts of first-episode patients: A systematic review. Arch. Gen. Psychiatry 2005, 62, 975–983. [Google Scholar] [CrossRef] [PubMed]
  3. Saha, S.; Chant, D.; Welham, J.; McGrath, J. A systematic review of the prevalence of schizophrenia. PLoS Med. 2005, 2, 0413–0433. [Google Scholar] [CrossRef] [PubMed] [Green Version]
  4. Laursen, T.M.; Nordentoft, M.; Mortensen, P.B. Excess early mortality in schizophrenia. Annu. Rev. Clin. Psychol. 2014, 10, 425–448. [Google Scholar] [CrossRef] [PubMed]
  5. Friston, K.J. The disconnection hypothesis. Schizophr. Res. 1998, 30, 115–125. [Google Scholar] [CrossRef]
  6. Bogerts, B.; Ashtari, M.; Degreef, G.; Alvir, J.; Bilder, R.M.; Lieberman, J.A. Reduced temporal limbic structure volumes on magnetic resonance images in first episode schizophrenia. Psychiatry Res. Neuroimaging 1990, 35, 1–13. [Google Scholar] [CrossRef]
  7. Uhlhaas, P.J.; Singer, W. Neural Synchrony in Brain Disorders: Relevance for Cognitive Dysfunctions and Pathophysiology. Neuron 2006, 52, 155–168. [Google Scholar] [CrossRef] [PubMed]
  8. Van den Heuvel, M.P.; Mandl, R.C.W.; Stam, C.J.; Kahn, R.S.; Hulshoff Pol, H.E. Aberrant frontal and temporal complex network structure in schizophrenia: a graph theoretical analysis. J. Neurosci. 2010, 30, 15915–15926. [Google Scholar] [CrossRef] [PubMed]
  9. Molina, V.; Hernández, J.A.; Sanz, J.; Paniagua, J.C.; Hernández, A.I.; Martín, C.; Matías, J.; Calama, J.; Bote, B. Subcortical and cortical gray matter differences between Kraepelinian and non-Kraepelinian schizophrenia patients identified using voxel-based morphometry. Psychiatry Res. Neuroimaging 2010, 184, 16–22. [Google Scholar] [CrossRef] [PubMed]
  10. Gur, R.E.; Gur, R.C. Functional magnetic resonance imaging in schizophrenia. Dialogues Clin. Neurosci. 2010, 12, 333–343. [Google Scholar] [PubMed]
  11. Kubicki, M.; McCarley, R.; Westin, C.-F.; Park, H.-J.; Maier, S.; Kikinis, R.; Jolesz, F.A.; Shenton, M.E. A review of diffusion tensor imaging studies in schizophrenia. J. Psychiatr. Res. 2007, 41, 15–30. [Google Scholar] [CrossRef] [PubMed]
  12. Uhlhaas, P.J.; Singer, W. Abnormal neural oscillations and synchrony in schizophrenia. Nat. Rev. Neurosci. 2010, 11, 100–113. [Google Scholar] [CrossRef] [PubMed]
  13. Mathalon, D.H.; Ford, J.M.; Pfefferbaum, A. Trait and state aspects of P300 amplitude reduction in schizophrenia: A retrospective longitudinal study. Biol. Psychiatry 2000, 47, 434–449. [Google Scholar] [CrossRef]
  14. O’Donnell, B.F.; Faux, S.F.; McCarley, R.W.; Kimble, M.O.; Salisbury, D.F.; Nestor, P.G.; Kikinis, R.; Jolesz, F.A.; Shenton, M.E. Increased rate of P300 latency prolongation with age in schizophrenia. Electrophysiological evidence for a neurodegenerative process. Arch. Gen. Psychiatry 1995, 52, 544–549. [Google Scholar] [CrossRef] [PubMed]
  15. Baldeweg, T.; Klugman, A.; Gruzelier, J.H.; Hirsch, S.R. Impairment in frontal but not temporal components of mismatch negativity in schizophrenia. Int. J. Psychophysiol. 2002, 43, 111–122. [Google Scholar] [CrossRef]
  16. Kircher, T.T.J.; Rapp, A.; Grodd, W.; Buchkremer, G.; Weiskopf, N.; Lutzenberger, W.; Ackermann, H.; Mathiak, K. Mismatch Negativity Responses in Schizophrenia: A Combined fMRI and Whole-Head MEG Study. Am. J. Psychiatry 2004, 161, 294–304. [Google Scholar] [CrossRef] [PubMed]
  17. Friston, K. Disconnection and cognitive dysmetria in schizophrenia. Am. J. Psychiatry 2005, 162, 429–432. [Google Scholar] [CrossRef] [PubMed]
  18. Uhlhaas, P.J.; Haenschel, C.; Nikolić, D.; Singer, W. The role of oscillations and synchrony in cortical networks and their putative relevance for the pathophysiology of schizophrenia. Schizophr. Bull. 2008, 34, 927–943. [Google Scholar] [CrossRef] [PubMed]
  19. Mazaheri, A.; Picton, T.W. EEG spectral dynamics during discrimination of auditory and visual targets. Cogn. Brain Res. 2005, 24, 81–96. [Google Scholar] [CrossRef] [PubMed]
  20. Uhlhaas, P.J.; Roux, F.; Rodriguez, E.; Rotarska-Jagiela, A.; Singer, W. Neural synchrony and the development of cortical networks. Trends Cogn. Sci. 2010, 14, 72–80. [Google Scholar] [CrossRef] [PubMed]
  21. Uhlhaas, P.J. Dysconnectivity, large-scale networks and neuronal dynamics in schizophrenia. Curr. Opin. Neurobiol. 2013, 23, 283–290. [Google Scholar] [CrossRef] [PubMed]
  22. Takahashi, T.; Cho, R.Y.; Mizuno, T.; Kikuchi, M.; Murata, T.; Takahashi, K.; Wada, Y. Antipsychotics reverse abnormal EEG complexity in drug-naive schizophrenia: A multiscale entropy analysis. Neuroimage 2010, 51, 173–182. [Google Scholar] [CrossRef] [PubMed]
  23. Taghavi, M.; Boostani, R.; Sabeti, M.; Taghavi, S.M.A. Usefulness of approximate entropy in the diagnosis of schizophrenia. Iran. J. Psychiatry Behav. Sci. 2011, 5, 62–70. [Google Scholar] [PubMed]
  24. Bassett, D.S.; Nelson, B.G.; Mueller, B.A.; Camchong, J.; Lim, K.O. Altered resting state complexity in schizophrenia. Neuroimage 2012, 59, 2196–2207. [Google Scholar] [CrossRef] [PubMed]
  25. Bachiller, A.; Lubeiro, A.; Díez, A.; Suazo, V.; Domínguez, C.; Blanco, J.A.; Ayuso, M.; Hornero, R.; Poza, J.; Molina, V. Decreased entropy modulation of EEG response to novelty and relevance in schizophrenia during a P300 task. Eur. Arch. Psychiatry Clin. Neurosci. 2014. [Google Scholar] [CrossRef] [PubMed]
  26. Bachiller, A.; Díez, A.; Suazo, V.; Domínguez, C.; Ayuso, M.; Hornero, R.; Poza, J.; Molina, V. Decreased spectral entropy modulation in patients with schizophrenia during a P300 task. Eur. Arch. Psychiatry Clin. Neurosci. 2014, 264, 533–543. [Google Scholar] [CrossRef] [PubMed]
  27. Le Van Quyen, M.; Foucher, J.; Lachaux, J.; Rodriguez, E.; Lutz, A.; Martinerie, J.; Varela, F.J. Comparison of Hilbert transform and wavelet methods for the analysis of neuronal synchrony. J. Neurosci. Methods 2001, 111, 83–98. [Google Scholar] [CrossRef]
  28. Mallat, S. A Wavelet Tour of Signal Processing; Academic Press: Waltham, MA, USA, 1999; pp. 20–41. [Google Scholar]
  29. Bachiller, A.; Poza, J.; Gómez, C.; Molina, V.; Suazo, V.; Hornero, R. A comparative study of event-related coupling patterns during an auditory oddball task in schizophrenia. J. Neural Eng. 2015, 12, 016007. [Google Scholar] [CrossRef] [PubMed]
  30. Shannon, C.E. A mathematical theory of communication. Bell Syst. Tech. J. 1948, 27, 379–423. [Google Scholar] [CrossRef]
  31. Quiroga, R.Q.; Rosso, O.A.; Başar, E.; Schürmann, M. Wavelet entropy in event-related potentials: A new method shows ordering of EEG oscillations. Biol. Cybern. 2001, 84, 291–299. [Google Scholar] [CrossRef] [PubMed]
  32. Ergen, M.; Marbach, S.; Brand, A.; Başar-Eroǧlu, C.; Demiralp, T. P3 and delta band responses in visual oddball paradigm in schizophrenia. Neurosci. Lett. 2008, 440, 304–308. [Google Scholar] [CrossRef] [PubMed]
  33. Kay, S.R.; Opler, L.A.; Lindenmayer, J.P. The Positive and Negative Syndrome Scale (PANSS): Rationale and standardisation. Br. J. Psychiatry 1989, 155, 59–65. [Google Scholar]
  34. Bledowski, C.; Prvulovic, D.; Hoechstetter, K.; Scherg, M.; Wibral, M.; Goebel, R.; Linden, D.E. Localizing P300 generators in visual target and distractor processing: A combined event-related potential and functional magnetic resonance imaging study. J. Neurosci. 2004, 24, 9353–9360. [Google Scholar] [CrossRef] [PubMed]
  35. Keren, A.S.; Yuval-Greenberg, S.; Deouell, L.Y. Saccadic spike potentials in gamma-band EEG: Characterization, detection and suppression. Neuroimage 2010, 49, 2248–2263. [Google Scholar] [CrossRef] [PubMed]
  36. Roach, B.J.; Mathalon, D.H. Event-related EEG time-frequency analysis: An overview of measures and an analysis of early gamma band phase locking in schizophrenia. Schizophr. Bull. 2008, 34, 907–926. [Google Scholar] [CrossRef] [PubMed]
  37. Makeig, S.; Debener, S.; Onton, J.; Delorme, A. Mining event-related brain dynamics. Trends Cogn. Sci. 2004, 8, 204–210. [Google Scholar] [CrossRef] [PubMed]
  38. David, O.; Harrison, L.; Friston, K.J. Modelling event-related responses in the brain. Neuroimage 2005, 25, 756–770. [Google Scholar] [CrossRef] [PubMed]
  39. Blanco, S.; Garcia, H.; Quiroga, R.Q.; Romanelli, L.; Rosso, O.A. Stationarity of the EEG series. IEEE Eng. Med. Biol. Mag. 1995, 14, 395–399. [Google Scholar] [CrossRef]
  40. Torrence, C.; Compo, G. A practical guide to wavelet analysis. Bull. Am. Meteorol. Soc. 1998, 79, 61–78. [Google Scholar] [CrossRef]
  41. Rosso, O.A.; Blanco, S.; Yordanova, J.; Kolev, V.; Figliola, A.; Schürmann, M.; Başar, E. Wavelet entropy: A new tool for analysis of short duration brain electrical signals. J. Neurosci. Methods 2001, 105, 65–75. [Google Scholar] [CrossRef]
  42. Ford, J.M.; Roach, B.J.; Faustman, W.O.; Mathalon, D.H. Synch before you speak: Auditory hallucinations in schizophrenia. Am. J. Psychiatry 2007, 164, 458–466. [Google Scholar] [CrossRef] [PubMed]
  43. Lage-Castellanos, A.; Martínez-Montes, E.; Hernández-Cabrera, J.A.; Galán, L. False discovery rate and permutation test: An evaluation in ERP data analysis. Stat. Med. 2010, 29, 63–74. [Google Scholar] [CrossRef] [PubMed]
  44. Kapur, S. Psychosis as a state of aberrant salience: A framework linking biology, phenomenology, and pharmacology in schizophrenia. Am. J. Psychiatry 2003, 160, 13–23. [Google Scholar] [CrossRef] [PubMed]
  45. Ferrarelli, F.; Massimini, M.; Peterson, M.J.; Riedner, B.A.; Lazar, M.; Murphy, M.J.; Huber, R.; Rosanova, M.; Alexander, A.L.; Kalin, N.; Tononi, G. Reduced Evoked Gamma Oscillations in the Frontal Cortex in Schizophrenia Patients a TMS EEG Study. Am. J. Psychiatry 2008, 165, 996–1005. [Google Scholar] [CrossRef] [PubMed]
  46. Tallon-Baudry, C.; Bertrand, O.; Delpuech, C.; Pernier, J. Stimulus specificity of phase-locked and non-phase-locked 40 Hz visual responses in human. J. Neurosci. 1996, 16, 4240–4249. [Google Scholar] [PubMed]
  47. Stefanics, G.; Hangya, B.; Hernádi, I.; Winkler, I.; Lakatos, P.; Ulbert, I. Phase entrainment of human delta oscillations can mediate the effects of expectation on reaction speed. J. Neurosci. 2010, 30, 13578–13585. [Google Scholar] [CrossRef] [PubMed]
  48. Bramon, E.; Rabe-Hesketh, S.; Sham, P.; Murray, R.M.; Frangou, S. Meta-analysis of the P300 and P50 waveforms in schizophrenia. Schizophr. Res. 2004, 70, 315–329. [Google Scholar] [CrossRef] [PubMed]
  49. Polich, J. Updating P300: An integrative theory of P3a and P3b. Clin. Neurophysiol. 2007, 118, 2128–2148. [Google Scholar] [CrossRef] [PubMed]
  50. Von Stein, A.; Chiang, C.; König, P. Top-down processing mediated by interareal synchronization. Proc. Natl. Acad. Sci. USA 2000, 97, 14748–14753. [Google Scholar] [CrossRef] [PubMed]
  51. Tallon-Baudry, C.; Bertrand, O. Oscillatory gamma activity and its role in object representation. Trends Cogn. Sci. 1999, 3, 151–162. [Google Scholar] [CrossRef]
  52. Potts, G.F.; Hirayasu, Y.; O’Donnell, B.F.; Shenton, M.E.; McCarley, R.W. High-density recording and topographic analysis of the auditory oddball event-related potential in patients with schizophrenia. Biol. Psychiatry 1998, 44, 982–989. [Google Scholar] [CrossRef]
  53. Raichle, M.E.; MacLeod, A.M.; Snyder, A.Z.; Powers, W.J.; Gusnard, D.A.; Shulman, G.L. A default mode of brain function. Proc. Natl. Acad. Sci. USA 2001, 98, 676–682. [Google Scholar] [CrossRef] [PubMed]
  54. Greicius, M.D.; Krasnow, B.; Reiss, A.L.; Menon, V. Functional connectivity in the resting brain: A network analysis of the default mode hypothesis. Proc. Natl. Acad. Sci. USA 2003, 100, 253–258. [Google Scholar] [CrossRef] [PubMed]
  55. Palaniyappan, L.; Doege, K.; Mallikarjun, P.; Liddle, E. Cortical thickness and oscillatory phase resetting: A proposed mechanism of salience network dysfunction in schizophrenia. Psychiatriki 2012, 23, 117–129. [Google Scholar] [PubMed]
  56. White, T.P.; Joseph, V.; Francis, S.T.; Liddle, P.F. Aberrant salience network (bilateral insula and anterior cingulate cortex) connectivity during information processing in schizophrenia. Schizophr. Res. 2010, 123, 105–115. [Google Scholar] [CrossRef] [PubMed]
  57. Mormann, F.; Fell, J.; Axmacher, N.; Weber, B.; Lehnertz, K.; Elger, C.E.; Fernández, G. Phase/amplitude reset and theta-gamma interaction in the human medial temporal lobe during a continuous word recognition memory task. Hippocampus 2005, 15, 890–900. [Google Scholar] [CrossRef] [PubMed]
  58. Gomez-Ramirez, M.; Kelly, S.P.; Molholm, S.; Sehatpour, P.; Schwartz, T.H.; Foxe, J.J. Oscillatory Sensory Selection Mechanisms during Intersensory Attention to Rhythmic Auditory and Visual Inputs: A Human Electrocorticographic Investigation. J. Neurosci. 2011, 31, 18556–18567. [Google Scholar] [CrossRef] [PubMed]

