
Optimal Base Wavelet Selection for ECG Noise Reduction Using a Comprehensive Entropy Criterion

Abstract
:1. Introduction
2. Discrete Wavelet Thresholding Denoising of ECG Signals
- (1)
- Choose an optimal base wavelet according to the noisy signal. Then, decompose the noisy signal into sub-bands by wavelet transform to yield coarse level scaling coefficients and wavelet coefficients.
- (2)
- Estimate the noise threshold T and design the threshold shrinkage function according to the requirements of noise reduction. Then, filter the noise by applying the shrinkage function to every wavelet coefficient.
- (3)
- Reconstruct the signal with new coefficients to obtain the estimated signal .
3. Comprehensive Entropy Criterion for Optimal Wavelet Selection
3.1. Decomposing Capability Measure
3.2. Information Comparison Measure
3.3. Comprehensive Entropy Criterion
4. Experiments and Comparison
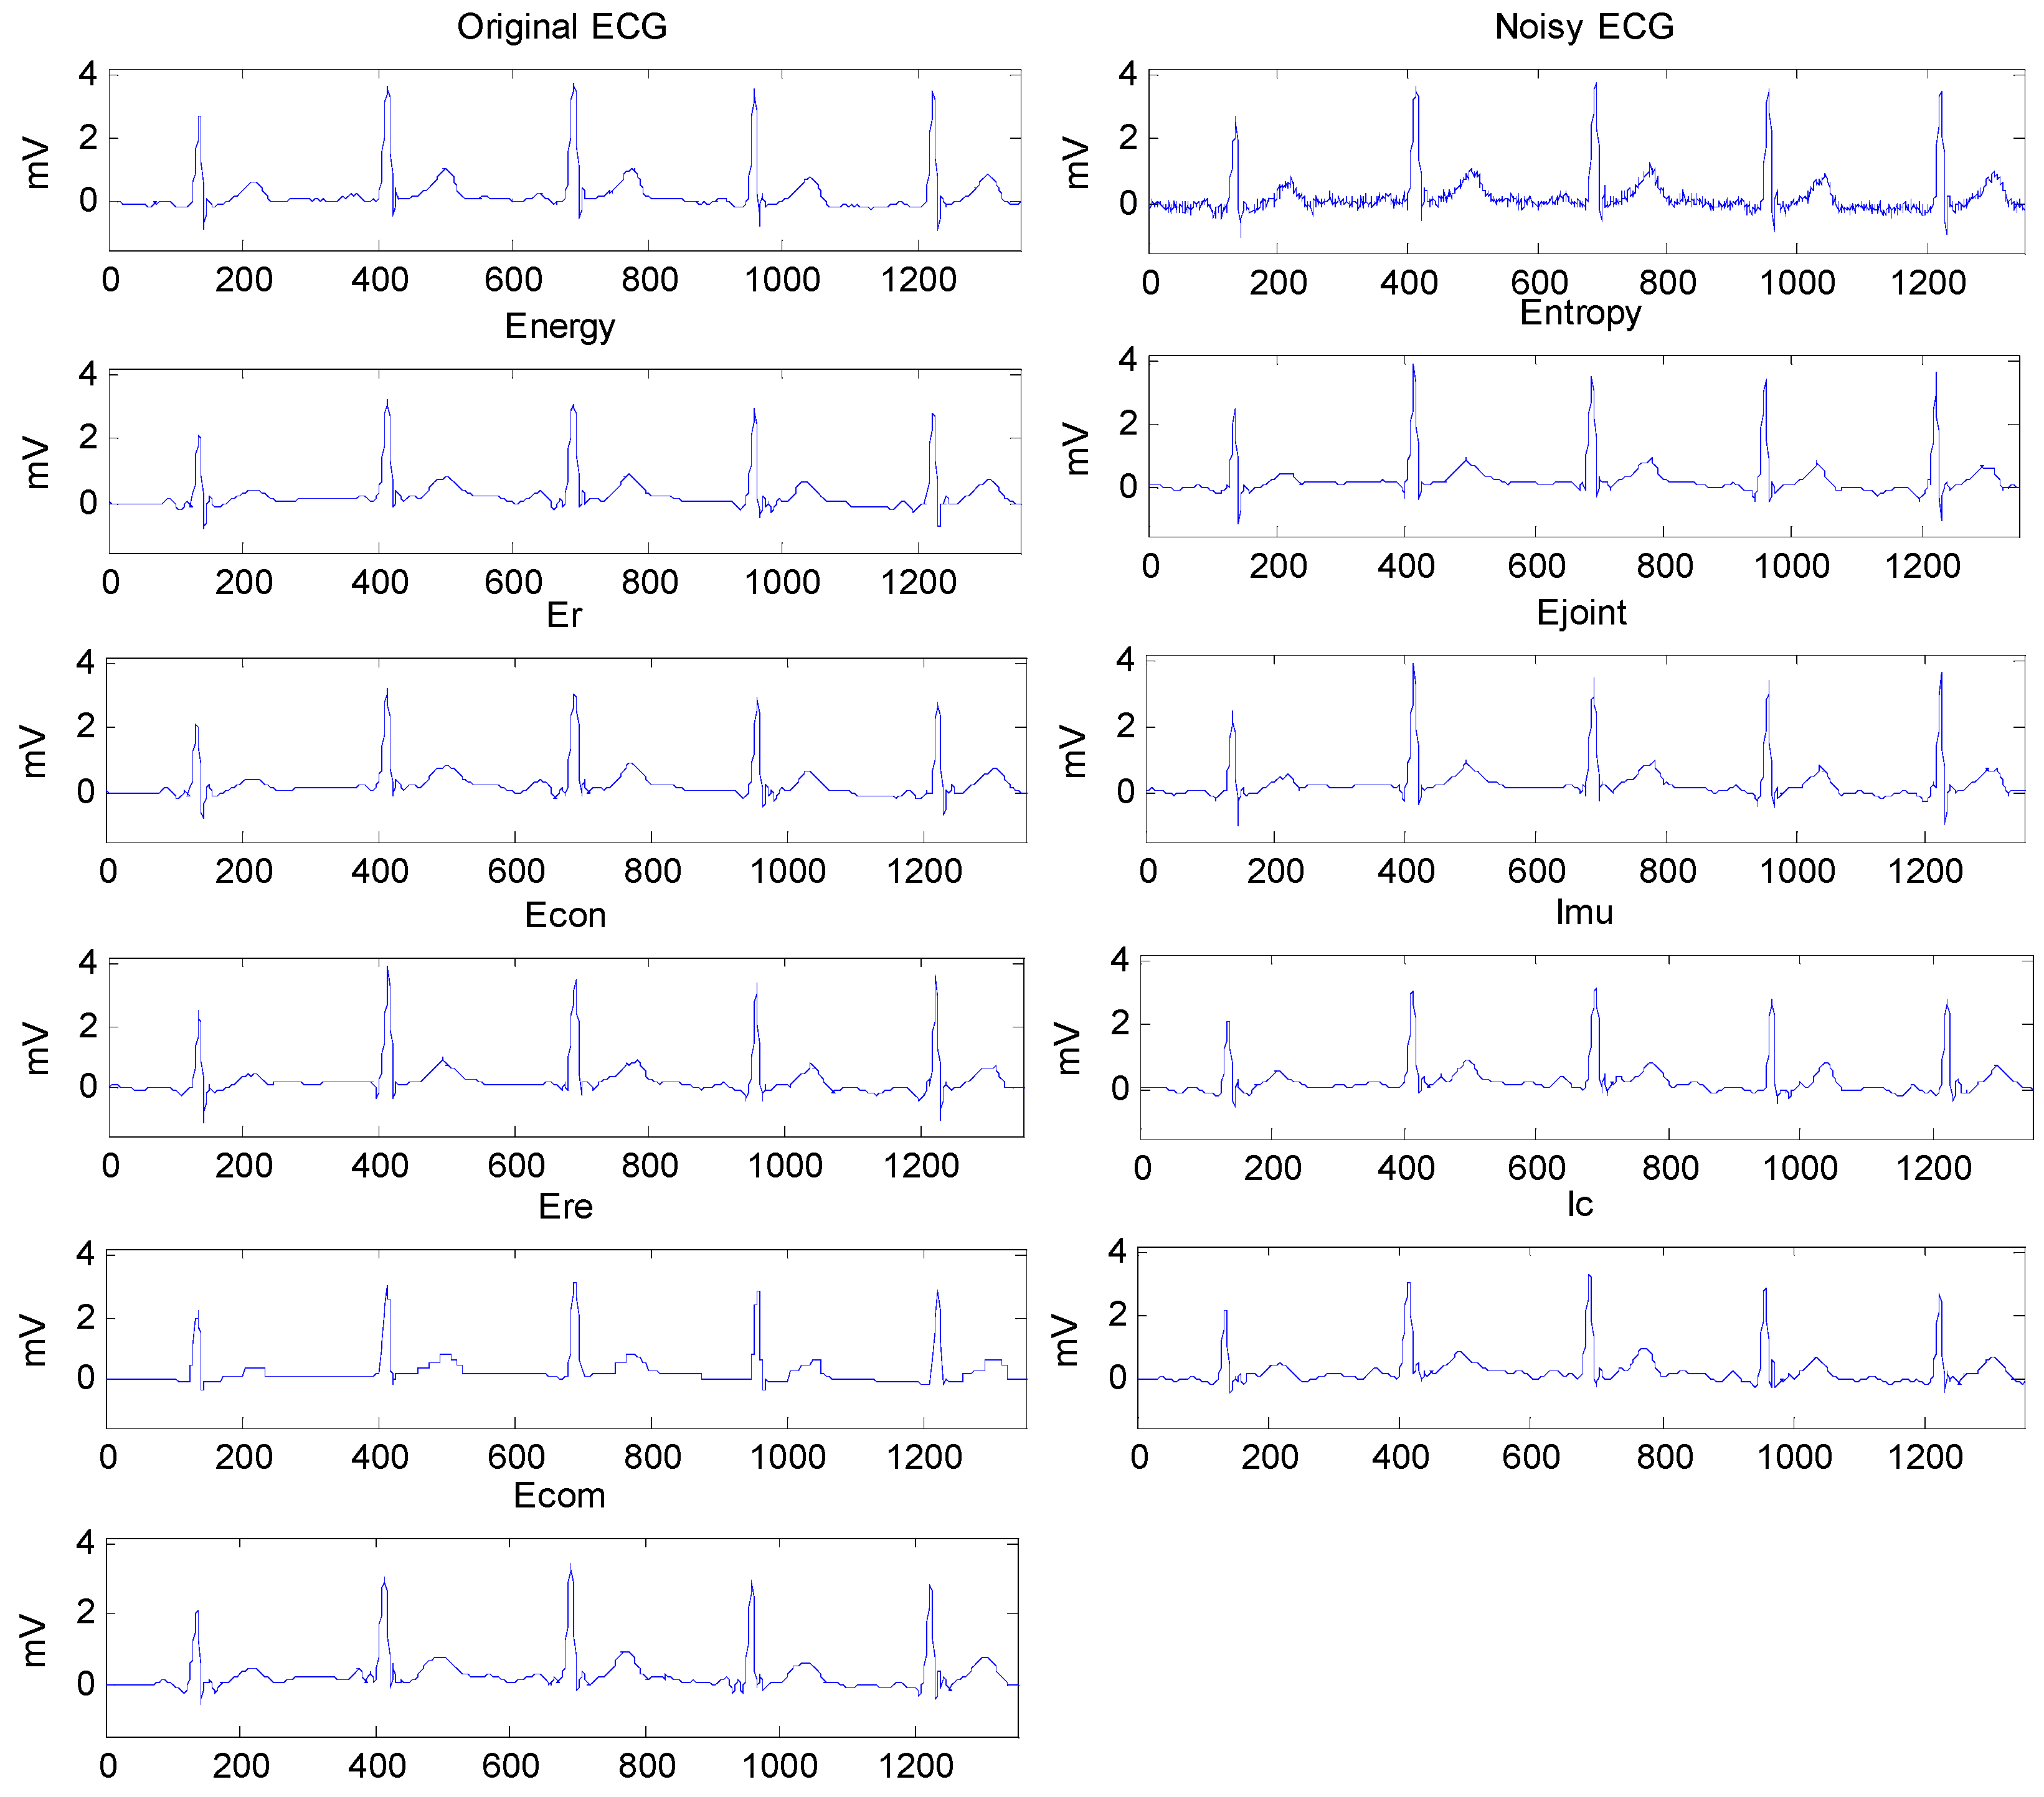
4.1. ECG Signals
4.2. Wavelet Set
4.3. Denoising Performance Indexes
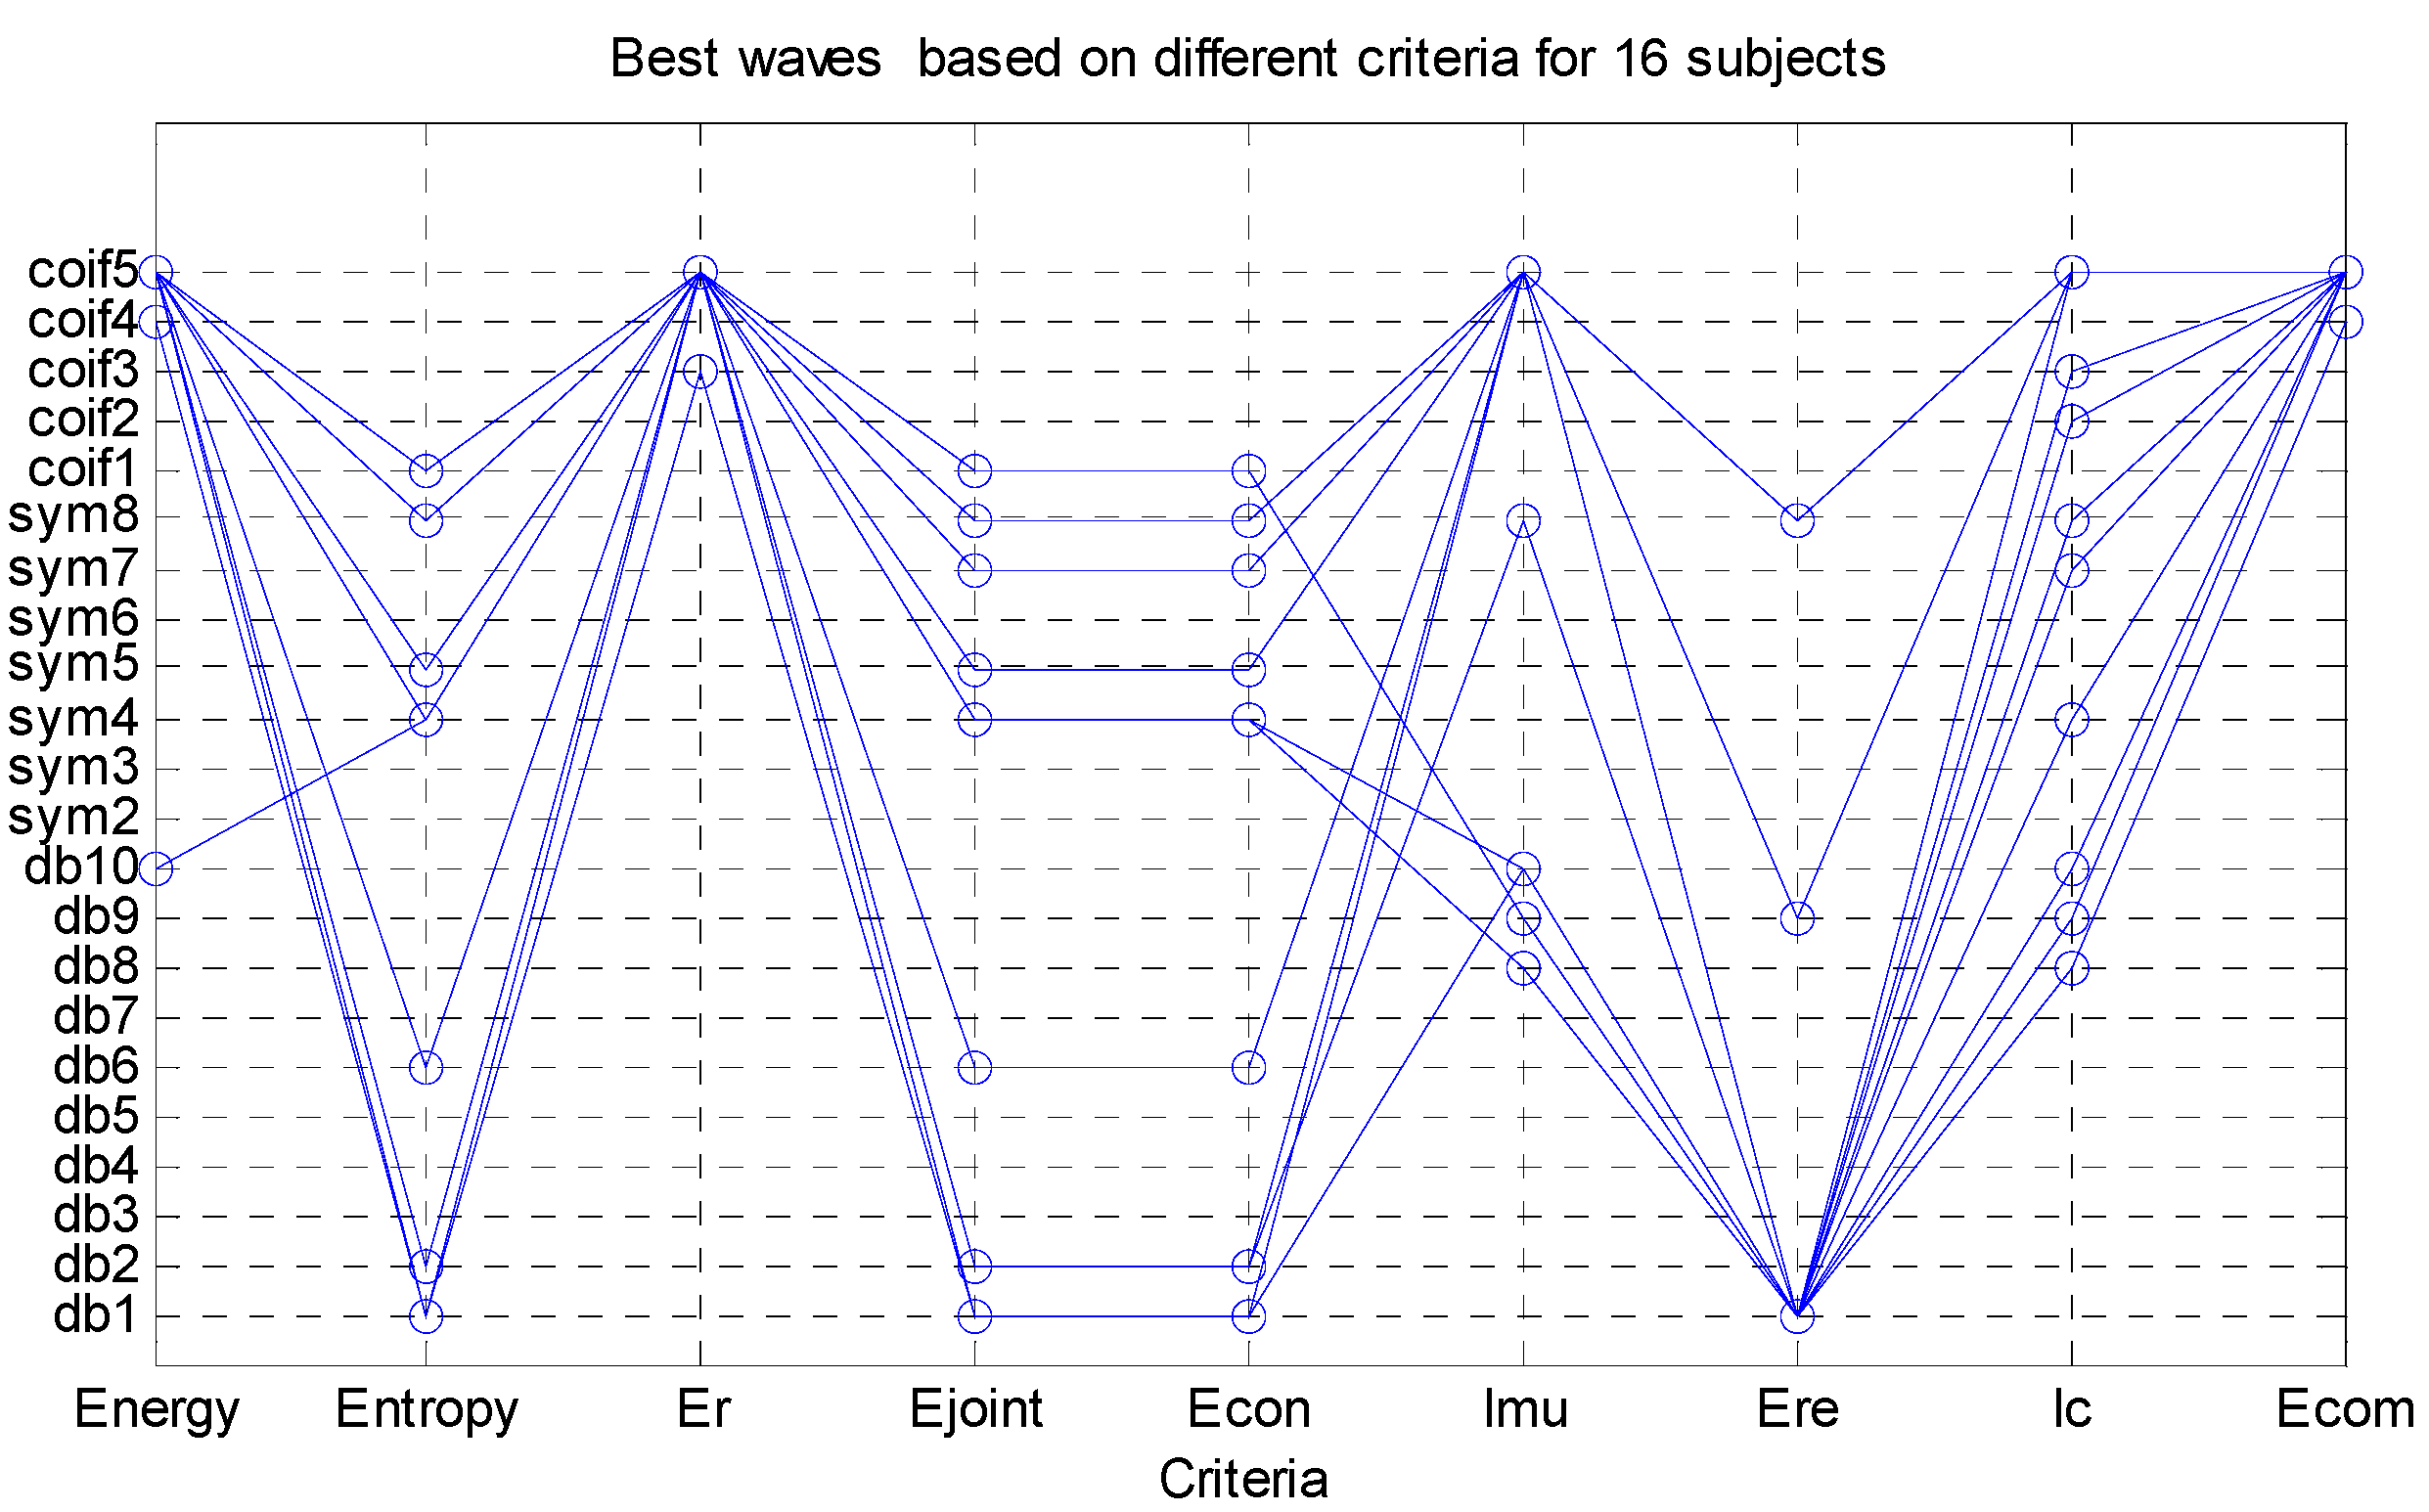
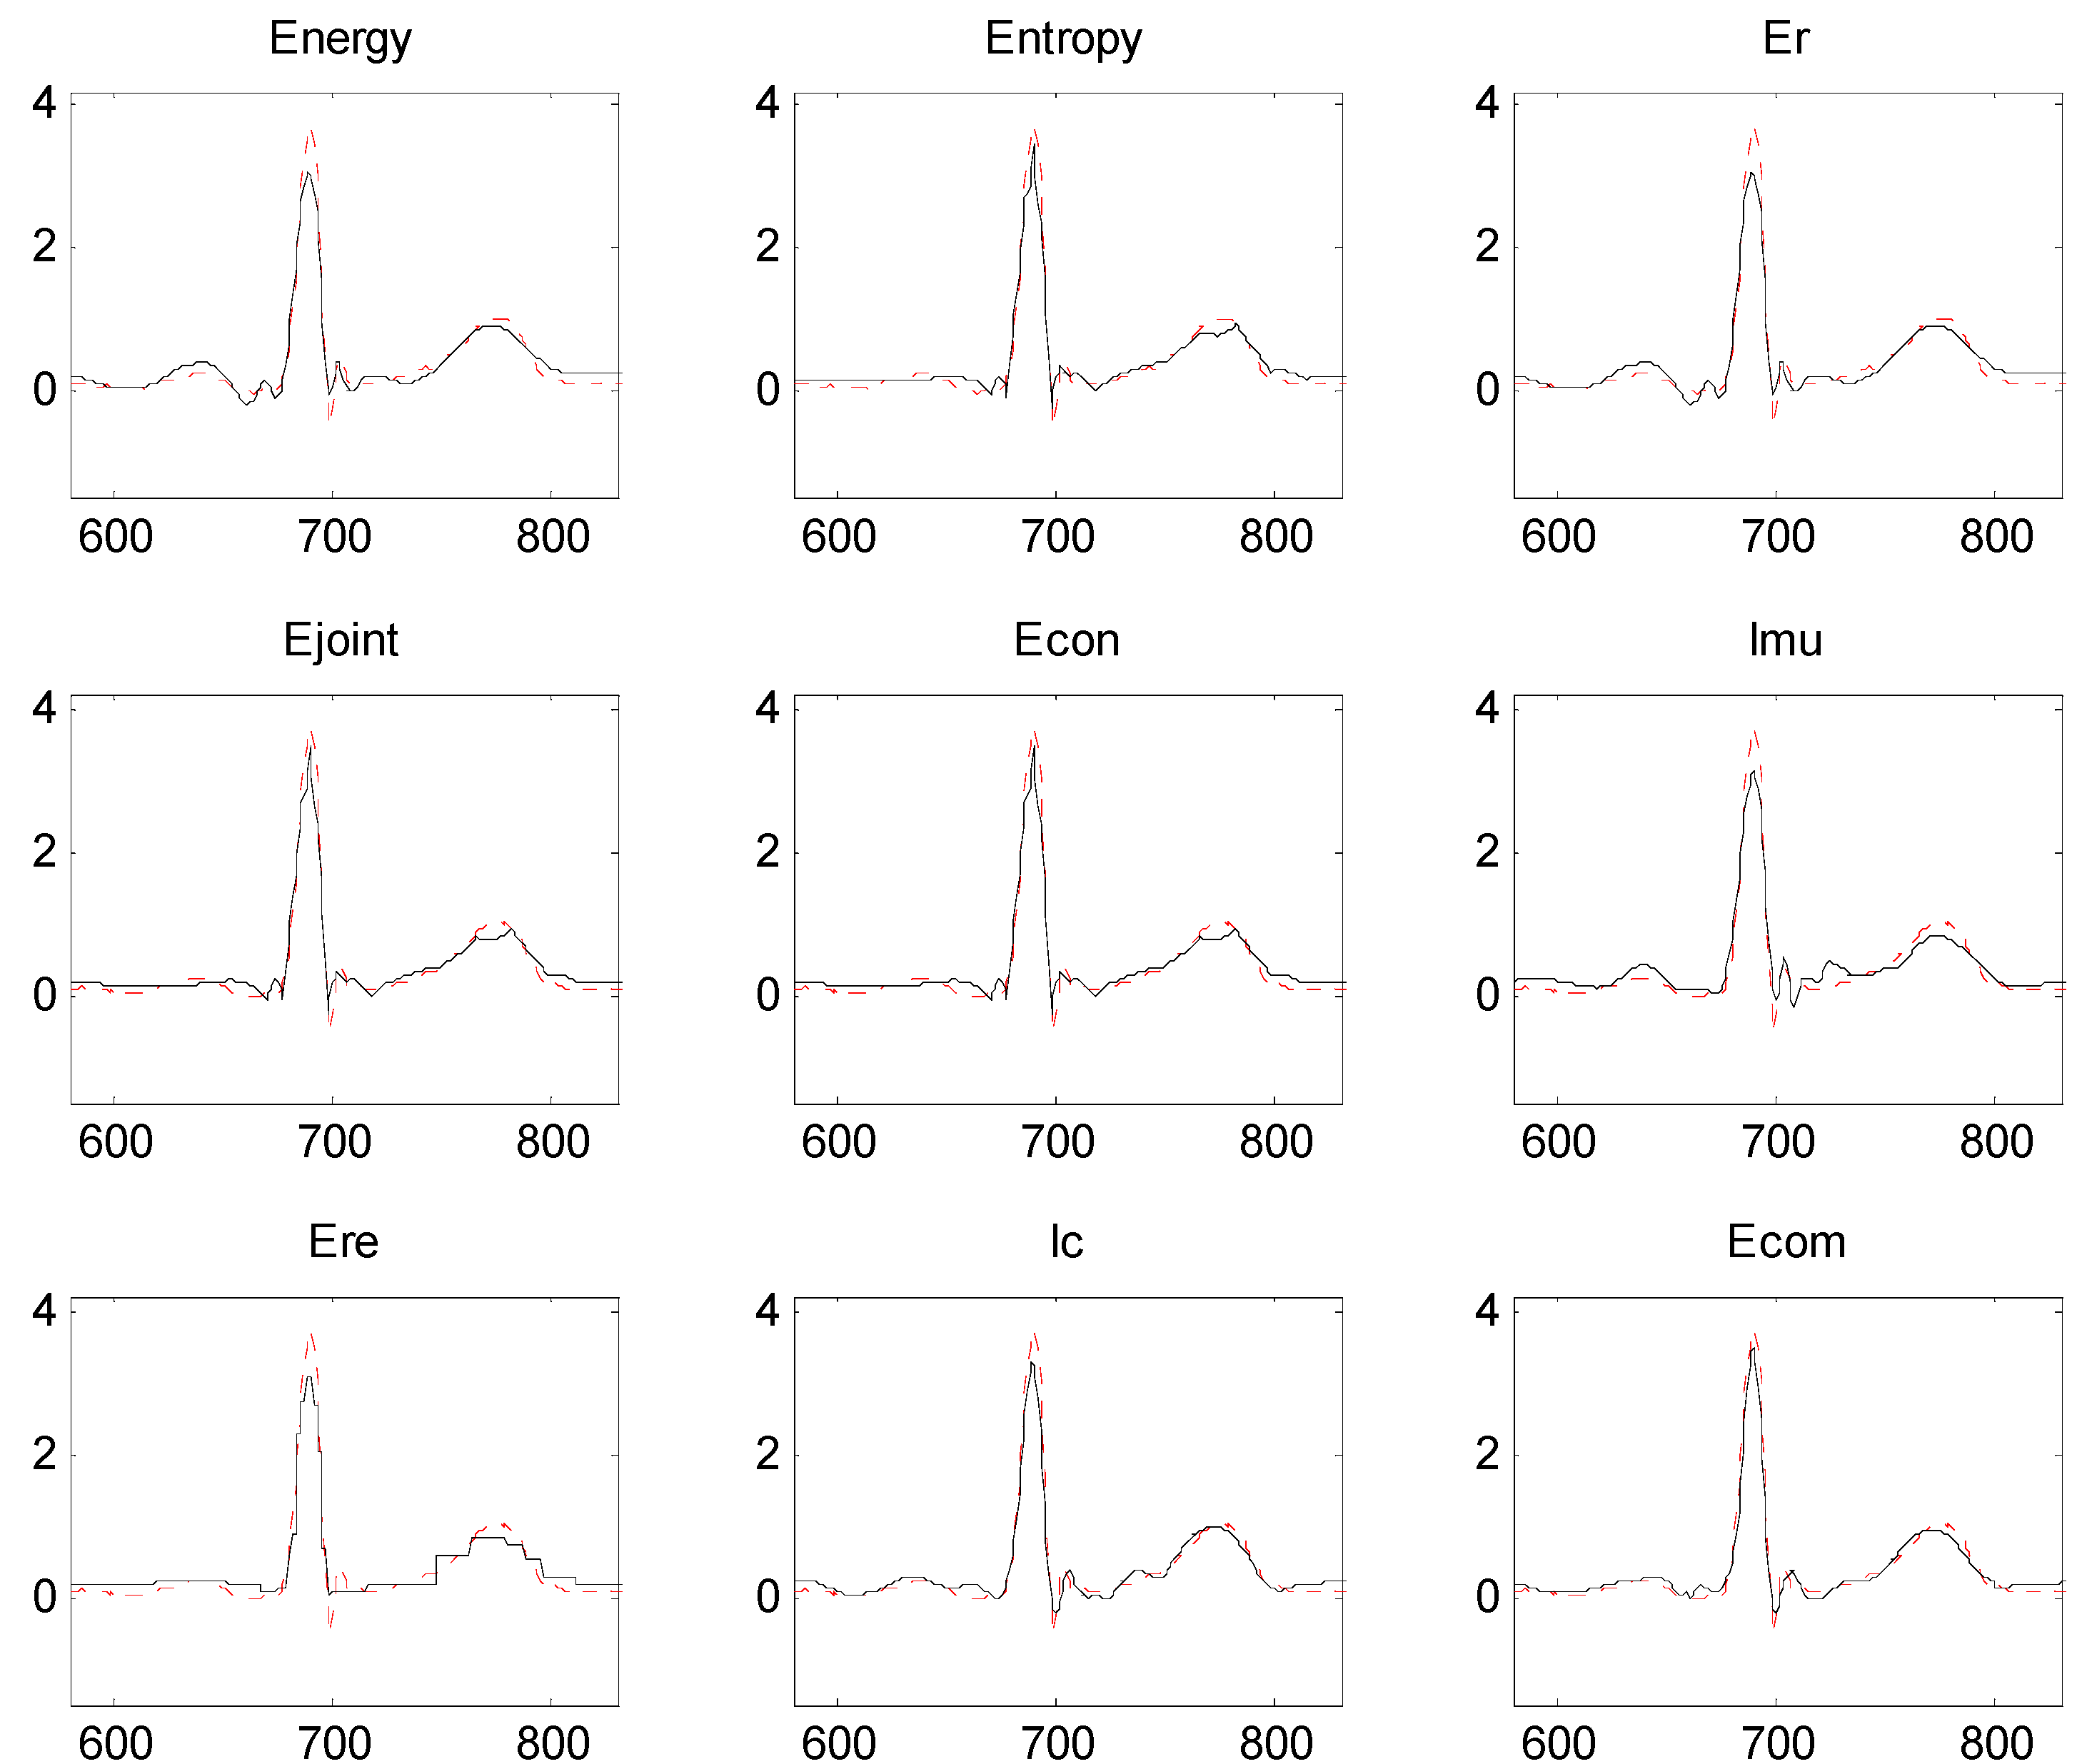
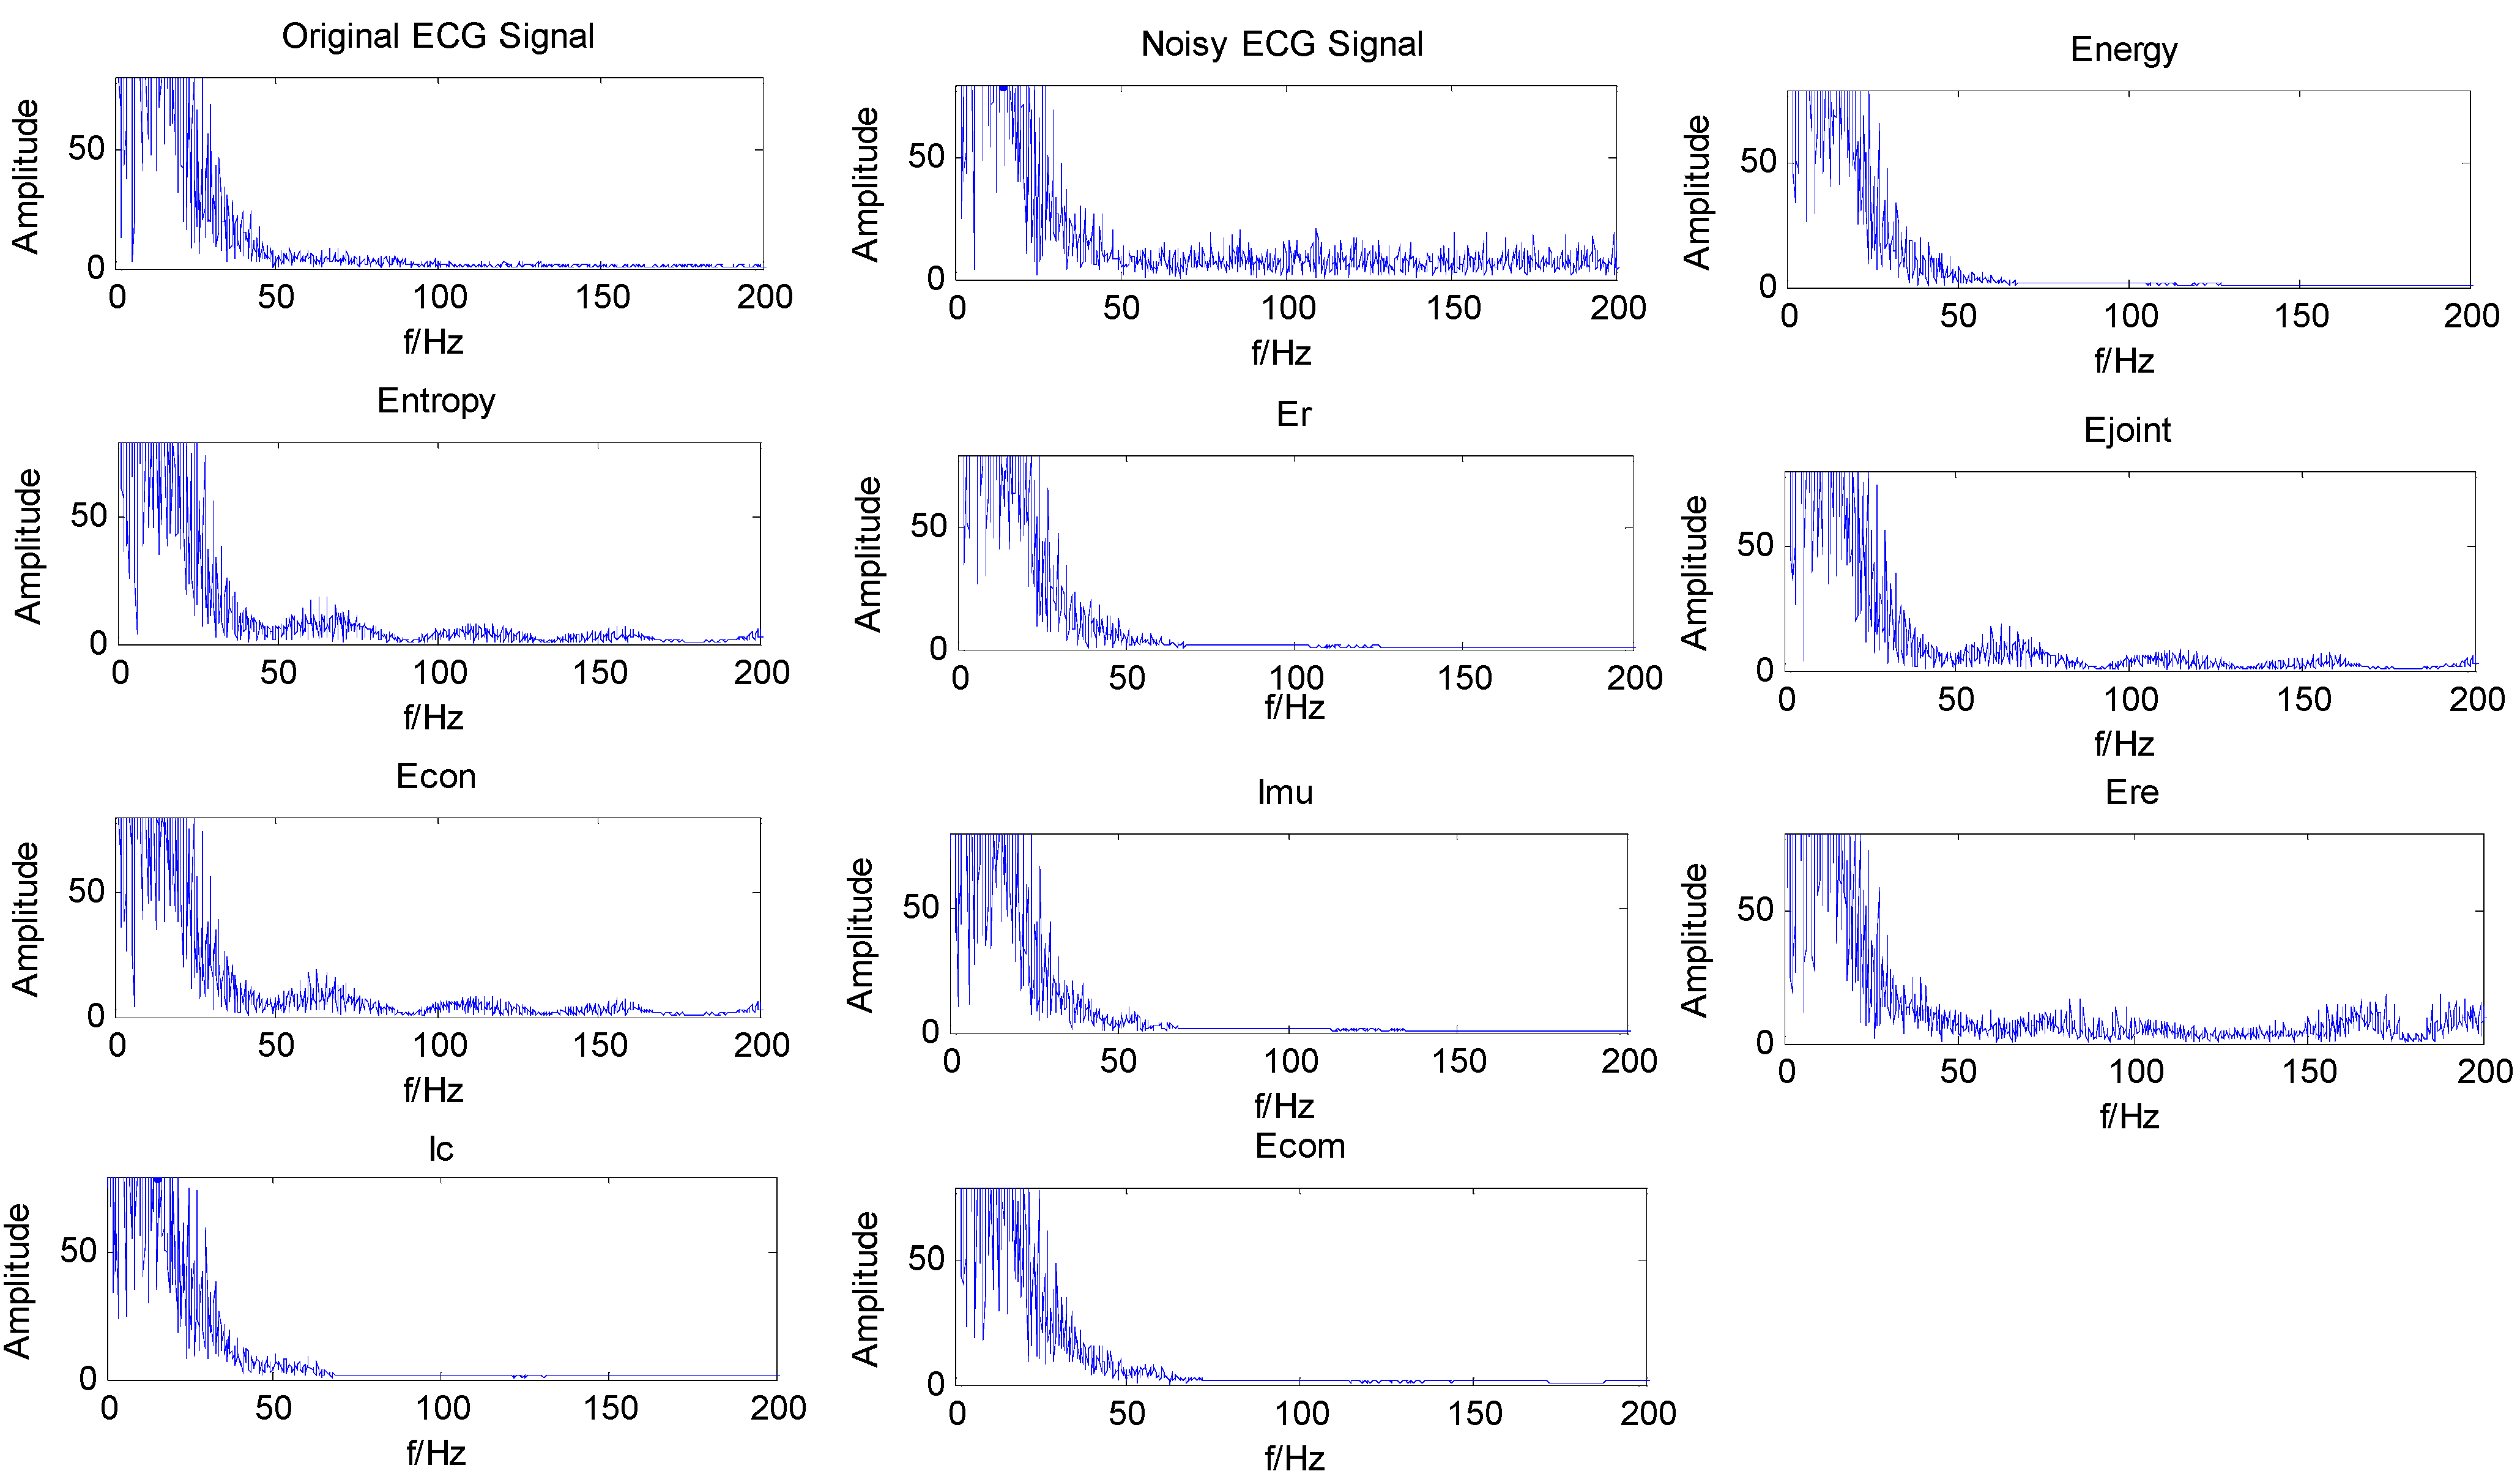
4.4. Results and Discussion


| Criterion | Eenergy | Eentropy | Er | Ejoint | Econ | Imu | Ere | Ic | Ecom |
|---|---|---|---|---|---|---|---|---|---|
| Wavelet | coif5 | coif1 | coif5 | coif1 | coif1 | db9 | db1 | db8 | coif4 |
| Criterion value | 8.3943 × 10³ | 4.2224 | 1.5282 × 10³ | 14.5307 | 4.2195 | 1.4138 × 10⁻² | 5.5464 | 3.4654 × 10⁻⁵ | 2.6248 × 10⁻² |


| Criterion | SNRo (dB) | RMSE (mV) | PRD (%) | R |
|---|---|---|---|---|
| Eenergy | 17.7889 | 0.1481 | 12.8990 | 0.9796 |
| Eentropy | 18.3061 | 0.1395 | 12.1533 | 0.9823 |
| Er | 17.7889 | 0.1481 | 12.8990 | 0.9796 |
| Ejoint | 18.3061 | 0.1395 | 12.1533 | 0.9823 |
| Econ | 18.3061 | 0.1395 | 12.1533 | 0.9823 |
| Imu | 17.7078 | 0.1494 | 13.0199 | 0.9823 |
| Ere | 16.9774 | 0.1626 | 14.1622 | 0.9760 |
| Ic | 17.3693 | 0.1554 | 13.5374 | 0.9803 |
| Ecom | 17.8896 | 0.1463 | 12.7502 | 0.9829 |
| Criterion | (dB) | (mV) | (%) | |
|---|---|---|---|---|
| Eenergy | 14.6989 | 0.1093 | 19.9152 | 0.9662 |
| Eentropy | 14.6835 | 0.1091 | 19.7216 | 0.9625 |
| Er | 14.6915 | 0.1094 | 19.9244 | 0.9658 |
| Ejoint | 14.6596 | 0.1095 | 19.7784 | 0.9623 |
| Econ | 14.6596 | 0.1095 | 19.7784 | 0.9623 |
| Imu | 14.5886 | 0.1107 | 20.2360 | 0.9628 |
| Ere | 13.9541 | 0.1197 | 21.7119 | 0.9578 |
| Ic | 14.4673 | 0.1122 | 20.4741 | 0.9614 |
| Ecom | 14.7314 | 0.1090 | 19.9128 | 0.9670 |
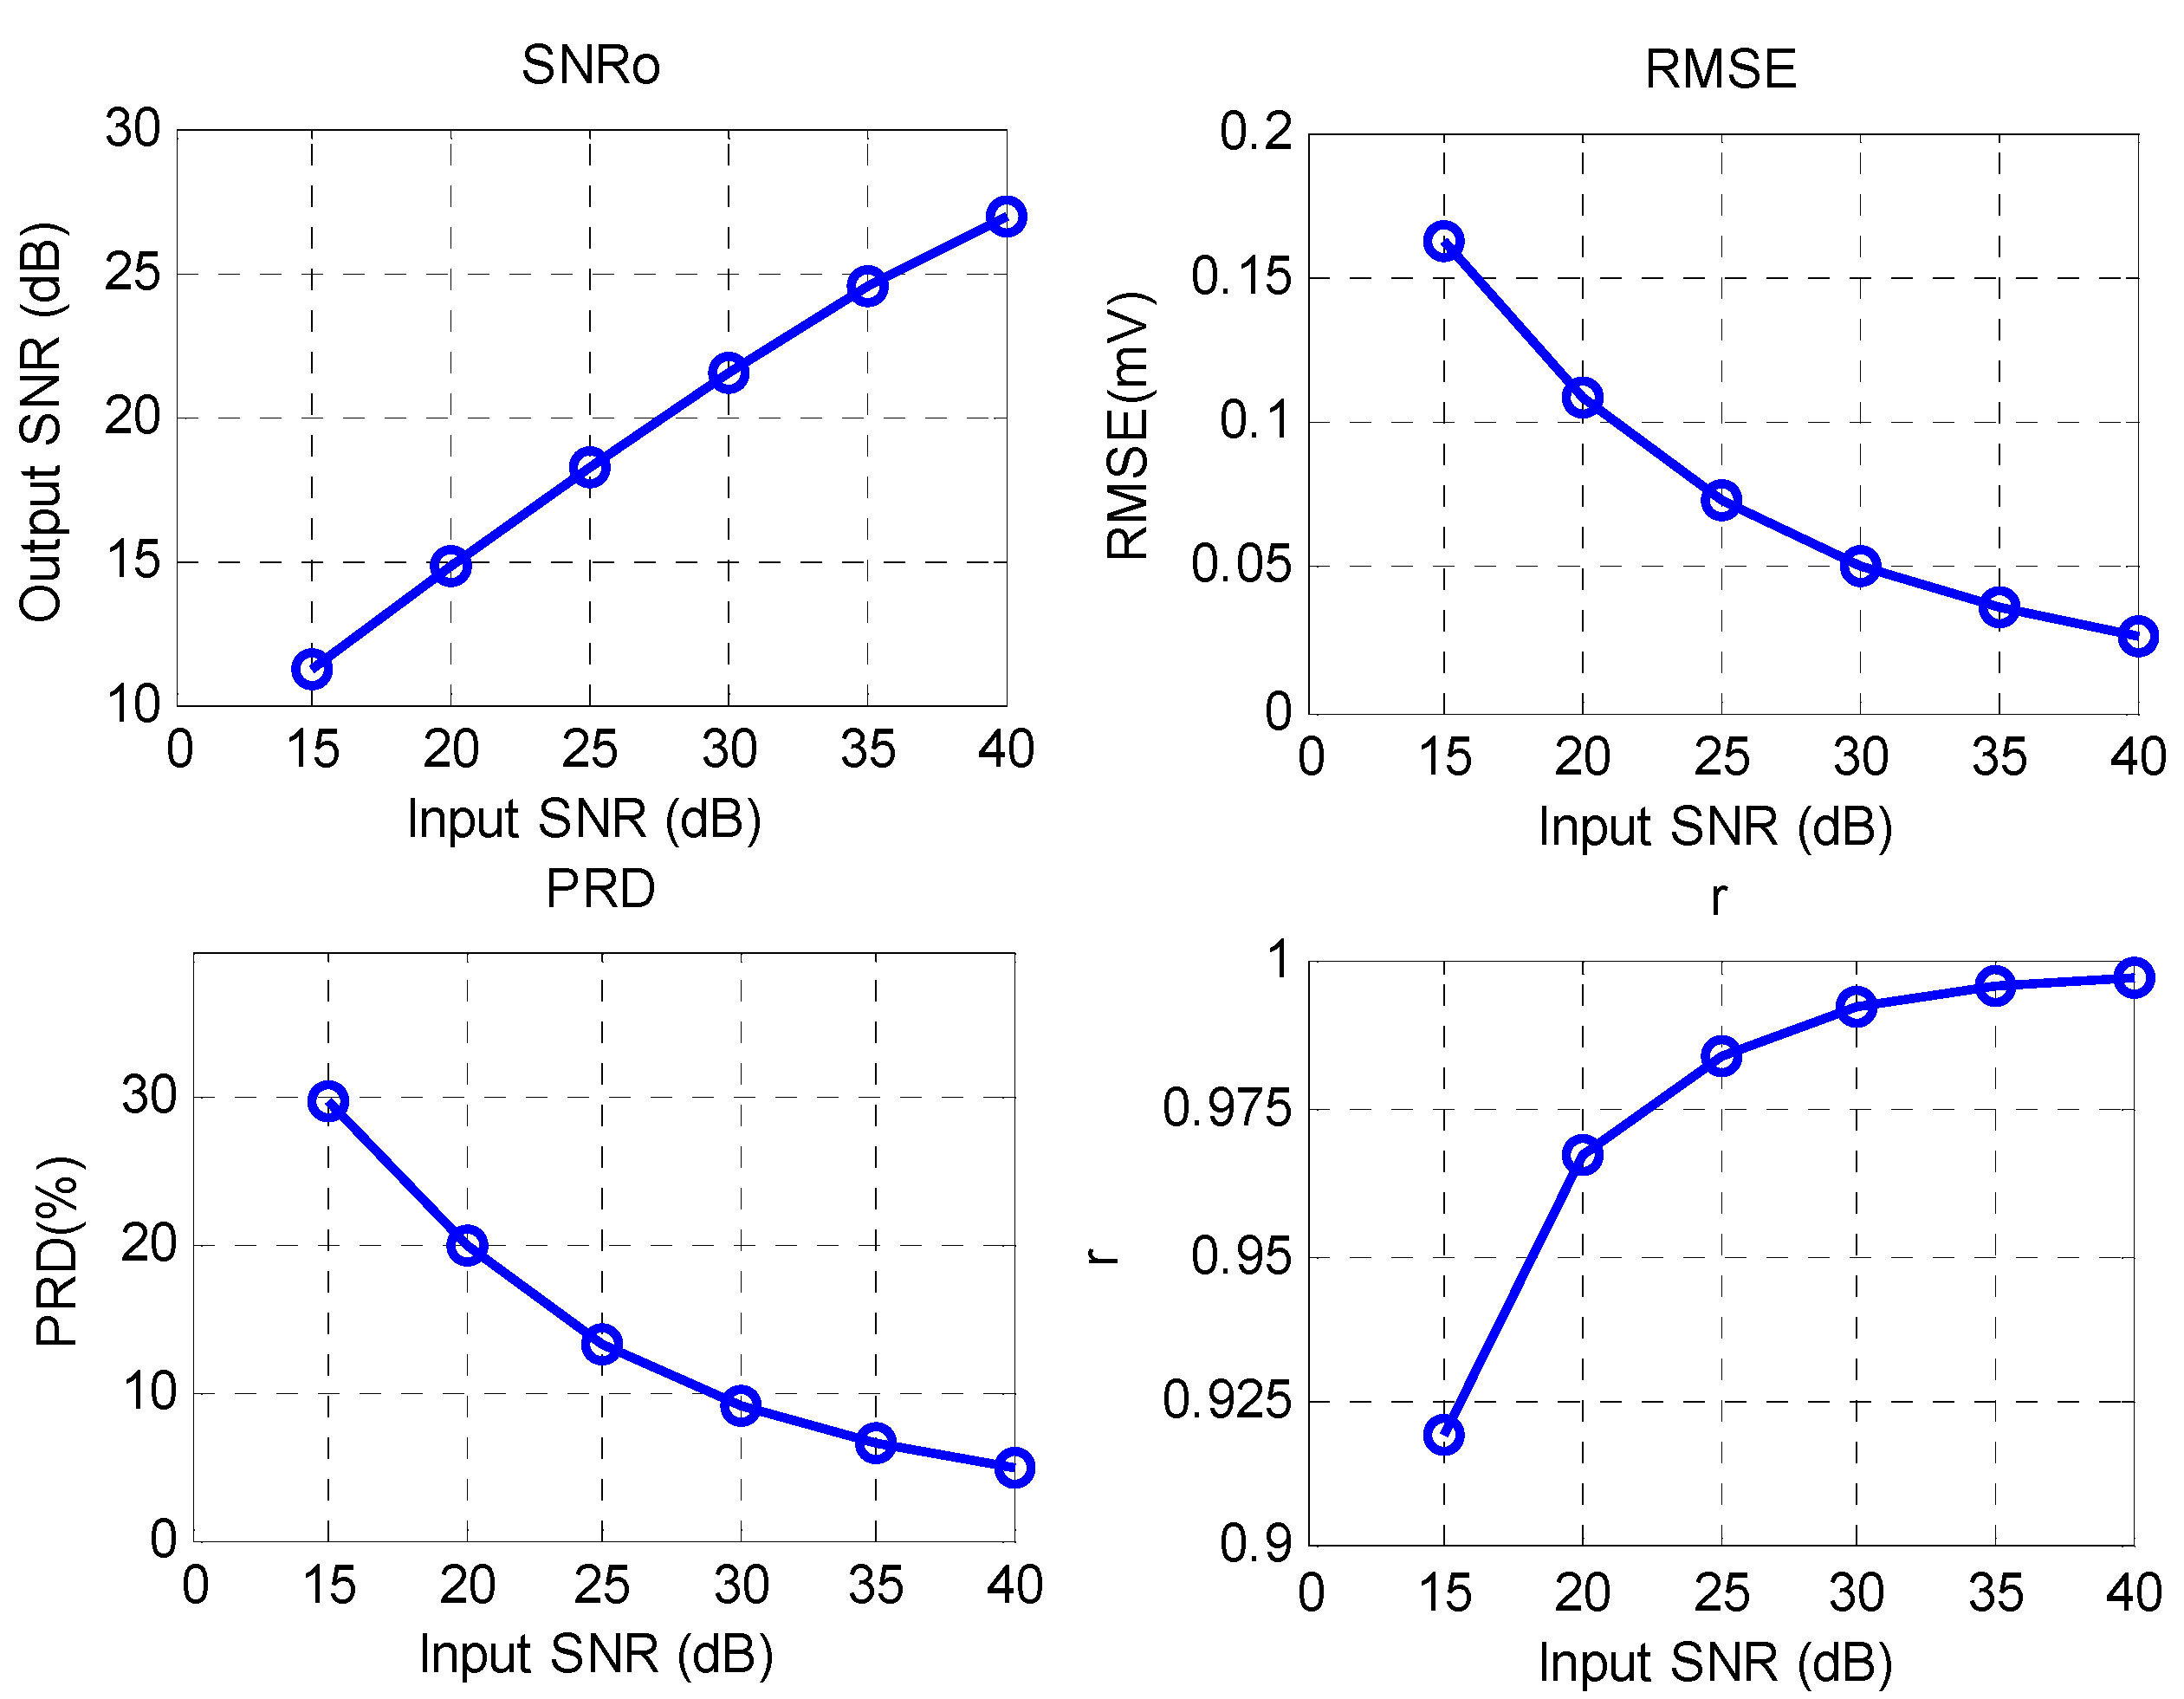
| Criterion | (dB) | (mV) | (%) | |
|---|---|---|---|---|
| Eenergy | 19.4608 | 0.0766 | 13.9811 | 0.9757 |
| Eentropy | 19.1159 | 0.0773 | 13.9304 | 0.9738 |
| Er | 19.4916 | 0.0763 | 13.9432 | 0.9757 |
| Ejoint | 19.1047 | 0.0774 | 13.9744 | 0.9741 |
| Econ | 19.1047 | 0.0774 | 13.9744 | 0.9741 |
| Imu | 19.4568 | 0.0767 | 14.0452 | 0.9745 |
| Ere | 17.7827 * | 0.0882 * | 15.7884 * | 0.9712 * |
| Ic | 19.4452 | 0.0770 | 14.0824 | 0.9743 |
| Ecom | 19.4922 | 0.0763 | 13.9420 | 0.9758 |
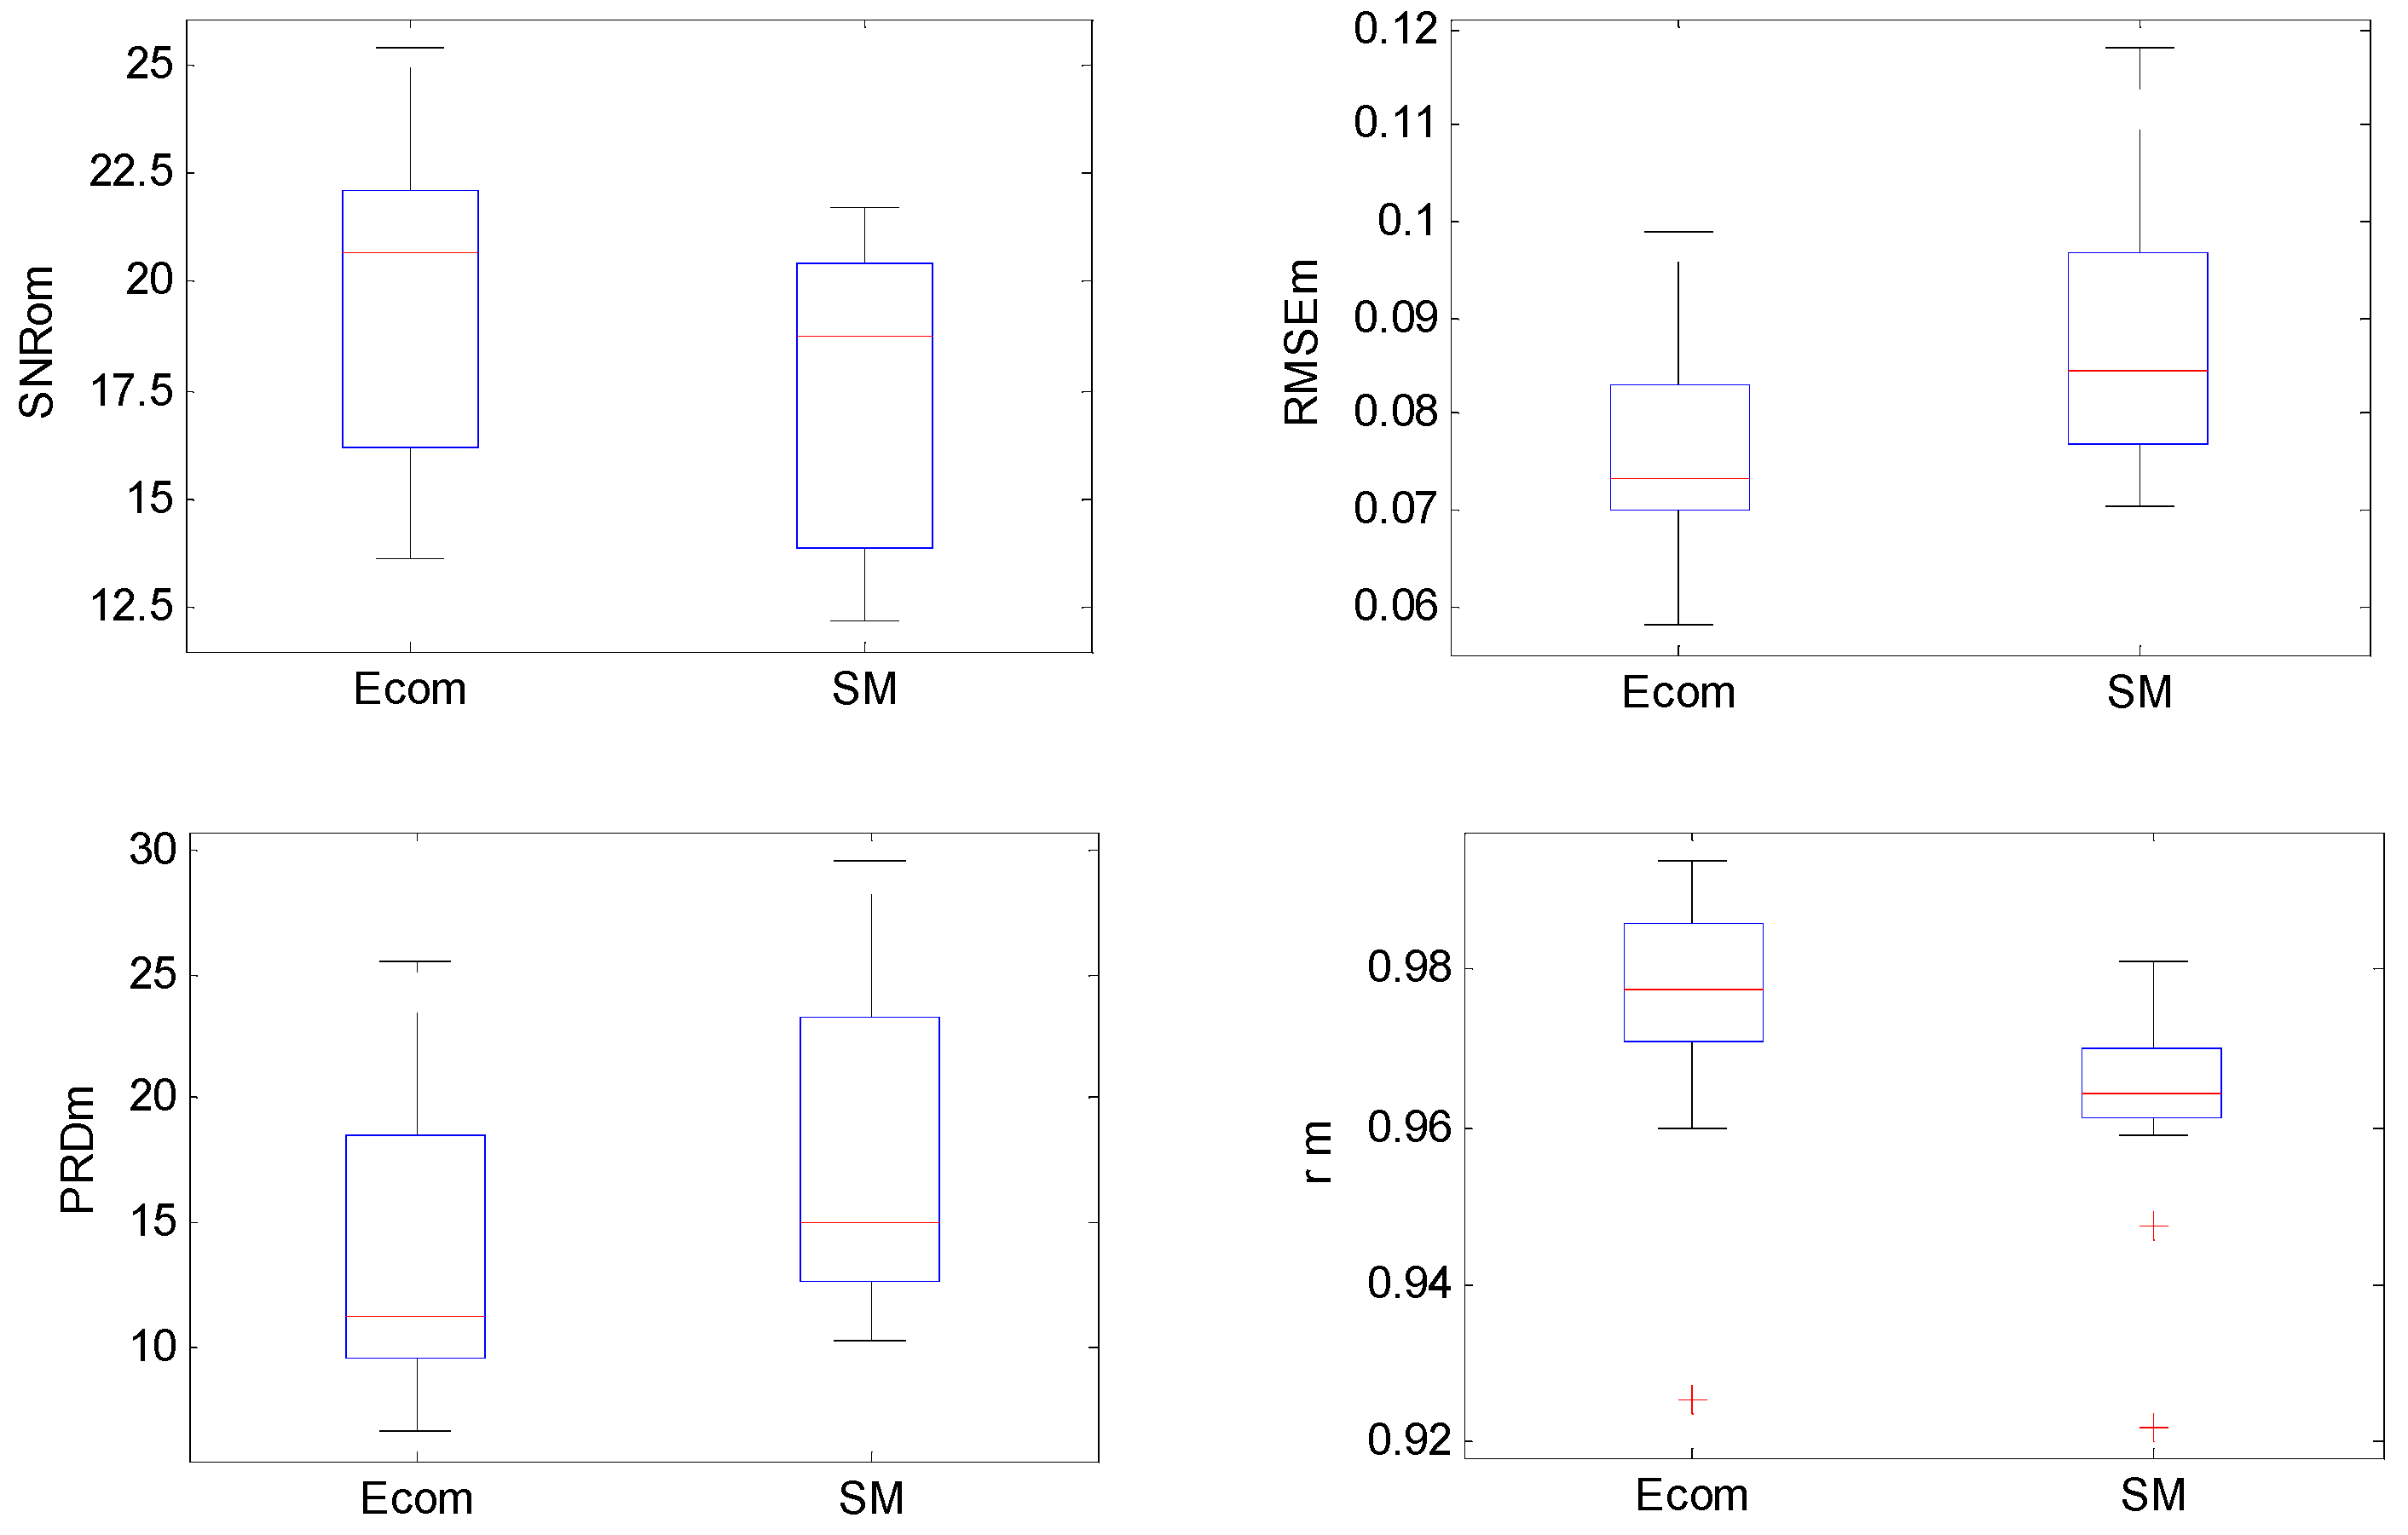
| Index | SNRom | RMSEm | PRDm | rm | ||||
|---|---|---|---|---|---|---|---|---|
| Statistic Variable | Mean | Standard Deviation | Mean | Standard Deviation | Mean | Standard Deviation | Mean | Standard Deviation |
| 19.4922 | 3.6429 | 0.0763 | 0.0107 | 13.9420 | 5.7904 | 0.9758 | 0.0163 | |
| Shape-Matched (SM) | 17.3304 | 3.4844 | 0.0865 | 0.0131 | 17.5809 | 6.0617 | 0.9632 | 0.0137 |


5. Conclusions
Acknowledgments
Author Contributions
Conflicts of Interest
References
- SØensen, J.T.; Clemmensen, P.; Sejersten, M. Telecardiology: Past, Present and Future. Rev. Esp. Cardiol. 2013, 66, 212–218. [Google Scholar] [CrossRef]
- Luo, S.; Johnston, P. A Review of Electrocardiogram Filtering. J. Electrocardiol. 2010, 43, 486–496. [Google Scholar] [CrossRef] [PubMed]
- Gacek, A.; Pedrycz, W. ECG Signal. Processing, Classification and Interpretation: A Comprehensive Framework of Computational Intelligence; Springer: London, UK, 2012. [Google Scholar]
- Gao, R.X.; Yan, R. Wavelets: Theory and Applications for Manufacturing; Springer: Berlin, Germany, 2011. [Google Scholar]
- Castillo, E.; Morales, D.P.; García, A.; Martínez-Martí, F.; Parrilla, L.; Palma, A.J. Noise Suppression in ECG Signals through Efficient One-Step Wavelet Processing Techniques. J. Appl. Math. 2013, 2013. [Google Scholar] [CrossRef]
- Singh, B.N.; Tiwari, A.K. Optimal Selection of Wavelet Basis Function Applied to ECG Signal Denoising. Digit. Signal. Process. 2006, 16, 275–287. [Google Scholar] [CrossRef]
- Bhatia, P.; Boudy, J.; Andreao, R.V. Wavelet Transformation and Pre-Selection of Mother Wavelet for ECG Signal Processing. In Proceedings of the 24th IASTED International Multiconference: Biomedical Engineering, Innsbruck, Austria, 15–17 Februray 2006; pp. 390–395.
- Amit, K.; Mandeep, S. Optimal Selection of Wavelet Function and Decomposition Level for Removal of ECG Signal Artifacts. J. Med. Imaging Health Inf. 2015, 5, 138–146. [Google Scholar]
- Tan, H.G.R.; Tan, A.C.; Khong, P.Y.; Mok, V.H. Best Wavelet Function Identification System for ECG Signal Denoise Applications. In Proceedings of the IEEE International Conference on Intelligent and Advanced Systems, ICIAS 2007, Kuala Lumpur, Malaysia, 25–28 November 2007; pp. 631–634.
- Stantic, D.; Jo, J. Selection of Optimal Parameters for ECG Signal Smoothing and Baseline Drift Removal. Comput. Inf. Sci. 2014, 7, 99–110. [Google Scholar] [CrossRef]
- Ranjeet, K.; Farida, J. Retained Signal Energy Based Optimal Wavelet Selection for Denoising of ECG Signal Using Modifide Thresholding. In Proceedings of the IEEE 2011 International Conference on Multimedia, Signal Processing and Communication Technologies (IMPACT), Aligarh, India, 17–19 December 2011; pp. 196–199.
- El-Sayed, A.; Dahshan, E. Genetic Algorithm and Wavelet Hybrid Scheme for ECG Signal Denoising. Telecommun. Syst. 2011, 46, 209–215. [Google Scholar]
- Addison, P.S. Wavelet Transforms and the ECG: A Review. Physiol. Meas. 2005, 26, 155–199. [Google Scholar] [CrossRef] [PubMed]
- Mallat, S. A Wavelet Tour of Signal Processing, 3rd ed.; Academic Press: Waltham, MA, USA, 2009. [Google Scholar]
- Mateo, J.; Torres, A.M.; Soria, C.; Santos, J.L. A Method for Removing Noise from Continuous Brain Signal Recordings. Comput. Electr. Eng. 2013, 39, 1561–1570. [Google Scholar] [CrossRef]
- Donoho, D.L.; Johnstone, I.M. Ideal Spatial Adaptation via Wavelet Shrinkage. Biometrika 1994, 81, 425–455. [Google Scholar] [CrossRef]
- Donoho, D.L. Denoising by Soft-thresholding. IEEE Trans. Inform. Theory 1995, 41, 613–627. [Google Scholar] [CrossRef]
- Von Sachs, R.; MacGibbon, B. Nonparametric Curve Estimation by Wavelet Thresholding with Locally Stationary Errors. Scand. J. Stat. 2000, 27, 475–499. [Google Scholar] [CrossRef]
- Gray, R.M. Entropy and Information Theory, 2nd ed.; Springer: New York, NY, USA, 2011. [Google Scholar]
- Moody, G.B.; Mark, R.G. The Impact of the MIT-BIH Arrhythmia Database. IEEE Eng. Med. Biol. 2001, 20, 45–50. [Google Scholar] [CrossRef]
- Goldberger, A.L.; Amaral, L.A.N.; Glass, L.; Hausdorff, J.M.; Ivanov, P.C.; Mark, R.G.; Mietus, J.E.; Moody, G.B.; Peng, C.-K.; Stanley, H.E. Physiobank, Physiotoolkit, and Physionet: Components of a New Research. Circulation 2000, 101, e215–e220. [Google Scholar] [CrossRef] [PubMed]
- Üstundag, M.; Gökbulut, M.; Sengür, A.; Ata, F. Denoising of Weak ECG Signals by Using Wavelet Analysis and Fuzzy Thresholding. Netw. Model. Anal. Health Inform. Bioinfor. 2012, 1, 1–6. [Google Scholar] [CrossRef]
- Bruce, A.G.; Gao, H.Y. WaveShrink with Firm Shrinkage. Stat. Sin. 1997, 7, 855–874. [Google Scholar]
© 2015 by the authors; licensee MDPI, Basel, Switzerland. This article is an open access article distributed under the terms and conditions of the Creative Commons Attribution license (http://creativecommons.org/licenses/by/4.0/).
Share and Cite
He, H.; Tan, Y.; Wang, Y. Optimal Base Wavelet Selection for ECG Noise Reduction Using a Comprehensive Entropy Criterion. Entropy 2015, 17, 6093-6109. https://0-doi-org.brum.beds.ac.uk/10.3390/e17096093
He H, Tan Y, Wang Y. Optimal Base Wavelet Selection for ECG Noise Reduction Using a Comprehensive Entropy Criterion. Entropy. 2015; 17(9):6093-6109. https://0-doi-org.brum.beds.ac.uk/10.3390/e17096093
Chicago/Turabian StyleHe, Hong, Yonghong Tan, and Yuexia Wang. 2015. "Optimal Base Wavelet Selection for ECG Noise Reduction Using a Comprehensive Entropy Criterion" Entropy 17, no. 9: 6093-6109. https://0-doi-org.brum.beds.ac.uk/10.3390/e17096093