
Wavelet Entropy Automatically Detects Episodes of Atrial Fibrillation from Single-Lead Electrocardiograms


Abstract
:1. Introduction
2. Materials and Methods
2.1. Study Population
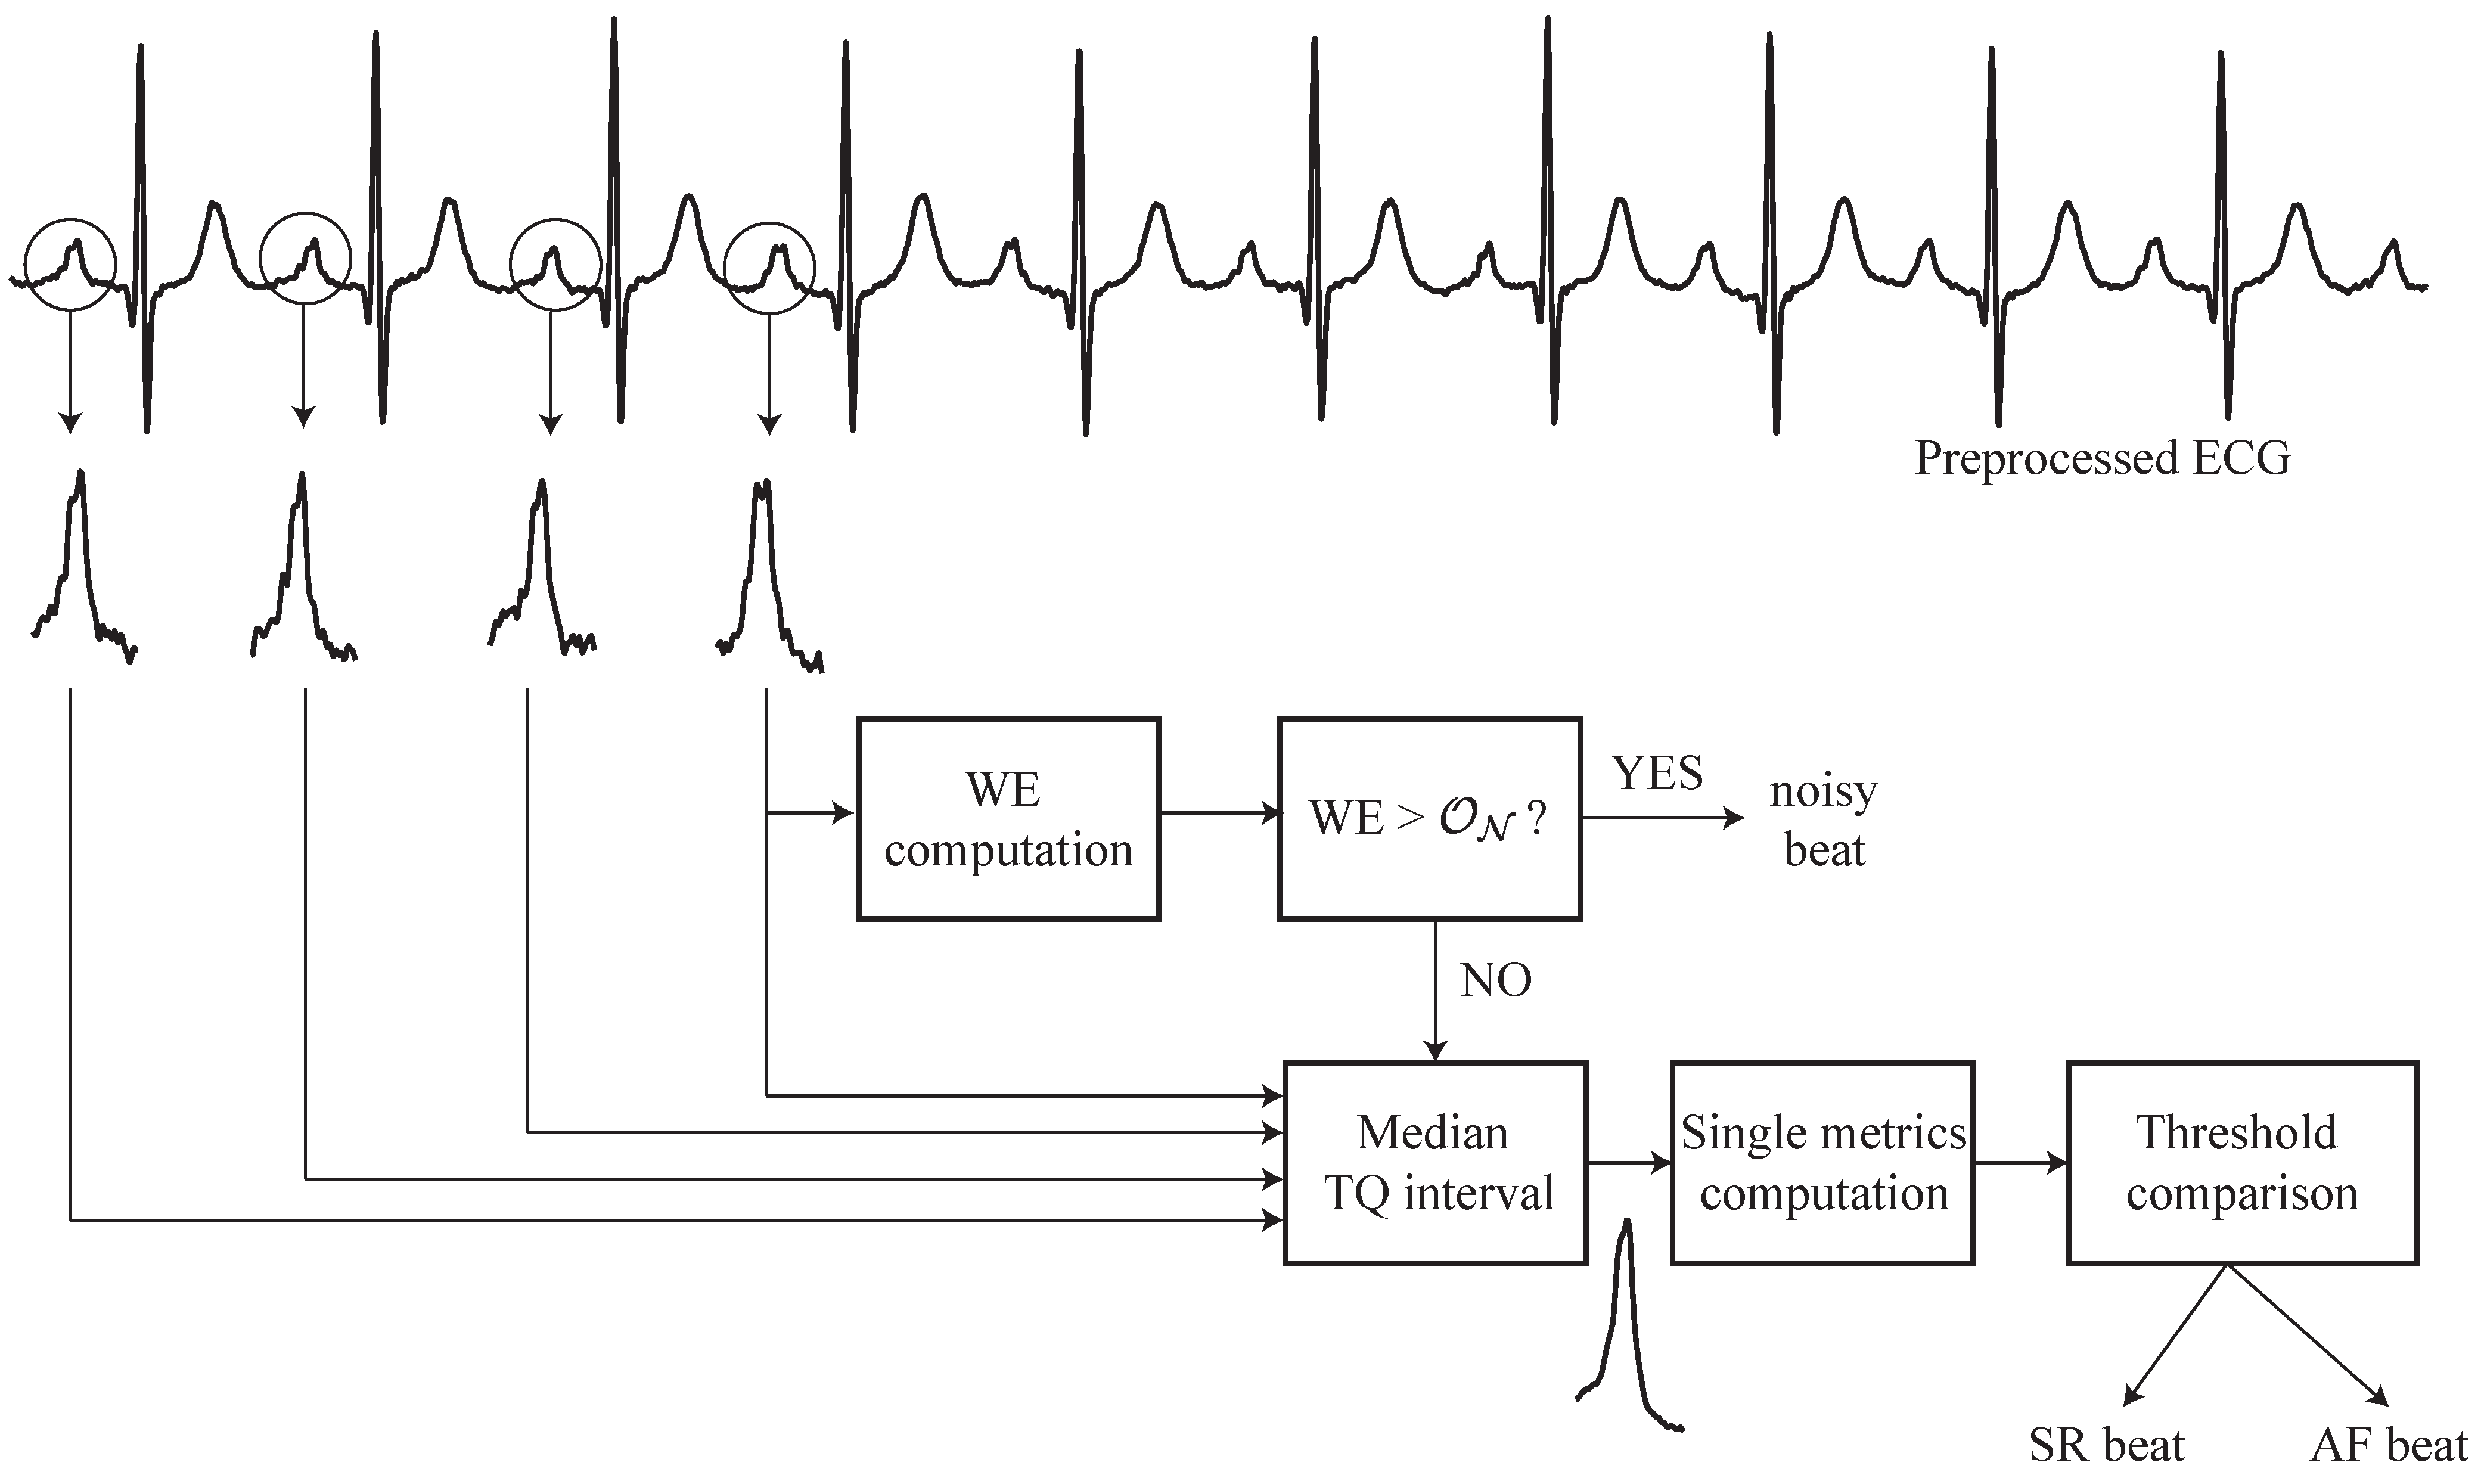
2.2. Data Processing

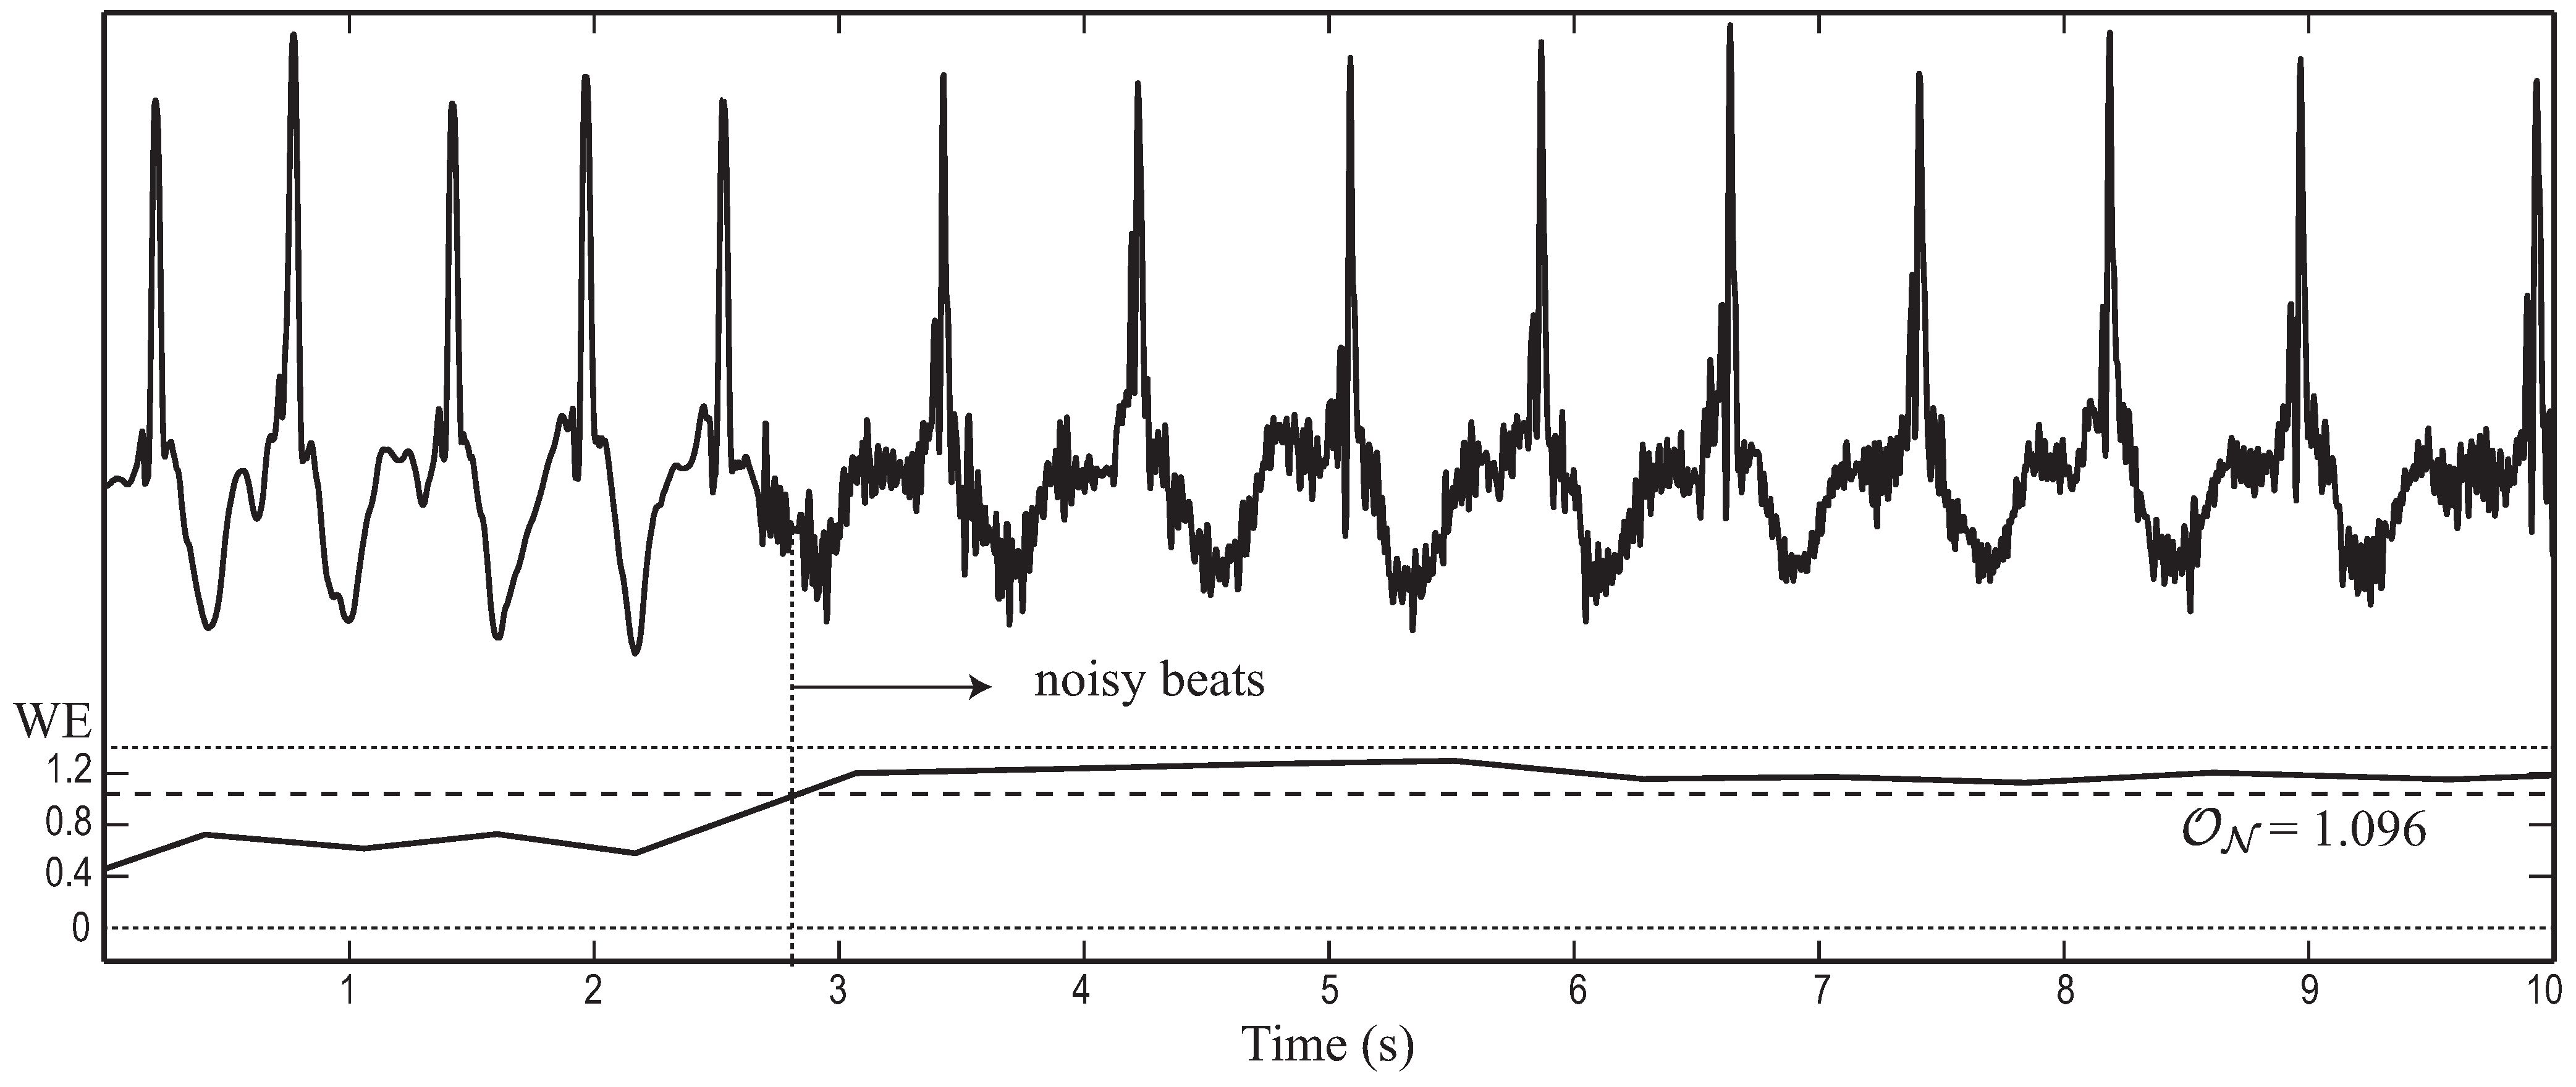
2.3. Wavelet Entropy Analysis
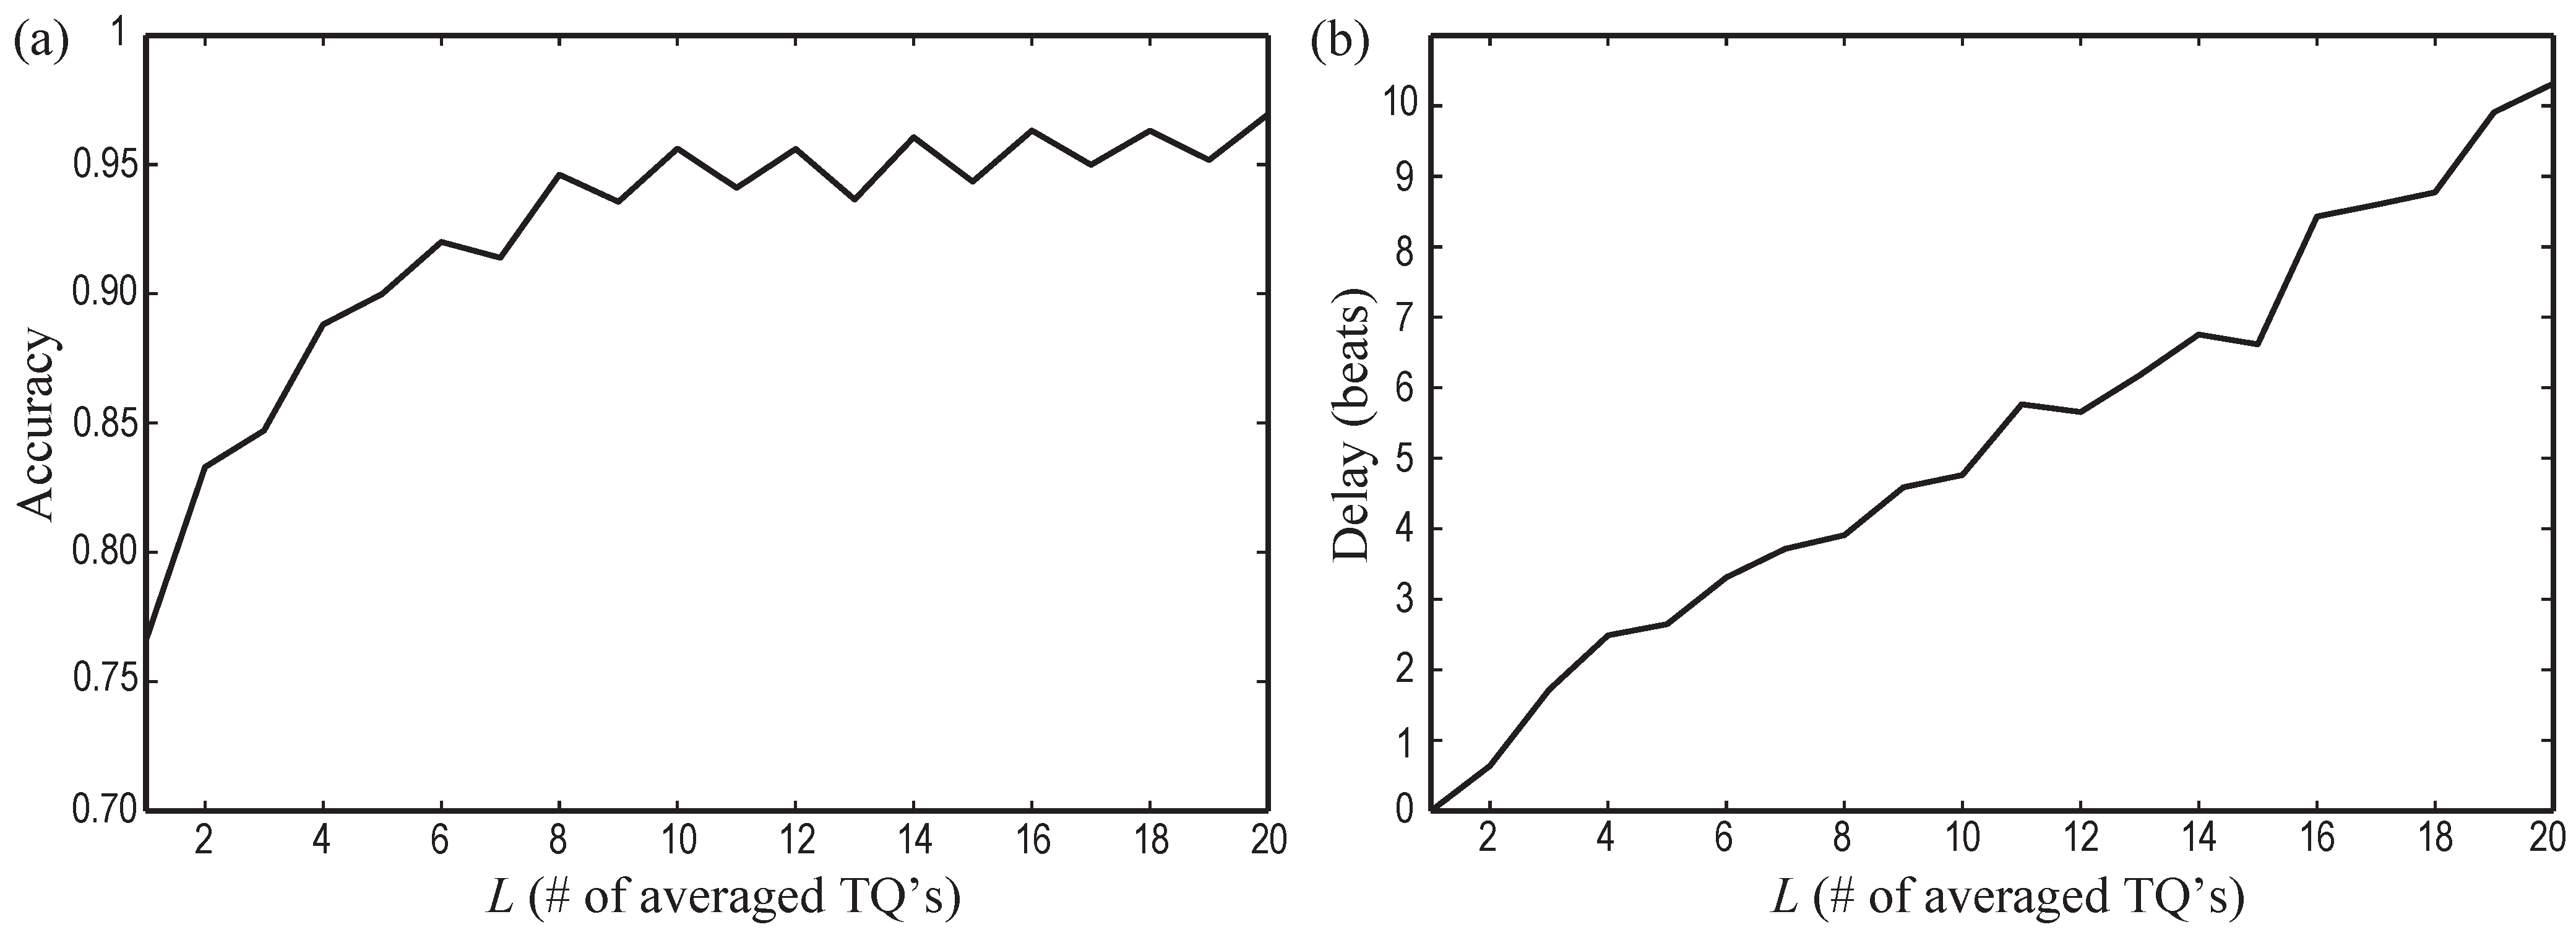
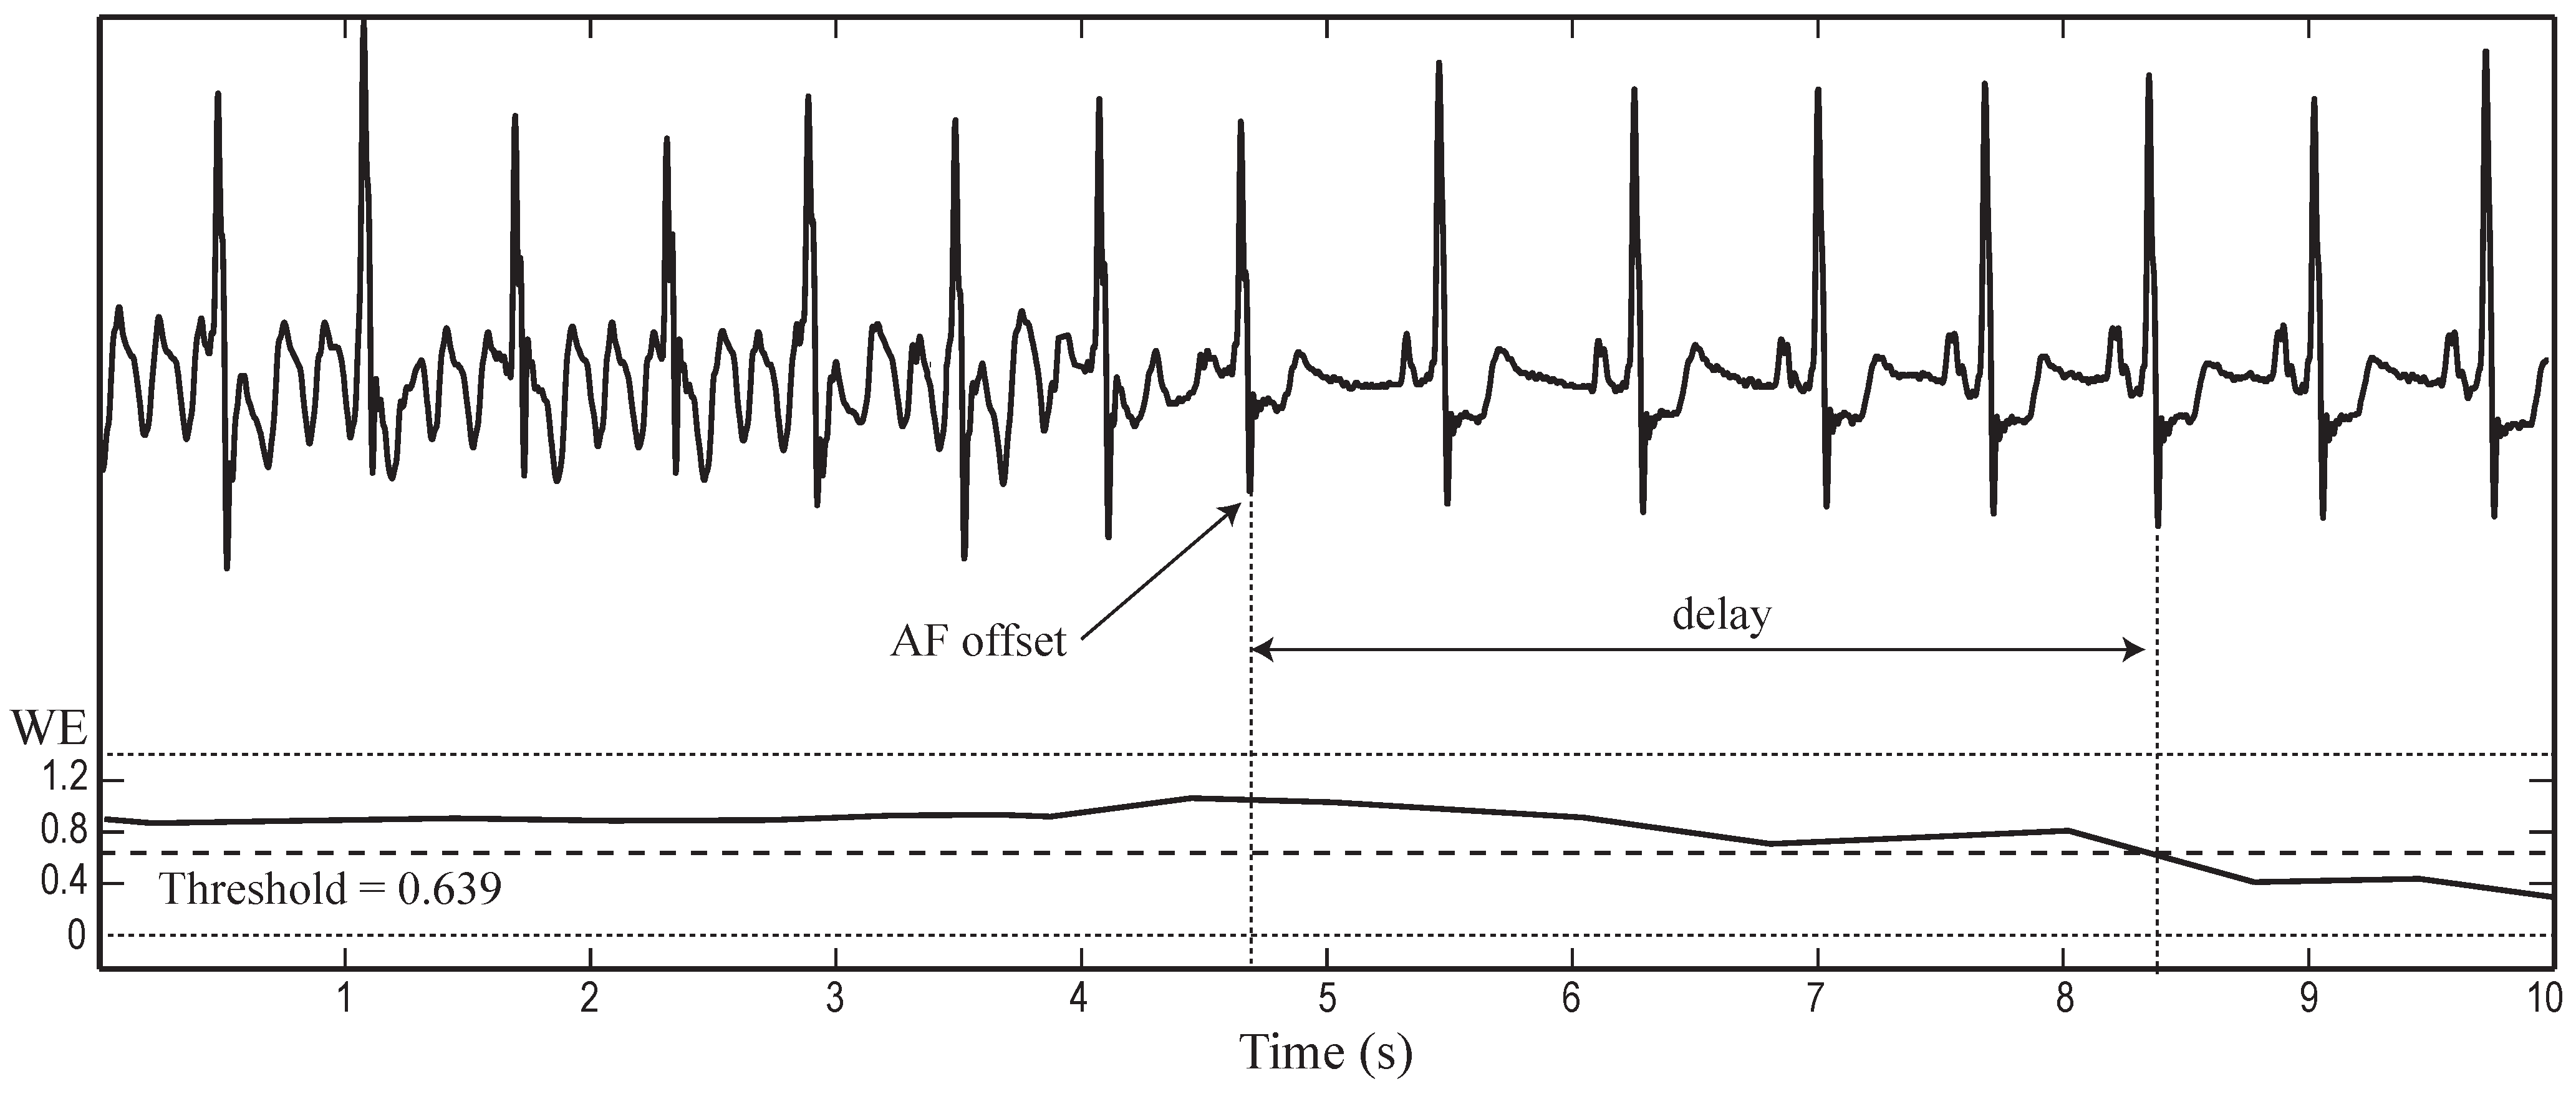
2.4. Performance Assessment and Statistical Analysis
3. Results


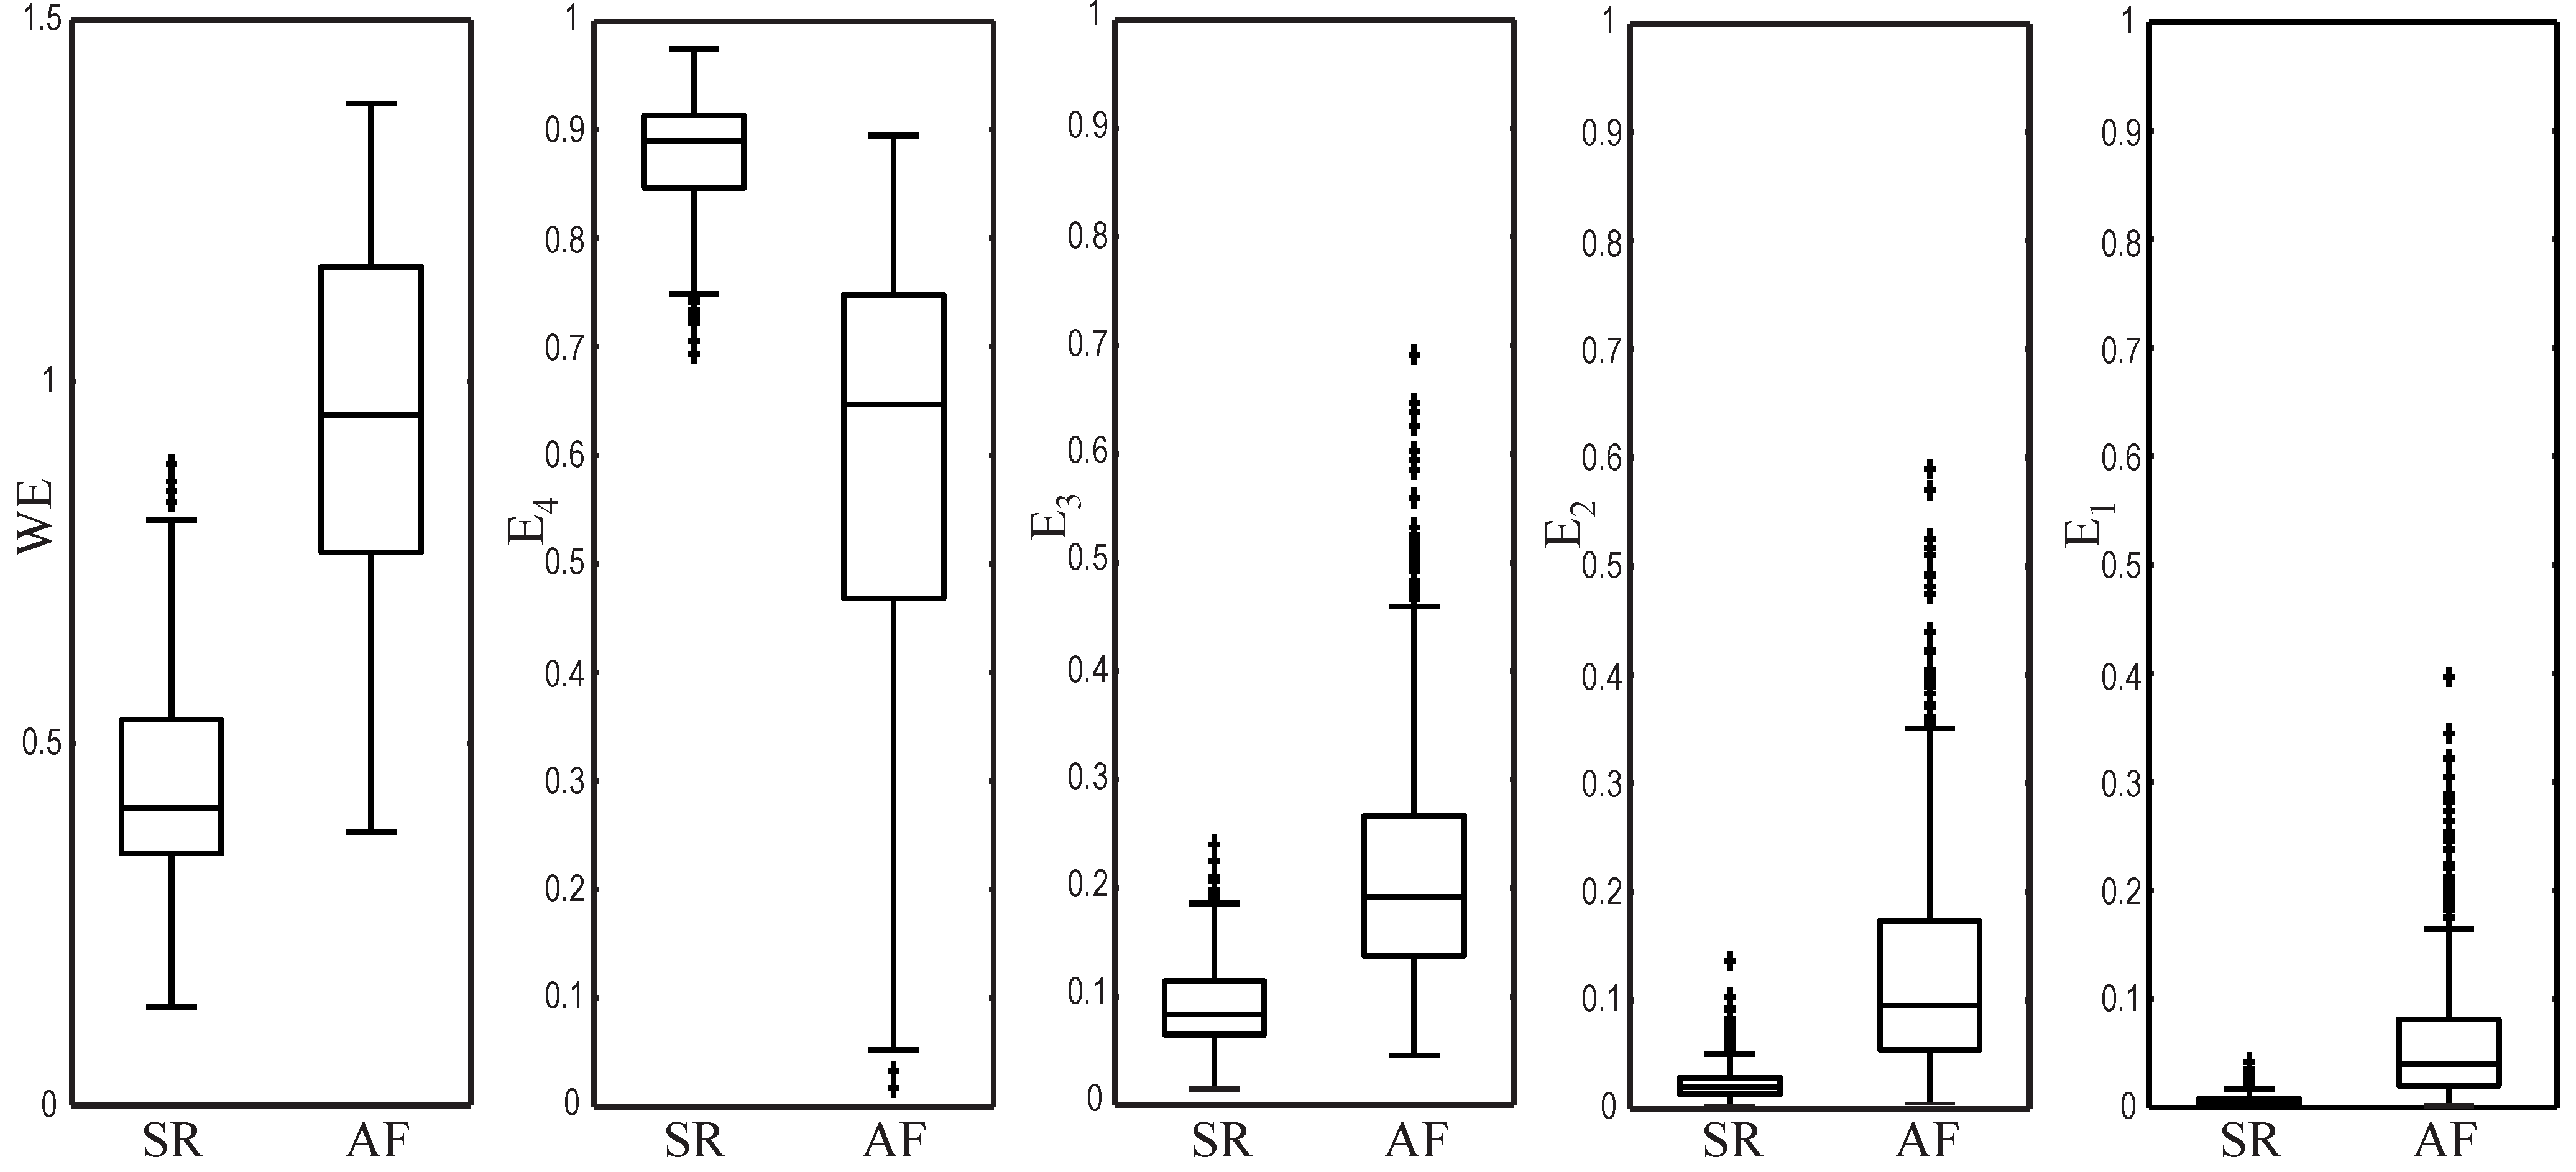
| Metric | SR beats | AF beats | p | Threshold | Accuracy (%) | Sensitivity (%) | Specificity (%) |
|---|---|---|---|---|---|---|---|
| WE | 0.431 ± 0.135 | 0.952 ± 0.240 | 0.639 | 95.62 | 96.07 | 95.23 | |
| 0.881 ± 0.051 | 0.601 ± 0.190 | 0.804 | 94.89 | 94.61 | 95.19 | ||
| 0.089 ± 0.040 | 0.215 ± 0.105 | 0.110 | 87.60 | 94.78 | 81.03 | ||
| 0.023 ± 0.015 | 0.125 ± 0.096 | 0.038 | 91.04 | 90.69 | 91.35 | ||
| 0.007 ± 0.006 | 0.060 ± 0.057 | 0.011 | 88.75 | 92.10 | 85.68 |
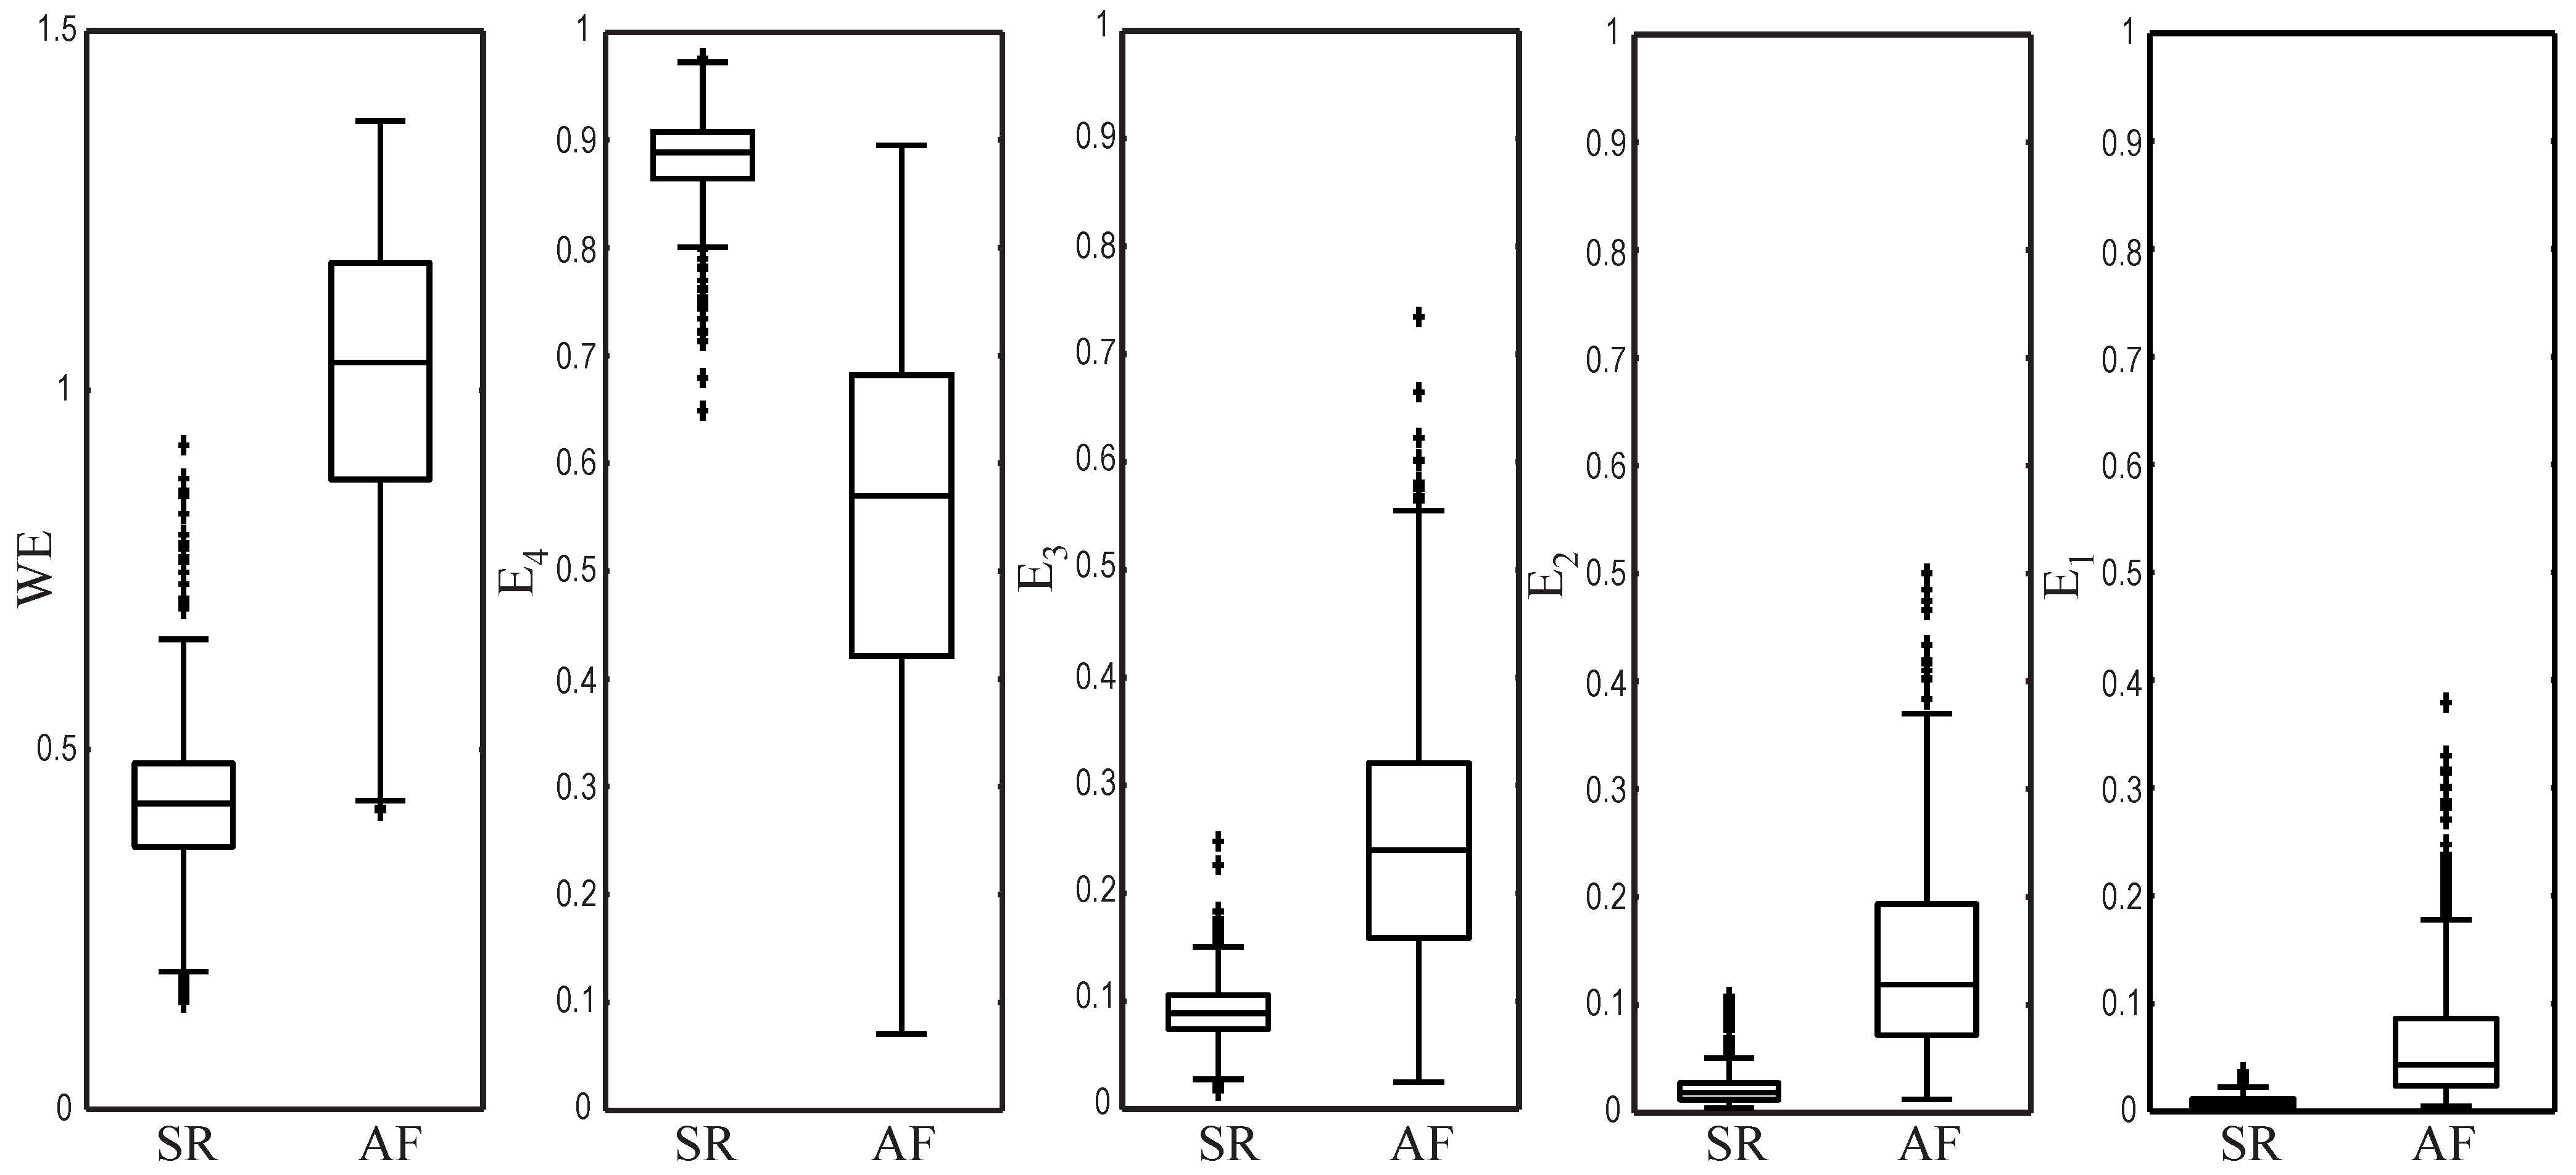
| Metric | SR beats | AF beats | p | Accuracy (%) | Sensitivity (%) | Specificity (%) |
|---|---|---|---|---|---|---|
| WE | 0.420 ± 0.124 | 1.017 ± 0.208 | 95.28 | 96.47 | 94.19 | |
| 0.886 ± 0.044 | 0.546 ± 0.183 | 94.48 | 93.19 | 95.89 | ||
| 0.086 ± 0.032 | 0.249 ± 0.118 | 85.51 | 81.66 | 89.03 | ||
| 0.022 ± 0.017 | 0.141 ± 0.089 | 90.84 | 88.15 | 93.29 | ||
| 0.007 ± 0.006 | 0.065 ± 0.060 | 87.69 | 81.80 | 93.03 |


4. Discussion

| Algorithm | Sensitivity | Specificity | Accuracy | Delay | Methodology |
|---|---|---|---|---|---|
| Slocum et al. [23] | 62.80% | 77.46% | – | – | Frequency analysis of the residual signal after QRST cancellation. |
| Tateno and Glass [27] | 94.40% | 97.20% | – | – | Kolmogorov–Smirnov test from histograms of difference between two successive RR intervals. |
| Dash et al. [28] | 94.40% | 95.10% | – | 18 beats | Analysis of randomness, variability and complexity of RR interval combined by simple rules. |
| Babaeizadeh et al. [34] | 92.00% | 95.50% | – | – | Information combined by a decision tree from RR and PR intervals variability and the P-wave similarity. |
| Huang et al. [29] | 96.10% | 98.10% | – | 70 beats | Analysis of the density histogram of delta RR intervals with several statistical features. |
| Lake and Moorman [30] | 91.00% | 94.00% | – | 12 beats | Analysis of RR interval regularity by using the coefficient of sample entropy. |
| Jiang et al. [36] | 98.20% | 97.50% | – | – | Analysis of RR interval density histograms combined with the P-wave presence study. |
| Lee et al. [56] | 98.20% | 97.70% | – | ≈ 12 beats | Analysis of RR interval variability with time-varying coherence functions and Shannon entropy. |
| Zhou et al. [32] | 96.89% | 98.25% | 97.67% | – | Analysis of RR interval regularity by applying nonlinear/linear integer filters, symbolic dynamics and Shannon entropy. |
| Ladavich and Ghoraani [24] | 98.09% | 91.66% | 93.22% | 7 beats | Analysis of the P-wave absence by using a Gaussian mixture model. |
| This work | 96.47% | 94.19% | 95.28% | 5 beats | Analysis of the median TQ interval by using WE. |
5. Conclusions
Acknowledgments
Author Contributions
Conflicts of Interest
References
- Drachman, D.A. Aging of the Brain, Entropy, and Alzheimer Disease. Neurology 2006, 67, 1340–1352. [Google Scholar] [CrossRef] [PubMed]
- Schulz, S.; Bär, K.J.; Voss, A. Analyses of Heart Rate, Respiration and Cardiorespiratory Coupling in Patients with Schizophrenia. Entropy 2015, 17, 483–501. [Google Scholar] [CrossRef]
- Du, Q.; Nie, K.; Wang, Z. Application of Entropy-Based Attribute Reduction and an Artificial Neural Network in Medicine: A Case Study of Estimating Medical Care Costs Associated with Myocardial Infarction. Entropy 2014, 16, 4788–4800. [Google Scholar] [CrossRef]
- Alcaraz, R.; Rieta, J.J. A Review on Sample Entropy Applications for the Non-invasive Analysis of Atrial Fibrillation Electrocardiograms. Biomed. Signal Process. Control 2010, 5, 1–14. [Google Scholar] [CrossRef]
- Umar, H. Clinical Decision-Making Using Computers: Opportunities and Limitations. Dent. Clin. North Am. 2002, 46, 521–538. [Google Scholar] [CrossRef]
- Belle, A.; Kon, M.A.; Najarian, K. Biomedical Informatics for Computer-Aided Decision Support Systems: A Survey. Sci. World J. 2013, 2013, 769639. [Google Scholar] [CrossRef] [PubMed]
- Rosso, O.A.; Blanco, S.; Yordanova, J.; Kolev, V.; Figliola, A.; Schürmann, M.; Başar, E. Wavelet Entropy: A New Tool for Analysis of Short Duration Brain Electrical Signals. J. Neurosci. Methods 2001, 105, 65–75. [Google Scholar] [CrossRef]
- Frantzidis, C.A.; Vivas, A.B.; Tsolaki, A.; Klados, M.A.; Tsolaki, M.; Bamidis, P.D. Functional Disorganization of Small-World Brain Networks in Mild Alzheimer’s Disease and Amnestic Mild Cognitive Impairment: An EEG Study Using Relative Wavelet Entropy (RWE). Front. Aging Neurosci. 2014, 6. [Google Scholar] [CrossRef] [PubMed]
- Alcaraz, R.; Rieta, J.J. Application of Wavelet Entropy to Predict Atrial Fibrillation Progression from the Surface ECG. Comput. Math. Methods Med. 2012, 2012, 245213. [Google Scholar] [CrossRef] [PubMed]
- Xu, P.; Hu, X.; Yao, D. Improved Wavelet Entropy Calculation with Window Functions and Its Preliminary Application to Study Intracranial Pressure. Comput. Biol. Med. 2013, 43, 425–433. [Google Scholar] [CrossRef] [PubMed]
- Cek, M.E.; Ozgoren, M.; Savaci, F.A. Continuous Time Wavelet Entropy of Auditory Evoked Potentials. Comput. Biol. Med. 2010, 40, 90–96. [Google Scholar] [PubMed]
- Fuster, V.; Rydén, L.E.; Cannom, D.S.; Crijns, H.J.; Curtis, A.B.; Ellenbogen, K.A.; Halperin, J.L.; Kay, G.N.; Le Huezey, J.Y.; Lowe, J.E.; et al. 2011 ACCF/AHA/HRS Focused Updates Incorporated into the ACC/AHA/ESC 2006 Guidelines for the Management of Patients with Atrial Fibrillation: A Report of the American College of Cardiology Foundation/American Heart Association Task Force on Practice Guidelines. Circulation 2011, 123, e269–e367. [Google Scholar] [PubMed]
- Gillis, A.M.; Krahn, A.D.; Skanes, A.C.; Nattel, S. Management of Atrial Fibrillation in the Year 2033: New Concepts, Tools, and Applications Leading to Personalized Medicine. Can. J. Cardiol. 2013, 29, 1141–1146. [Google Scholar] [CrossRef] [PubMed]
- January, C.T.; Wann, L.S.; Alpert, J.S.; Calkins, H.; Cigarroa, J.E.; Cleveland, J.C., Jr.; Conti, J.B.; Ellinor, P.T.; Ezekowitz, M.D.; Field, M.E.; et al. 2014 AHA/ACC/HRS Guideline for the Management of Patients with Atrial Fibrillation: Executive Summary: A Report of the American College of Cardiology/American Heart Association Task Force on Practice Guidelines and the Heart Rhythm Society. Circulation 2014, 130, e199–e267. [Google Scholar] [CrossRef] [PubMed]
- Hart, R.G.; Pearce, L.A.; Aguilar, M.I. Meta-analysis: Antithrombotic Therapy to Prevent Stroke in Patients Who Have Nonvalvular Atrial Fibrillation. Ann. Intern. Med. 2007, 146, 857–867. [Google Scholar] [CrossRef] [PubMed]
- Blomstrom Lundqvist, C.; Lip, G.Y.H.; Kirchhof, P. What Are the Costs of Atrial Fibrillation? Europace 2011, 13, ii9–ii12. [Google Scholar] [CrossRef] [PubMed]
- Asgari, S.; Mehrnia, A.; Moussavi, M. Automatic Detection of Atrial Fibrillation Using Stationary Wavelet Transform and Support Vector Machine. Comput. Biol. Med. 2015, 60, 132–142. [Google Scholar] [CrossRef] [PubMed]
- Israel, C.W.; Grönefeld, G.; Ehrlich, J.R.; Li, Y.G.; Hohnloser, S.H. Long-Term Risk of Recurrent Atrial Fibrillation as Documented by an Implantable Monitoring Device: Implications for Optimal Patient Care. J. Am. Coll. Cardiol. 2004, 43, 47–52. [Google Scholar] [CrossRef] [PubMed]
- Xiong, Q.; Proietti, M.; Senoo, K.; Lip, G.Y.H. Asymptomatic versus Symptomatic Atrial Fibrillation: A Systematic Review of Age/Gender Differences and Cardiovascular Outcomes. Int. J. Cardiol. 2015, 191, 172–177. [Google Scholar] [CrossRef] [PubMed]
- Strickberger, S.A.; Ip, J.; Saksena, S.; Curry, K.; Bahnson, T.D.; Ziegler, P.D. Relationship between Atrial Tachyarrhythmias and Symptoms. Heart Rhythm 2005, 2, 125–131. [Google Scholar] [CrossRef] [PubMed]
- Quinn, F.R.; Gladstone, D. Screening for Undiagnosed Atrial Fibrillation in the Community. Curr. Opin. Cardiol. 2014, 29, 28–35. [Google Scholar] [CrossRef] [PubMed]
- Petrutiu, S.; Ng, J.; Nijm, G.M.; Al-Angari, H.; Swiryn, S.; Sahakian, A.V. Atrial Fibrillation and Waveform Characterization. A Time Domain Perspective in the Surface ECG. IEEE Eng. Med. Biol. Mag. 2006, 25, 24–30. [Google Scholar] [CrossRef] [PubMed]
- Slocum, J.; Sahakian, A.; Swiryn, S. Diagnosis of Atrial Fibrillation from Surface Electrocardiograms Based on Computer-Detected Atrial Activity. J. Electrocardiol. 1992, 25, 1–8. [Google Scholar] [CrossRef]
- Ladavich, S.; Ghoraani, B. Rate-independent Detection of Atrial Fibrillation by Statistical Modeling of Atrial Activity. Biomed. Signal Process. Control 2015, 18, 274–281. [Google Scholar] [CrossRef]
- Larburu, N.; Lopetegi, T.; Romero, I. Comparative Study of Algorithm for Atrial Fibrillation Detection. In Proceedings of the 2011 Computing in Cardiology, Hangzhou, China, 18–21 September 2011; Vol. 38, pp. 265–268.
- Zhang, Y.; Mazgalev, T.N. Ventricular Rate Control during Atrial Fibrillation and AV Node Modifications: Past, Present, and Future. Pacing Clin. Electrophysiol. 2004, 27, 382–393. [Google Scholar] [CrossRef] [PubMed]
- Tateno, K.; Glass, L. Automatic Detection of Atrial Fibrillation Using the Coefficient of Variation and Density Histograms of RR and ΔRR Intervals. Med. Biol. Eng. Comput. 2001, 39, 664–671. [Google Scholar] [CrossRef] [PubMed]
- Dash, S.; Chon, K.H.; Lu, S.; Raeder, E.A. Automatic Real Time Detection of Atrial Fibrillation. Ann. Biomed. Eng. 2009, 37, 1701–1709. [Google Scholar] [CrossRef] [PubMed]
- Huang, C.; Ye, S.; Chen, H.; Li, D.; He, F.; Tu, Y. A Novel Method for Detection of the Transition between Atrial Fibrillation and Sinus Rhythm. IEEE Trans. Biomed. Eng. 2011, 58, 1113–1139. [Google Scholar] [CrossRef] [PubMed]
- Lake, D.E.; Moorman, J.R. Accurate Estimation of Entropy in very Short Physiological Time Series: The Problem of Atrial Fibrillation Detection in Implanted Ventricular Devices. Am. J. Physiol. Heart Circ. Physiol. 2011, 300, H319–H325. [Google Scholar] [CrossRef] [PubMed]
- Lee, J.; Reyes, B.A.; McManus, D.D.; Maitas, O.; Mathias, O.; Chon, K.H. Atrial Fibrillation Detection Using an iPhone 4S. IEEE Trans. Biomed. Eng. 2013, 60, 203–206. [Google Scholar] [CrossRef] [PubMed]
- Zhou, X.; Ding, H.; Ung, B.; Pickwell-MacPherson, E.; Zhang, Y. Automatic Online Detection of Atrial Fibrillation Based on Symbolic Dynamics and Shannon Entropy. Biomed. Eng. Online 2014, 13. [Google Scholar] [CrossRef] [PubMed]
- Seet, R.C.S.; Friedman, P.A.; Rabinstein, A.A. Prolonged Rhythm Monitoring for the Detection of Occult Paroxysmal Atrial Fibrillation in Ischemic Stroke of Unknown Cause. Circulation 2011, 124, 477–486. [Google Scholar] [CrossRef] [PubMed]
- Babaeizadeh, S.; Gregg, R.E.; Helfenbein, E.D.; Lindauer, J.M.; Zhou, S.H. Improvements in Atrial Fibrillation Detection for Real-time Monitoring. J. Electrocardiol. 2009, 42, 522–526. [Google Scholar] [CrossRef] [PubMed]
- De Carvalho, P.; Henriques, J.; Couceiro, R.; Harris, M.; Antunes, M. Model-Based Atrial Fibrillation Detection. In ECG Signal Processing, Classification and Interpretation; Springer: London, UK, 2012; pp. 99–133. [Google Scholar]
- Jiang, K.; Huang, C.; Ye, S.M.; Chen, H. High Accuracy in Automatic Detection of Atrial Fibrillation for Holter Monitoring. J. Zhejiang Univ. Sci. B. 2012, 13, 751–756. [Google Scholar] [CrossRef] [PubMed]
- Pürerfellner, H.; Pokushalov, E.; Sarkar, S.; Koehler, J.; Zhou, R.; Urban, L.; Hindricks, G. P-Wave Evidence as a Method for Improving Algorithm to Detect Atrial Fibrillation in Insertable Cardiac Monitors. Heart Rhythm 2014, 11, 1575–1583. [Google Scholar] [CrossRef] [PubMed]
- Du, X.; Rao, N.; Qian, M.; Liu, D.; Li, J.; Feng, W.; Yin, L.; Chen, X. A Novel Method for Real-Time Atrial Fibrillation Detection in Electrocardiograms Using Multiple Parameters. Ann. Noninvasive Electrocardiol. 2014, 19, 217–225. [Google Scholar] [CrossRef] [PubMed]
- Petrėnas, A.; Sörnmo, L.; Lukoševičius, A.; Marozas, V. Detection of Occult Paroxysmal Atrial Fibrillation. Med. Biol. Eng. Comput. 2015, 53, 287–297. [Google Scholar] [CrossRef] [PubMed]
- Lévy, S.; Breithardt, G.; Campbell, R.W.; Camm, A.J.; Daubert, J.C.; Allessie, M.; Aliot, E.; Capucci, A.; Cosio, F.; Crijns, H.; et al. Atrial Fibrillation: Current Knowledge and Recommendations for Management. Working Group on Arrhythmias of the European Society of Cardiology. Eur. Heart J. 1998, 19, 1294–1320. [Google Scholar] [CrossRef] [PubMed]
- Holmqvist, F.; Carlson, J.; Waktare, J.E.P.; Platonov, P.G. Noninvasive Evidence of Shortened Atrial Refractoriness during Sinus Rhythm in Patients with Paroxysmal Atrial Fibrillation. Pacing Clin. Electrophysiol. 2009, 32, 302–307. [Google Scholar] [CrossRef] [PubMed]
- Blanche, C.; Tran, N.; Carballo, D.; Rigamonti, F.; Burri, H.; Zimmermann, M. Usefulness of P-Wave Signal Averaging to Predict Atrial Fibrillation Recurrences after Electrical Cardioversion. Ann. Noninvasive Electrocardiol. 2014, 19, 266–272. [Google Scholar] [CrossRef] [PubMed]
- Blanche, C.; Tran, N.; Rigamonti, F.; Burri, H.; Zimmermann, M. Value of P-Wave Signal Averaging to Predict Atrial Fibrillation Recurrences after Pulmonary Vein Isolation. Europace 2013, 15, 198–204. [Google Scholar] [CrossRef] [PubMed]
- Goldberger, A.L.; Amaral, L.A.; Glass, L.; Hausdorff, J.M.; Ivanov, P.C.; Mark, R.G.; Mietus, J.E.; Moody, G.B.; Peng, C.K.; Stanley, H.E. PhysioBank, PhysioToolkit, and PhysioNet: Components of a New Research Resource for Complex Physiologic Signals. Circulation 2000, 101, e215–e220. [Google Scholar] [CrossRef] [PubMed]
- Taha, B.; Reddy, S.; Xue, Q.; Swiryn, S. Automated Discrimination between Atrial Fibrillation and Atrial Flutter in the Resting 12-Lead Electrocardiogram. J. Electrocardiol. 2000, 33, 123–125. [Google Scholar] [CrossRef] [PubMed]
- Christov, I.; Bortolan, G.; Daskalov, I. Automatic Detection of Atrial Fibrillation and Flutter by Wave Rectification Method. J. Med. Eng. Technol. 2001, 25, 217–221. [Google Scholar] [CrossRef] [PubMed]
- Dotsinsky, I.; Stoyanov, T. Optimization of Bi-directional Digital Filtering for Drift Suppression in Electrocardiogram Signals. J. Med. Eng. Technol. 2004, 28, 178–180. [Google Scholar] [CrossRef] [PubMed]
- Sörnmo, L.; Laguna, P. Biomedical Signal Processing in Cardiac and Neurological Applications (Biomedical Engineering); Elsevier: Amsterdam, The Netherlands, 2005. [Google Scholar]
- Martínez, A.; Alcaraz, R.; Rieta, J.J. Application of the Phasor Transform for Automatic Delineation of Single-Lead ECG Fiducial Points. Physiol. Meas. 2010, 31, 1467–1485. [Google Scholar] [CrossRef] [PubMed]
- Mallat, S. A Wavelet Tour of Signal Processing; Academic Press: Waltham, MA, USA, 1999. [Google Scholar]
- Addison, P.S. Wavelet Transforms and the ECG: A Review. Physiol. Meas. 2005, 26, R155–R199. [Google Scholar] [CrossRef] [PubMed]
- Rafiee, J.; Rafiee, M.A.; Prause, N.; Schoen, M.P. Wavelet Basis Functions in Biomedical Signal Processing. Expert Syst. Appl. 2011, 38, 6190–6201. [Google Scholar] [CrossRef]
- Arlot, S. A Survey of Cross-Validation Procedures for Model Selection. Stat. Surv. 2010, 4, 40–79. [Google Scholar] [CrossRef]
- Liu, C.; Li, P.; Di Maria, C.; Zhao, L.; Zhang, H.; Chen, Z. A Multi-step Method with Signal Quality Assessment and Fine-Tuning Procedure to Locate Maternal and Fetal QRS Complexes from Abdominal ECG Recordings. Physiol. Meas. 2014, 35, 1665–1683. [Google Scholar] [CrossRef] [PubMed]
- Censi, F.; Ricci, C.; Calcagnini, G.; Triventi, M.; Ricci, R.P.; Santini, M.; Bartolini, P. Time-Domain and Morphological Analysis of the P-Wave. Part I: Technical Aspects for Automatic Quantification of P-Wave Features. Pacing Clin. Electrophysiol. 2008, 31, 874–883. [Google Scholar] [CrossRef] [PubMed]
- Lee, J.; Nam, Y.; McManus, D.D.; Chon, K.H. Time-Varying Coherence Function for Atrial Fibrillation Detection. IEEE Trans. Biomed. Eng. 2013, 60, 2783–2793. [Google Scholar] [PubMed]
© 2015 by the authors; licensee MDPI, Basel, Switzerland. This article is an open access article distributed under the terms and conditions of the Creative Commons Attribution license (http://creativecommons.org/licenses/by/4.0/).
Share and Cite
Ródenas, J.; García, M.; Alcaraz, R.; Rieta, J.J. Wavelet Entropy Automatically Detects Episodes of Atrial Fibrillation from Single-Lead Electrocardiograms. Entropy 2015, 17, 6179-6199. https://0-doi-org.brum.beds.ac.uk/10.3390/e17096179
Ródenas J, García M, Alcaraz R, Rieta JJ. Wavelet Entropy Automatically Detects Episodes of Atrial Fibrillation from Single-Lead Electrocardiograms. Entropy. 2015; 17(9):6179-6199. https://0-doi-org.brum.beds.ac.uk/10.3390/e17096179
Chicago/Turabian StyleRódenas, Juan, Manuel García, Raúl Alcaraz, and José J. Rieta. 2015. "Wavelet Entropy Automatically Detects Episodes of Atrial Fibrillation from Single-Lead Electrocardiograms" Entropy 17, no. 9: 6179-6199. https://0-doi-org.brum.beds.ac.uk/10.3390/e17096179