
Energy and Exergy Analyses of a Combined Power Cycle Using the Organic Rankine Cycle and the Cold Energy of Liquefied Natural Gas

Abstract
:1. Introduction

| reference | year | cycle description | fluids | heat source temperature |
|---|---|---|---|---|
| Miyazaki et al. [7] | 2000 | Rankine cycle with DEC | NH3-H2O | 950 °C |
| Lu and Wang [8] | 2009 | Rankine/Brayton cycles/DEC | NH3-H2O | 990 °C |
| Shi and Che [9] | 2009 | Rankine cycle with DEC | NH3-H2O | 157–197 °C |
| Wang et al. [10] | 2013 | Rankine cycle with DEC | NH3-H2O | 200 °C |
| Wang et al. [11] | 2013 | Rankine cycle | NH3-H2O | 200 °C |
| Kim et al. [12,13] | 2014/2015 | Rankine cycle with DEC | NH3-H2O | 200 °C |
| Czargut and Szczygiel [22] | 2009 | cascade Rankine cycle | C2H6, C3H8 | 15 °C |
| Choi et al. [23] | 2013 | cascade Rankine cycle | C2H4, C2H6 | 15 °C |
| Sun et al. [28] | 2014 | ORC with/without DEC | zeotropic | 30 °C |
| Lee et al. [29] | 2014 | ORC with CO2 capture | ternary | 87.7 °C |
| Kim et al. [30] | 2015 | cascade ORC | binary | 25 °C |
| Soffiato et al. [26] | 2015 | ORC with career engine | 6 fluids | 76 °C |
| Xue et al. [27] | 2015 | cascade ORC | R227ea, R116 | 120 °C |
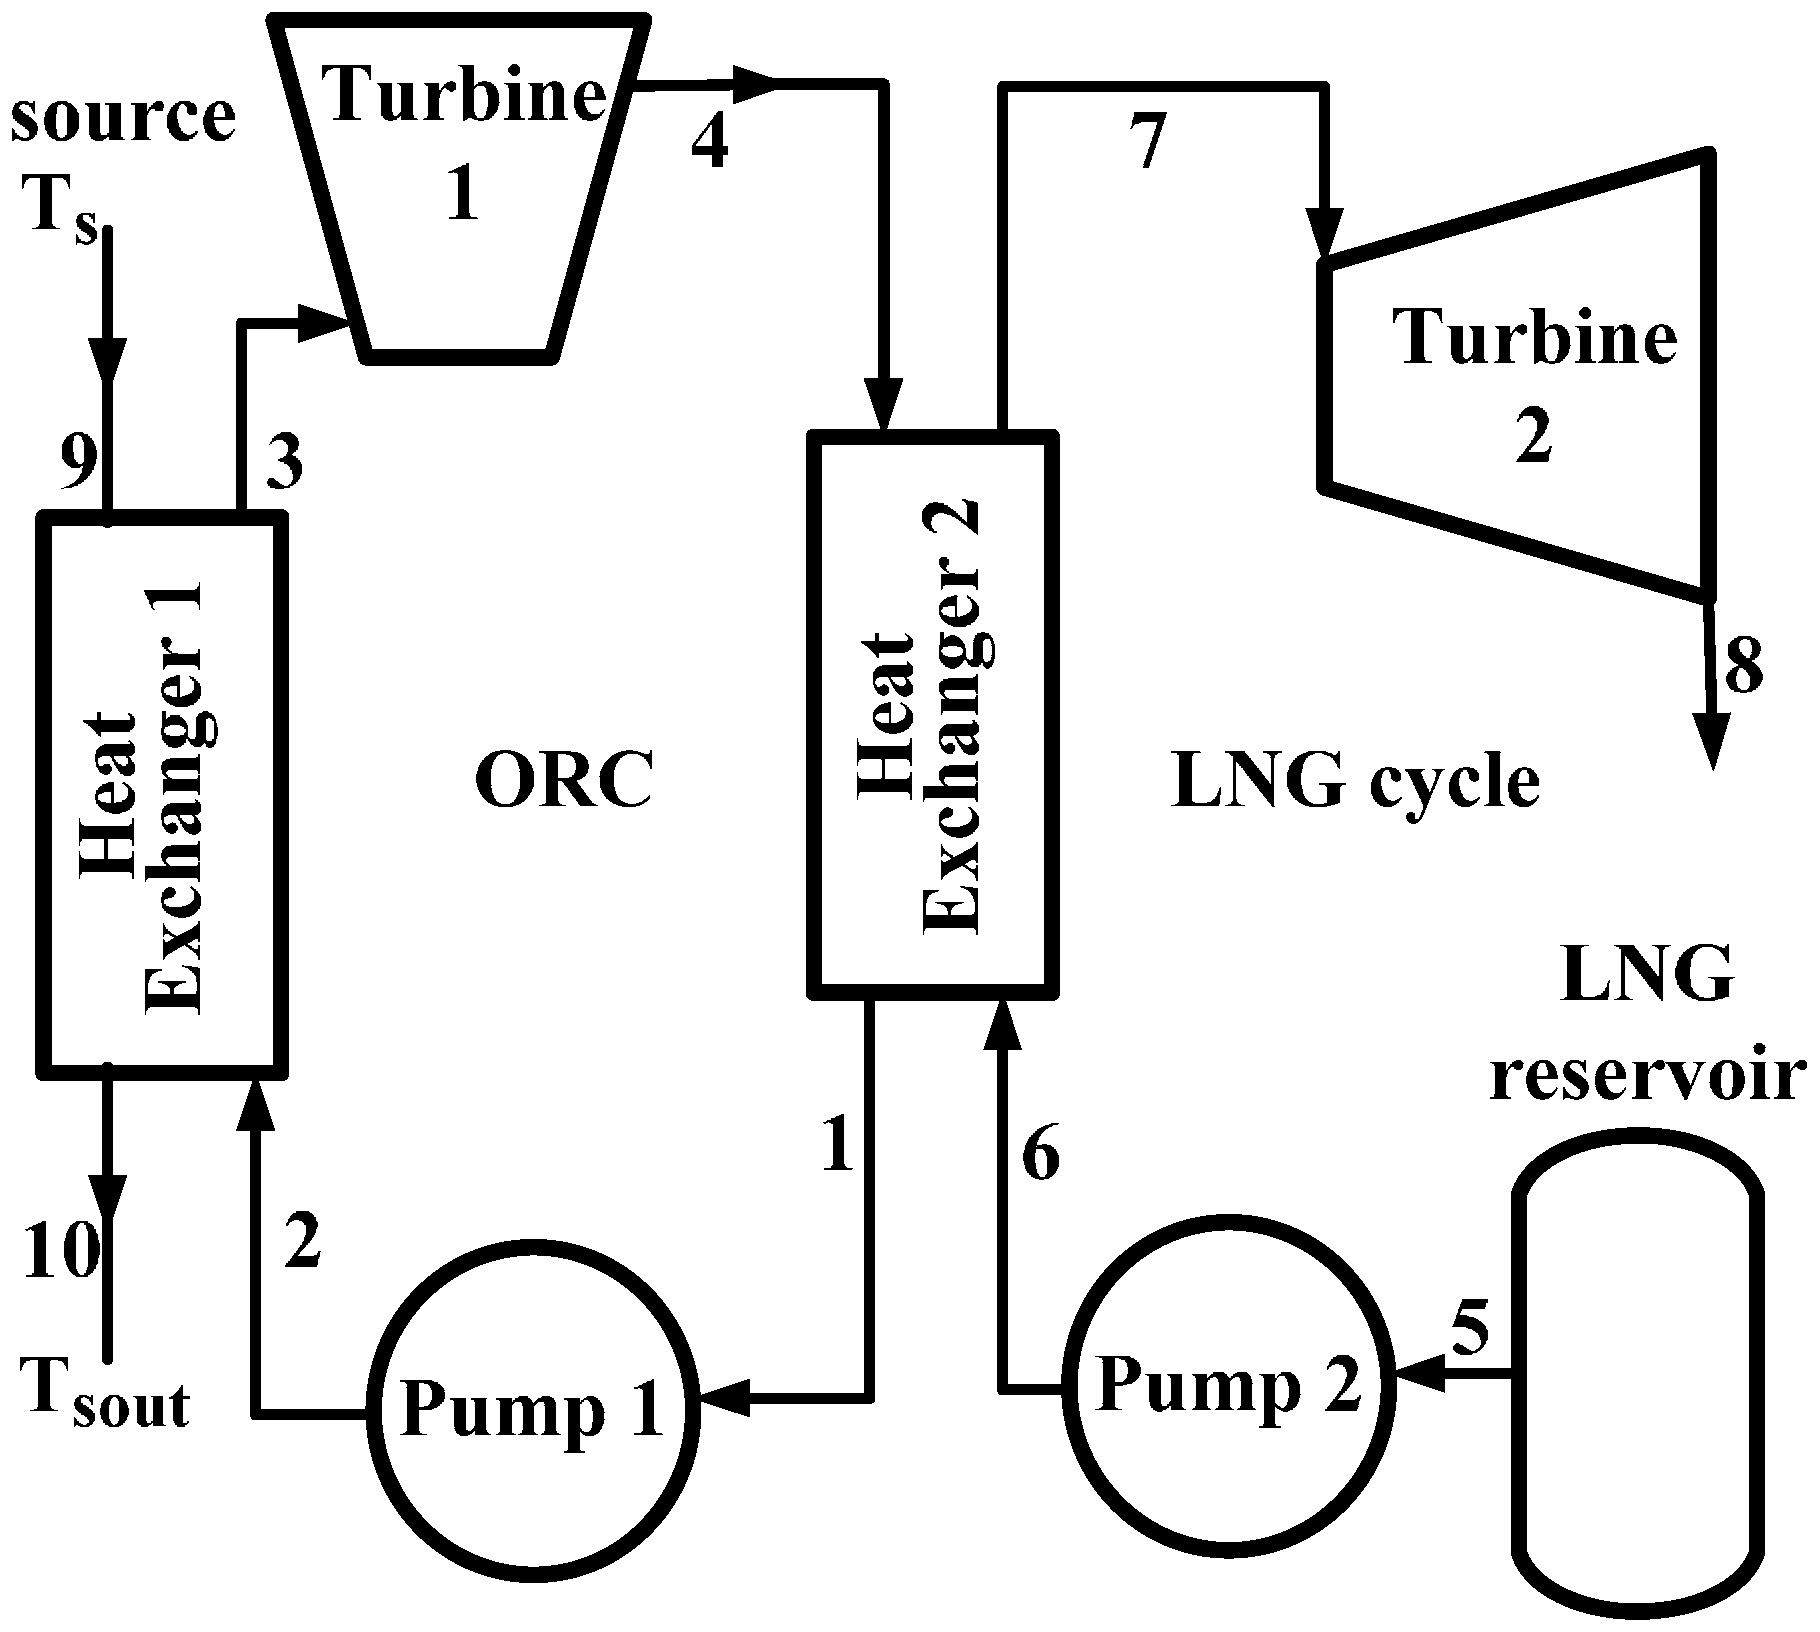
2. Methods

3. System Analysis
| Symbol | Component | Expression |
|---|---|---|
| DSE | source exhaust | |
| DLE | LNG exhaust | |
| DHX1 | heat exchanger 1 | |
| DHX2 | heat exchanger 2 | |
| DWn1 | net power of ORC | |
| DWn2 | net power of LNG cycle |
| Substance | M (kg/kmol) | Tcr (K) | Pcr (bar) | ω |
|---|---|---|---|---|
| R22 | 86.468 | 369.30 | 49.71 | 0.219 |
| R134a | 102.031 | 380.00 | 36.90 | 0.239 |
| R152a | 66.051 | 386.60 | 44.99 | 0.263 |
| propane | 44.096 | 396.82 | 42.49 | 0.152 |
| isobutane | 58.123 | 408.14 | 36.48 | 0.177 |
| R245fa | 134.048 | 427.20 | 36.40 | 0.3724 |
| R123 | 136.467 | 456.90 | 36.74 | 0.282 |
| isopentane | 72.150 | 460.43 | 33.81 | 0.228 |

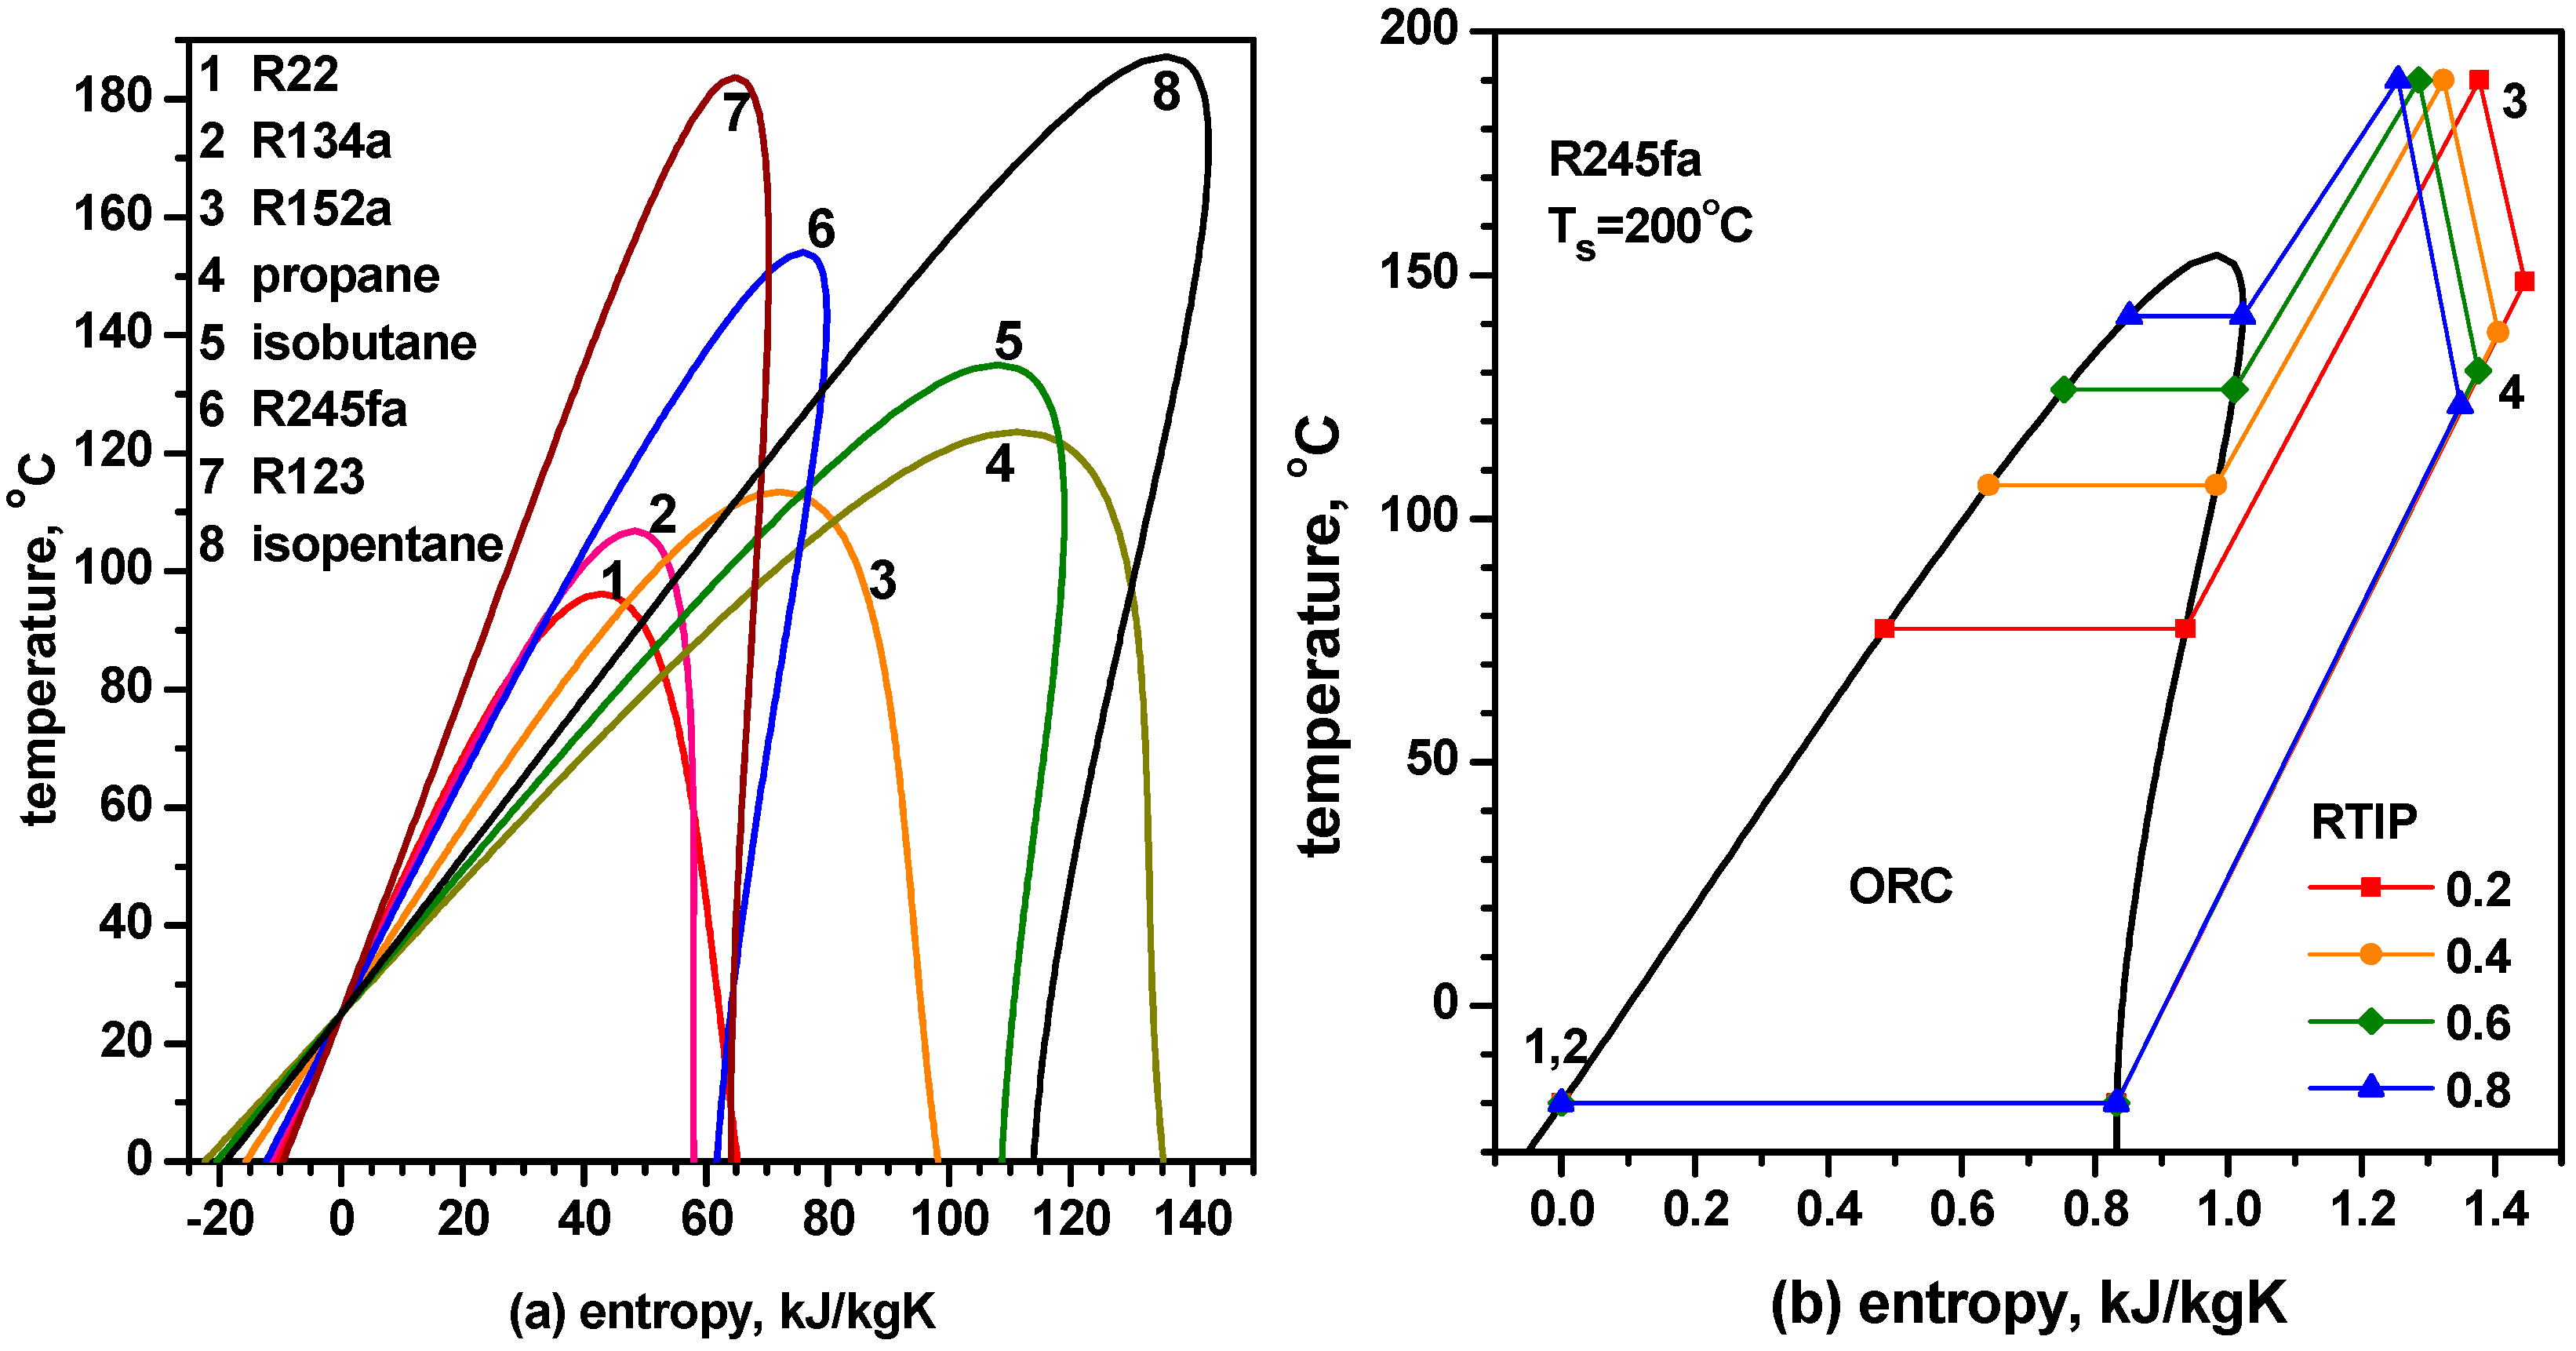
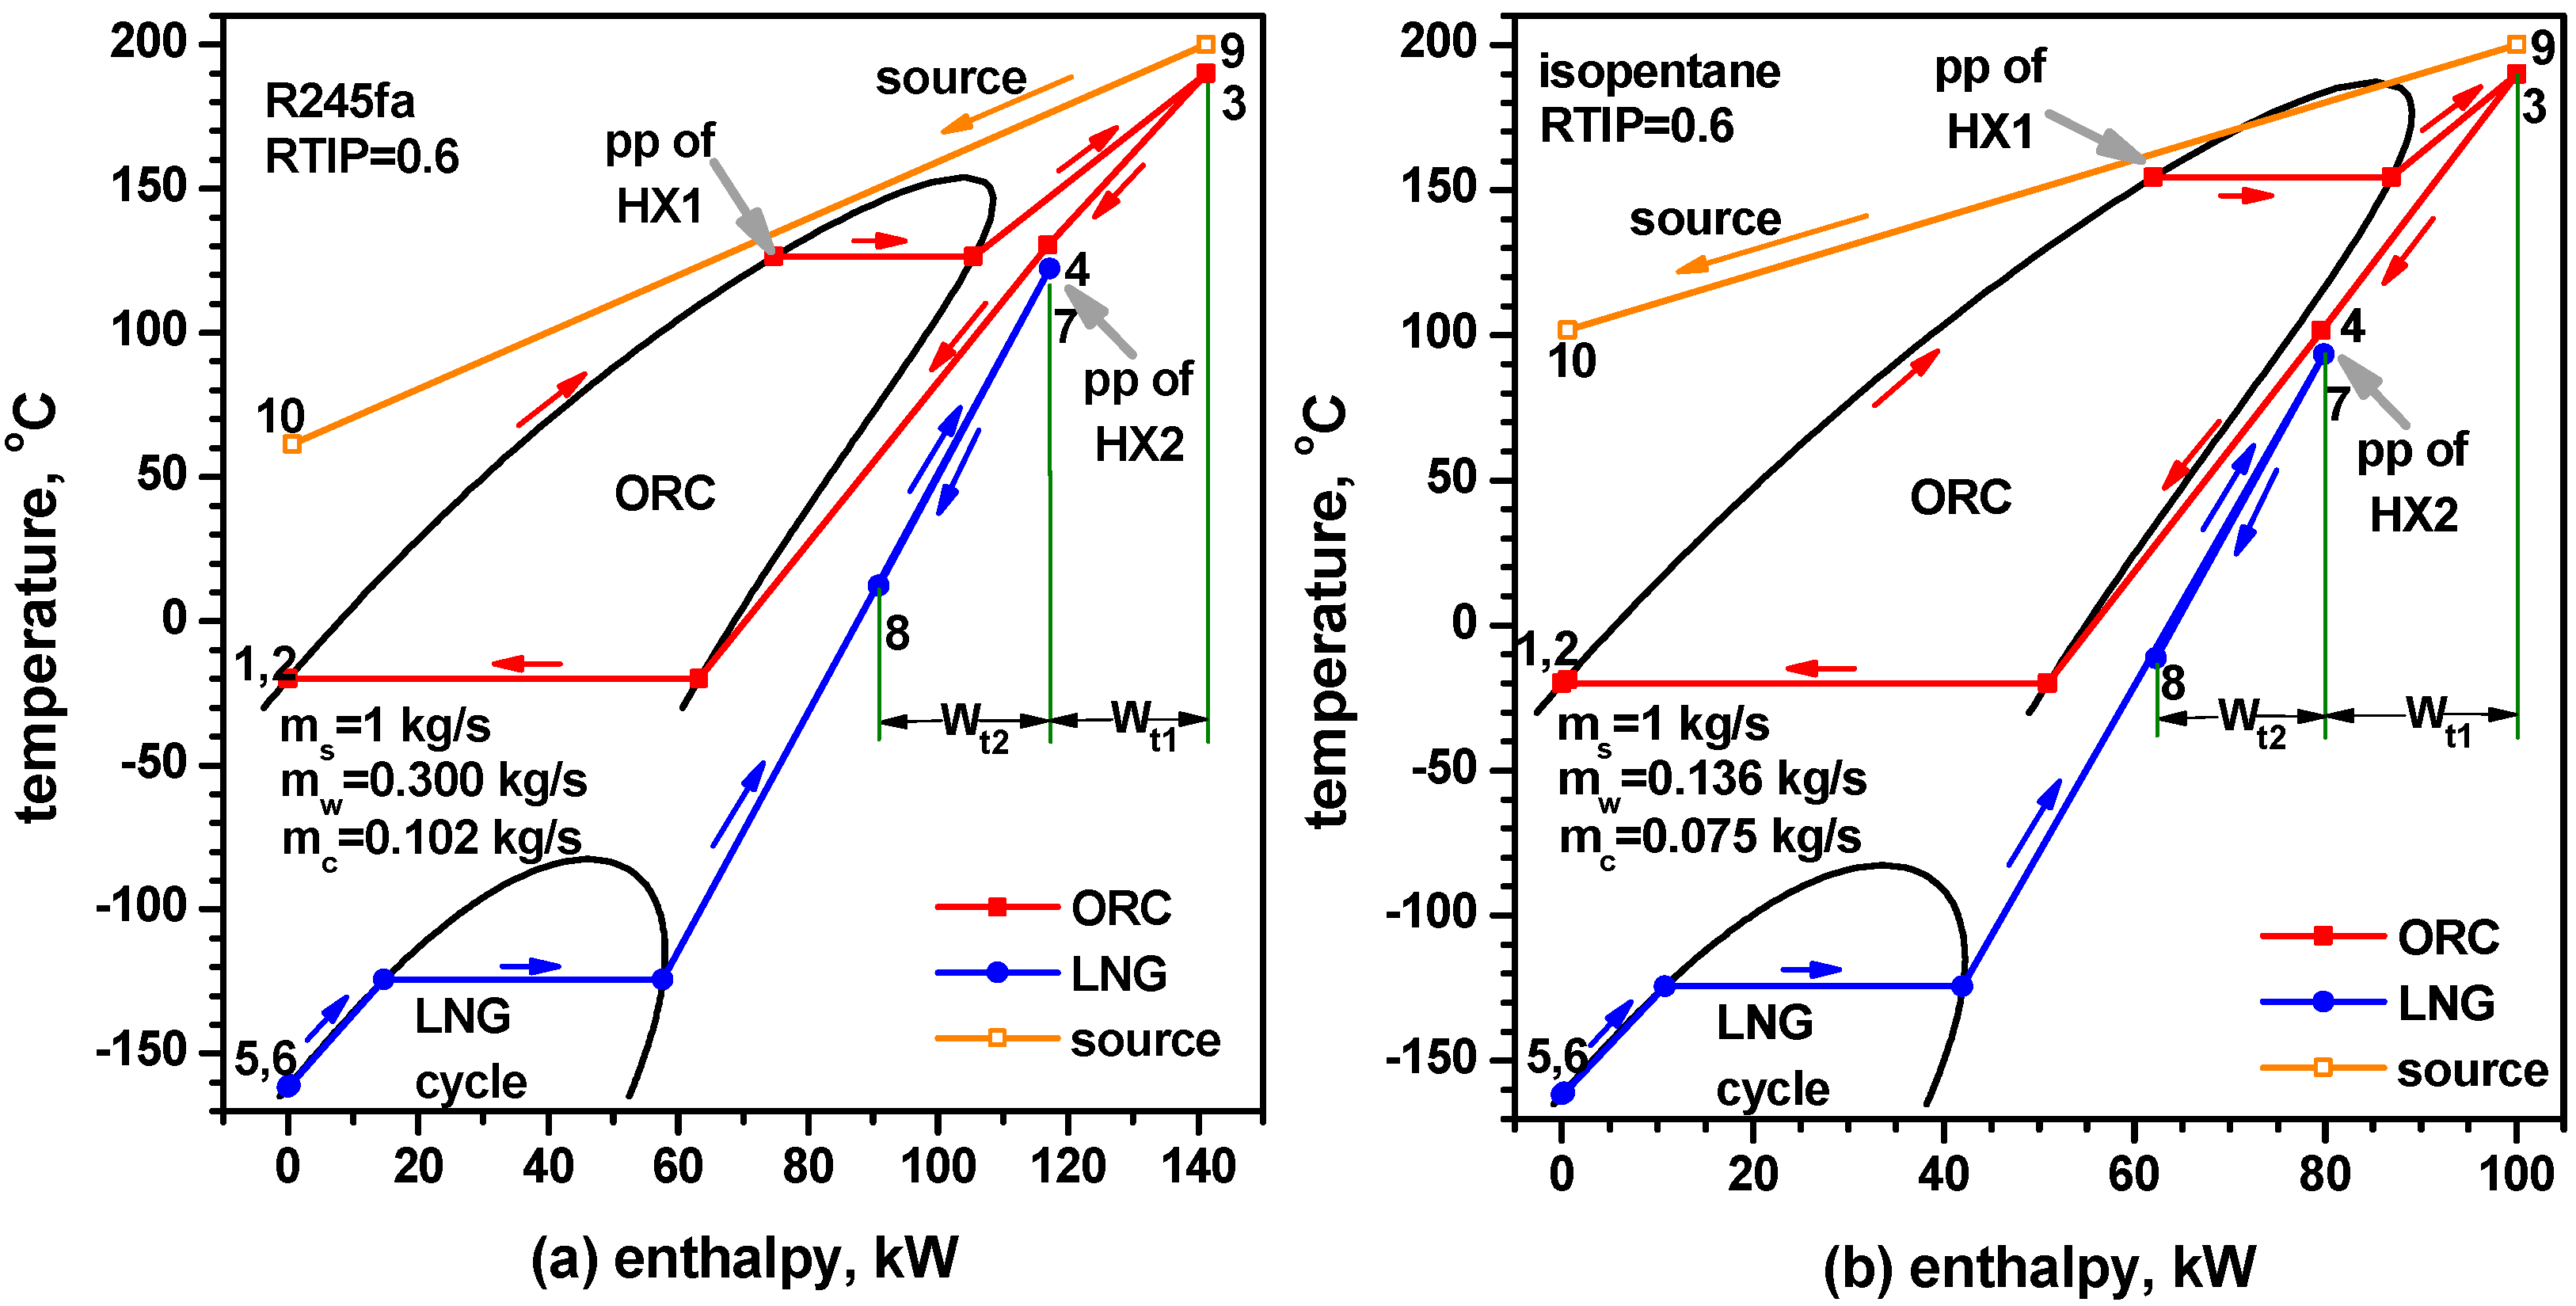
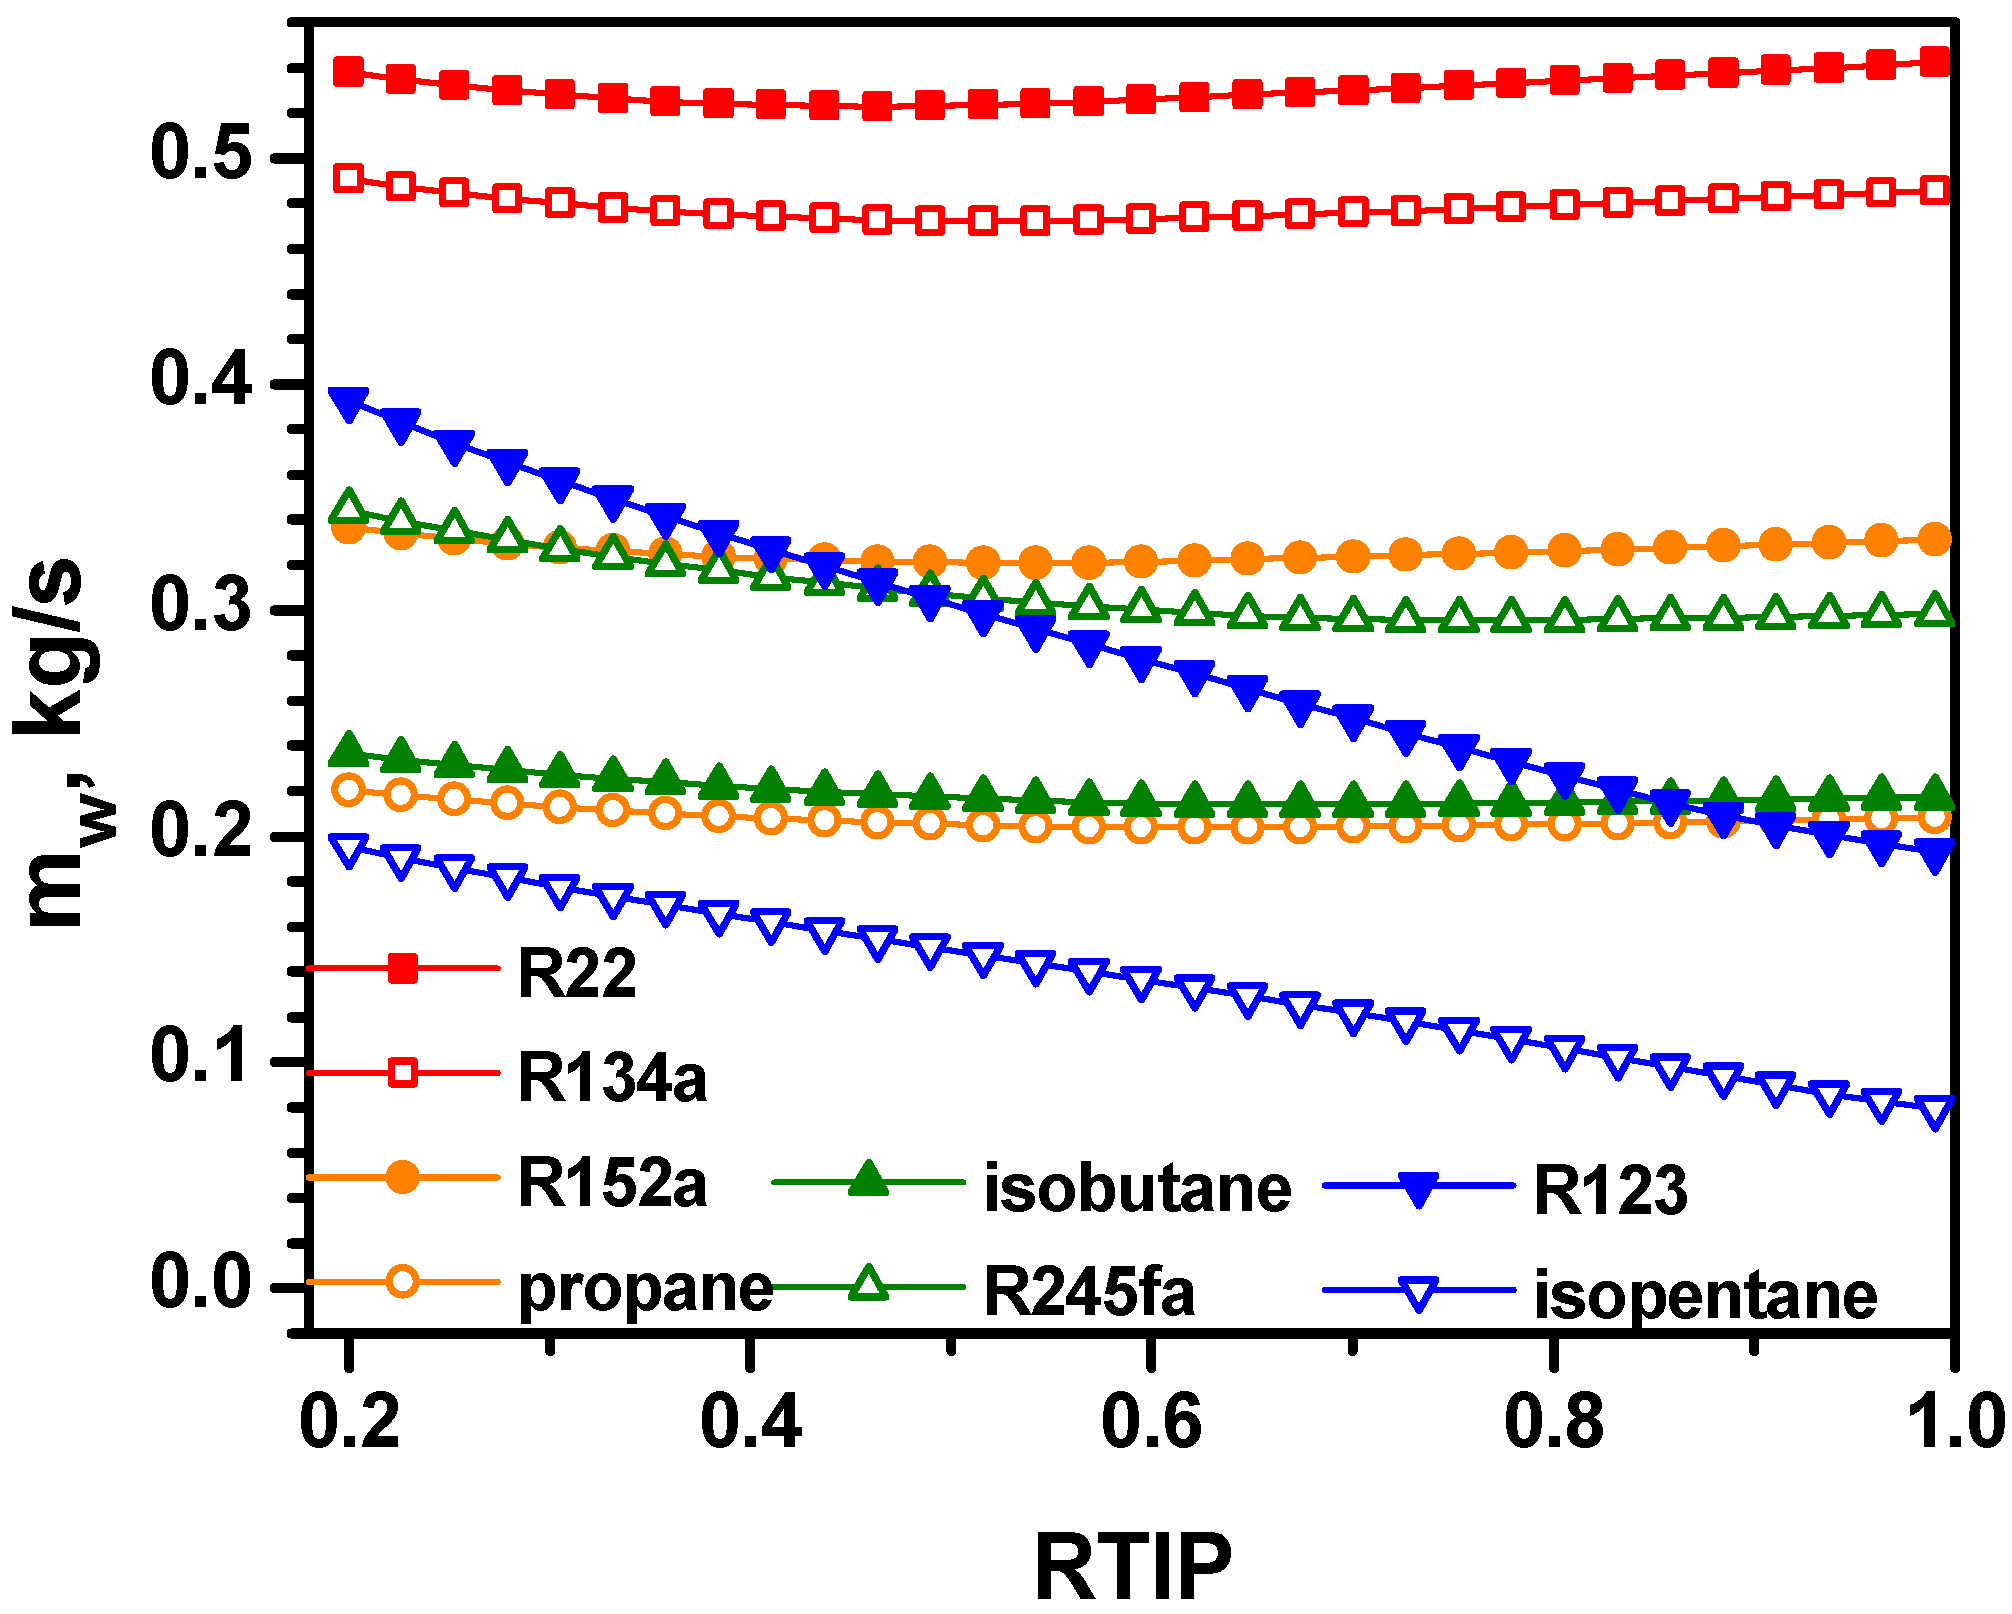
4. Results and Discussion
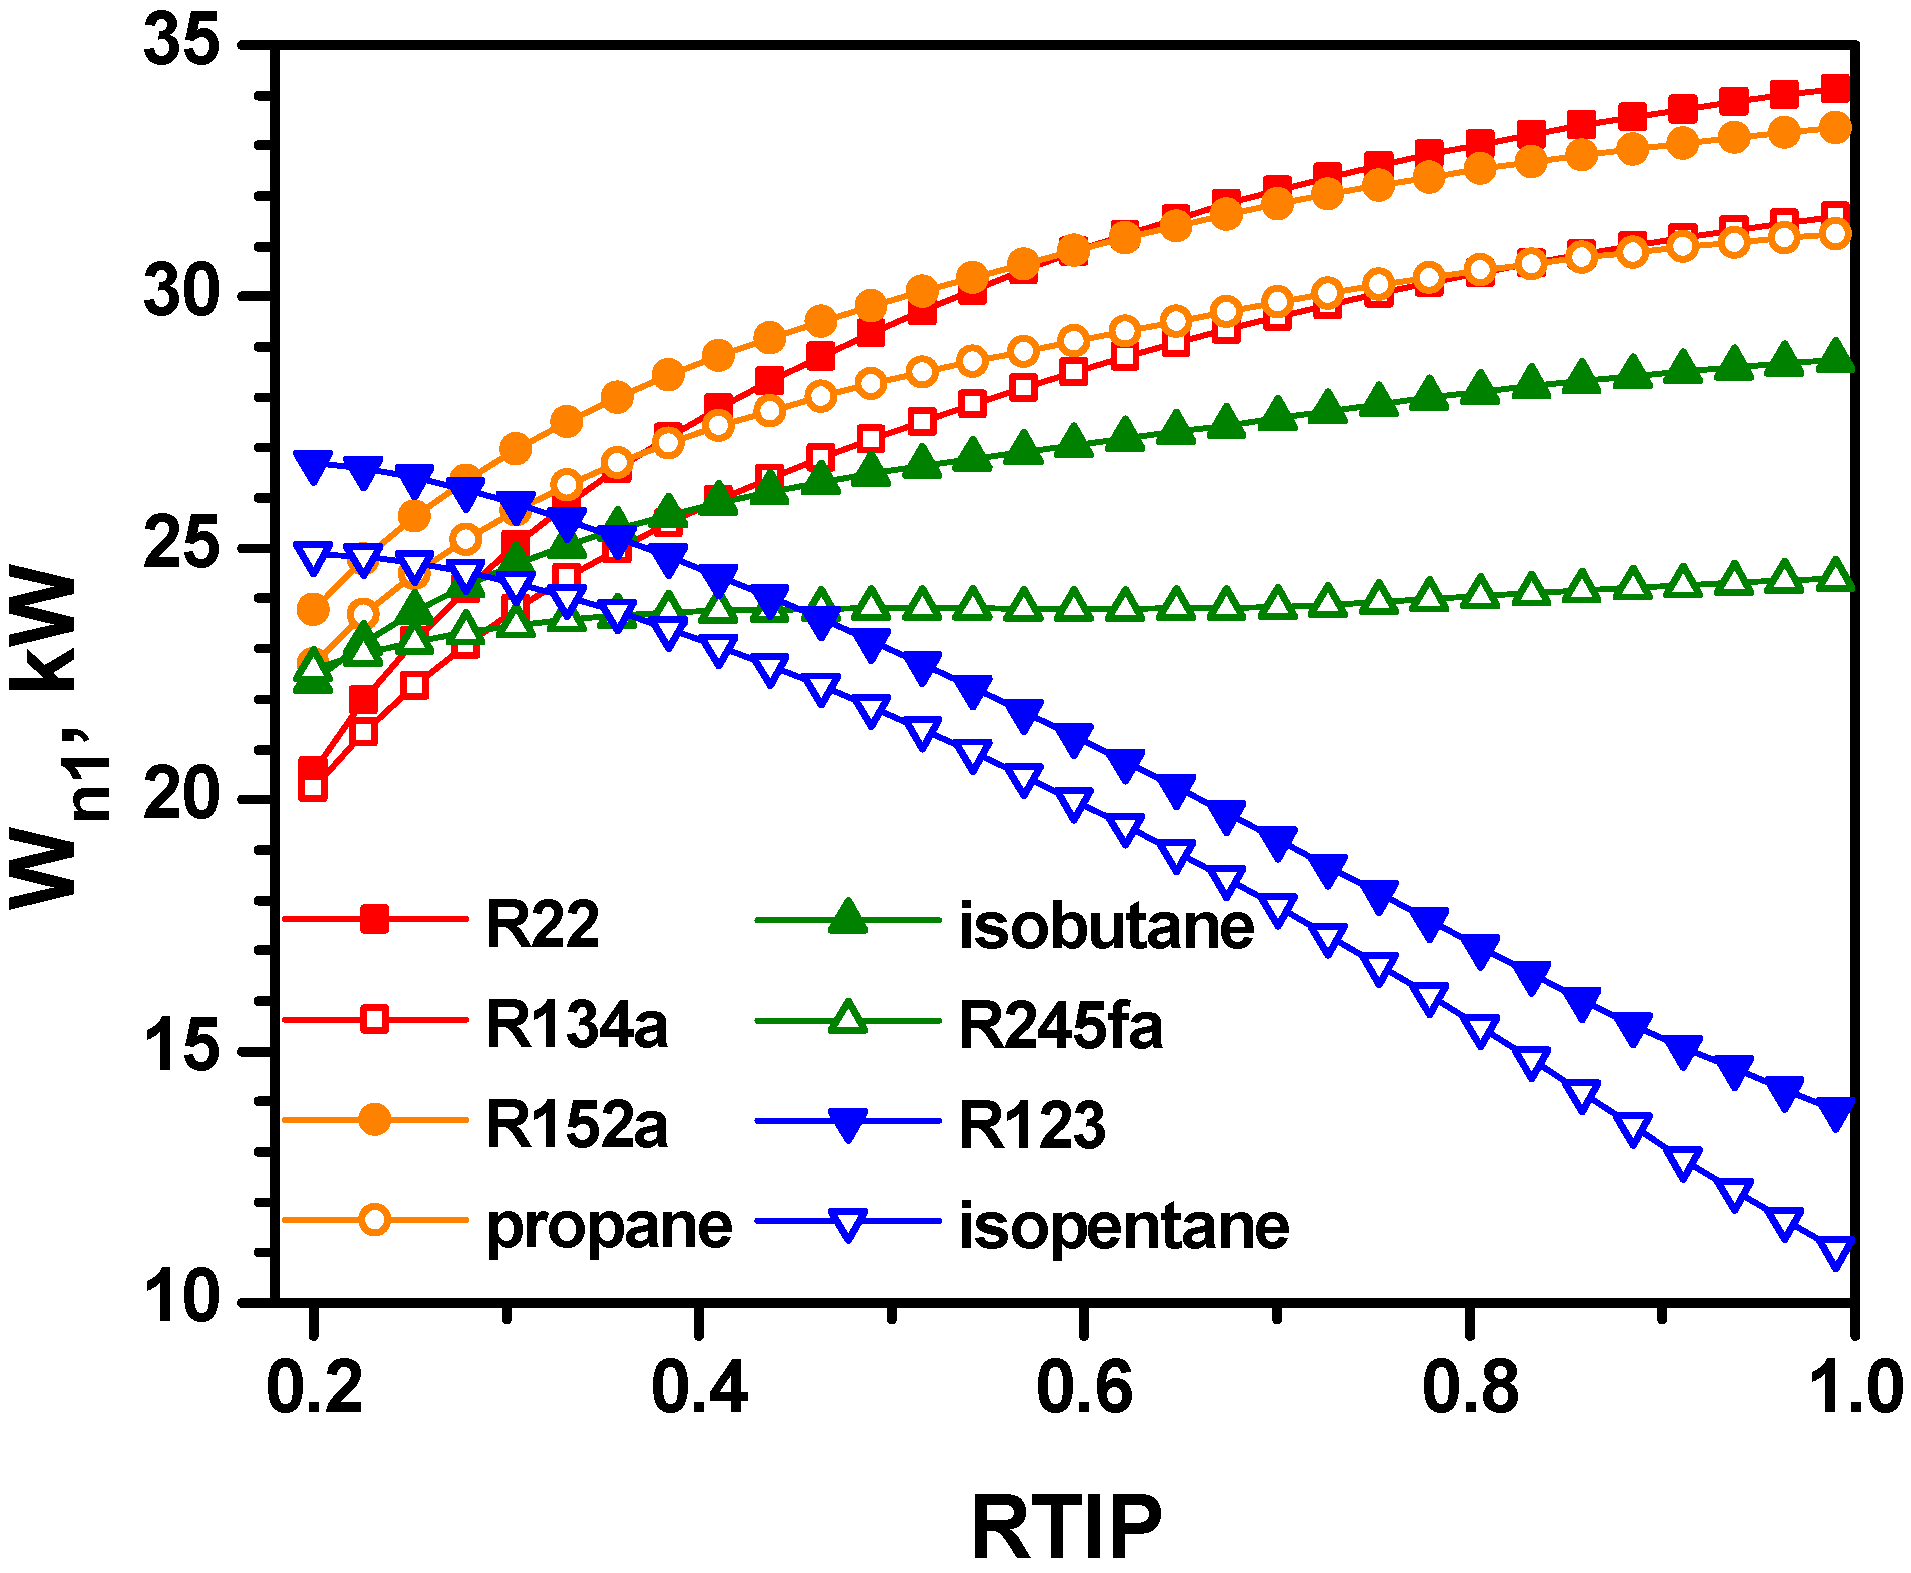
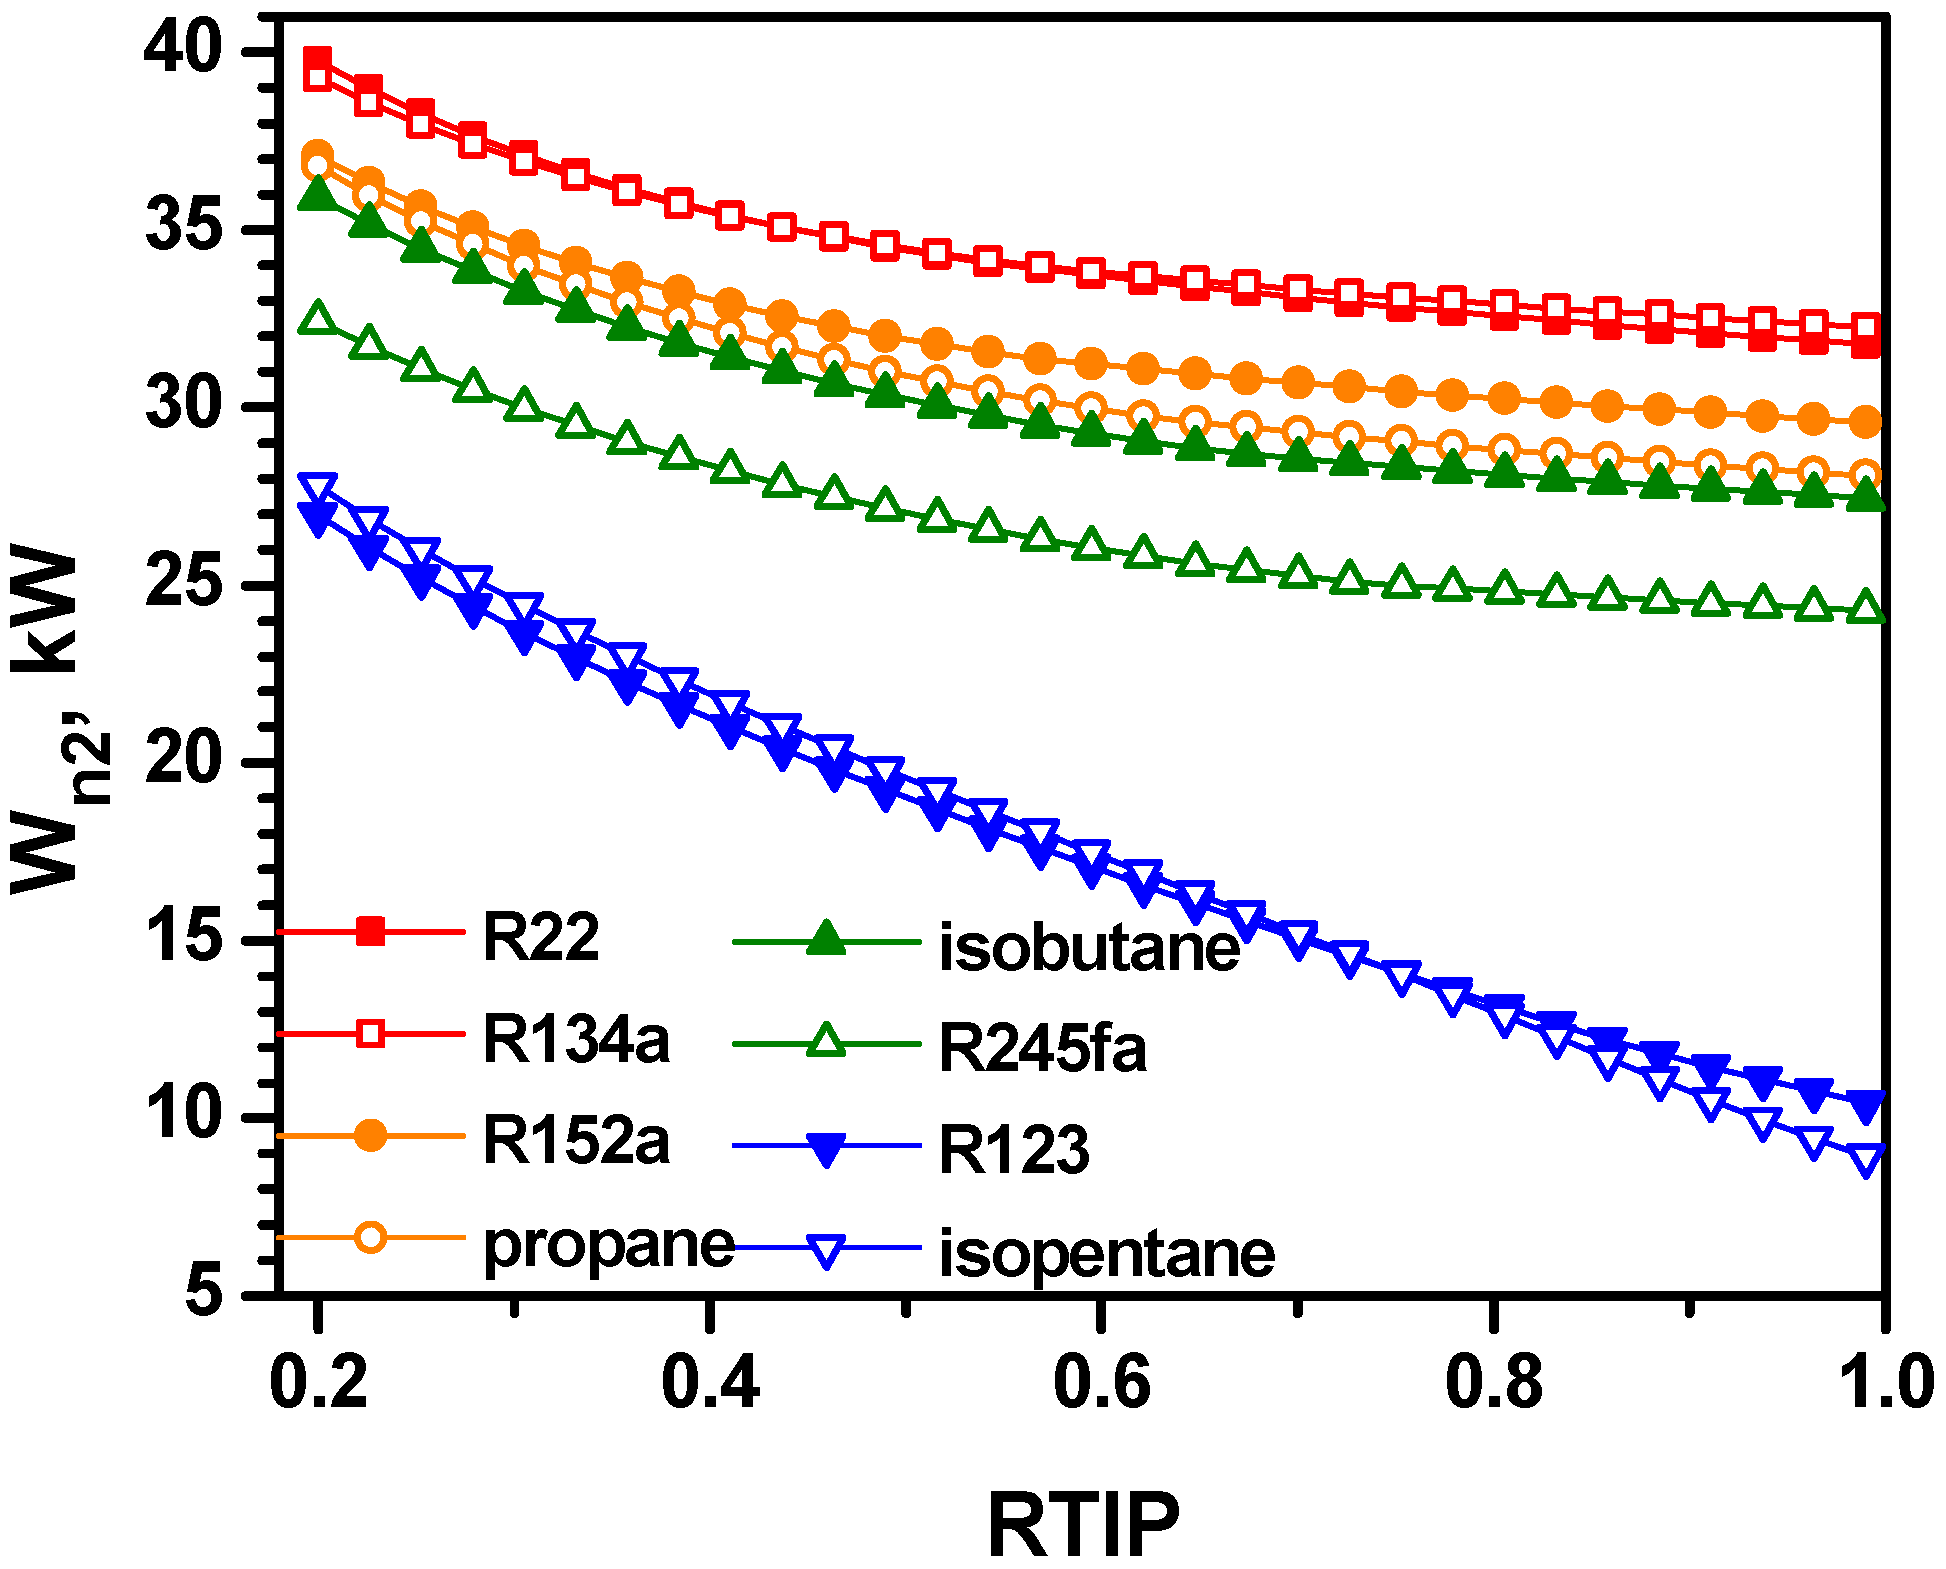
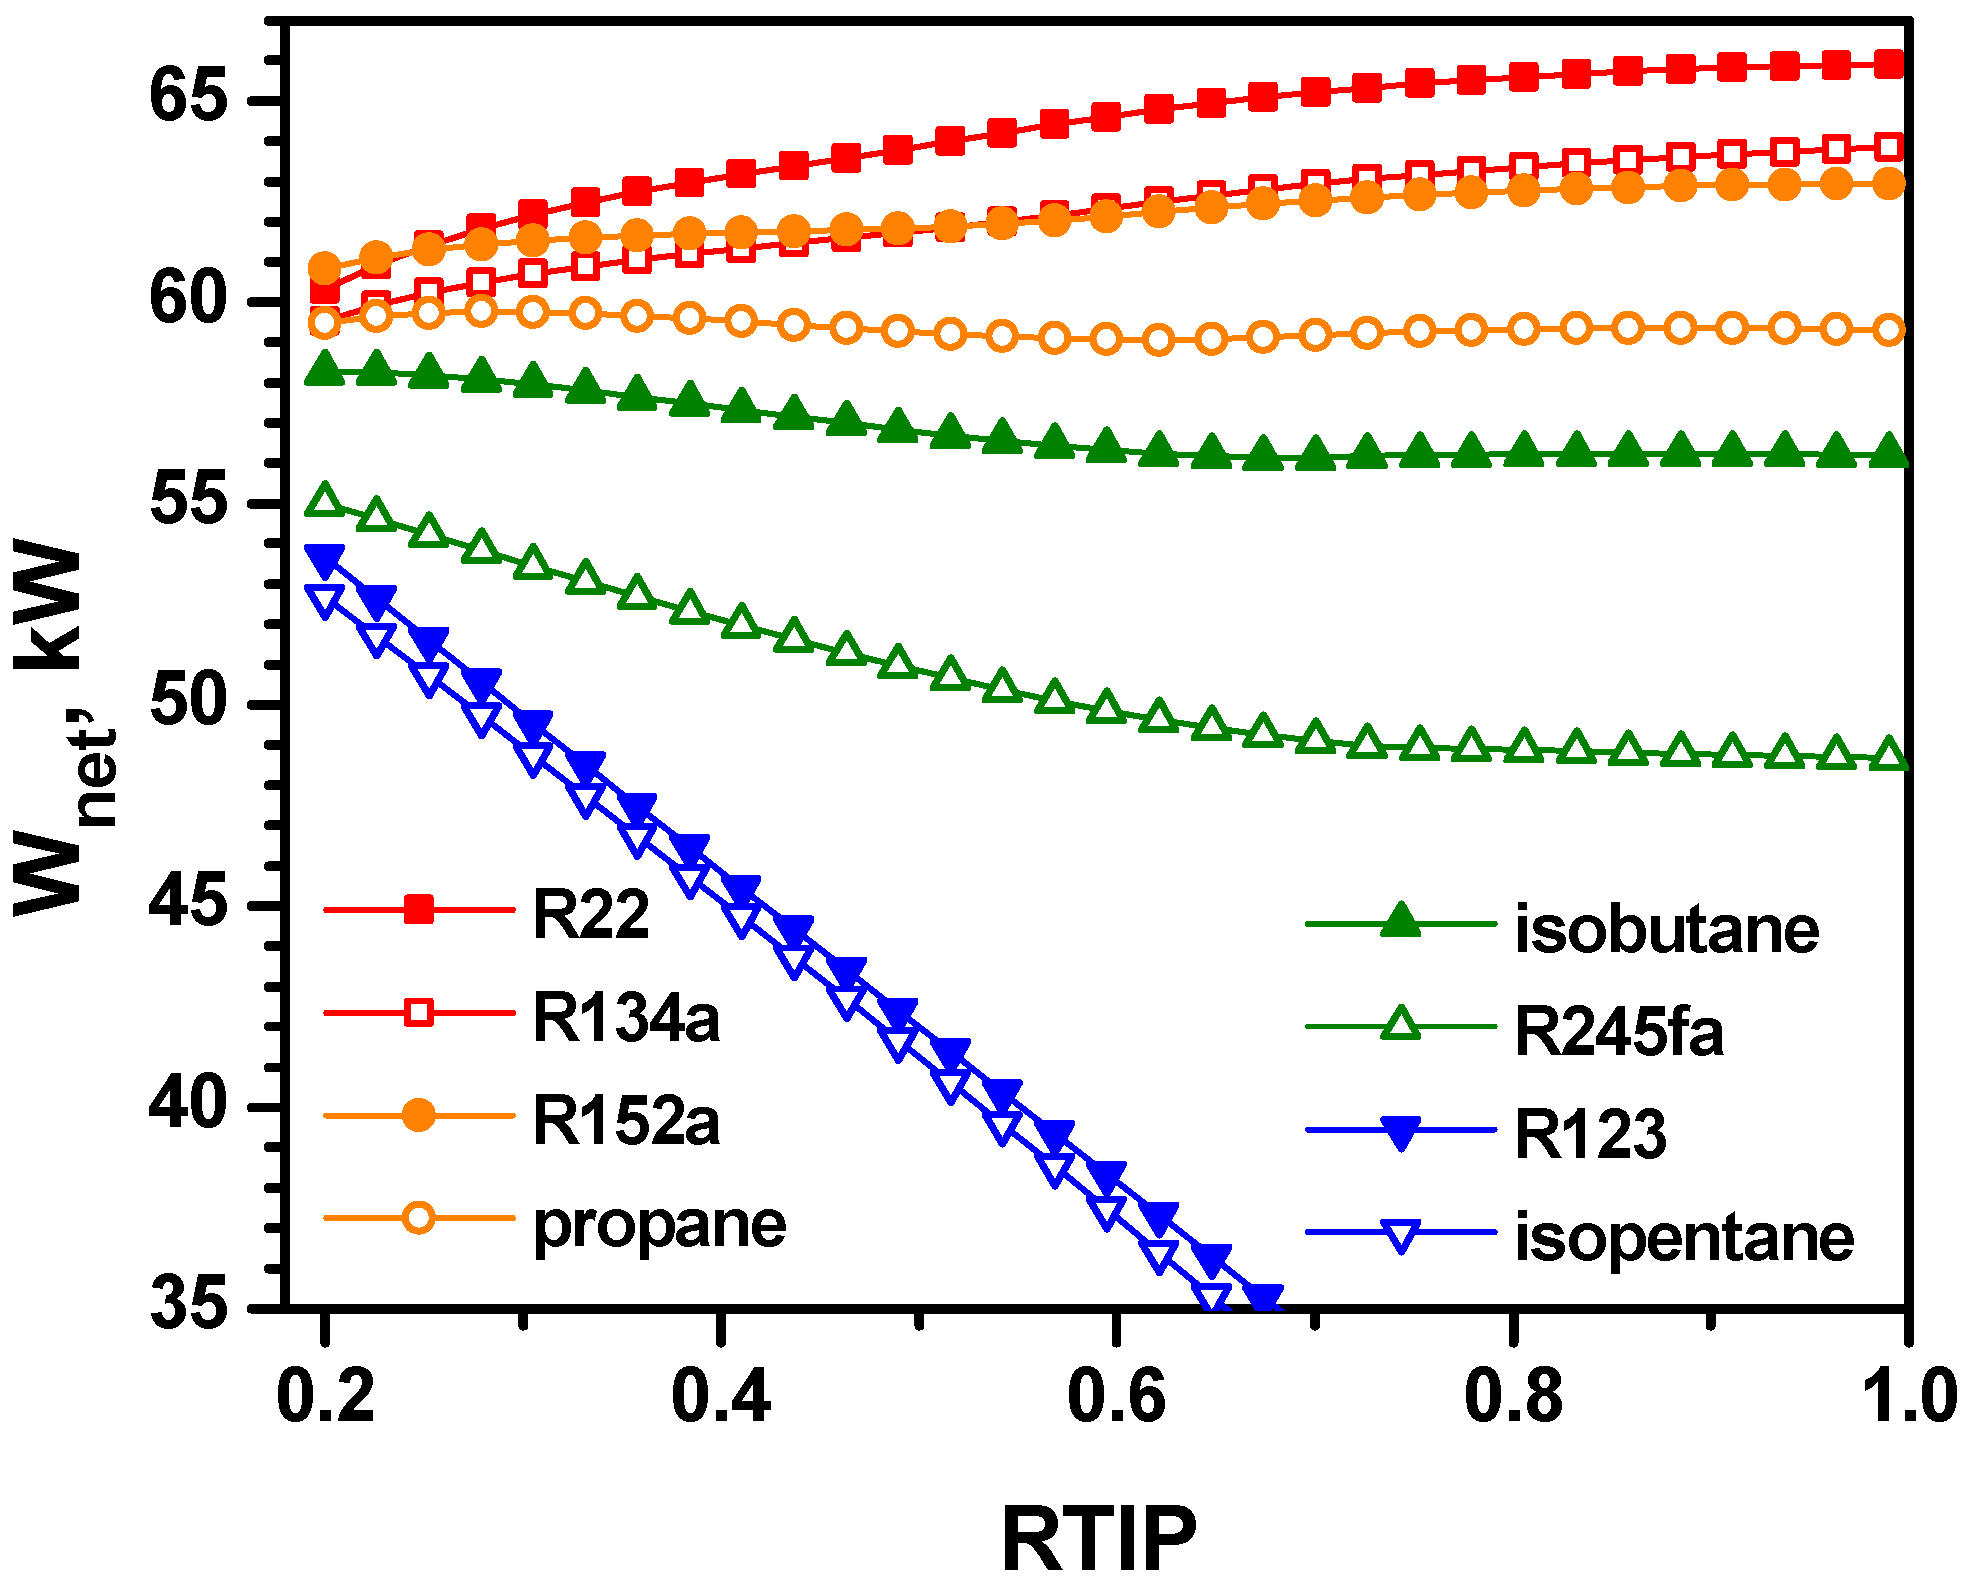
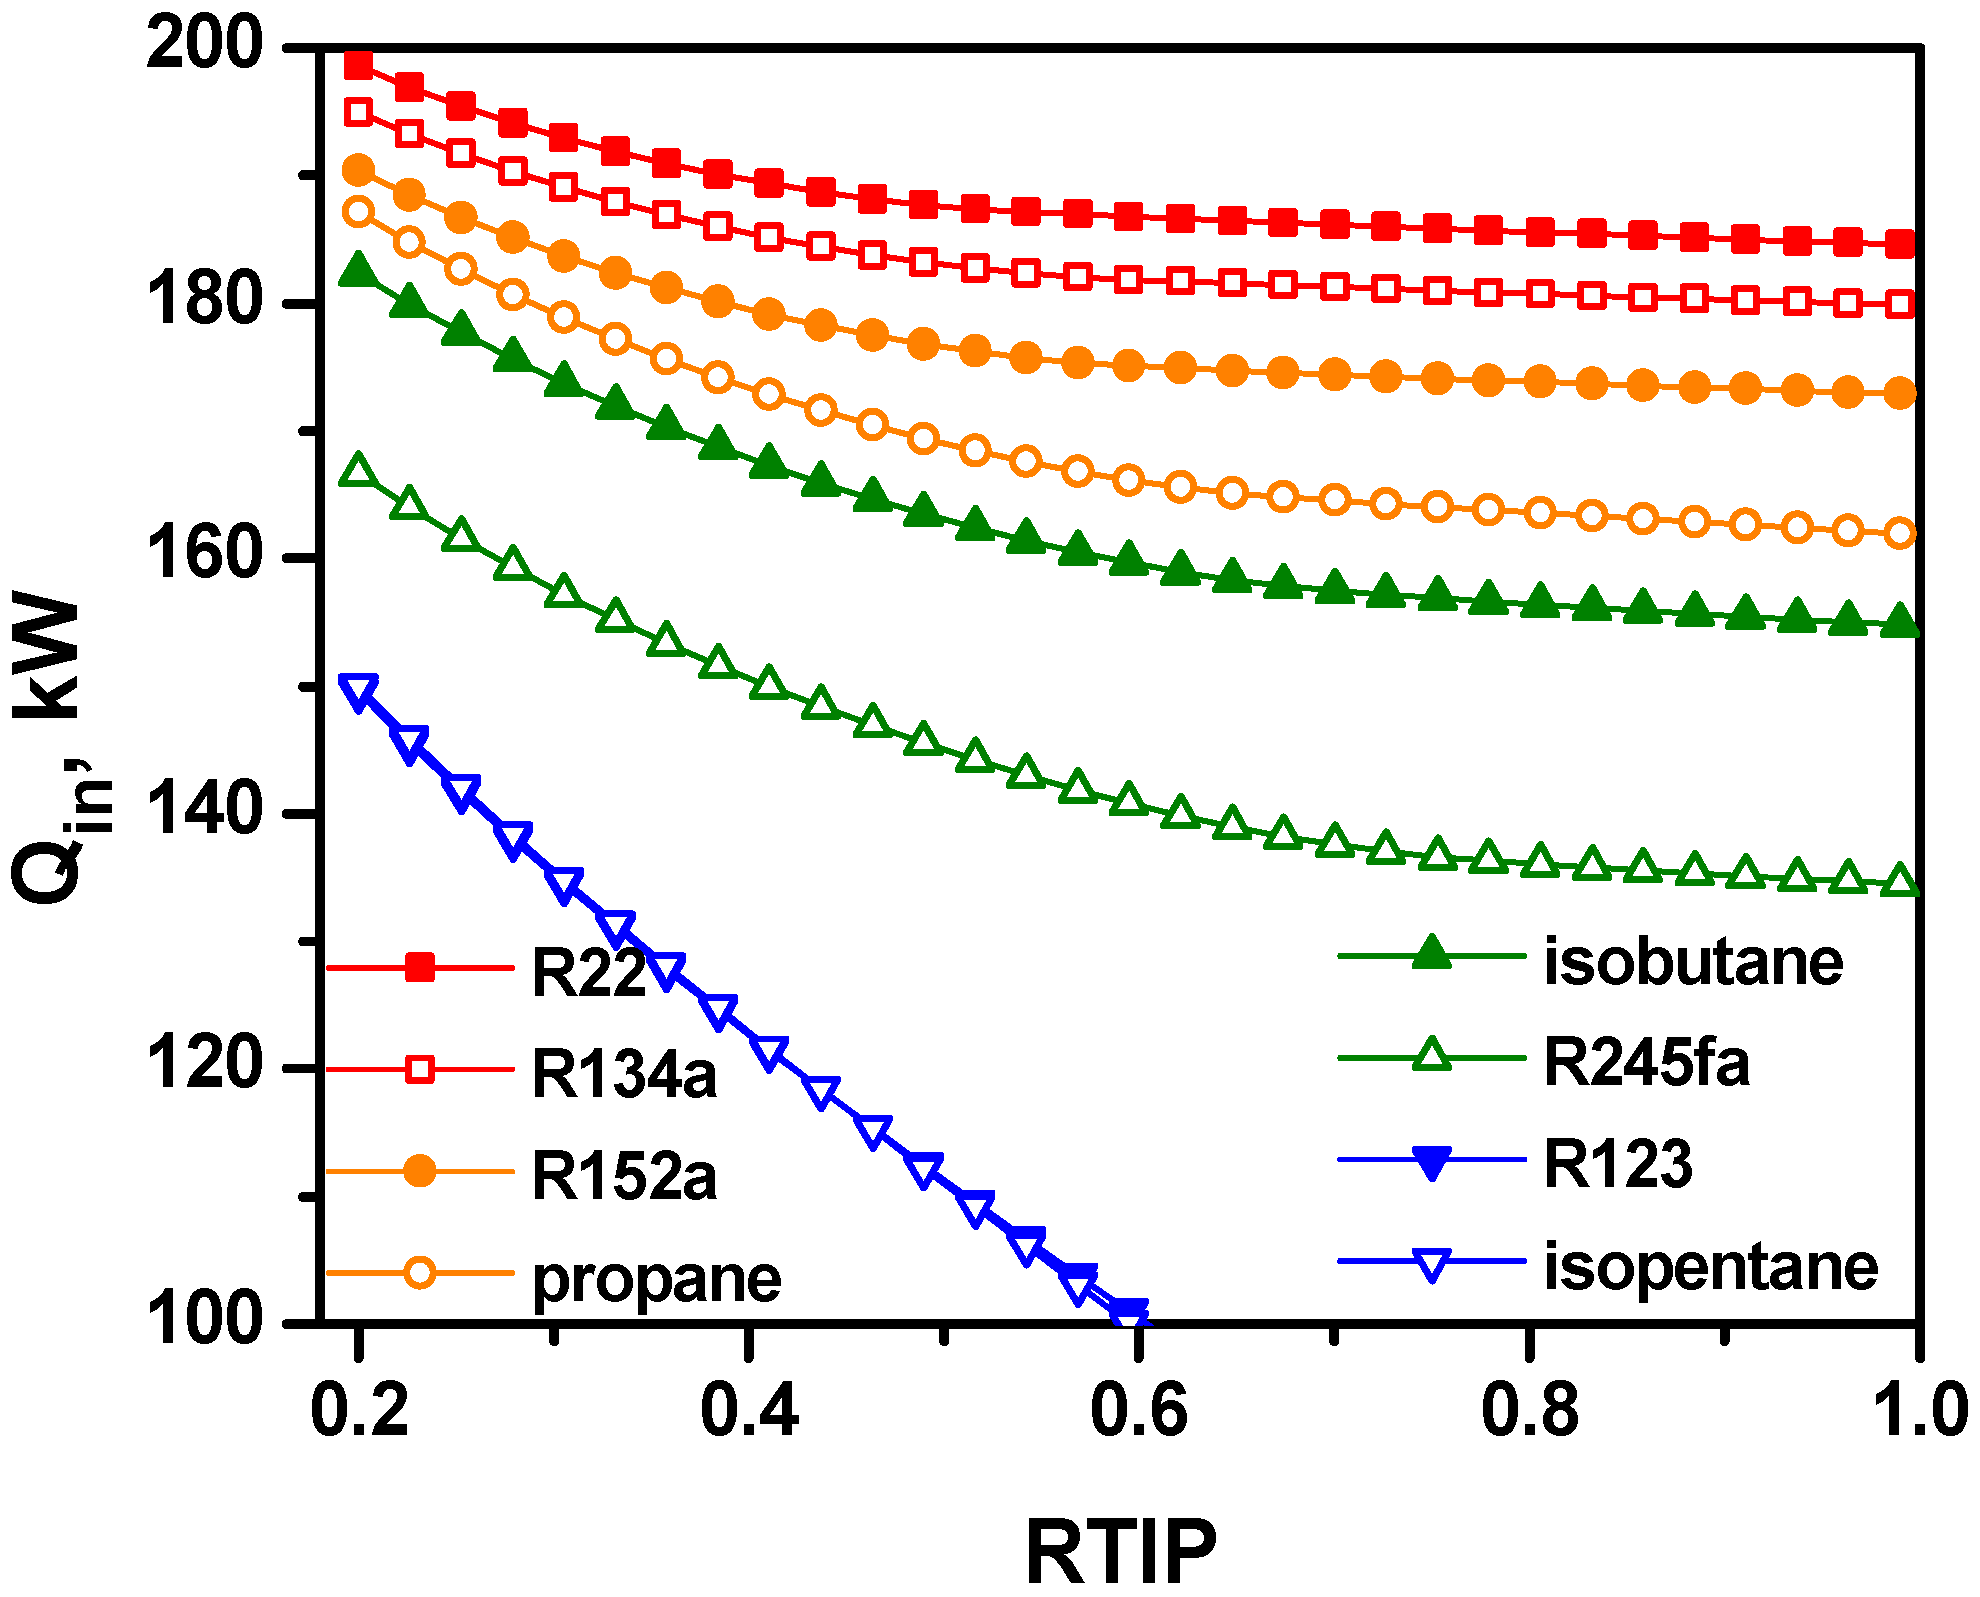
4.1. Energy Analysis
| symbol | description | value | unit |
|---|---|---|---|
| ms | mass flow rate of source fluid | 1 | kg/s |
| Ts | source temperature | 200 | °C |
| TH1 | turbine inlet temperature | 190 | °C |
| Tc | condensation temperature | −20 | °C |
| ΔTpp | pinch temperature difference | 8 | °C |
| PH2 | LNG turbine inlet pressure | 10 | bar |
| PL2 | LNG turbine exit pressure | 1 | atm |
| ηp | isentropic efficiency of pump | 70 | % |
| ηt | isentropic efficiency of turbine | 70 | % |
| No | fluid | x | T (°C) | P (bar) | h (kJ/kg) | s (kJ/kgK) | e (kJ/kg) | m (kg/s) |
|---|---|---|---|---|---|---|---|---|
| 1 | R245fa | 0.000 | 0.0 | 0.536 | 0.0 | 0.000 | 8.1 | 0.3005 |
| 2 | R245fa | −2.161 | 0.9 | 21.840 | 2.1 | 0.002 | 9.5 | 0.3005 |
| 3 | R245fa | 2.167 | 190.0 | 21.840 | 444.6 | 1.187 | 99.0 | 0.3005 |
| 4 | R245fa | 1.875 | 141.1 | 0.536 | 379.6 | 1.255 | 13.5 | 0.3005 |
| 5 | LNG | 0.000 | −161.5 | 1.013 | 0.0 | 0.000 | 1087.8 | 0.0977 |
| 6 | LNG | −0.337 | −161.0 | 10.000 | 3.0 | 0.008 | 1088.4 | 0.0977 |
| 7 | NG | 2.452 | 133.1 | 10.000 | 1170.7 | 6.264 | 390.8 | 0.0977 |
| 8 | NG | 1.750 | 21.1 | 1.013 | 906.1 | 6.687 | 0.1 | 0.0977 |
| 9 | air | 0.000 | 200.0 | 0.000 | 177.8 | 0.469 | 37.9 | 1.0000 |
| 10 | air | 0.000 | 69.1 | 0.000 | 44.8 | 0.140 | 3.0 | 1.0000 |


4.2. Exergy Analysis


| fluid | maximum exergy efficiency, % | RTIP | TIP, bar |
|---|---|---|---|
| R22 | 32.2 | 0.75 | 37.3 |
| R134a | 33.5 | 0.99 | 36.5 |
| R152a | 33.1 | 0.73 | 32.8 |
| propane | 33.6 | 0.78 | 33.1 |
| isobutane | 33.7 | 0.85 | 31.0 |
| R245fa | 33.3 | 0.58 | 21.1 |
| R123 | 33.4 | 0.23 | 8.5 |
| isopentane | 33.4 | 0.25 | 8.5 |


5. Conclusions
Acknowledgments
Author Contributions
Conflicts of Interest
Nomenclature
| cp | isobaric specific heat, kJ/kg∙K |
| D | exergy destruction ratio |
| DEC | direct expansion cycle of LNG |
| dtot | total exergy destruction, kW |
| E | exergy flow, kW |
| e | specific exergy, kJ/kg∙K |
| Ein | exergy input rate, kW |
| h | specific enthalpy, kJ/kg |
| m | mass flow rate, kg/s |
| P | pressure, bar |
| Q | heat transfer rate, kW |
| RTIP | reduced turbine inlet pressure of Turbine 1 |
| s | specific entropy, kJ/kg∙K |
| T | temperature, °C or K |
| Tc | critical temperature, °C |
| Tcd | condensing temperature, °C |
| TH1 | turbine inlet temperature of Turbine 1, °C |
| Ts | source temperature, °C |
| TIP | turbine inlet pressure of Turbine 1, bar |
| Wn1 | net power production of ORC, kW |
| Wn2 | net power production of the LNG cycle, kW |
| Wnet | net power production, kW |
| UAtot | total heat transfer capacity of heat exchangers, kW/ °C |
| ∆Tm | logarithmic temperature difference of a heat exchanger, °C |
| ∆Tpp | pinch temperature difference, °C |
| η | isentropic efficiency |
| ηex | exergetic efficiency |
| ηth | thermal efficiency |
Subscripts
| 0 | reference state for thermodynamic properties |
| 1 | ORC |
| 2 | LNG cycle |
| c | condensation |
| cr | critical point of working fluid |
| LE | LNG exhaust |
| p | pump |
| s | source |
| SE | source exhaust |
| t | turbine |
| w | working fluid |
References
- Wood, D.A. A review and outlook for the global LNG trade. J. Nat. Gas Sci. Eng. 2012, 9, 16–27. [Google Scholar] [CrossRef]
- Roszak, E.A.; Chorowski, M. Exergy analysis of combined simultaneous Liquid Natural Gas vaporization and Adsorbed Natural Gas cooling. Fuel 2013, 111, 755–762. [Google Scholar] [CrossRef]
- Liu, H.; You, L. Characteristics and applications of the cold heat exergy of liquefied natural gas. Energy Convers. Manag. 1999, 40, 1515–1525. [Google Scholar] [CrossRef]
- Kumar, S.; Kwon, H.T.; Choi, K.H.; Lim, W.S.; Cho, J.H.; Tak, K.J.; Moon, I. LNG: An eco-friendly cryogenic fuel for sustainable development. Appl. Energy 2011, 88, 4264–4273. [Google Scholar] [CrossRef]
- Gómez, M.R.; Garcia, R.F.; Gómez, J.R.; Carril, J.C. Review of thermal cycles exploiting the exergy of liquefied natural gas in the regasification process. Renew. Sustain. Energy Rev. 2014, 38, 781–795. [Google Scholar] [CrossRef]
- Kim, K.H.; Ko, H.J.; Kim, K. Assessment of pinch point characteristics in heat exchangers and condensers of ammonia-water based power cycles. Appl. Energy 2014, 113, 970–981. [Google Scholar] [CrossRef]
- Miyazaki, T.; Kang, Y.T.; Akisawa, A.; Kashiwagi, T. A combined power cycle using refuse incineration and LNG cold energy. Energy 2000, 25, 639–655. [Google Scholar] [CrossRef]
- Lu, T.; Wang, K.S. Analysis and optimization of a cascading power cycle with liquefied natural gas (LNG) cold energy recovery. Appl. Therm. Eng. 2009, 29, 1478–1484. [Google Scholar] [CrossRef]
- Shi, X.; Che, D. A combined power cycle utilizing low-temperature waste heat and LNG cold energy. Energy 2009, 50, 567–575. [Google Scholar] [CrossRef]
- Wang, H.; Shi, X.; Che, D. Thermodynamic optimization of the operating parameters for a combined power cycle utilizing low-temperature waste heat and LNG cold energy. Appl. Therm. Eng. 2013, 59, 490–497. [Google Scholar] [CrossRef]
- Wang, J.; Yan, Z.; Wang, M. Thermodynamic analysis and optimization of an ammonia-water power system with LNG (liquefied natural gas) as its heat sink. Energy 2013, 50, 513–522. [Google Scholar] [CrossRef]
- Kim, K.H.; Kim, K.C. Thermodynamic performance analysis of a combined power cycle using low grade heat source and LNG cold energy. Appl. Therm. Eng. 2014, 70, 50–60. [Google Scholar] [CrossRef]
- Kim, K.C.; Ha, J.M.; Kim, K.H. Exergy Analysis of a Combined Power Cycle Using Low Grade Heat Source and LNG Cold Energy. Int. J. Exergy 2015, 17, 374–400. [Google Scholar] [CrossRef]
- Dai, Y.; Wang, J.; Gao, L. Parametric optimization and comparative study of organic Rankine cycle (ORC) for low grade waste heat recovery. Energy Convers. Manag. 2009, 50, 576–582. [Google Scholar] [CrossRef]
- Heberle, F.; Brueggemann, D. Exergy based fluid selection for a geothermal organic Rankine cycle for combined heat and power generation. Appl. Therm. Eng. 2010, 30, 1326–1332. [Google Scholar] [CrossRef]
- Hung, T.C.; Wang, S.K.; Kuo, C.H.; Pei, B.S.; Tsai, K.F. A study of organic working fluids on system efficiency of an ORC using low-grade energy sources. Energy 2010, 35, 1403–1411. [Google Scholar] [CrossRef]
- Uusitalo, A.; Honkatukia, J.; Turunen-Saaresti, T.; Larjola, J. A thermodynamic analysis of waste heat recovery from reciprocating engine power plants by means of Organic Rankine Cycles. Appl. Therm. Eng. 2014, 70, 33–41. [Google Scholar] [CrossRef]
- Kim, K.H.; Perez-Blanco, H. Performance Analysis of a Combined Organic Rankine Cycle and Vapor Compression Cycle for Power and Refrigeration Cogeneration. Appl. Therm. Eng. 2015, in press. [Google Scholar] [CrossRef]
- Tchanche, B.F.; Pétrissans, M.; Papadakis, G. Heat resources and organic Rankine cycle machines. Renew. Sustain. Energy Rev. 2014, 39, 1185–1199. [Google Scholar] [CrossRef]
- Bao, J.; Zhao, L. A review of working fluid and expander selections for organic Rankine cycle. Renew. Sustain. Energy Rev. 2013, 24, 325–342. [Google Scholar] [CrossRef]
- Lecompte, S.; Huisseune, H.; van den Broek, M.; Vanslambrouck, B.; De Paepe, M. Review of organic Rankine cycle (ORC) architectures for waste heat recovery. Renew. Sustain. Energy Rev. 2015, 47, 448–461. [Google Scholar] [CrossRef]
- Szargut, J.; Szczygiel, I. Utilization of the cryogenic exergy of liquid natural gas (LNG) for the production of electricity. Energy 2009, 34, 827–837. [Google Scholar] [CrossRef]
- Choi, I.H.; Lee, S.I.; Seo, Y.T. Analysis and optimization of cascade Rankine cycle for liquefied natural gas cold energy recovery. Energy 2013, 61, 179–195. [Google Scholar] [CrossRef]
- Rao, W.J.; Zhao, L.J.; Liu, C.; Zhang, M.G. A combined cycle utilizing LNG and low-temperature solar energy. Appl. Therm. Eng. 2013, 60, 51–60. [Google Scholar] [CrossRef]
- Kamalinejad, M.; Amidpour, M.; Naeynian, S.M.M. Thermodynamic design of a cascade refrigeration system of liquefied natural gas by applying mixed integer non-linear programming. Chinese J. Chem. Eng. 2015, 23, 998–1008. [Google Scholar] [CrossRef]
- Soffiato, M.; Frangopoulos, C. A.; Manente, G.; Rech, S.; Lazzaretto, A. Design optimization of ORC systems for waste heat recovery on board a LNG carrier. Energy Convrs. Manag. 2015, 92, 523–534. [Google Scholar] [CrossRef]
- Xue, X.; Guo, C.; Du, X.; Yang, L.; Yang, Y. Thermodynamic analysis and optimization of a two-stage organic Rankine cycle for liquefied natural gas cryogenic exergy recovery. Energy 2015, 83, 778–787. [Google Scholar] [CrossRef]
- Sun, H.; Zhu, H.; Liu, F.; Ding, H. Simulation and optimization of a novel Rankine power cycle for recovering cold energy from liquefied natural gas using a mixed working fluid. Energy 2014, 70, 317–324. [Google Scholar] [CrossRef]
- Lee, U.; Kim, K.; Han, C. Design and optimization of multi-component organic rankine cycle using liquefied natural gas cryogenic exergy. Energy 2014, 77, 520–532. [Google Scholar] [CrossRef]
- Kim, K.; Lee, U.; Kim, C.; Han, C. Design and optimization of cascade organic Rankine cycle for recovering cryogenic energy from liquefied natural gas using binary working fluid. Energy 2015, 88, 304–313. [Google Scholar] [CrossRef]
- Bejan, A. Advanced Engineering Thermodynamics, 3rd ed.; John Wiley & Sons: New York, NY, USA, 2006. [Google Scholar]
- Safarian, S; Aramoun, F. Energy and exergy assessments of modified Organic Rankine Cycles (ORCs). Energy Rep. 2015, 1, 1–7. [Google Scholar]
- Khaljani, M.; Saray, R.K.; Bahlouli, K. Comprehensive analysis of energy, exergy and exergo-economic of cogeneration of heat and power in a combined gas turbine and organic Rankine cycle. Energy Convers. Manag. 2015, 97, 154–7165. [Google Scholar] [CrossRef]
- Yang, T.; Chen, G.J.; Guo, T.M. Extension of the Wong-Sandler mixing rule to the three-parameter Patel-Teja equation of state: Application up to the near-critical region. Chem. Eng. J. 1997, 67, 27–36. [Google Scholar] [CrossRef]
- Gao, J.; Li, L.D.; Zhu, Z.Y.; Ru, S.G. Vapor-liquid equilibria calculation for asymmetric systems using Patel-Teja equation of state with a new mixing rule. Fluid Phase Equilibria 2004, 224, 213–219. [Google Scholar] [CrossRef]
- Yaws, C.L. Chemical Properties Handbook; McGraw-Hill: New York, NY, USA, 1999. [Google Scholar]
© 2015 by the authors; licensee MDPI, Basel, Switzerland. This article is an open access article distributed under the terms and conditions of the Creative Commons Attribution license (http://creativecommons.org/licenses/by/4.0/).
Share and Cite
Lee, H.Y.; Kim, K.H. Energy and Exergy Analyses of a Combined Power Cycle Using the Organic Rankine Cycle and the Cold Energy of Liquefied Natural Gas. Entropy 2015, 17, 6412-6432. https://0-doi-org.brum.beds.ac.uk/10.3390/e17096412
Lee HY, Kim KH. Energy and Exergy Analyses of a Combined Power Cycle Using the Organic Rankine Cycle and the Cold Energy of Liquefied Natural Gas. Entropy. 2015; 17(9):6412-6432. https://0-doi-org.brum.beds.ac.uk/10.3390/e17096412
Chicago/Turabian StyleLee, Ho Yong, and Kyoung Hoon Kim. 2015. "Energy and Exergy Analyses of a Combined Power Cycle Using the Organic Rankine Cycle and the Cold Energy of Liquefied Natural Gas" Entropy 17, no. 9: 6412-6432. https://0-doi-org.brum.beds.ac.uk/10.3390/e17096412