Article

Three-Dimensional Lattice Boltzmann Simulation of Liquid Water Transport in Porous Layer of PEMFC

1
School of Aeronautics and Astronautics, Zhejiang University, Hangzhou 310027, China
2
Department of Building and Real Estate, Hong Kong Polytechnic University, Hung Hom 999077, Hong Kong, China
*
Author to whom correspondence should be addressed.
Submission received: 23 September 2015 / Revised: 30 November 2015 / Accepted: 28 December 2015 / Published: 31 December 2015
(This article belongs to the Special Issue Non-Linear Lattice)

Abstract

:
A three-dimensional two-phase lattice Boltzmann model (LBM) is implemented and validated for qualitative study of the fundamental phenomena of liquid water transport in the porous layer of a proton exchange membrane fuel cell (PEMFC). In the present study, the three-dimensional microstructures of a porous layer are numerically reconstructed by a random generation method. The LBM simulations focus on the effects of the porous layer porosity and boundary liquid saturation on liquid water transport in porous materials. Numerical results confirm that liquid water transport is strongly affected by the microstructures in a porous layer, and the transport process prefers the large pores as its main pathway. The preferential transport phenomenon is more profound with a decreased porous layer porosity and/or boundary liquid saturation. In the transport process, the breakup of a liquid water stream can occur under certain conditions, leading to the formation of liquid droplets inside the porous layer. This phenomenon is related to the connecting bridge or neck resistance dictated by the surface tension, and happens more frequently with a smaller porous layer porosity. Results indicate that an optimized design of porous layer porosity and the combination of various pore sizes may improve both the liquid water removal and gaseous reactant transport in the porous layer of a PEMFC.

1. Introduction

The proton exchange membrane fuel cell (PEMFC) is considered one of the most promising energy conversion devices for future transportation applications, due to its high energy efficiency, high power density, and environment-friendly operations. Figure 1a shows a schematic of a single piece of a PEMFC, which is mainly composed of a polymer electrolyte membrane (PEM), bipolar plates with the built-in gas channels, gas diffusion layers (GDLs), and catalyst layers (CLs). The GDLs and CLs are heterogeneous porous media, in which the chemical species diffusion, electrochemical reactions, and migration of protons and electrons occur, as shown in Figure 1b,c. During PEMFC operations, water is produced by the electrochemical reactions in the cathode catalyst layer (CCL). Water is needed to fully hydrate the polymer membrane to increase its proton conductivity and thus improve the PEMFC performance, but excessive water, particularly liquid water in the porous materials (GDLs and CLs), can block hydrogen/oxygen transport to the reaction sites and consequently decrease the cell performance. Therefore, water management in a PEMFC, particularly the liquid water transport and distribution in the porous materials, play a key role in fuel cell operations [1,2].
Figure 1. (a) Schematic of a single piece of a PEMFC; (b) Schematic of the microstructure and mass transport phenomena in porous layers; (c) Schematic of transport and reaction mechanism in CL.
Entropy 18 00017 g001
Over the past decades, many experimental and numerical studies have been conducted to investigate the complex transport phenomena in the porous media of PEMFCs [3,4,5,6,7,8,9,10,11,12,13,14]. These studies, however, focused mainly on the macro-scale transport processes. To obtain a deeper understanding of the underlying transport mechanisms in the porous materials of a PEMFC, fundamental studies have also been conducted to reveal the microstructures of the porous materials and further examine their effects on the transport processes. Hizir et al. [15] used the optical profilometry and SEM to scan the surface morphology of the CL of a PEMFC. Their studies indicated that there are surface cracks in the CL, which could significantly affect the multi-phase liquid water transport behaviors. Based on images from SEM, Thiele et al. [16] reconstructed a three-dimensional geometry of the cathode catalyst layer (CCL) of a PEMFC. The pore size distribution in the CCL was revealed in detail. Due to the great complexity of the microstructures in PEMFCs, it is difficult to directly observe liquid water transport inside the porous materials using the present experimental techniques. Therefore, the micro- and meso-scale numerical modeling and simulation approaches are widely used as effective tools to study the detailed transport processes in the porous media. For example, Wang et al. [17] and Mukherjee et al. [18] developed a direct numerical simulation method to study the pore-scale species transport in the cathode catalyst layer of a PEMEC. The CCL was reconstructed using a stochastic technique.
Although good progress has been made in studying transport phenomena at the micro scale, it is still a challenging issue in fully understanding the liquid water transport mechanisms inside the porous materials of a PEMFC. Recently, the lattice Boltzmann method (LBM), which is well established for simulating multi-phase and multi-component fluid flows [19,20,21,22,23,24,25,26], has been applied to study liquid water transport in PEMFCs. In LBM, the density distribution functions are directly solved by implementing the collision and streaming procedures at discrete lattices, and thus this method can handle the gas−liquid and solid−liquid interactions automatically and accurately. Sinha et al. [27] performed a two-phase LBM simulation to study the effects of wetting property on the liquid water dynamic behaviors in a reconstructed carbon-paper GDL. Park et al. [28] conducted an LBM simulation of the liquid droplet transport through a GDL made of woven carbon cloth. Hao et al. [29,30] used a free-energy LBM to study the dynamic behaviors of liquid droplets in the gas channel and analyzed the effects of the micro-scale porous structure on the relative permeability of a porous material. Mukherjee et al. [31] conducted LBM simulation to examine the two-phase transport process and liquid water flooding phenomena in the porous media of a PEMFC. Han et al. [32,33,34] conducted two-dimensional two-phase LBM simulations to analyze the formation, growth, and interaction of liquid droplets inside the GDL and gas channel. Effects of several important parameters, including the gas flow velocity, surface contact angle, and gas channel shape, on the liquid water transport characteristics were investigated. These early studies prove that LBM simulations are suitable for numerical study of the micro-scale two-phase transport in the complex porous media of a PEMFC.
In this paper, a three-dimensional two-phase lattice Boltzmann method is employed to simulate the liquid water transport dynamics in the porous layer of a PEMFC. A random method is employed to numerically reconstruct the micro-scale structures of a porous medium. The numerical model is validated with two test cases concerning the gas−liquid phase separation and liquid–solid surface interaction. The numerical studies focus on the effects of the porous layer porosity and boundary liquid saturation on liquid water transport behaviors. Results obtained herein can help to improve fundamental understanding of the liquid water transport processes in porous materials of PEMFCs.

2. Lattice Boltzmann Model and Its Validation

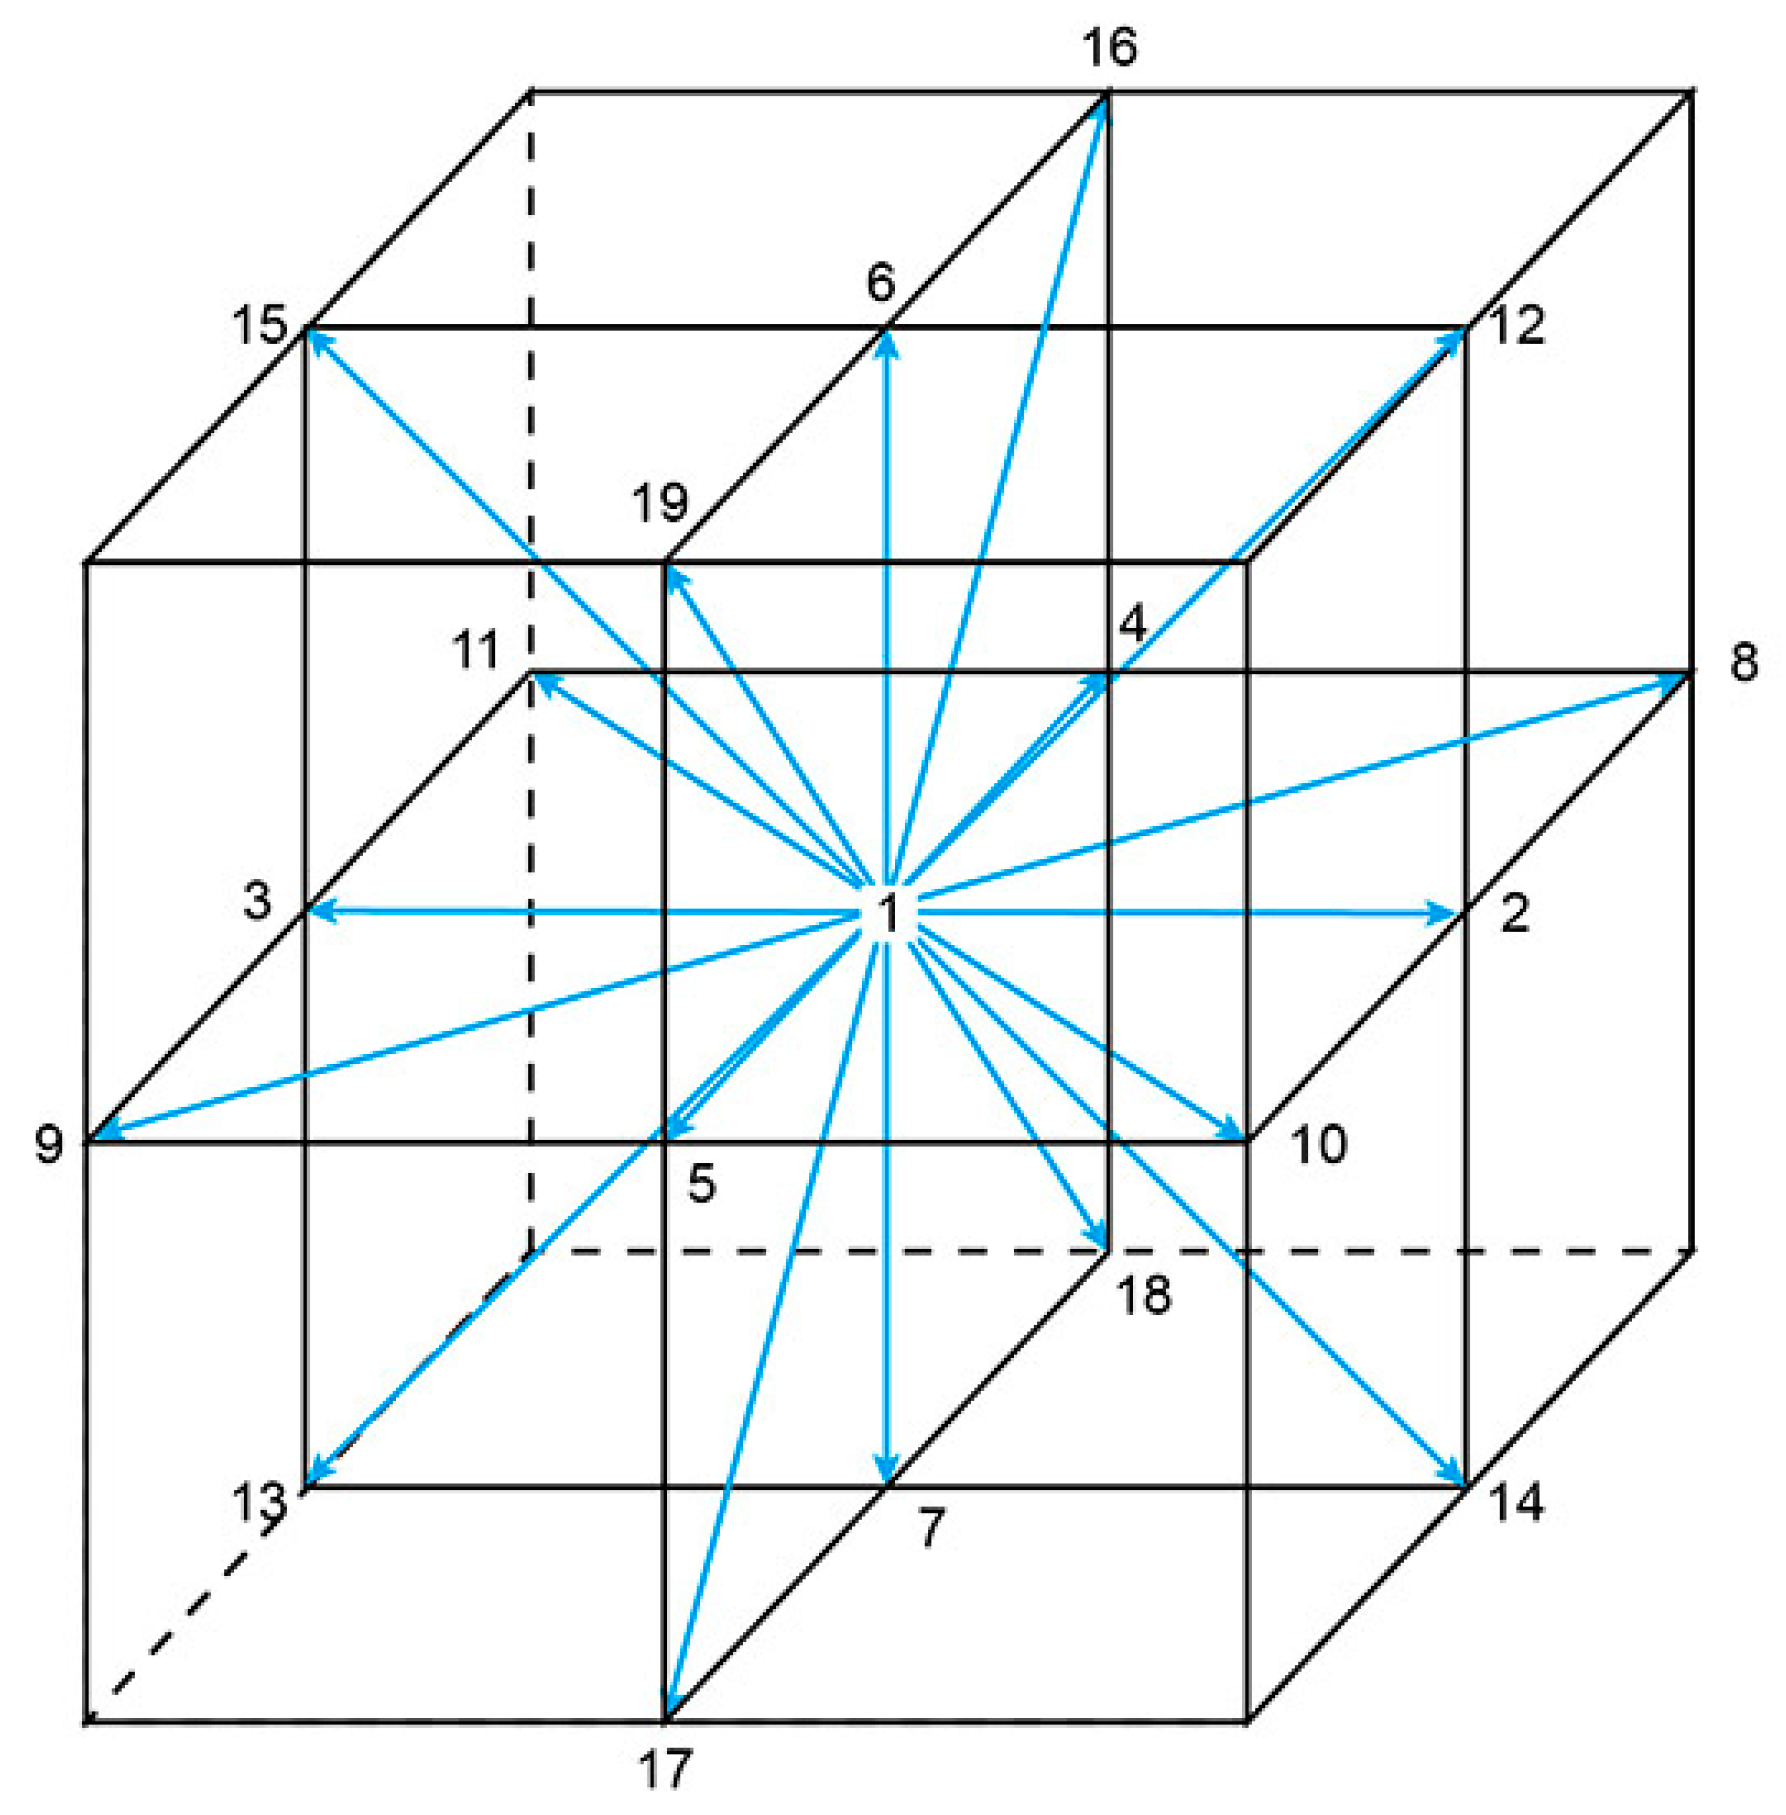
2.1. Lattice Boltzmann Model

The present three-dimensional two-phase LBM simulation is based on the single relaxation time Bhatnagar–Gross–Krook (BGK) evolution equation and Shan–Chan model [22,23]. The Boltzmann–BGK equation, which is an approximation of the continuum Boltzmann equation, is discretized in time, space, and velocity domains to obtain a full discrete LBM equation:
f α ( x + e α Δ t ,   t + Δ t ) f α ( x ,   t ) = 1 τ ( f α e q ( x ,   t ) f α ( x ,   t ) ) ,
where f is the density distribution function, x is the space position vector, e α is the lattice velocity vector at the α th direction, t is the time, and τ is the relaxation time that can be determined using the fluid kinematic viscosity. Generally, there are two important steps in numerical solution of the LBM equation, streaming and collision, which need to be implemented separately in the numerical treatment. In the streaming step, the distribution function representing discrete particles is moved into the neighboring lattices in a fixed velocity scheme. In the collision step, the density distribution function is relaxed toward its equilibrium state at a given relaxation time. In the present simulation, the equilibrium distribution function is defined as:
f α e q ( x ,   t ) = ω α ρ [ 1 + e α · u e q c s 2 + ( e α · u e q ) 2 2 c s 4 ( u e q ) 2 2 c s 2 ] ,
where ω α is the weighting factor, ρ is the macroscopic fluid density, u e q is the macroscopic equilibrium velocity, and c s is the lattice sound velocity. In order to determine these parameters, the D3Q19 scheme that includes 19 discrete velocities in three space dimensions is used, as shown in Figure 2.
Figure 2. D3Q19 scheme for three-dimensional lattice Boltzmann simulations.
Entropy 18 00017 g002
The relevant parameters in Equation (2) are defined in detail in the following:
  • The weighting factor:
    ω α = { 1 / 3 ,     α = 1 1 / 18 , α = 2 , 3 , 4 , 5 , 6 , 7 1 / 36 ,     α = 8 , 9 , 10 , 11 , 12 , 13 , 14 , 15 , 16 , 17 , 18 , 19 .
  • The macroscopic fluid density:
    ρ = α = 1 19 f α   .
  • The lattice velocity vector:
    e = c [ 0 1 1 0 0 0 0 0 0         0 0 0 1 1 0 0 0 1         0 1 1 0 1 1 1 0 0         1 1 1 1 1 0 0 0 1         1 1 1 0 0 0 1 1 1         0 0 0 1 1 1 1 1 1       0 1 1 ] ,
where c is defined as the ratio of the space distance between lattice nodes to the time step.
In the Shan–Chen two-phase model, extra forces are included in the equilibrium state distribution function to handle the fluid−fluid and fluid−solid interactions. The forces are calculated as:
F = F i n t ( x , t ) + F a d s ( x , t ) + F g ( x ) ,
In Equation (6), the term F g ( x ) is the gravity force or uniform steady body force, and F i n t ( x , t ) is the inter-particle cohesive force that is introduced to account for the interaction between fluid particles. The adsorption force F a d s ( x , t ) , which is used to account for the fluid−solid interaction, is expressed as:
F a d s ( x , t ) = G ψ ( ρ ( x , t ) ) α ω α ψ ( ρ w ) s ( x + e α Δ t , t ) e α
where G is a constant representing the interaction strength between neighboring particles, Ψ is a density-dependent potential function, and ρ w is a free parameter that can be tuned to obtain different contact angles.
The forces in Equation (6) are implemented into LBM by changing the equilibrium velocity in Equation (2). Therefore, the new equilibrium distribution function for the present two-phase simulation is expressed as:
f α e q ( x ,   t ) = ω α ρ [ 1 + e α · ( u + τ F ρ ) c s 2 + ( e α · ( u + τ F ρ ) ) 2 2 c s 4 ( u + τ F ρ ) 2 2 c s 2 ] ,
where u is the microscopic velocity, which can be calculated as:
u = 1 ρ α = 1 19 f α e α .
More details concerning the two-phase lattice Boltzmann model can be found in the previous publications [22,23,32].

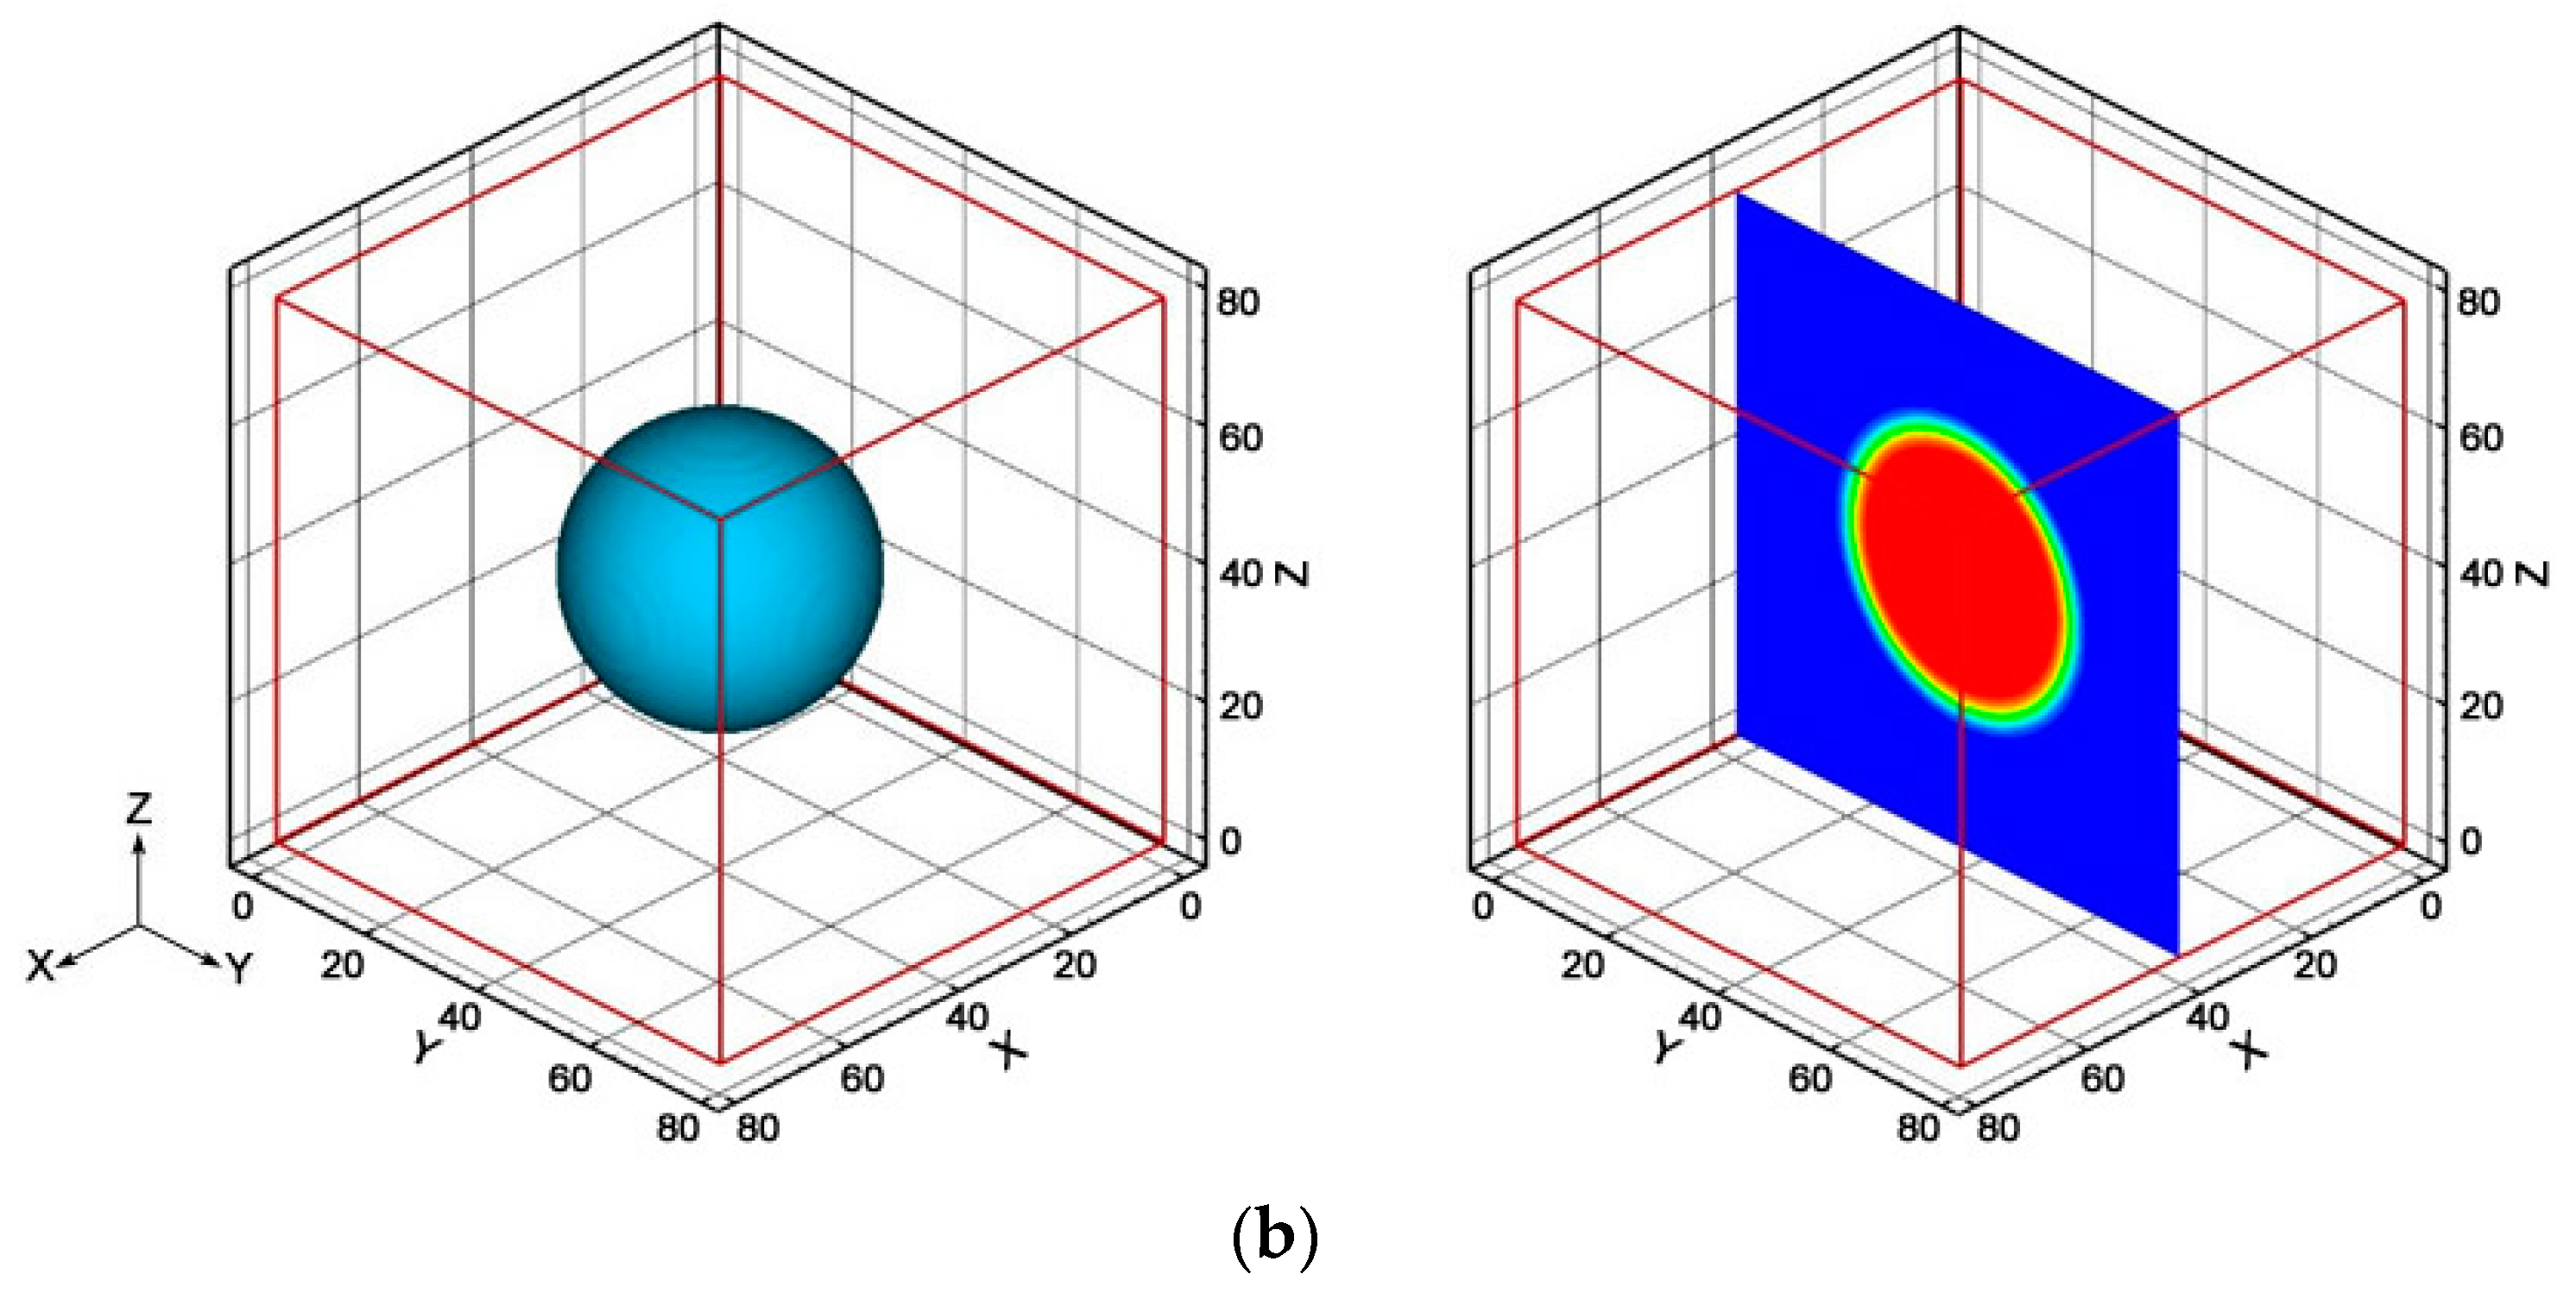
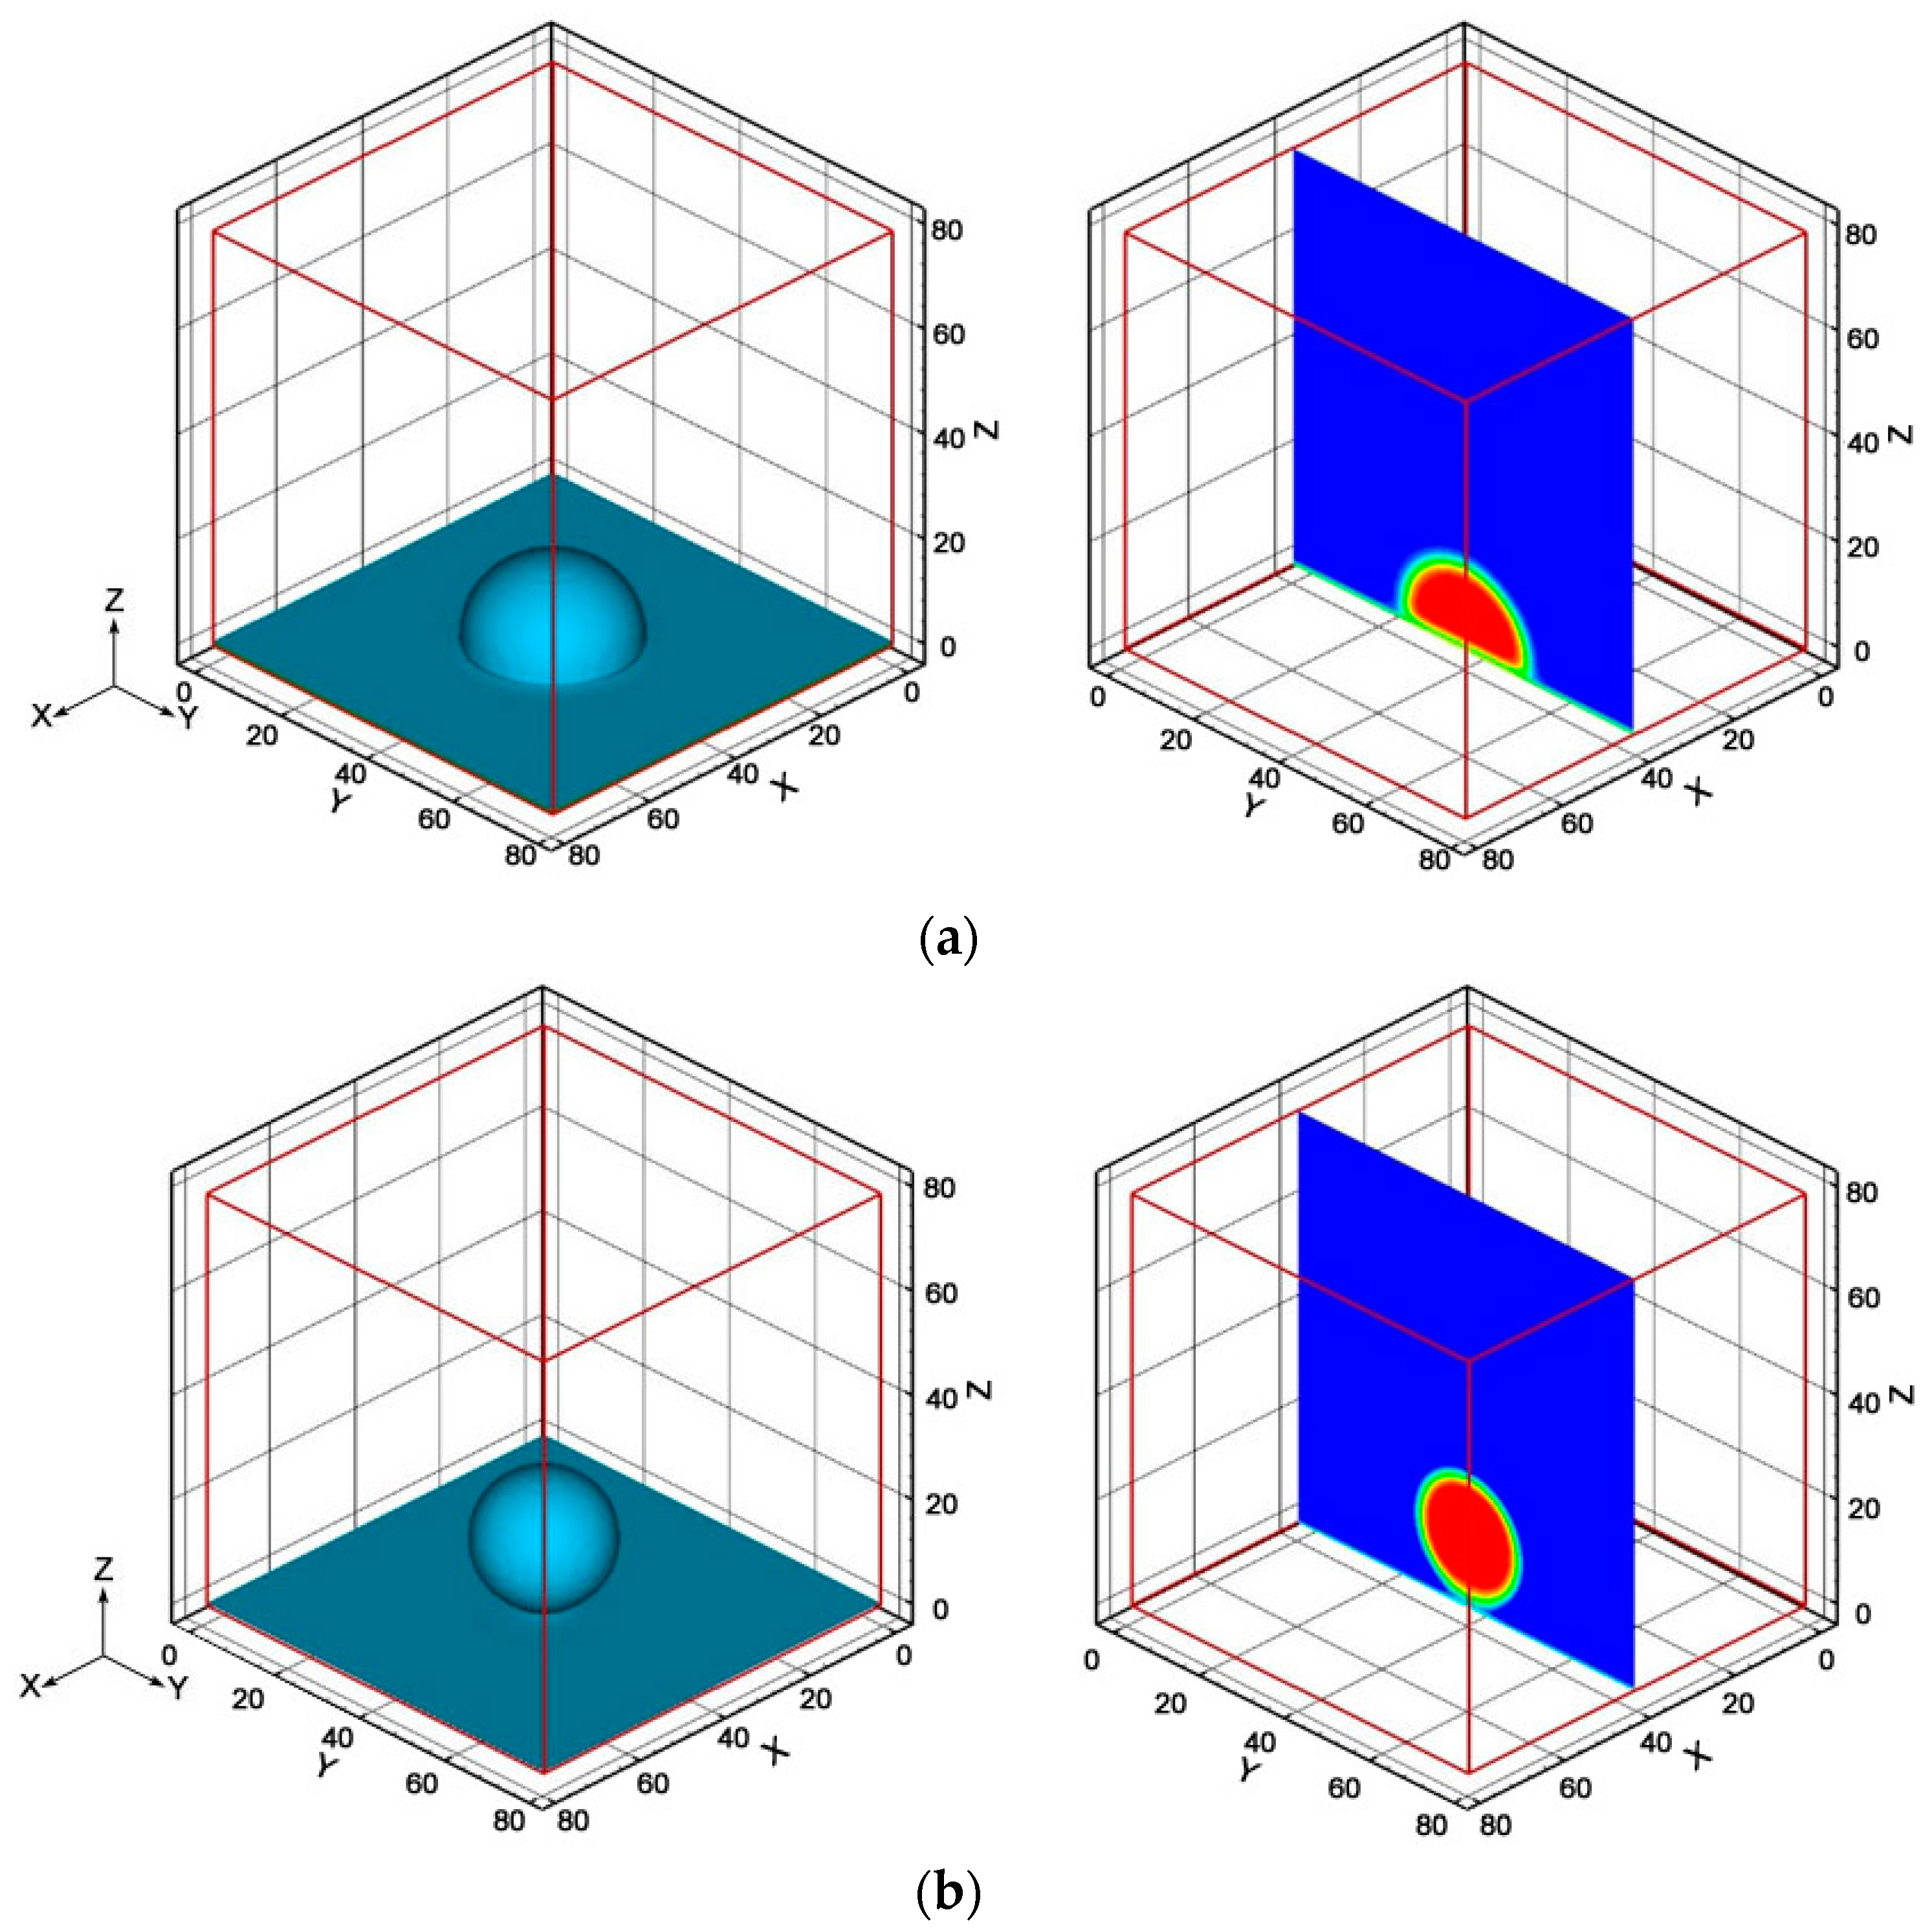
2.2. Model Validation

The preceding three-dimensional two-phase lattice Boltzmann model has been developed into a computational program in our research group. Before it is used for detailed numerical studies of liquid water transport in the porous layer of a PEMFC, two numerical test cases, concerning the gas−liquid two-phase separation and contact angle effect on liquid droplet behaviors, were conducted for model validations.
The first test concerns the gas−liquid two-phase separation and maintaining of a single liquid droplet after the two-phase separation. A single liquid droplet with a specified radius was initially placed in a gas phase domain, which was divided into 80 × 80 × 80 lattices at the x, y, and z directions, respectively. The boundary condition was set to be fully periodic in the simulations. Without the body force effect, the droplet should reach an equilibrium state with unchanged shape and size. As shown in Figure 3a,b, the figures on the left side illustrate two spherical droplets at a radius of 10 lu and 20 lu, respectively, at the equilibrium state. The two-dimensional views of the liquid droplets in the y-z cross section in the middle of the x direction are shown in the figures on the right side. The red region represents the liquid phase, and the blue one is the gas phase. It can be observed that the interface between gas phase and liquid phase is very sharp and clear, verifying that the present model is capable of handling the gas−liquid two-phase interaction and phase separation.
Figure 3. Model validations concerning two-phase separation: (a) A liquid droplet with a radius of 10 lu; (b) A liquid droplet with a radius of 20 lu.
Entropy 18 00017 g003aEntropy 18 00017 g003b
In addition, according to Laplace’s law, the static pressure difference across a droplet interface should be proportional to the fluid surface tension and inversely proportional to the droplet radius. To test Laplace’s law, a series of LBM simulations with various droplet radii were performed. As shown in Figure 4, the solid line represents the results directly calculated from Laplace’s law, and the dots are obtained from the LBM simulations. Two cases were simulated using different numbers of lattices, including case 1 with 80 × 80 × 80 lattices and case 2 with 60 × 60 × 60 lattices. At a relatively large droplet radius, the simulation results from the two cases are both consistent with Laplace’s law. However, at a small droplet radius, results from case 1 show better agreement than those from case 2, because of the finer grid resolution. For instance, when the droplet radius is equal to 10 lu, the pressure difference calculated in case 1 is 1.14, which is very close to the result from Laplace’s law, but the pressure difference in case 2 is only 1.04, showing a relatively large error. Therefore, the simulation results indicate that the present two-phase model is sufficiently accurate for numerical studies, using a set of 80 × 80 × 80 lattices.
Figure 4. Model validations against Laplace’s law.
Entropy 18 00017 g004
The second test was carried out to study the effect of the surface contact angle on liquid water droplet behaviors on a solid surface. The computational domain was again divided into a total of 80 × 80 × 80 lattices. The periodic boundary condition was used at the x and y directions, and the wall bounce-back boundary condition was set for the top and bottom boundaries at the z direction. The body force effect was neglected in the simulations. Initially, a spherical liquid droplet was placed on the solid surface at the bottom boundary. The contact angle of the solid surface was adjusted to represent different interaction strengths between the liquid droplet and solid surface. The LBM simulations were performed until the droplet reached the steady state. Figure 5 clearly shows the proper characteristics with interaction between the liquid droplet and solid surface at a contact angle of 90° (Figure 5a) and 180° (Figure 5b), respectively. Results further verify that the present two-phase lattice Boltzmann model can also accurately treat the liquid−solid interaction.
It should be mentioned that because of the numerical problem in treating a large density ratio in the LBM simulations, the density ratio in the present studies is set at 10, and the dynamic viscosity is also at 10. Therefore, the two-phase flows solved in the above tested cases and following numerical simulations concern the liquid water transport in a dense gaseous phase. However, the previous studies [23,25,27,31,32,33,34] and the present test results have clearly shown that the LBM simulations are capable of capturing the fundamental physics in two-phase flows.
Figure 5. Model validations concerning liquid−solid interactions: (a) At a contact angle of θ = 90 ° ; (b) At a contact angle of θ = 180 ° .
Entropy 18 00017 g005

3. Results and Discussion

After model validations, numerical studies of liquid water transport in the porous layer of a PEMFC are conducted in this section, focusing mainly on the effects of the porous layer porosity and boundary liquid saturation on the transport behaviors.

3.1. Microstructure Reconstruction

Reconstruction of the microstructure of a porous layer is a prerequisite prior to conducting LBM simulations. In the open literature [35,36,37], two methods were generally used to reconstruct the microstructures of a porous material. One method is based on the three-dimensional experimental imaging techniques, such as the scanning electron microscopy. Another method is based on the numerical random generation, which has lower cost and higher computational efficiency compared with the experimental method. Due to the complexity of the porous layer structures in PEMFCs, the second method is used in the present study to reproduce the porous structures. The following assumptions are made in the reconstruction procedure:
(a)
the porous material is formed by spherical particles with various sizes;
(b)
the spherical particles are randomly distributed.
Since the porous material (e.g., GDL) in a PEMFC is generally made of carbon paper with very complex microstructures, the second assumption is reasonable, but the first assumption is only a simplification for the present qualitative study.
Based on these assumptions, an effective numerical model, in which a random function is introduced to account for the pore distribution characteristics, is developed to reproduce the three-dimensional porous layer. In this reconstruction method, the porosity is an important controlling parameter, which is defined as the ratio of the pore volume to the total volume of the porous material.
ε p = V p V = 1 V s ( r s ) V ,
where V p represents the pore volume, V is the total volume of the porous medium, and V s ( r s ) is the solid phase volume that is related to the radius r s of the spherical particles.
A spherical particle can be generated using a random method to satisfy the following condition:
( x x 0 ) 2 + ( y y 0 ) 2 + ( z z 0 ) 2 r s 2 ,
{ r s = r i s + r a n f x 0 = x i 0 + r a n f y 0 = y i 0 + r a n f z 0 = z i 0 + r a n f     ,
where ( x 0 , y 0 , z 0 ) and r s are the center coordinates and radius of a spherical particle, which are allowed to vary with a random function, r a n f , to account for the complex characteristics of a porous medium in a PEMFC. The solid particles are allowed to contact each other, depending on their positions and radii. To start the reconstruction procedure, the parameters, ( x i 0 , y i 0 , z i 0 ) and r i s , which represent the initial center coordinates and an initial radius of a spherical particle, are specified.
A discriminant function is used to distinguish the fluid and solid lattice nodes. The function is defined as:
g ( x , y , z ) = { 1 ,     S o l i d   l a t t i c e 0 ,     F l u i d   l a t t i c e .
As shown in Figure 6, two porous materials with different porosities have been reconstructed. The computational domain is set to be 80 × 80 × 80 lattice nodes at the x, y, and z directions, respectively. Since the thickness of a GDL in a PEMFC is around 200 µm, a lattice unit thus represents about 2.5 µm in the present study. Figure 6a shows a reconstructed porous medium with a porosity of 0.4, while Figure 6b shows one with a porosity of 0.7. The difference between the two reconstructed porous materials can be clearly observed, and the reconstruction can capture the random micro-pore structures. It should be noted that the mean pore size in the reconstructed porous material is around 15 µm, which is in the practical range of a PEMFC. In the computational domain, six lattices are located in each dimension of the pore, and it should be sufficient for obtaining reasonably accurate results in the present qualitative study.
Figure 6. Reconstructed porous layers using a random numerical generation method: (a) Porosity: 0.4; (b) Porosity: 0.7.
Entropy 18 00017 g006

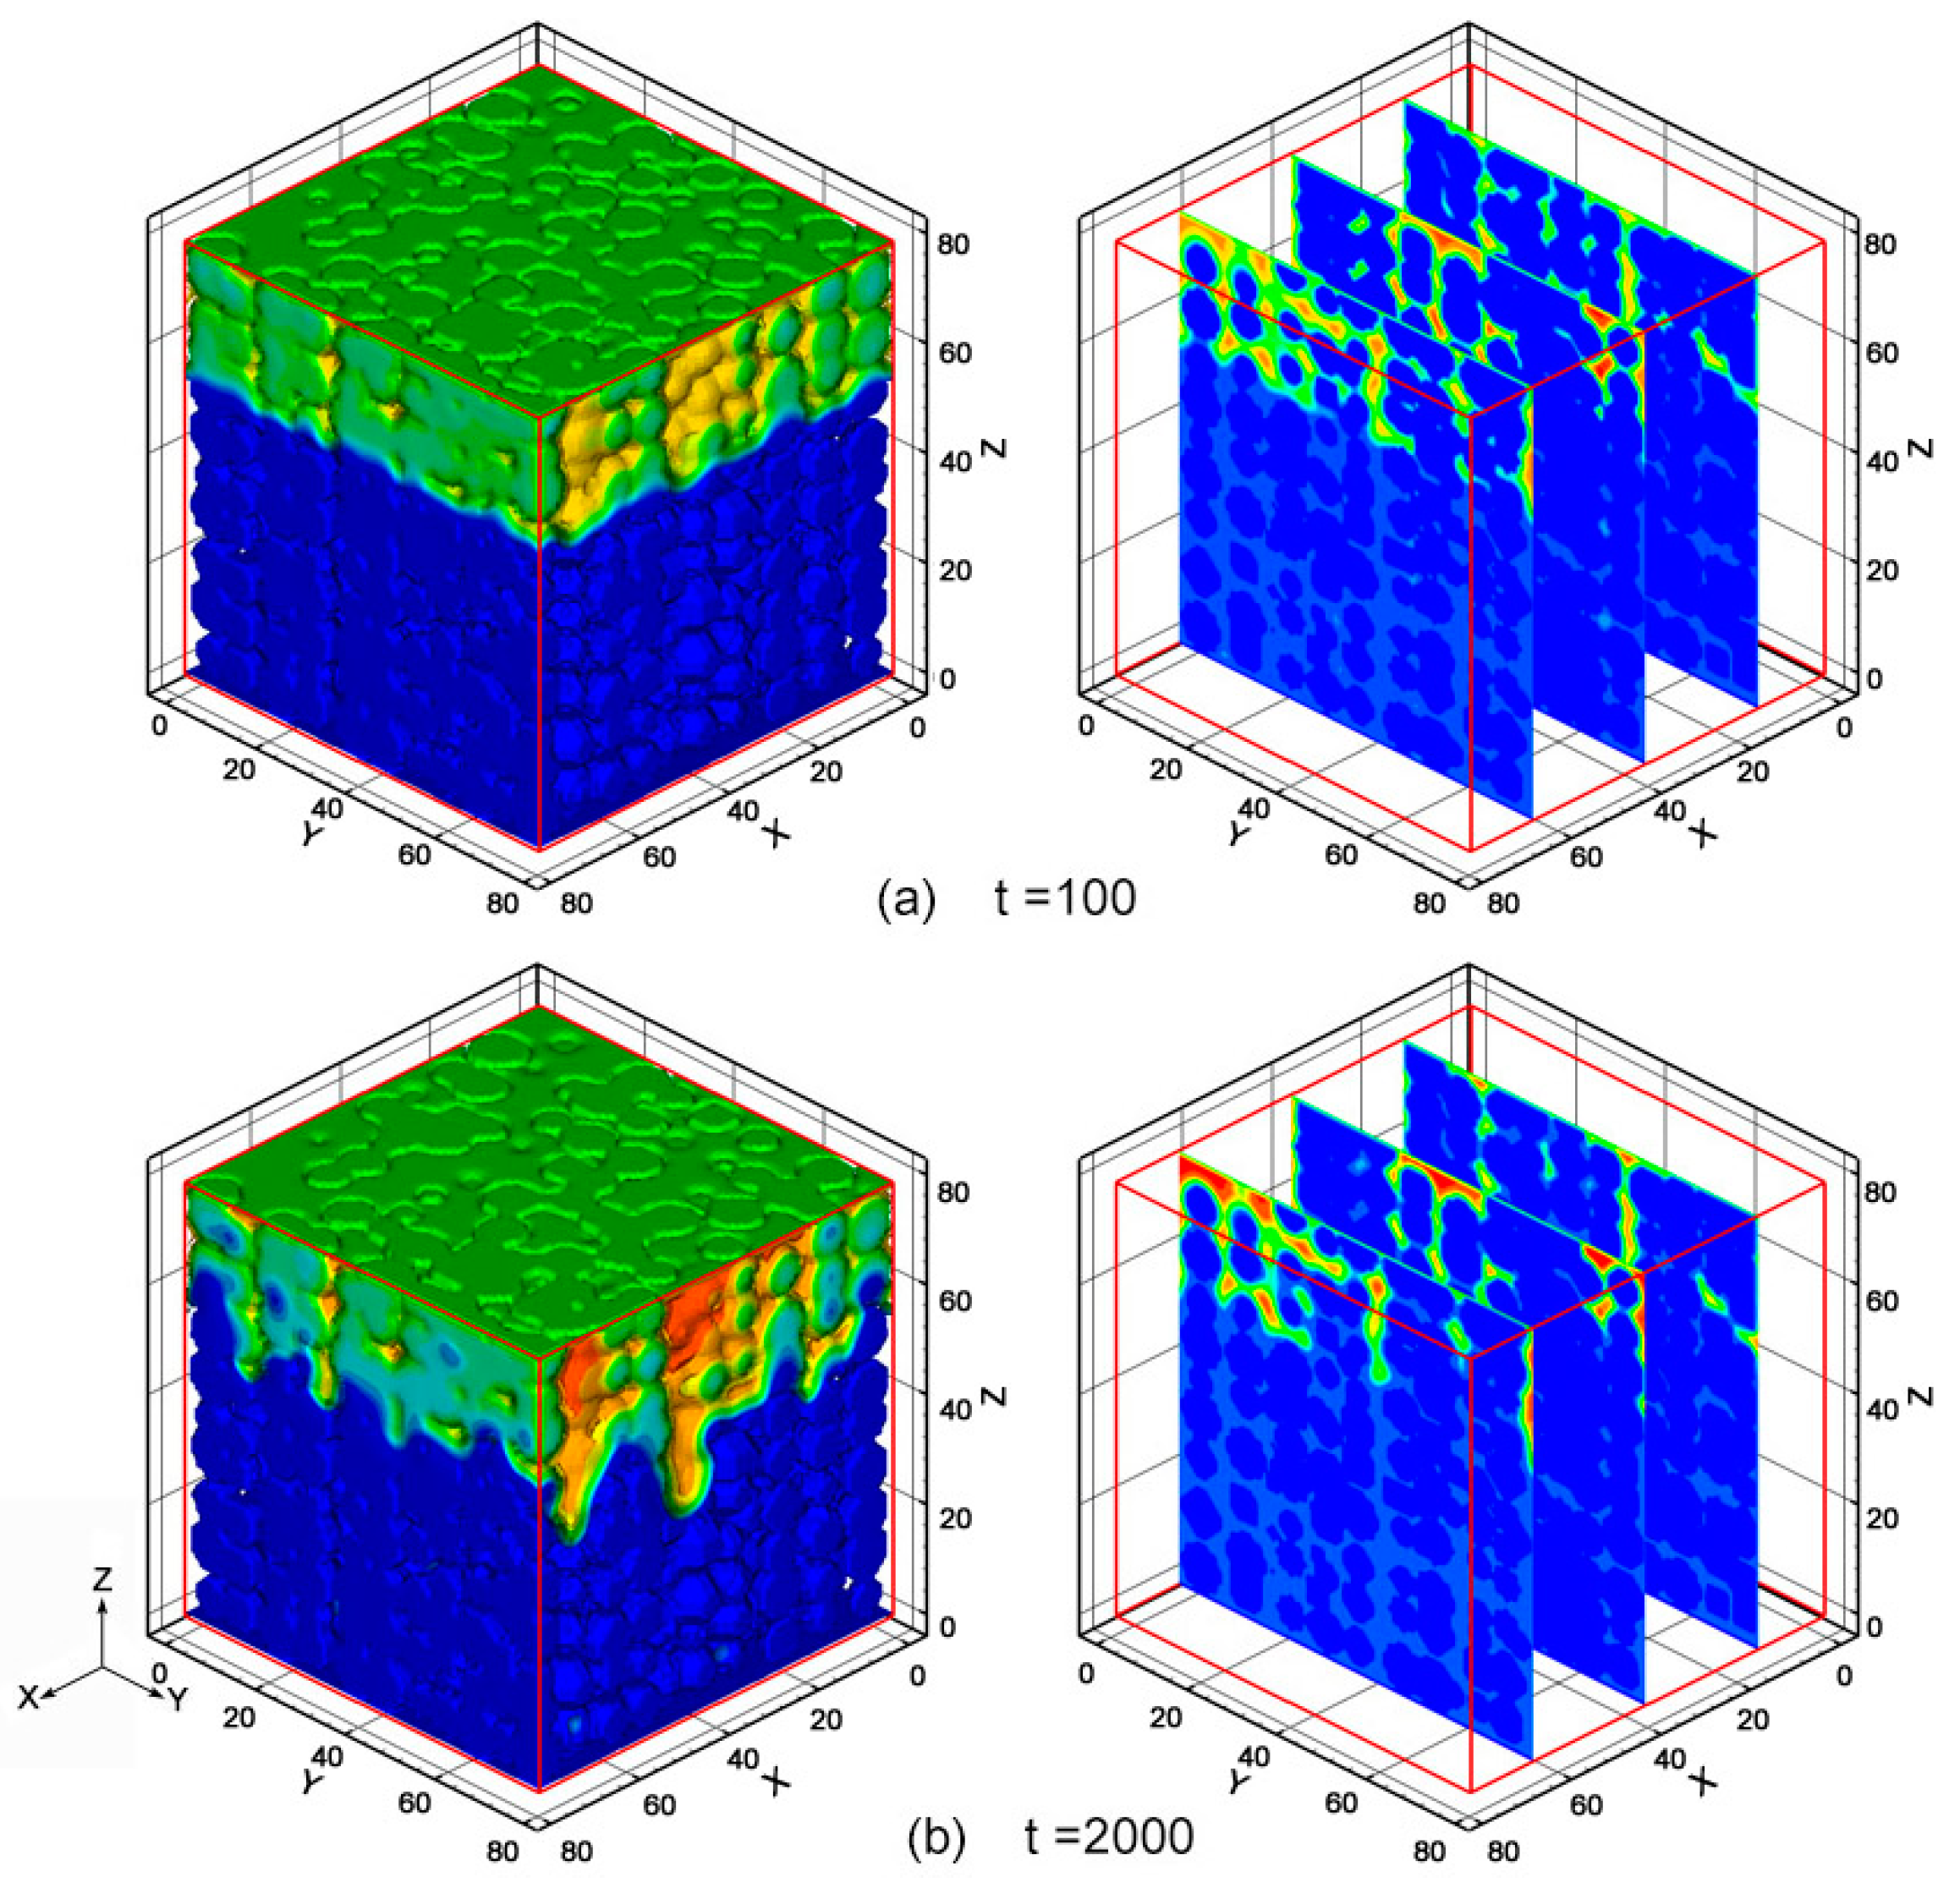
3.2. Liquid Water Transport in Reconstructed Porous Materials

Liquid water transport in the porous layer of a PEMFC is studied in this section, based on the two reconstructed porous layers in Figure 6 and using the three-dimensional two-phase lattice Boltzmann method described and validated in the previous sections. The effects of the porous layer porosity and boundary liquid saturation on liquid water transport behaviors are examined.
In the present LBM simulations, three types of boundary conditions are used, including: (a) the pressure boundary condition that is imposed on the up (inlet) and down (outlet) boundaries in the computational domain; (b) the periodic boundary condition that is set to another four boundaries; (c) the bounce-back boundary condition that is used to simulate the interactions between the fluid particles and solid surfaces inside the reconstructed porous structure. In the present studies, all the solid surfaces in the porous material are assumed to be hydrophobic with a contact angle of 160°. At the inlet, the liquid water distribution is randomly specified, in consistency with the boundary liquid saturation, and a small velocity at 0.5 × 10⁻⁵ ms−1 is defined for the liquid water to start the numerical simulations.
Figure 7 illustrates the transient liquid water transport process in the reconstructed porous layer of a PEMFC, with a porosity of 0.7, as presented in Figure 6b. In this case, the boundary liquid saturation at the top surface, which may represent the chemical reaction sites in a PEMFC, is set to 0.19. In PEMFC operations, liquid water is produced in the CL, penetrates through the porous CL and GDL, and moves into the gas channel (refer to Figure 1b,c). Figure 7a shows the detailed liquid water distribution at a time step of t = 100 ts. It can be observed that at the early stage of the transport process, when the time step is less than 100 ts, the liquid water front moves relatively uniformly from the inlet boundary of the reconstructed porous layer. The figure on the right side in Figure 7a shows the two-dimensional cross-sectional views of liquid water distribution at different x positions. It can be seen that more liquid water exists in the middle section, because in this case, there are larger pores in this region. Liquid water transport in a porous material is mainly controlled by the capillary pressure, and thus prefers the large empty area as the preferential transport pathway [31]. The capillary pressure in the porous layer can be evaluated using the following analytical expression [38]:
p c = σ c o s θ ( ε K ) 1 / 2 J ( s ) ,
where σ is the surface tension of liquid water, θ is the contact angle of the porous material, ε is the porosity, K is the permeability that is related to the pore sizes, and J ( s ) is a function that is related to the liquid saturation s . This formulation has been widely used in the macro-scale numerical studies of liquid water transport in the CL and GDL of a PEMFC [38].
As the time step increases to 2000 ts, liquid water penetrates deeper into the porous layer, as shown in Figure 7b. At this instant, many separate liquid water fronts exist. The preferential transport characteristics of liquid water in the porous layer can be clearly observed. Results on the left side of Figure 7b clearly show that liquid water in some small pores, instead of move forward, retracts and changes its transport pathway to the neighboring large pores. These results clearly elucidate the effect of the microstructures on liquid water transport in a porous layer of a PEMFC. Since the large pores serve as the main pathway for liquid water transport, the small pores are thus available for the gaseous reactant transport. This indicates that a good combination of large and small pores in a porous material can help gaseous species transport and consequently improve the fuel cell performance.
Figure 7. Liquid water evolution and distributions in a reconstructed porous layer with a porosity of 0.7 and a boundary liquid saturation of 0.19. (a) At a time step of t = 100 ts; (b) At a time step of t = 2000 ts.
Entropy 18 00017 g007
Since the amount of liquid water generated by the electrochemical reactions on the cathode side in a PEMFC varies with different cell operation conditions, it is thus important to study the effect of the boundary liquid saturation on liquid water transport and distribution in the porous layer. As shown in Figure 8, the boundary liquid saturation is increased to 0.31, meaning that more liquid water is produced in this case by the electrochemical reactions. According to Equation (14), the variation of liquid water saturation can have a direct effect on the capillary pressure and thus may influence the liquid water transport and distribution.
Figure 8a,b displays the evolution of liquid water in the reconstructed porous medium at two different time steps, with a boundary liquid saturation of 0.31. Liquid water moves more uniformly and faster in this case with a larger amount of liquid water, compared to the case with a boundary liquid saturation at 0.19. At a time step of t = 2000 ts, separate liquid water fronts can be observed, but it appears that the preferential transport characteristics in this case are not as profound as the preceding case, as shown in Figure 7. An interesting physical phenomenon is also clearly observed; during liquid water invasion, it appears that the breakup of a liquid water stream can occur under certain conditions, leading to the formation of a liquid droplet in the porous layer. This phenomenon is related to the connecting bridge or neck resistance dictated by the surface tension. As the feeding pore becomes smaller or the invasion pore becomes larger, the connecting resistance will be weakened, resulting in the detachment of a liquid droplet from the feeding stream.
Figure 8. Liquid water evolution and distributions in a reconstructed porous layer with a porosity of 0.7 and a boundary liquid saturation of 0.31. (a) At a time step of t = 100 ts; (b) At a time step of t = 2000 ts.
Entropy 18 00017 g008
The effect of the porous layer porosity on liquid water transport and distribution was studied next. Figure 9 shows results obtained from LBM simulations of liquid water transport in a reconstructed porous medium with a porosity of 0.4. In this case, the boundary liquid saturation is set to be 0.19. It is found that liquid water transport is very sensitive to the porous layer porosity. The preferential liquid water transport characteristics are more profound in this case with a smaller porous layer porosity, compared with the results in Figure 7. According to Equation (14), the variation of the porous layer porosity can also have a direct effect on the capillary pressure and thus can influence the liquid water transport and distribution. It is also observed that the detachment and formation of liquid droplets occur earlier and more frequently in this case, as compared to results calculated with a larger porosity, as shown in Figure 7 and Figure 8.
Figure 9. Liquid water evolution and distributions in a reconstructed porous layer with a porosity of 0.4 and a boundary liquid saturation of 0.19. (a) At a time step of t = 100 ts; (b) At a time step of t = 2000 ts.
Entropy 18 00017 g009
Figure 10 shows liquid water evolution in the reconstructed porous layer with a porosity of 0.4, but the boundary liquid saturation is increased to 0.31. Again, liquid water penetrates faster and deeper in this case with more liquid water, similar to the trend shown in Figure 8. However, the preferential liquid water transport characteristics become more profound in this case with a decreased porous layer porosity, compared with the results in Figure 8.
Figure 10. Liquid water evolution and distributions in a reconstructed porous layer with a porosity of 0.4 and a boundary liquid saturation of 0.31. (a) At a time step of t = 100 ts; (b) At a time step of t = 2000 ts.
Entropy 18 00017 g010

4. Conclusions

In this paper, a three-dimensional two-phase lattice Boltzmann model is implemented to qualitatively study liquid water transport behaviors in the porous layer of a PEMFC. The model is validated against two test cases concerning the gas−liquid separation and liquid−solid interaction. Model validations prove that the lattice Boltzmann model is capable of accurately simulating the two-phase transport phenomena. A random numerical generation method is used to reconstruct the microstructures of a porous layer. The solid surfaces in the porous material are assumed to be hydrophobic with a contact angle of 160°. The present LBM simulations focus on the effects of the porous layer porosity and boundary liquid saturation on liquid water transport in porous materials.
Numerical results confirm that liquid water transport is strongly affected by the microstructures in a porous layer, and liquid water prefers the large pores as its main pathway. It is found that during the transport process, liquid water in some small pores may retract and change its pathway to the neighboring large pores. The preferential transport phenomenon is more profound with a decreased porous layer porosity and/or boundary liquid saturation. In the transport process, the breakup of a liquid water stream can occur under certain conditions, leading to the formation of liquid droplets inside the porous layer. This phenomenon is related to the connecting bridge or neck resistance dictated by the surface tension, and happens more frequently with a smaller porous layer porosity.
Results obtained in this paper indicate that an optimized design of porous layer porosity and the combination of various pore sizes may improve both the liquid water removal and gaseous reactant transport in a porous layer. The LBM simulations can help to improve the fundamental understanding of liquid water transport phenomena in the porous materials of PEMFCs.

Acknowledgments

This work was financially supported by the National Natural Science Foundation of China (No.10972197).

Author Contributions

The research was proposed and designed by Meng Ni and Hua Meng, and the numerical study was performed by Bo Han. Bo Han wrote the first draft of this paper, and Hua Meng made revisions. The authors have read and approved the final version.

Conflicts of Interest

The authors declare no conflict of interest.

References

  1. Song, G.-H.; Meng, H. Numerical modeling and simulation of PEM fuel cells: Progress and perspective. Acta Mech. Sin. 2013, 29, 318–334. [Google Scholar] [CrossRef]
  2. Mukherjee, P.P.; Kang, Q.; Wang, C.-Y. Pore-scale modeling of two-phase transport in polymer electrolyte fuel cells—progress and perspective. Energy Environ. Sci. 2011, 4, 346–369. [Google Scholar] [CrossRef]
  3. Zhang, F.-Y.; Advani, S.G.; Prasad, A.K.; Boggs, M.E.; Sullivan, S.P.; Beebe, T.P., Jr. Quantitative characterization of catalyst layer degradation in PEM fuel cells by X-ray photoelectron spectroscopy. Electrochim. Acta 2009, 54, 4025–4030. [Google Scholar] [CrossRef]
  4. Sinha, P.K.; Halleck, P.; Wang, C.-Y. Quantification of liquid water saturation in a PEM fuel cell diffusion medium using X-ray microtomograph. Electrochem. Solid State Lett. 2006, 9, A344–A348. [Google Scholar] [CrossRef]
  5. Turhan, A.; Heller, K.; Brenizer, J.S.; Mench, M.M. Quantification of liquid water accumulation and distribution in a polymer electrolyte fuel cell using neutron imaging. J. Power Sources 2006, 160, 1195–1203. [Google Scholar] [CrossRef]
  6. Song, D.; Wang, Q.; Liu, Z.; Navessin, T.; Eikerling, M.; Holdcroft, S. Numerical optimization study of the catalyst layer of PEM fuel cell cathode. J. Power Sources 2004, 126, 104–111. [Google Scholar] [CrossRef]
  7. Lin, G.; He, W.; Nguyen, T.V. Modeling liquid water effects in the gas diffusion and catalyst layers of the cathode of a PEM fuel cell. J. Electrochem. Soc. 2004, 151, A1999–A2006. [Google Scholar] [CrossRef]
  8. Liu, J.; Eikerling, M. Model of cathode catalyst layers for polymer electrolyte fuel cells: The role of porous structure and water accumulation. Electrochim. Acta 2008, 53, 4435–4446. [Google Scholar] [CrossRef]
  9. Jiao, K.; Zhou, B. Effects of electrode wettabilities on liquid water behaviors in PEM fuel cell cathode. J. Power Sources 2008, 175, 106–119. [Google Scholar] [CrossRef]
  10. Ju, H. Analyzing the effects of immobile liquid saturation and spatial wettability variation on liquid water transport in diffusion media of polymer electrolyte fuel cells (PEFCs). J. Power Sources 2008, 185, 55–62. [Google Scholar] [CrossRef]
  11. Wang, Y. Modeling of two-phase transport in the diffusion media of polymer electrolyte fuel cells. J. Power Sources 2008, 185, 261–271. [Google Scholar] [CrossRef]
  12. Das, P.K.; Li, X.; Liu, Z.-S. Analysis of liquid water transport in cathode catalyst layer of PEM fuel cells. Int. J. Hydrog. Energy 2010, 35, 2403–2416. [Google Scholar] [CrossRef]
  13. Meng, H. Multi-dimensional liquid water transport in the cathode of a PEM fuel cell with consideration of the micro-porous layer (MPL). Int. J. Hydrog. Energy 2009, 34, 5488–5497. [Google Scholar] [CrossRef]
  14. Meng, H. Numerical studies of liquid water behaviors in PEM fuel cell cathode considering transport across different porous layers. Int. J. Hydrog. Energy 2010, 35, 5569–5579. [Google Scholar] [CrossRef]
  15. Hizir, F.E.; Ural, S.O.; Kumbur, E.C.; Mench, M.M. Characterization of interfacial morphology in polymer electrolyte fuel cells: Micro-porous layer and catalyst layer surfaces. J. Power Sources 2010, 195, 3463–3471. [Google Scholar] [CrossRef]
  16. Thiele, S.; Zengerle, R.; Ziegler, C. Nano-morphology of a polymer electrolyte fuel cell catalyst layer—Imaging, reconstruction and analysis. Nano Res. 2011, 4, 849–860. [Google Scholar] [CrossRef]
  17. Wang, G.; Mukherjee, P.P.; Wang, C.-Y. Optimization of polymer electrolyte fuel cell cathode catalyst layers via direct numerical simulation modeling. Electrochim. Acta 2007, 52, 6367–6377. [Google Scholar] [CrossRef]
  18. Mukherjee, P.P.; Wang, C.-Y. Stochastic microstructure reconstruction and direct numerical simulation of the PEFC catalyst layer. J. Electrochem. Soc. 2006, 153, A840–A849. [Google Scholar] [CrossRef]
  19. Higuera, F.J.; Succi, S. Simulating the flow around a circular cylinder with a lattice Boltzmann equation. Europhys. Lett. 1989, 8, 517–521. [Google Scholar] [CrossRef]
  20. Succi, S; Foti, E.; Higuera, F. Three-dimensional flows in complex geometries with the lattice Boltzmann method. Europhys. Lett. 1989, 10, 433–438. [Google Scholar]
  21. Benzi, R.; Succi, S.; Vergassola, M. The lattice Boltzmann equation: Theory and applications. Phys. Rep. 1992, 222, 145–197. [Google Scholar] [CrossRef]
  22. Chen, S.; Doolen, G.D. Lattice Boltzmann method for fluid flows. Annu. Rev. Fluid Mech. 1998, 30, 329–364. [Google Scholar] [CrossRef]
  23. Shan, X.; Chen, H. Lattice Boltzmann model for simulating flows with multiple phases and components. Phys. Rev. E 1993, 47. [Google Scholar] [CrossRef]
  24. Martys, N.S.; Chen, H. Simulation of multicomponent fluids in complex three-dimensional geometries by the lattice Boltzmann method. Phys. Rev. E 1996, 53. [Google Scholar] [CrossRef]
  25. Huang, H.; Li, Z.; Liu, S.; Lu, X.-Y. Shan-and-Chen-type multiphase lattice Boltzmann study of viscous coupling effects for two-phase flow in porous media. Int. J. Numer. Methods Fluids 2009, 61, 341–354. [Google Scholar] [CrossRef]
  26. Chen, L.; Kang, Q.; Tang, Q.; Robinson, B.A.; He, Y.L.; Tao, W.Q. Pore-scale simulation of multicomponent multiphase reactive transport with dissolution and precipittaion. Int. J. Heat Mass Transf. 2015, 85, 935–949. [Google Scholar] [CrossRef]
  27. Sinha, P.K.; Mukherjee, P.P.; Wang, C.-Y. Impact of GDL structure and wettability on water management in polymer electrolyte fuel cells. J. Mater. Chem. 2007, 17, 3089–3103. [Google Scholar] [CrossRef]
  28. Park, J.; Matsubara, M.; Li, X. Application of lattice Boltzmann method to a micro-scale flow simulation in the porous electrode of a PEM fuel cell. J. Power Sources 2007, 173, 404–414. [Google Scholar] [CrossRef]
  29. Hao, L.; Cheng, P. Lattice Boltzmann simulations of liquid droplet dynamic behavior on a hydrophobic surface of a gas flow channel. J. Power Sources 2009, 190, 435–446. [Google Scholar] [CrossRef]
  30. Hao, L.; Cheng, P. Pore-scale simulations on relative permeabilities of porous media by lattice Boltzmann method. Int. J. Heat Mass Transf. 2010, 53, 1908–1913. [Google Scholar] [CrossRef]
  31. Mukherjee, P.P.; Wang, C.-Y.; Kang, Q. Mesoscopic modeling of two-phase behavior and flooding phenomena in polymer electrolyte fuel cells. Electrochim. Acta 2009, 54, 6861–6875. [Google Scholar] [CrossRef]
  32. Han, B.; Yu, J.; Meng, H. Lattice Boltzmann simulations of liquid droplets development and interaction in a gas channel of a proton exchange membrane fuel cell. J. Power Sources 2012, 202, 175–183. [Google Scholar] [CrossRef]
  33. Han, B.; Meng, H. Lattice Boltzmann simulation of liquid water transport in turning regions of serpentine gas channels in proton exchange membrane fuel cells. J. Power Sources 2012, 217, 268–279. [Google Scholar] [CrossRef]
  34. Han, B.; Meng, H. Numerical studies of interfacial phenomena in liquid water transport in polymer electrolyte membrane fuel cells using the lattice Boltzmann method. Int. J. Hydrog. Energy 2013, 38, 5053–5059. [Google Scholar] [CrossRef]
  35. Wang, Y.; Cho, S.; Thiedmann, R.; Schmidt, V.; Lehnert, W.; Feng, X. Stochastic modeling and direct simulation of the diffusion media for polymer electrolyte fuel cells. Int. J. Heat Mass Transf. 2010, 53, 1128–1138. [Google Scholar] [CrossRef]
  36. Thiedmann, R.; Fleischer, F.; Hartnig, C.; Lehnert, W.; Schmidt, V. Stochastic 3D modeling of the GDL structure in PEMFCs based on thin section detection. J. Electrochem. Soc. 2008, 155, B391–B399. [Google Scholar] [CrossRef]
  37. Zhang, Y.; Sun, Q.; Xia, C.; Ni, M. Geometric properties of nanostructured solid oxide fuel cell electrodes. J. Electrochem. Soc. 2013, 160, F278–F289. [Google Scholar] [CrossRef]
  38. Meng, H.; Wang, C.-Y. Model of two-phase flow and flooding dynamics in polymer electrolyte fuel cells. J. Electrochem. Soc. 2005, 152, A1733–A1741. [Google Scholar] [CrossRef]

