1. Introduction
Parkinson’s disease (PD) is a neurodegenerative disorder that causes motor disabilities including tremors and cognitive impairment. Patients with progressive PD exhibit several cognitive dysfunctions that are similar to those found in patients with Alzheimer’s disease (AD). It has been previously reported that 26% of patients with PD-related dementia (PD-D) exhibit similar symptoms of cognitive impairment to those observed in patients with AD [
1]. Distinguishing PD-D from other forms of dementia is important because they possess entirely different pathological causes and lesions and thus require different treatment strategies. PD is currently diagnosed via medical examination by a clinical doctor. Typical PD is detected based on clinical signs, but no specific clinical criteria exist for the differential diagnoses of PD-D and AD [
2,
3]. Therefore, it is difficult to distinguish between PD-D and AD using neuropsychological tests, particularly at the early stages of the disease [
4]. Mild PD-D is often misdiagnosed and commonly confused with mild AD [
5]. Thus, additional examinations, such as brain tissue analysis and brain scans, are critically important to increase diagnostic precision. We previously utilized single-photon emission computed tomography (SPECT) scanning to distinguish between PD-D and AD; however, this neuroimaging method requires considerable time, cost, and effort [
4,
6,
7], compared with the electroencephalography (EEG). The EEG is potentially useful for the early diagnosis of PD-D and AD because the cost, space, and time requirements of this method are lower than those of other neuroimaging techniques.
PD-D and AD patients often exhibit slow oscillatory brain activity compared with normal subjects. PD-D patients produce EEG signals with reduced α power and increased amplitudes of θ and δ powers [
8,
9,
10,
11,
12,
13,
14]. The EEG patterns produced by AD patients also show slow brain activity, similar to that observed in PD patients. The combinations of decreased α power and increased δ and θ powers in AD patients indicates a global “slowing” of background EEG activity [
15,
16]. In addition, studies of non-linear properties have mostly reported a loss of complexity and decreased connectivity in EEG of AD patients [
15]. Furthermore, these slowing oscillatory activities are considered to be strongly correlated with cognitive decline [
17,
18,
19].
Although numerous studies have compared the EEG patterns produced by PD, PD-D, and dementia, few studies have compared PD-D patients with those exhibiting other forms of dementia, such as AD, using advanced EEG techniques because these diseases exhibit similar EEG characteristics (e.g., slow brain oscillatory activity). A previous study using source localization found that abnormalities in central δ source and posterior θ and β1 sources in PD-D were more pronounced relative to AD patients and normal elderly subjects [
20]. This study has also shown reduced posterior cortical sources of α1 rhythms in both PD-D and AD patients, with far greater decreases in α in AD patients than in PD-D patients. In addition, activity (5.6–7.9 Hz) in posterior derivations has been observed in patients with dementia with Lewy bodies (DLB) and PD-D, while dominant α bands have been observed in AD patients [
21]. Furthermore, increased relative θ power in the left temporal region and reduced median frequency have also been reported in AD and PD patients [
22]. This result showed slow EEG patterns in both AD and PD patients although slower patterns in PD compared with AD were repeatedly reported. Recently, another study investigated quantitative EEG patterns among AD patients, PD-D patients, PD patients without dementia, and controls [
23] and demonstrated that δ and θ powers were highest in PD-D patients and lowest in controls. This result is consistent with findings of previous studies (
i.e., slow EEG patterns in PD-D and AD patients); however, it was controversial whether there were significant differences observed in the comparison of PD-D patients and AD patients, PD-D patients and PD patients, PD-D patients and controls, and AD patients and controls. Furthermore, after examining inter- and intra-hemispheric coherence, it was found that β frontal-occipital inter-hemispheric coherence was highest in PD-D patients, while α and β frontal inter-hemispheric coherence was highest in PD-D patients and lowest in AD patients [
23].
To the best of our knowledge, no studies have evaluated the performance of machine learning techniques in distinguishing between PD-D and AD despite the large number of reports on using such techniques to diagnose AD. Previous studies attempting to classify PD have primarily focused on identifying or predicting tremors or other motor symptoms in PD patients using electromyography (EMG). One group of researchers has reported using β peak frequency, α relative power, and α/θ power to distinguish between patients with PD-mild cognitive impairment (MCI) and those with PD-D [
24]. However, the use of advanced EEG techniques, including wavelet approaches or machine learning tools, to differentiate between PD-D and AD patients has not yet been reported.
Thus, the aim of the current study was to investigate the spectral powers and coherences of various brain regions in PD-D patients, AD patients and healthy elderly subjects using wavelet transform (WT), which provides time-frequency information on a signal [
25]. Discrete wavelet transform (DWT) can efficiently decompose non-stationary signals, such as EEG, into sub-frequency bands. Then, the quantity of information contained within each of these bands can be determined based on relative wavelet energy (RWE). Since PD-D and AD patients both exhibit slow EEG activity, single-channel RWE analysis is limited when these two groups are compared. To overcome this limitation, the wavelet coherence (WC) among the signals in each channel was also calculated. WC can be used to examine the relationship between two signals by estimating their spectral patterns. Additionally, WC can provide phase synchrony between and transmit information among different brain regions; as such WC measurements may help estimate the degree of connectivity among various brain regions and reveal the spatial patterns of these connections. In the current study, diagnostic machines were constructed using quadratic discriminant analysis (QDA) after statistical comparisons of RWE and WC. The diagnostic performance of each machine was examined based on its ability to differentiate between PD-D patients, AD patients and healthy subjects.
2. Methods
2.1. Subjects and Data Acquisition
Each subject group (PD-D, AD, and control) underwent EEG at the Incheon St. Mary Hospital. The 26 PD-D patients had an average age of 73.73 years (range, 57 to 86 years), the 26 AD patients had an average of 74.31 years (range, 55 to 82 years), and the 26 healthy elderly subjects had an average of 71.50 years (range, 59 to 84 years). The control group was composed of patients who had visited the hospital for headache and did not exhibit any neurophysiological disorders. Cognitive function was assessed using the Mini-Mental State Examination (MMSE) [
26]. Patients with MMSE scores less than or equal to 20 were diagnosed with dementia. Patients diagnosed with mild cognitive impairment (MCI) were excluded from the current study. Age, sex, and MMSE distribution did not differ between the three groups (
Table 1).
Table 1.
Demographic data and MMSE scores in the PD-D, AD, and control groups. Sex distributions were compared using the chi-squared test, and age and MMSE were compared using ANOVA. (The values shown are the mean ± standard deviation).
Table 1.
Demographic data and MMSE scores in the PD-D, AD, and control groups. Sex distributions were compared using the chi-squared test, and age and MMSE were compared using ANOVA. (The values shown are the mean ± standard deviation).
| | PD-D | AD | Controls | Statistics (p-Value) |
|---|
| Subjects | Number | 26 | 26 | 26 | - |
| Sex (male) | 12 | 11 | 11 | χ2 = 0.110 (0.946) |
| Age | Mean (yrs) | 73.73 ± 6.98 | 74.31 ± 6.76 | 71.50 ± 6.01 | F = 1.315 (0.275) |
| MMSE | Mean | 14.19 ± 4.35 | 14.00 ± 4.45 | - | F = 0.001 (0.974) |
The EEG was recorded in the resting state with eyes closed for 20 min with Comet-Plus XL® Lab-based EEG from Grass Technologies (Middleton, WI, USA). It was sampled with a frequency of 200 Hz. The outputs of 21 channels based on average reference montage were obtained from 23 electrodes positioned according to the International 10–20 System (Fp1, F7, T3, T5, Fp2, F8, T4, T6, F3, C3, P3, O1, F4, C4, P4, O2, FZ, CZ, PZ, EKG, Photic).
The first 10 min of noisy data were discarded because the stress test using the light reflex and the breath-holding test were performed in early measurements. Baseline corrections were applied using EEGLAB toolbox in MATLAB (R2014b). EEG signals were filtered by 50 Hz low-pass filter to avoid muscle artifacts and 60 Hz line-noise. Pre-processed data were divided into non-overlapped 2.56-s epochs (512 points) which is free for noises from subjects’ movement or eye-blink (<100 µV).
2.2. Wavelet Transform and Wavelet Energy
WT, which can measure the similarity between a target signal and an analyzing function called wavelet, is one of the most commonly used time-frequency analysis tools for biosignals. WT introduces appropriate orthonormal series generated by a wavelet [
27]. It produces information on frequency and time by comparing target signals with shifted and stretched/compressed wavelets. It provides coefficients at various scales and positions, which respectively indicate frequency and time [
25]. The coefficient of continuous wavelet transform (CWT) can be calculated with following equation:
for a scale parameter, a > 0, and position parameter, b, where
is a target signal,
is a wavelet, and
is its complex conjugate. The scales are inversely proportional to frequency and can be expressed by:
where F
c is the center frequency of a wavelet and F
s is the sampling frequency. To decompose the signal into sub-band, discrete wavelet transform let a wavelet be shifted and scaled by a scale constant
a = 2
j and a position constant
b = 2
jk:
Then, the wavelet expansion of the sampled signal,
, can be described as:
where
. The coefficients
are detail coefficients that contain the information of the frequency band
, where
is the sampling frequency.
In this study, the Daubechies-4 wavelet was selected as a wavelet and decomposed with a level of 5. Then, 5 detail coefficients and 1 approximate coefficient were obtained. Each detail coefficient at resolution level j was named Fj and an approximate coefficient was called F6 for the convenience of explanation. Since the sampling frequency was 200 Hz, the decomposed frequency bands were divided into F1 (50–100 Hz), F2 (25–50 Hz), F3 (12.5–25 Hz), F4 (6.25–12.5 Hz), F5 (3.125–6.25 Hz), and F6 (< 3.125 Hz). The F1 band was excluded from the analysis because it was filtered due to muscle artifacts and power noise during preprocessing. Each decomposed frequency band corresponded to an EEG frequency band: F2 = γ, F3 = β, F4 = α, F5 = θ, and F6 = δ.
Then, the energy at each resolution level j was calculated using [
28]:
The energy at each sampled time k was:
and the total energy was:
The relative wavelet energy (RWE) is obtained for normalization as:
The RWE value pj, which was normalized energy density calculated with a set of coefficients at resolution level j, implies containing power in corresponding frequency band. The RWE values except p1 were statistically compared after they were averaged over epochs to reduce fluctuation effects due to noises. The RWE values for each channel were calculated in MATLAB, according to the steps above. To investigate differences in RWE values across various brain regions, EEG channels were subdivided into the following four groups: frontal (Fp1, Fp2, F3, F4, and FZ), parietal (FZ, C3, C4, CZ, and PZ), occipital (O1, O2, P3, P4, and PZ), and temporal (F7, F8, T3, T4, T5, and T6) regions. RWE values were averaged over the channels in each group and then compared between the PD-D patients, AD patients, and controls.
2.3. Wavelet Coherence
WT and its relative energy measure temporal and spectral patterns of a signal in a single channel. Since PD-D and AD patients both exhibit slow EEG activity, single-channel analyses are limited when these two groups are compared. To overcome this limitation, it was necessary to obtain spatial information from several channels in this study. Coherence has been used to investigate relationships between two signals by dividing the squared magnitude of the cross-spectral density of two signals by the product of the power spectral densities:
where
f is frequency, and P
xx and P
yy are functions of the power densities for two signals x and y, respectively [
29]. P
xy is a function of the cross spectral density of signal x and y which is obtained by the product of the Fourier transform of signal x and the complex conjugate of Fourier transform of signal y. The coherence value exhibits the values ranging from 0 to 1. A higher coherence value near 1 means two signals have highly similar spectral densities. If two signals are exactly the same, the coherence is equal to one. The coherence for EEG signals, which are non-stationary signals, should be measured using time-varying spectral analysis, such as WT, rather than non-varying spectral analysis (
i.e., Fourier transform). Then, power densities can be replaced with wavelet energies, and cross spectral densities can be changed to a wavelet cross spectrum. The wavelet cross spectrum of two signals x and y is:
where C
x(
a,b) and C
y(
a,b) are the wavelet transforms of x and y at scales
a and positions
b [
30]. S denotes a function of smoothing, and * means complex conjugate. Then, the wavelet coherence of two signals x and y can be described as:
In a similar way to the relative wavelet energy, discrete wavelet transform was used to obtain the wavelet coherence for boosting calculation speed. Then, discrete wavelet coherence between two channels was computed as follows:
at resolution level j and sampled time k. As a consequence, the wavelet coherence could be obtained from each frequency bands F
1 (50–100 Hz), F
2 (25–50 Hz, γ), F
3 (12.5–25 Hz, β), F
4 (6.25–12.5 Hz, α), F
5 (3.125–6.25 Hz, θ), and F
6 (< 3.125 Hz, δ) by averaging the coherence values at each frequency bands. F
1 band WC results were excluded from analysis because of muscle artifacts and power noise. WC results in the F
5 and F
6 bands, which are relevant to the θ and δ frequency bands, were also excluded because low frequency EEG components are highly influenced by volume conduction effects [
31,
32]. To investigate volume conduction effects, distance-dependent differences in coherence were examined using the WC values of the control groups. The mean WC values of anterior-posterior channel pairs and lateral-medial channel pairs were used for the volume conduction test (
Table 2).
Table 2.
Channel pairs used for the volume conduction test.
Table 2.
Channel pairs used for the volume conduction test.
| Distance 1 | Distance 2 | Distance 3 | Distance 4 |
|---|
| Anterior-Posteior | Fp1-F3 | Fp1-C3 | Fp1-P3 | Fp1-O1 |
| Fp1-F7 | Fp1-T3 | Fp1-T5 | Fp1-O1 |
| O1-P3 | O1-C3 | O1-F3 | O1-Fp1 |
| O1-T5 | O1-T3 | O1-F7 | O1-Fp1 |
| Fp2-F4 | Fp2-C4 | Fp2-P4 | Fp2-O2 |
| Fp2-F8 | Fp2-T4 | Fp2-T6 | Fp2-O2 |
| O2-P4 | O2-C4 | O2-F4 | O2-Fp2 |
| O2-T6 | O2-T4 | O2-F8 | O2-Fp2 |
| Lateral-Medial | F7-F3 | F7-FZ | F7-F4 | F7-F8 |
| T3-C3 | T3-CZ | T3-C4 | T3-T4 |
| T5-P3 | T5-PZ | T5-P4 | T5-T6 |
| F8-F4 | F8-CZ | F8-F3 | F8-F7 |
| T4-C4 | T4-CZ | T4-C3 | T4-T3 |
| T6-P4 | T6-CZ | T6-P3 | T6-T5 |
2.4. Statistical Analysis
One-way analysis of variance (ANOVA) was used to evaluate the significance of differences in RWE and WC among the EEGs from the PD-D patients, AD patients, and healthy subjects. Statistical significance was considered if p-values were lower than 0.05. If a significant difference was found in the ANOVA test, the Bonferroni correction method was used as a post-hoc test. If three groups were compared with n hypotheses, the Bonferroni-corrected significance level was 1 − 0.05/(3 group comparisons × n hypothesis). Every result was averaged over whole epochs to minimize the distortion from noise. Every statistical test was performed in MATLAB.
2.5. Diagnostic Performance with Linear Discriminant Analysis
To quantitatively measure diagnostic performance, RWE and WC values were classified using linear discriminant analysis (LDA) which is a machine learning technique that separates two or more classes using a linear surface. The technique assumes that each set of data is normally distributed and constructs a discriminant model with the means and covariances of the training data of each class. The test data are classified with the likelihood obtained from prior probability analysis using the constructed discriminant model. To avoid over-fitting, the discriminability of the RWE and WC values was calculated using 10-fold cross-validation. The RWE and WC values were randomly partitioned into 10 subsamples. Accuracy was measured using 9 subsamples as a training set and 1 sample as a test set; the measurements were repeated 10 times. Following this, the 10 results were averaged and compared. The total number of candidate features for the RWE was 95 (19 channels × 5 bands), and the number of candidate features for the WC was 513 (
connectivity × 3 bands). To select an appropriate number of features, the accuracy was calculated based on the number of features selected by the Fisher ratio (FR) score in the training dataset. The FR provides a rank of discriminant capability via the following relationship:
where
m is the mean of a class and σ is the standard deviation of a class [
33].
The diagnostic validity was confirmed with three measurements: sensitivity, specificity, and performance. Answers that were classified as patients with a diagnosis were called positive, and answers classified as controls were called negative. Then, true positive was correctly classified as patients, and false negative was wrongly answered as controls, even though they were actually patients. Finally, sensitivity and specificity were defined as , in which TP is the number of true positive, FN is the number of false negatives, TN is the number of true negatives, and FP is the number of false positives. The performance is calculated as the rate of correctly classified answers, which sensitivity and specificity is combined: .
3. Results
3.1. Relative Wavelet Energy
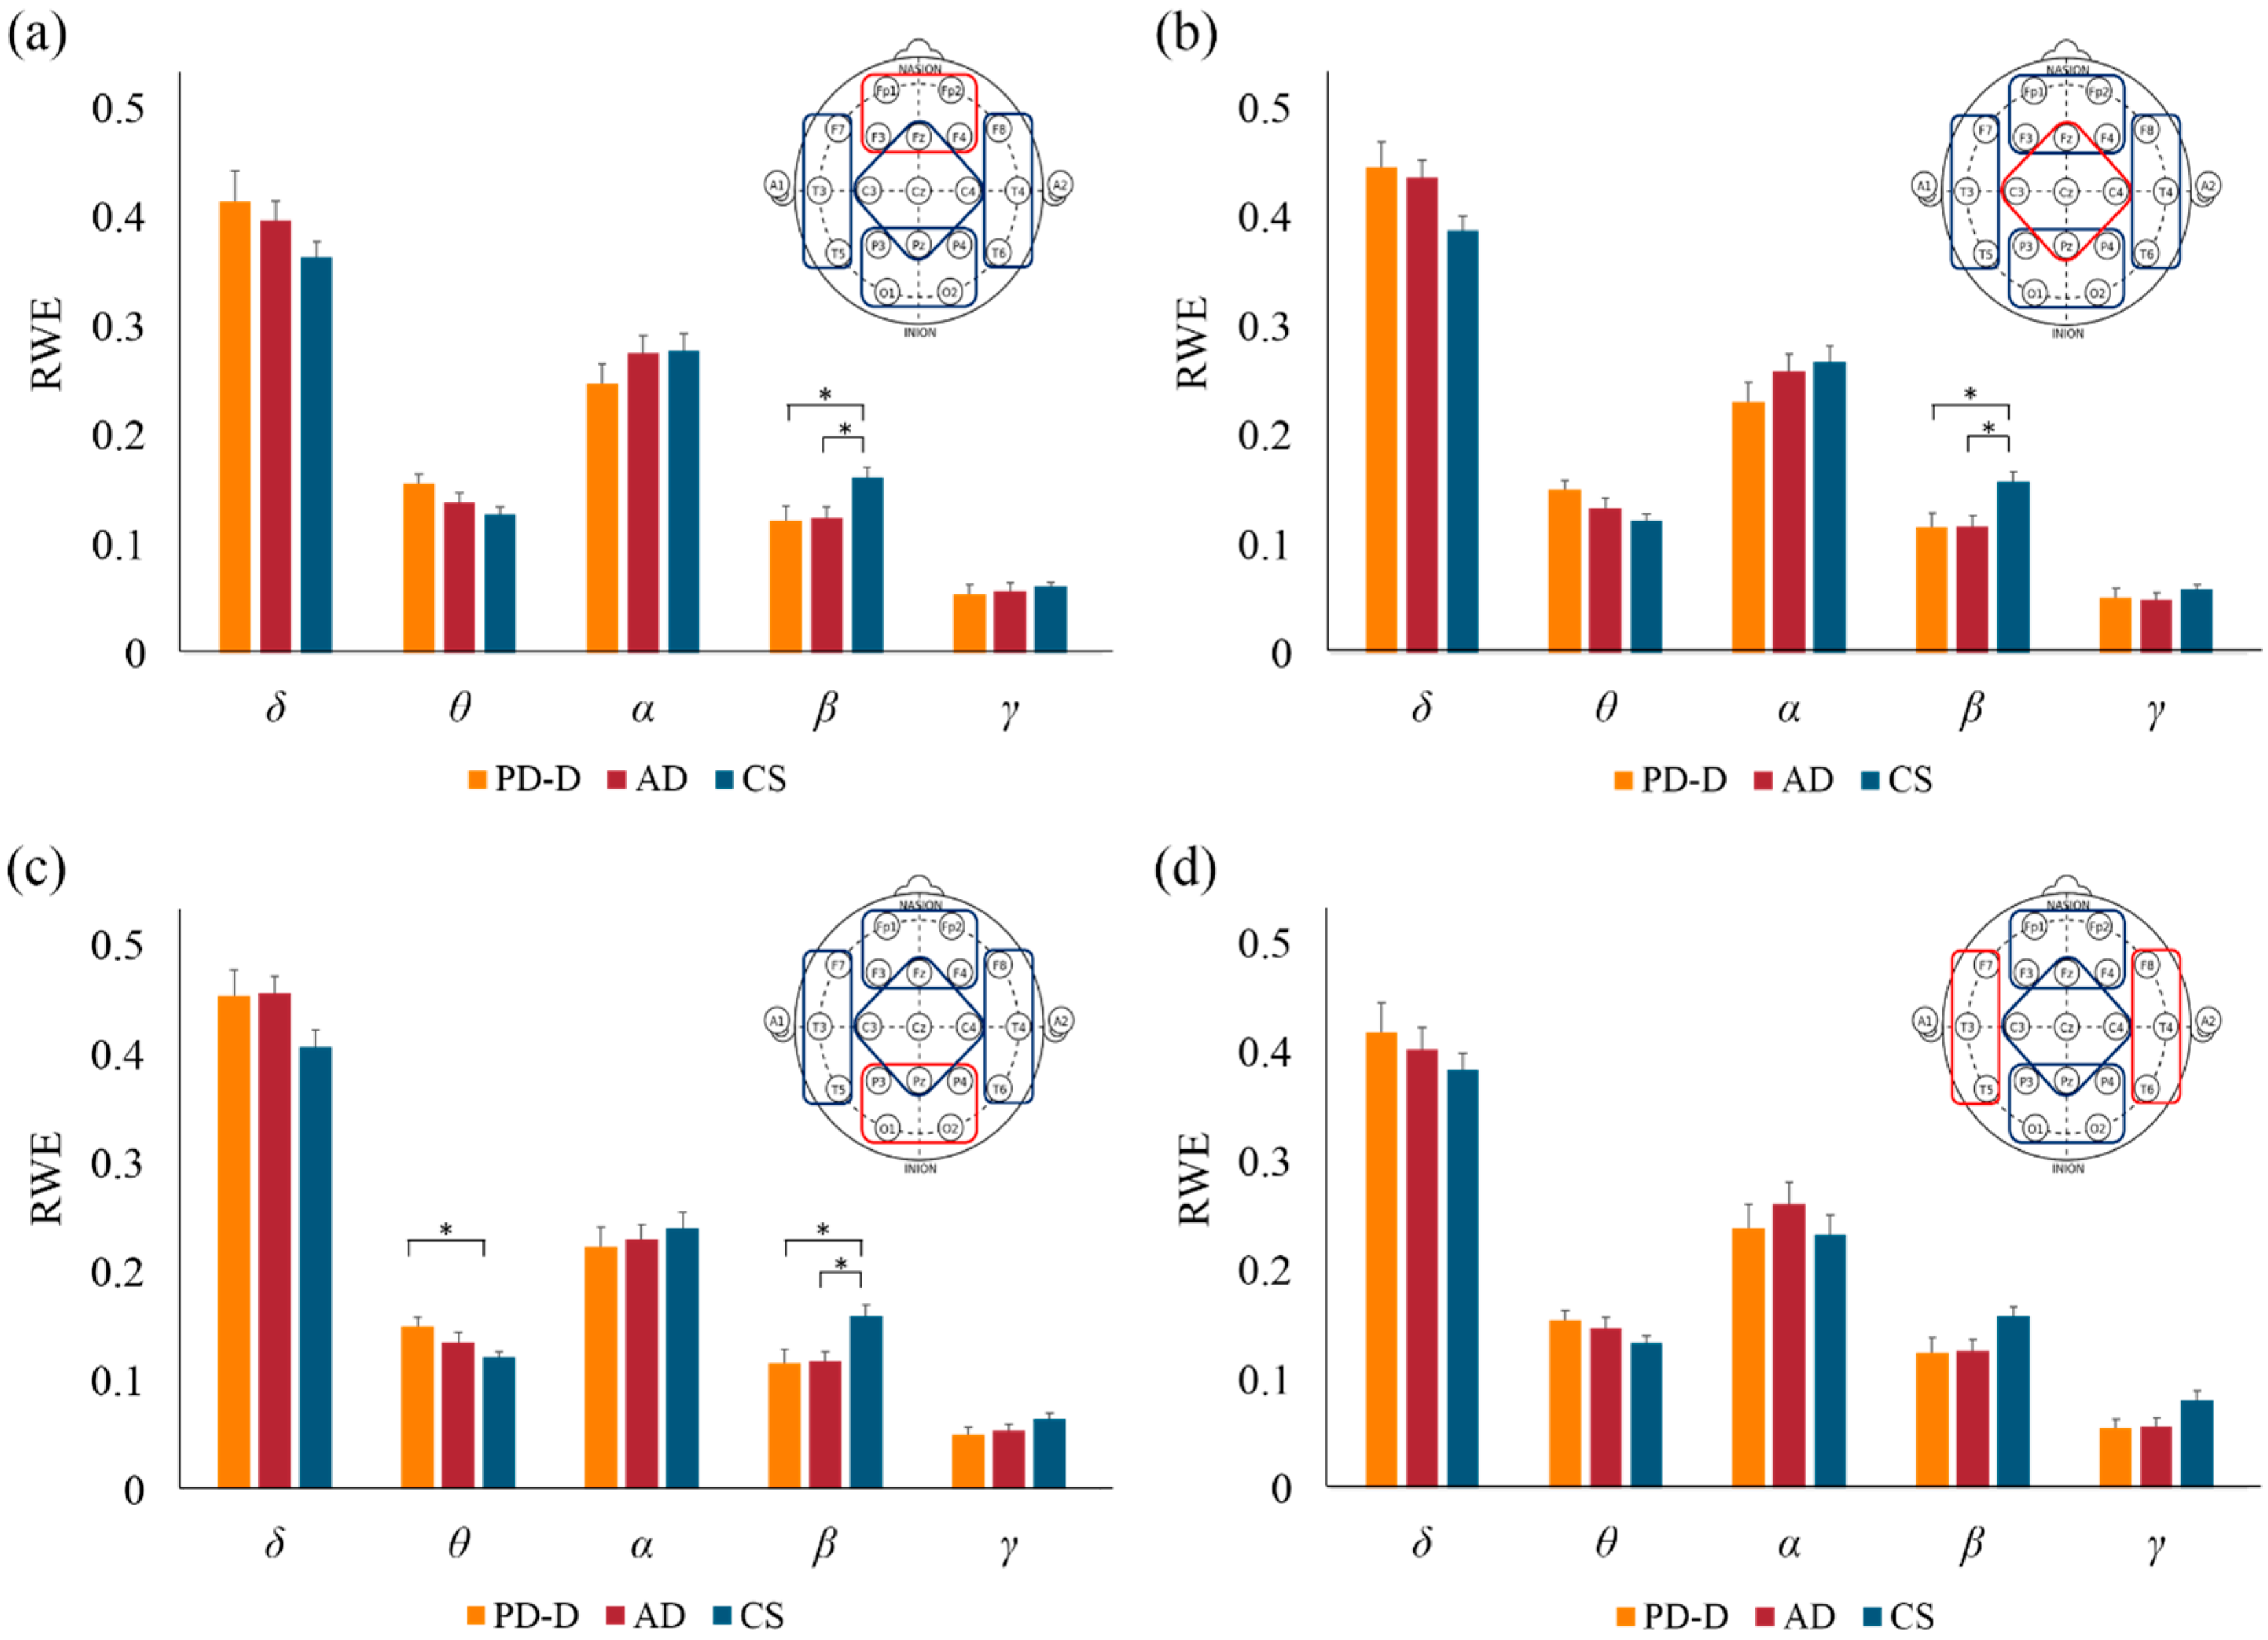
RWE was calculated to describe temporal and spectral dynamics in EEG signals. We found that the RWE values p2 and p3, which were obtained from the high-frequency bands β and γ, were smaller in the PD-D and AD groups compared with the control group. In contrast, the RWE value p5, which was obtained from the low-frequency band θ, was larger in the posterior channel in the PD-D patients compared with the controls. No statistically significant differences were found among the three groups in RWE values in the δ and α frequency bands. In the θ frequency band, the RWE values in the PD-D group were significantly larger than those in the control group in seven channels (FZ, F4, C4, P3, P4, O1, and O2; Bonferroni correction, p < 0.05). In the β frequency band, the RWE values in the PD-D and AD groups were smaller than those in the control group in most channels. In channels F4 and P4, the β energy in the PD-D group was significantly lower than in the controls. In channels Fp1, PZ, and O2, the β energy in the AD group was significantly lower than in the controls. In channels Fp2, F3, C3, C4, P3, and O1, the β energy in both the PD-D and AD groups was significantly lower than in the control group. The group means over all channels also showed significant differences between the PD-D patients and controls (Bonferroni correction, p < 0.05). In the γ frequency band, in both the PD-D and AD groups, the RWE values were decreased in channels located in the temporal regions. In channels T5 and T6, the RWE values in the AD group were smaller than those in the control group. In channels T3 and P3, both the PD-D and AD groups had smaller RWE values than the control group.
To examine regional difference in RWE values, we subdivided the EEG channels into the following four groups: frontal (Fp1, Fp2, F3, F4, and FZ), parietal (FZ, C3, C4, CZ, and PZ), occipital (O1, O2, P3, P4, and PZ), and temporal (F7, F8, T3, T4, T5, and T6). With the exception of the temporal regions, the PD-D and AD groups both had lower RWE values in the β frequency than the control group (
Figure 1). In the occipital regions, the RWE values in the PD-D group were significantly smaller than those in the control group (
Figure 1c). We also found a trend of decreased RWE values in the δ, θ, and α frequency bands and increased RWE values in the γ frequency band in the PD-D and AD groups compared to the controls; however, none of these differences were significant.
Figure 1.
The mean RWE values in different brain regions in the PD-D, AD, and control groups. (a) Frontal region (Fp1, Fp2, F3, F4, and Fz); (b) Parietal region (Fz, C3, C4, Cz, and Pz); (c) Occipital region (P3, P4, Pz, O1, and O2); (d) Temporal region (F7, F8, T3, T4, T5, and T6). Larger RWE values were found in the β frequency band in the PD-D and AD groups relative to the control group in the frontal, parietal, and occipital regions (a–c). There were significantly larger decreases in RWE value in the θ frequency band in the PD-D group vs. the control group (c). (* denotes a Bonferroni-corrected p-value < 0.05.)
3.2. Wavelet Coherence
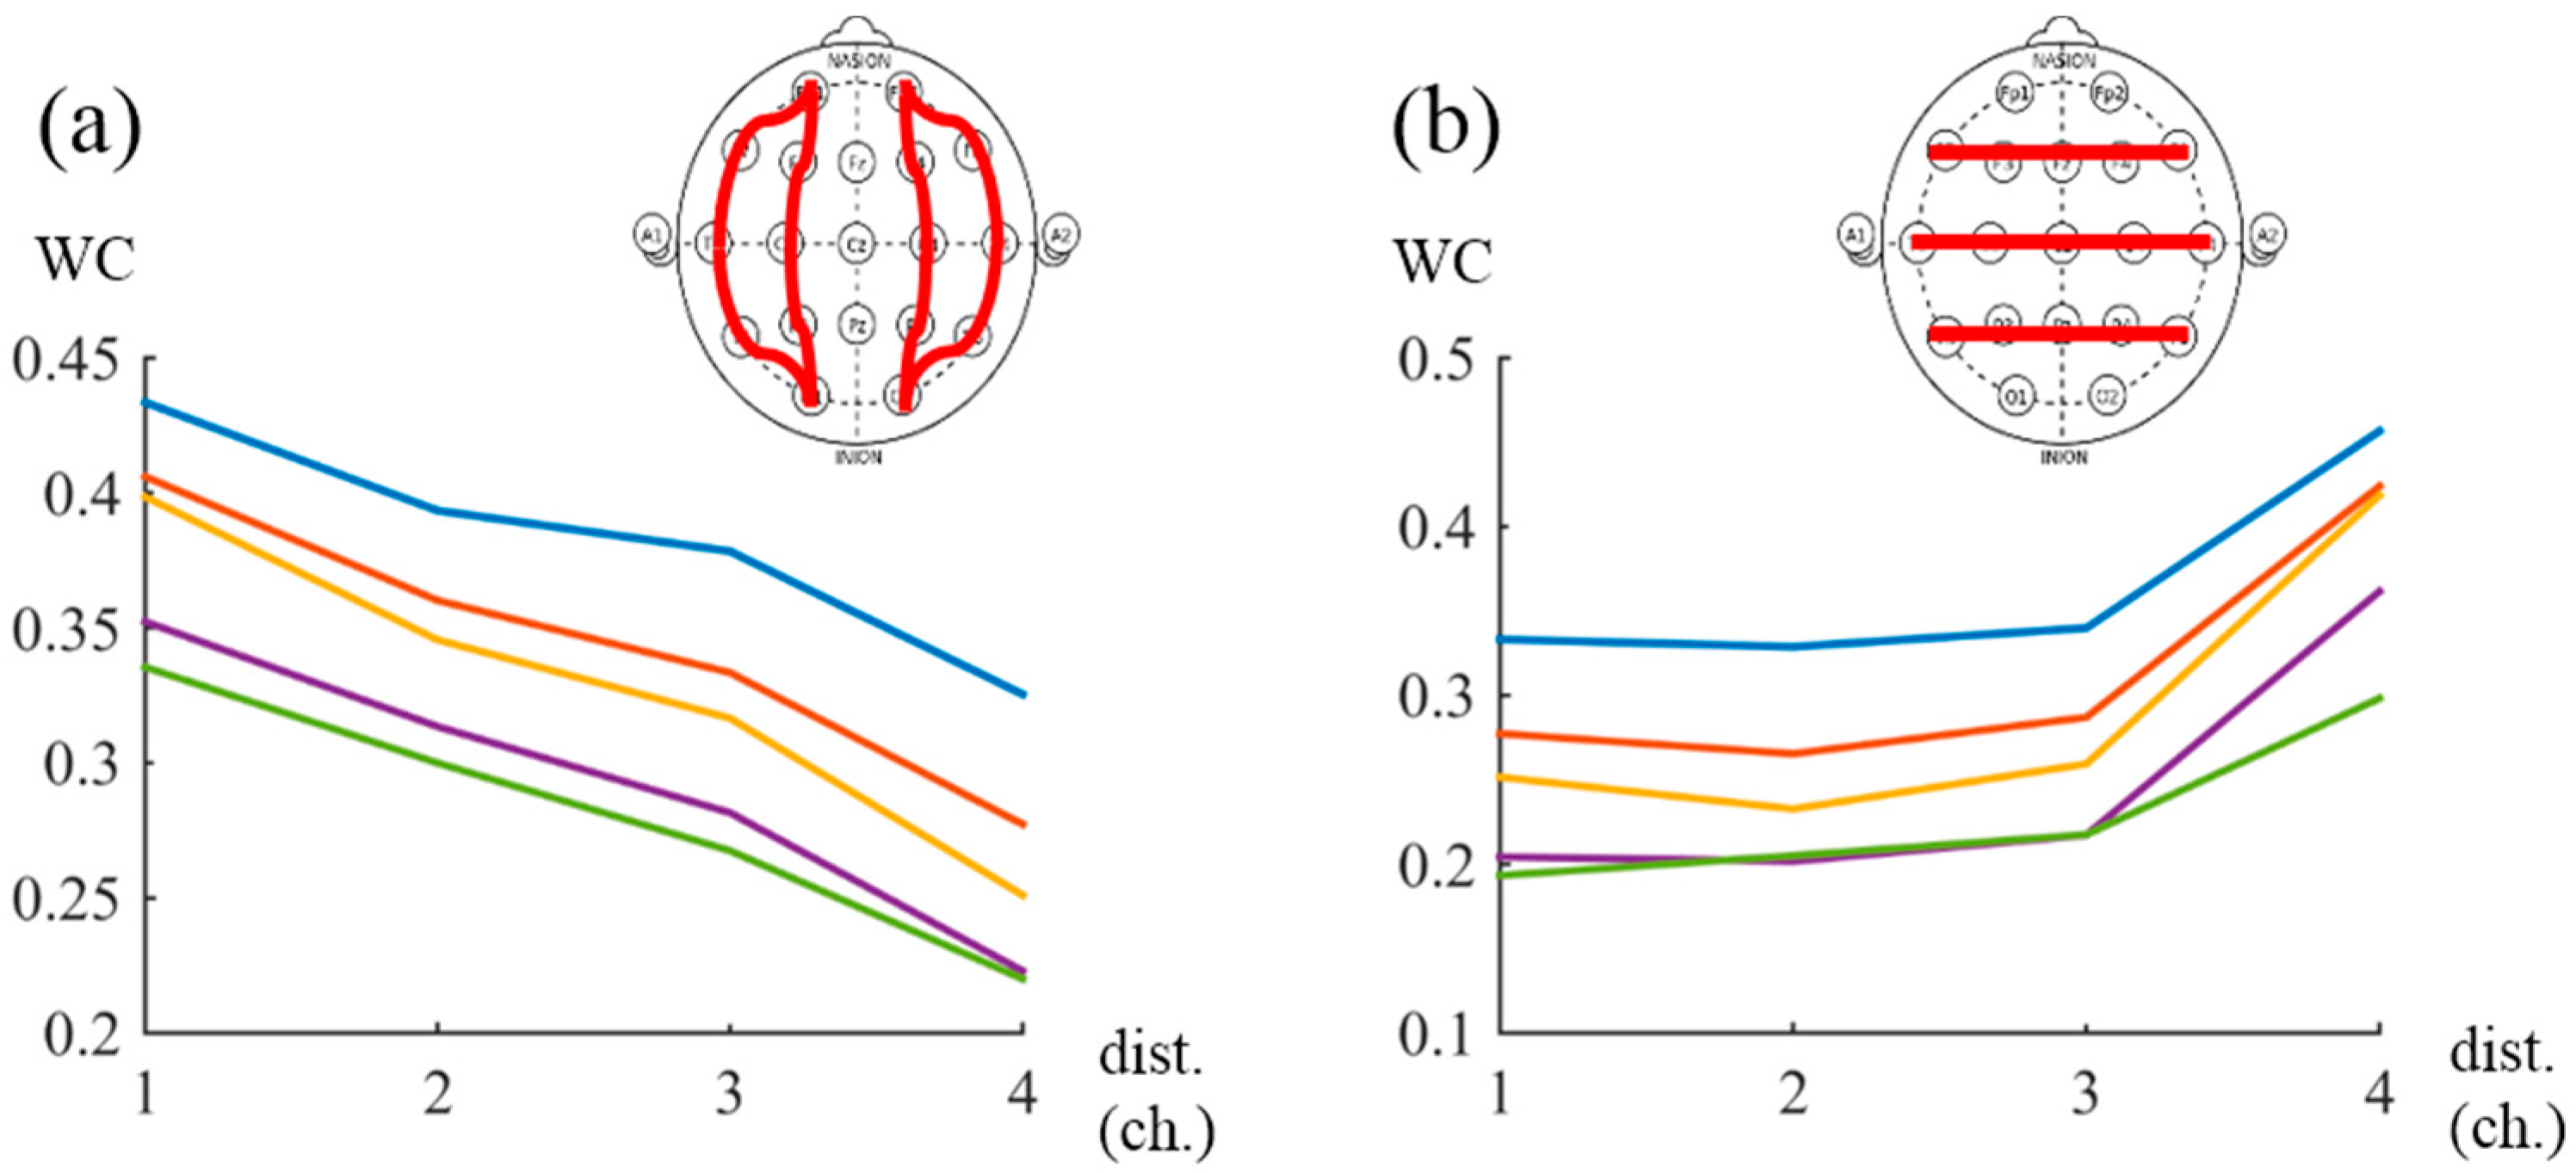
To avoid volume conduction effects, we examined how distance affected the WC results. Control group WC values were used for this analysis. Larger WC values were found in lower frequency bands (
Figure 2); thus, low-frequency components of EEG signals are more influenced by volume conduction. In the anterior-posterior comparison, WC values decreased with increasing distance (
Figure 2a). In the lateral-medial comparison, distance did not appreciably affect WC values and the largest values were found between symmetric channels. Because large inter-hemispheric coherence was frequently reported, these channel pairs were only weakly influenced by volume conduction. We excluded the WC results corresponding to the δ and θ frequency bands and adjacent channel pairs from the above examination.
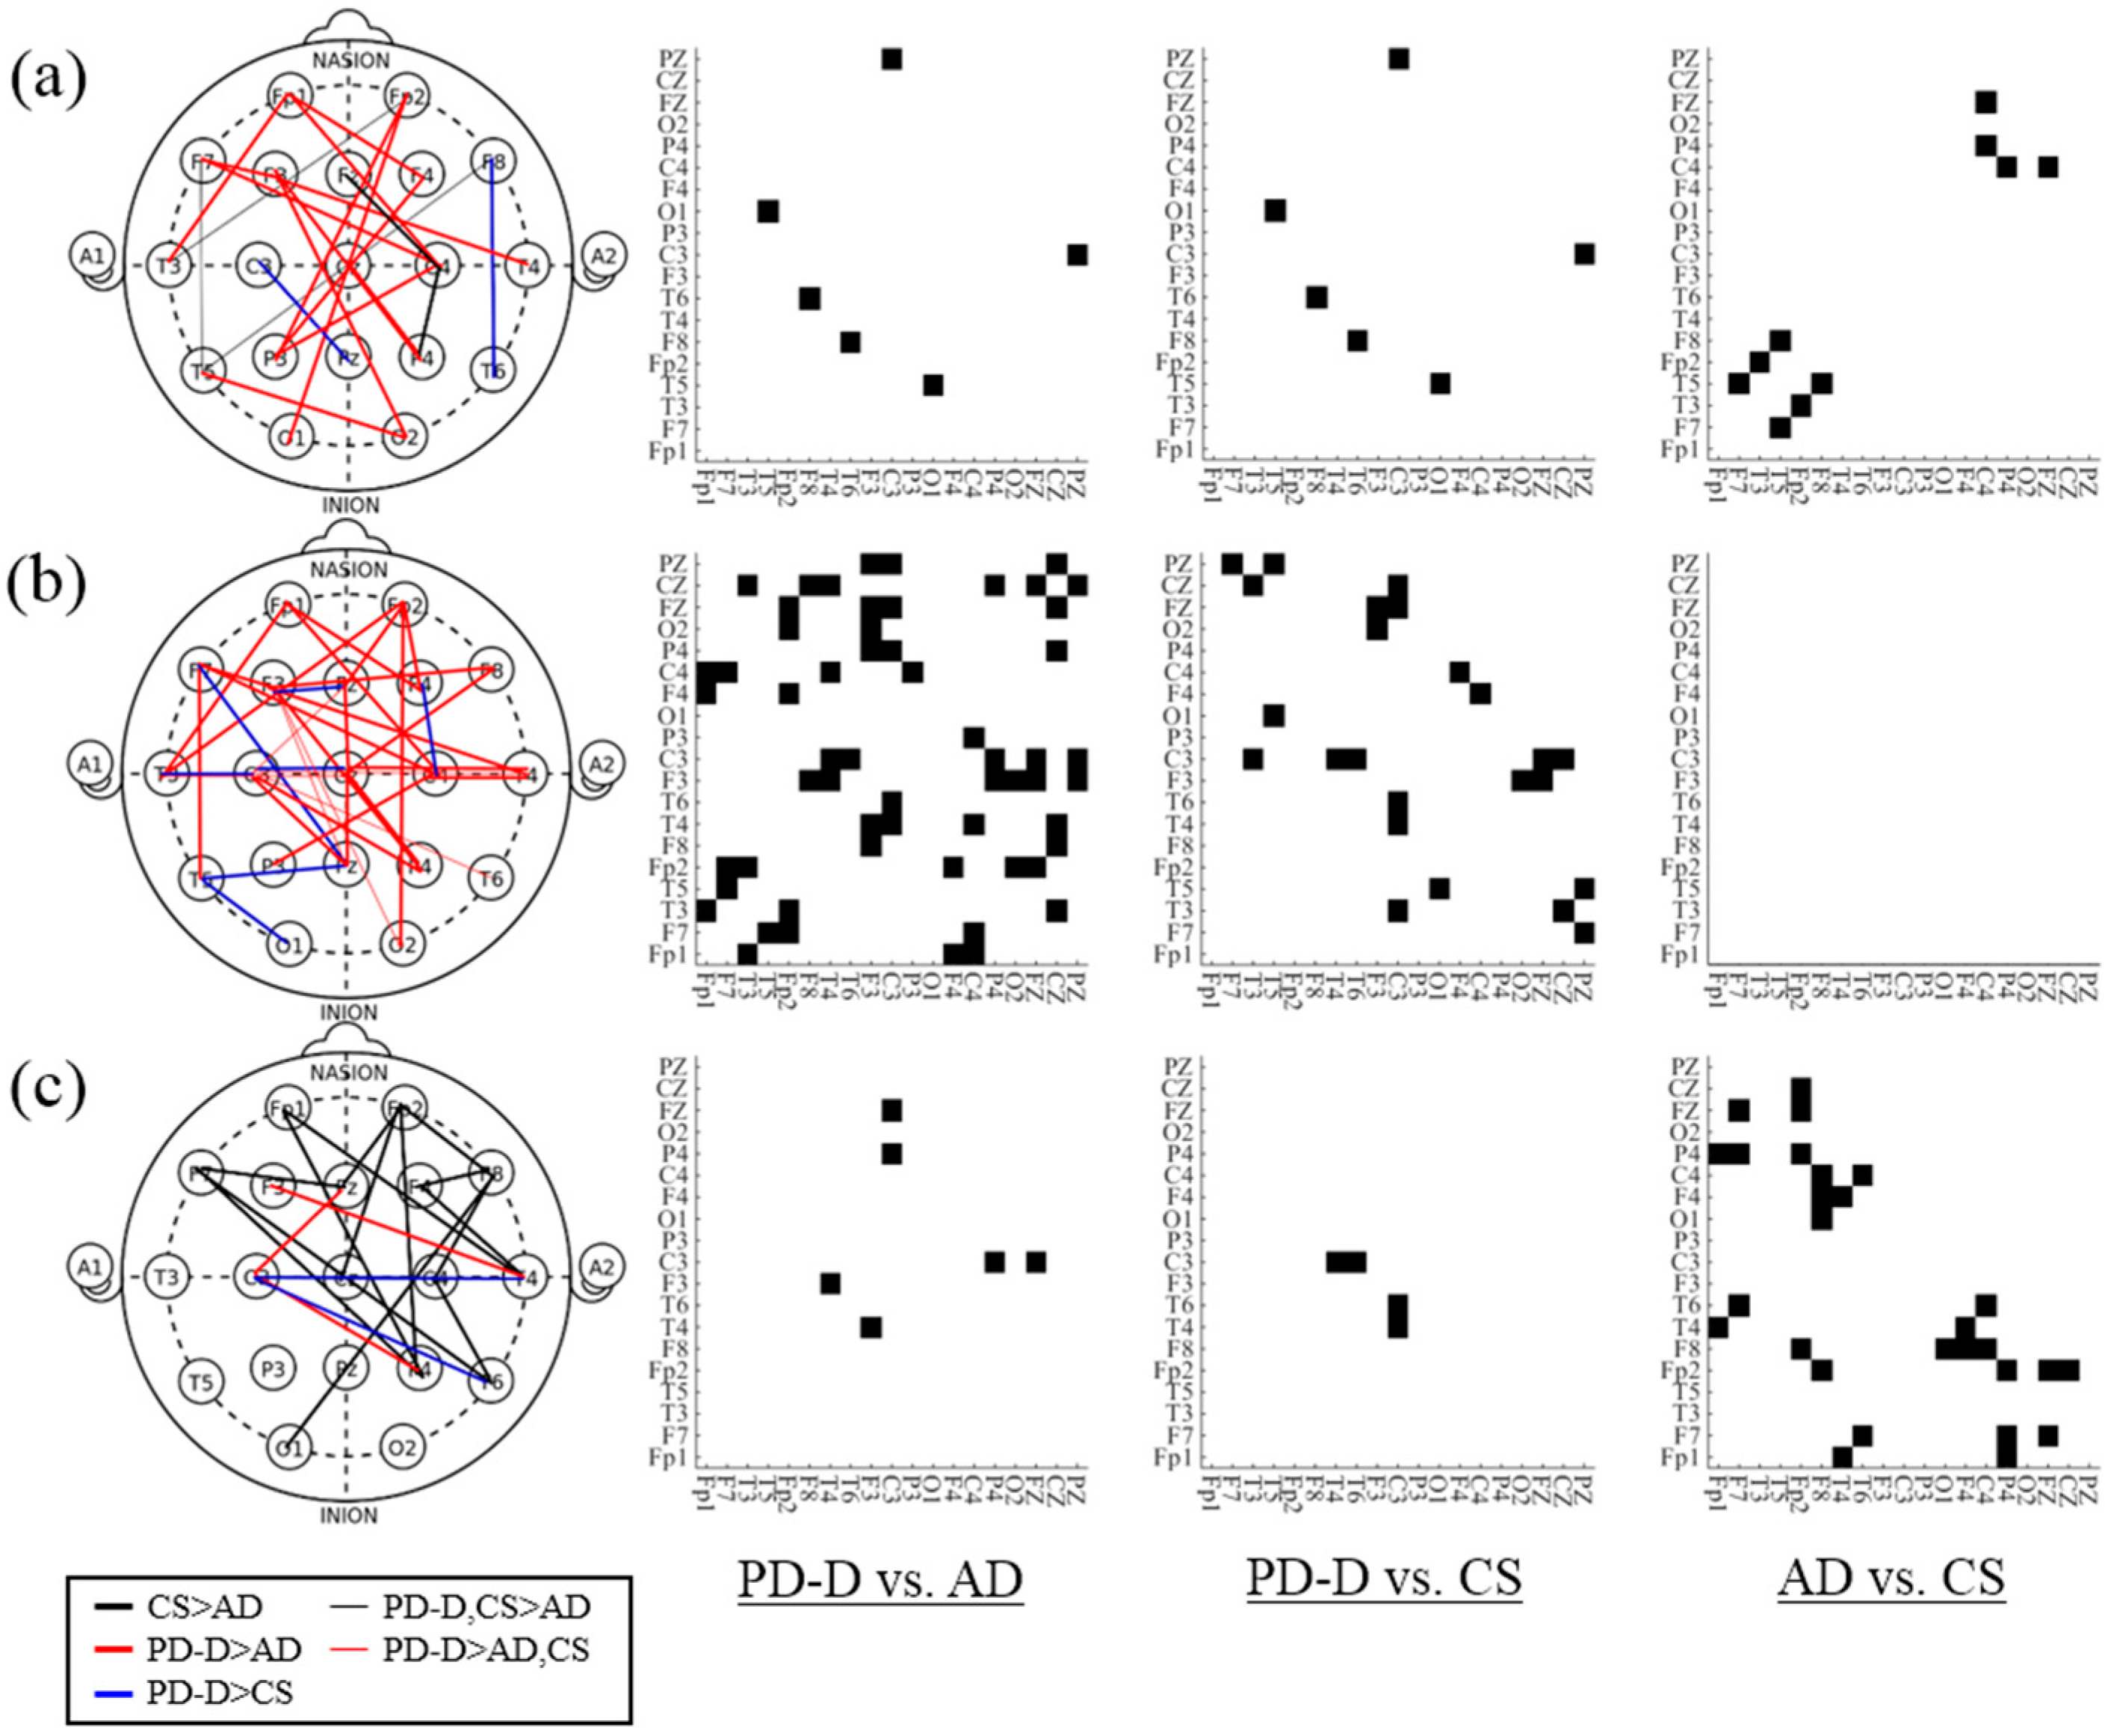
Overall, we found lower coherence values in AD patients than in PD-D patients and controls and higher coherence values in PD-D patients than in controls in a large number of channel pairs. Significantly different coherence patterns were found among the subject groups (
p < 0.05); these patterns were distinctly different at each frequency band. In particular, the PD-D and AD groups exhibited differences in the α frequency band (
Figure 3a). In the β frequency band, the PD-D patients’ WC values were higher than those of the AD patients, and some connections showed significant differences between the PD-D patients and the controls (
Figure 3b). In most of the connections in the α and β bands, the PD-D patients’ WC values were smaller than those of the AD patients. In the γ band, the AD patients’ WC values were lower than those of the controls (
Figure 3c).
Figure 2.
WC values corresponding to between-channel distances. Larger WC values were found in lower frequency bands, indicating that low-frequency components of EEG signals were more influenced by volume conduction effects. (blue line = δ, red line = θ, yellow line = α, purple line = β, green line = γ). (a) In the anterior-posterior comparison, WC values were largest between adjacent channel pairs and decreased as channels became more distant; (b) In the lateral-medial comparison, the largest WC values were found between symmetric channels; other WC values were similar regardless of distance (dist. = distance between channels).
Figure 3.
Connections with significant differences between the two patient groups for each band. For Bonferroni-corrected p-value < 0.05, the channel pairs were connected with different colored lines to indicate channel topography and marked in black on the adjacency matrix (CS: Control subjects, AD: AD patients, PD-D: PD-D patients). (a) In the α band, the connections in the PD-D group had larger WC values than those in the AD group; (b) In the β band, many of the connections in the PD-D group had larger WC values than those in the AD and control groups; (c) In the γ band, the AD group had lower WC values than those of the control groups.
After excluding adjacent channel pairs, connectivity distributions were examined to identify regional differences among the comparisons of the three groups (PD-D vs. AD, PD-D vs. CS, and AD vs. CS). Most of the connections that commonly exhibited significant difference among the three groups were related to temporal channels. However, the connectivity patterns of the increased WC values in the PD-D group and the decreased WC values in the AD group were slightly different. Most connections that had higher WC values in the PD-D group compared to the control and AD groups (PD-D > CS and PD-D > CS & AD) were temporo-parietal channel pairs. The WC values in the PD-D group were larger than those in the control group at F8-T6 in the α band, F7-PZ and T5-PZ in the β band, and T4-C3 and T6-C3 in the γ band. Furthermore, the WC values in the PD-D group were larger than those in both the controls and AD groups at T3-CZ, T4-C3, T6-C3, and F3-O2 in the β band. Otherwise, the decreased WC values in the AD group were mostly found in connections with frontal channels. The WC values in the AD group were smaller than those in both the control and PD-D groups at F7-T5, Fp2-T3, and F8-T5 in the α band. Relative to the control groups, the AD group had significantly smaller WC values at Fp1-T4, Fp1-P4, F7-T6, F7-P4, F7-FZ, Fp2-P4, Fp2-Cz, and F8-O1.
To evaluate the different connectivity pattern, we compared the mean WCs of separated channels. The following non-adjacent channels were selected for analysis: Fp1 and Fp2 in the frontal region, T3 and T4 in the temporal region, O1 and O2 in the occipital region, and CZ in the parietal region. Thus, fronto-temporal channel pairs, fronto-occipital channel pairs, fronto-parietal channel pairs, temporo-parietal channel pairs, tempo-occipital channel pairs, and occipito-parietal channel pairs were compared among the three patients groups after averaging their WC values (e.g., the WC values of FP1-T3 and FP2-T4 were averaged for the fronto-temporal comparison.). The mean WC values in the AD group were lower in the fronto-temporal connection in the α and β bands than those in the PD-D and AD groups. The mean WC values in the PD-D group were lower in the temporo-parietal connections in the β and γ bands than those in the AD and control group (
Table 3).
Table 3.
Comparison of PD-D, AD, and CS group EEGs with links between different regions. Channels were selected for separation to minimize the volume conduction effect. The mean WC values in the frontal region (Fp1, Fp2), temporal region (T3, T4), occipital region (O1, O2), and parietal region (CZ) were compared. (p-values lower than 0.05 were indicated in the bold type and *; * <0.05, ** <0.01, *** <0.001).
| | | PD-D | AD | CS | ANOVA F | ANOVA p-Value | PD-D vs. AD | PD-D vs. CS | AD vs. CS |
|---|
| Fronto-Temporal | α | 0.4482 | 0.3447 | 0.4228 | 8.22 | 0.0006 *** | 0.0006 *** | 1 | 0.0132 * |
| β | 0.3834 | 0.2864 | 0.3678 | 6.38 | 0.0028 ** | 0.0041 ** | 1 | 0.0201 * |
| γ | 0.3263 | 0.2613 | 0.3203 | 3.47 | 0.0362 * | 0.059 | 1 | 0.1015 |
| Fronto-Occipital | α | 0.2702 | 0.2574 | 0.2285 | 1.87 | >0.05 | - | - | - |
| β | 0.2393 | 0.2116 | 0.2014 | 1.23 | >0.05 | - | - | - |
| γ | 0.2290 | 0.2014 | 0.2015 | 0.91 | >0.05 | - | - | - |
| Fronto-Parietal | α | 0.2579 | 0.2557 | 0.2450 | 0.27 | >0.05 | - | - | - |
| β | 0.2350 | 0.2051 | 0.2206 | 1.17 | >0.05 | - | - | - |
| γ | 0.2046 | 0.1557 | 0.2170 | 3.20 | 0.0466 * | 0.1804 | 1 | 0.0580 |
| Temporo-Occipital | α | 0.3302 | 0.3183 | 0.2601 | 1.21 | >0.05 | - | - | - |
| β | 0.2838 | 0.2718 | 0.2190 | 1.25 | >0.05 | - | - | - |
| γ | 0.2712 | 0.2574 | 0.2027 | 1.50 | >0.05 | - | - | - |
| Temporo-Parietal | α | 0.2349 | 0.1884 | 0.2023 | 3.04 | 0.0537 | 0.0563 | 0.2874 | 1 |
| β | 0.2165 | 0.1528 | 0.1671 | 8.55 | 0.0005 *** | 0.0005 *** | 0.0093 ** | 1 |
| γ | 0.2008 | 0.1605 | 0.1576 | 4.78 | 0.0111 * | 0.0358 * | 0.0214 * | 1 |
| Occipito-Parietal | α | 0.4071 | 0.3169 | 0.4254 | 1.44 | >0.05 | - | - | - |
| β | 0.4005 | 0.3020 | 0.4102 | 1.64 | >0.05 | - | - | - |
| γ | 0.3864 | 0.3241 | 0.4229 | 1.38 | >0.05 | - | - | - |
3.3. Diagnostic Performance with Linear Discriminant Analysis
LDA was used to classify the EEGs of the three subject groups. A 10-fold cross-validation test was performed to avoid over-fitting. First, the three groups were classified using RWE values. As observed in
Section 3.1, RWE significantly differed between the PD-D/AD and control groups. It is important to select an adequate number of features to reduce computational cost and avoid over-fitting. Features were selected based on the ranking obtained from the FR, which has discriminant ability; for higher FR thresholds, fewer features were selected. Applying LDA model to the RWE values accurately separated the PD-D and AD groups from the normal controls (
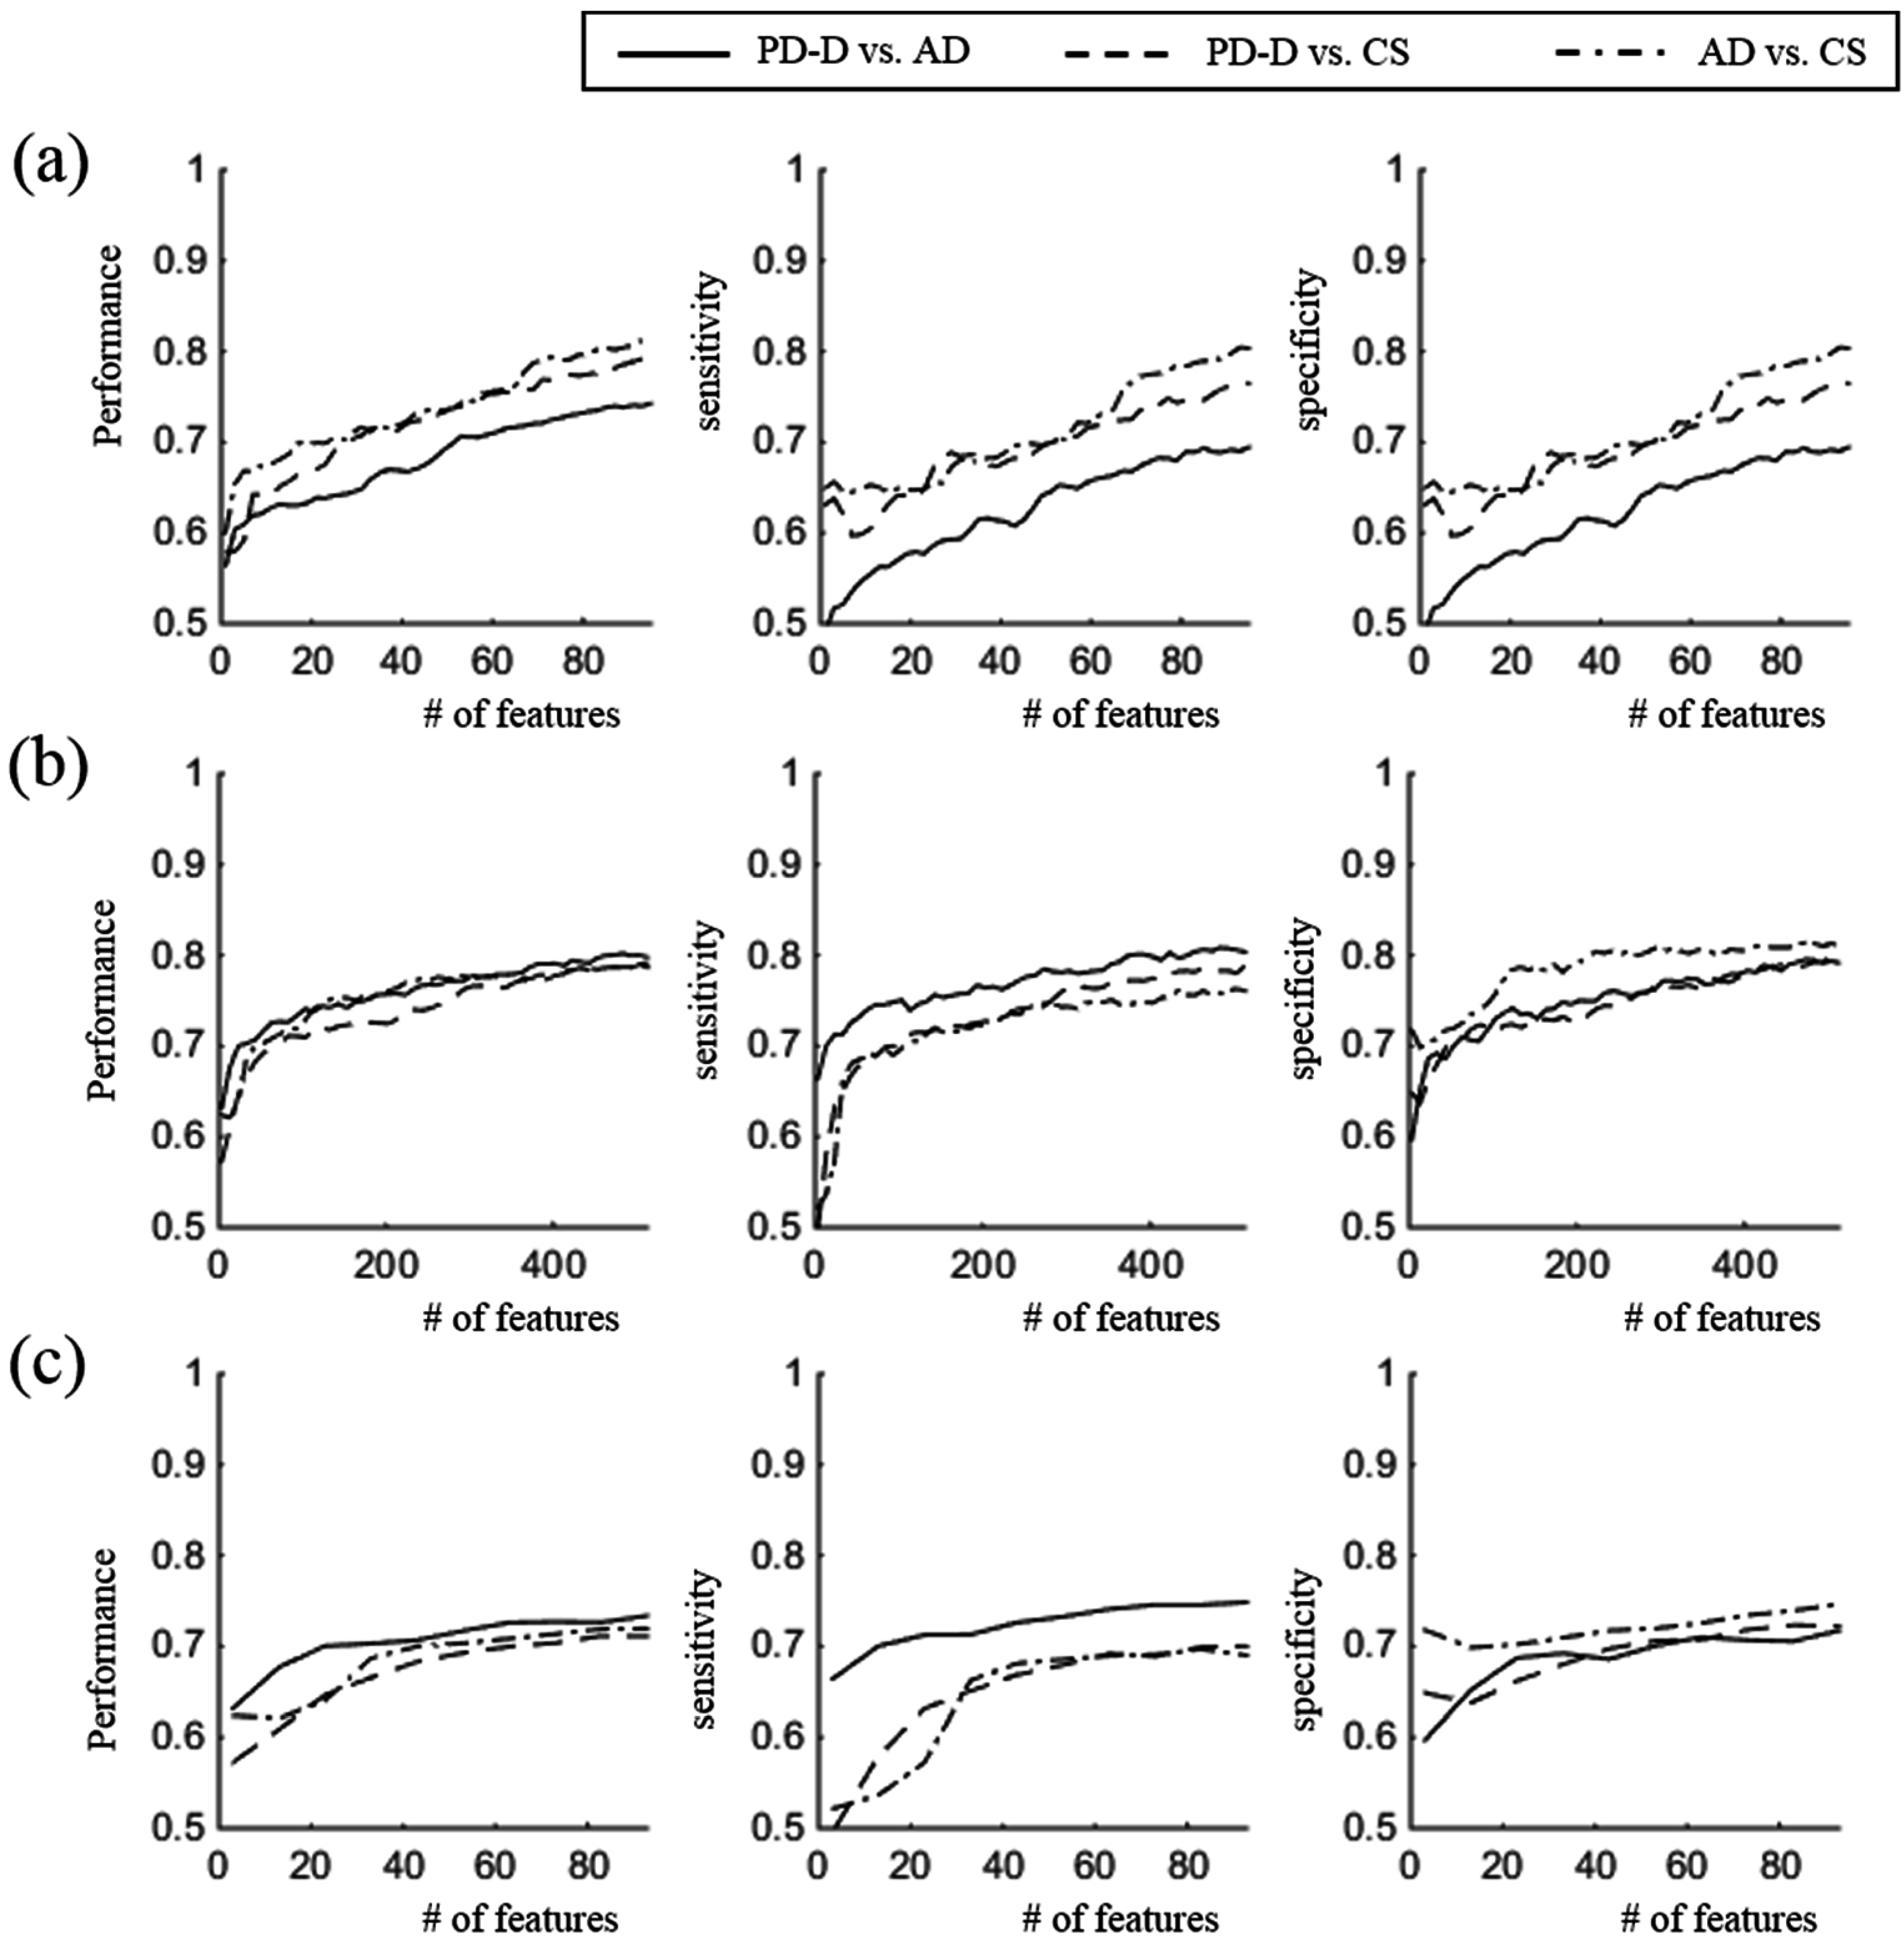
Figure 4a). The maximum accuracy when comparing the PD-D and CS groups was obtained was obtained when 93 out of 95 features were used; this value was 79.18% with 81.84% sensitivity and 76.49% specificity. The maximum accuracy when comparing the AD and CS groups was obtained when all features were used; this value was 81.25% with 82.25% sensitivity and 80.35% specificity. There was slightly lower accuracy in differentiating between the PD-D and AD groups than in the other comparisons. The optimal total performance was 74.30%, with specificity 69.47% and 78.78% sensitivity. In this case, the sensitivity was based on the rate of correctly classified PD-D data, and the specificity was based on the rate of correctly classified AD data. LDA of the WC values produced similar results among the three comparisons (
Figure 4b). When the same number of features was used, the total performance and sensitivity had slightly higher values in the comparisons of the PD-D
vs. AD groups than in the other comparisons, and there was slightly greater in the comparison of the AD
vs. CS groups than in the other comparisons. The optimal performance in the comparison of the PD-D
vs. AD groups was 80.19% when 483 features out of 513 features were used, with 80.83% sensitivity and 79.50% specificity. The optimal performance in the comparison of the PD
vs. CS groups was 79.16 % when all features were used, with 78.83% sensitivity and 79.50% specificity. The optimal performance in the comparison of the AD
vs. CS groups was 78.69% when all features were used, with 76.09% sensitivity and 81.09% specificity. When only 95 WC values were used, there was less accuracy than that produced when using the RWE values (73.35% for PD-D
vs. AD, 71.11% for PD-D
vs. CS, and 71.94% for AD
vs. CS;
Figure 4c).
Figure 4.
Diagnostic performance of LDA. (a) Diagnostic accuracy when using RWE values; (b) Diagnostic accuracy when using WC values; (c) Diagnostic accuracy when using WC values while limiting the number of features to 95. (Left: Total Performance; Middle: Sensitivity; Right: Specificity).
Figure 4.
Diagnostic performance of LDA. (a) Diagnostic accuracy when using RWE values; (b) Diagnostic accuracy when using WC values; (c) Diagnostic accuracy when using WC values while limiting the number of features to 95. (Left: Total Performance; Middle: Sensitivity; Right: Specificity).
4. Discussion
The current study has investigated energy distributions across EEG frequencies in PD-D patients, AD patients, and age-matched healthy subjects. When calculating the RWE via discrete wavelet transform, smaller values were found in PD-D and AD patients vs. controls; this difference indicates slowed oscillatory activity due to cognitive decline. The WC between multiple channel pairs at each band showed decreased connectivity in the AD patients and increased connectivity in the PD-D patients compared with the healthy controls. In particular, in the AD patients, lower WC was primarily observed in the links related to the frontal lobes in the γ band; conversely, in the PD-D patients, higher WC was primarily observed in the temporo-parietal links in the α and β bands. The lower WC in the AD patients might have resulted from a collapse of functional connectivity, particularly in frontal regions.
Decreased β and γ frequency energy and increased θ frequency energy was observed in the PD-D and AD patients, indicating these patients underwent a slowing of brain oscillatory activity, which is consistent with previous reports [
8,
9,
10,
11,
12,
13,
14,
15,
16]. Slow EEG activity implies that neural activity in the information processing of the brain has become less complex and thus simpler dynamics exist in brains cognitively impaired by dementia. In a longitudinal study that utilized magnetoencephalography (MEG), peak frequency decreased as time progressed, while θ power increased, and α1 and α2 powers decreased [
10]. The referenced study indirectly revealed that slowed brain activity correlates with cognitive decline by longitudinally examining initially non-demented PD patients. Follow-up studies reported that the subjects possessing low background rhythm frequency (grand median < 8.5 Hz) were at much higher risk of developing dementia than the subjects with high background rhythm frequency [
14]. The above studies suggest that slow oscillatory activity is associated with cognitive decline. In another study of EEG patterns in PD-D patients, PD-MCI patients, and control subjects, a significant correlation between short grant total EEG (GTE) score and cognitive decline was found [
11].
In the current study, similar slow EEG oscillations were exhibited in both patient groups when comparing RWE values. In particular, in most channels, significantly decreased β energy was found in both the PD-D and AD groups. The total mean over all channels also showed significant differences (Bonferroni-corrected
p < 0.05). The group means of the frontal, parietal, and occipital regions were significantly smaller in the PD-D and AD groups than in the control group, as was the mean in the β frequency band (
Figure 1). In addition, significantly higher θ energy was found in posterior channels in the PD-D group compared with the control group. The group means in the occipital region (P3, P4, PZ, O1 and O2) were significantly smaller in the PD-D group than in the control group, but there were no significant differences between the AD and CS groups (
Figure 1). In the PD-D patients, the highly decreased RWE values in the posterior channels can be associated with hypoperfusion in the occipital lobes and cerebellum [
7]. Occipital hypofunction may be associated with abnormal saccadic eye movements or hemispatial neglect, both of which frequently occur in PD-D patients [
34,
35,
36]. Few studies have compared AD and PD patients. As described above, the EEG patterns produced by both diseases show similar slow oscillatory activity. Several studies have reported differences in central and posterior spectral power between PD-D and AD patients. The dominant frequency power in the α band was slightly lower in the posterior electrodes in DLB and PD-D patients compared with AD patients [
21]. Source analysis using LORETA showed that the PD-D group had abnormal central δ sources and posterior θ and β sources compared with the AD and control groups [
20]. In these regions, the PD-D patients exhibited increased δ and θ power and decreased β power, which indicates slow EEG activity. When comparing AD patients, PD-D patients, PD patients without dementia, and controls, the highest δ and θ powers were observed in the PD-D patients and the lowest δ and θ powers were found in the controls (PD-D > AD > PD > CG) [
22]. Similar patterns of highest δ energy and lowest α, β and γ energy in PD-D patients were observed in the current study. However, there was no significant difference in discriminant ability between the PD-D and AD groups.
WC was measured to investigate functional connectivity in the brains of PD-D and AD patients. To avoid the volume conduction effect, we excluded the WC results corresponding to the δ and θ frequency bands (
Figure 2) [
31,
32]. When performing an EEG, decreased coherence reflects reduced functional connections between the brain regions lying underneath the electrodes. Decreased WC was observed in the AD patients, and increased WC was observed in the PD-D patients in most channel pairs at most frequency bands (
Figure 3). In particular, in the AD patients, decreased WC was primarily observed in the frontal region in the γ band. In the PD patients increased WC was primarily observed in the temporo-parietal links in the α and β bands. Previous studies on AD patients have shown decreased coherence in the α and β bands in both close and distant channel pairs. Decreased coherence might be associated with cognitive impairment [
15,
37,
38]. This weakened connectivity is likely the result of disconnection of synaptic coupling due to the loss of acetylcholine, a neurotransmitter in the brain [
39]. A significant decrease in WC was found in AD patients at temporocentral regions in the δ band and at parietal-central regions in the θ and α bands [
40]. Mutual information analysis also showed that connections between the frontal and antero-temporal regions are weaker in AD patients [
41]. Recent coherence studies using complex network analysis also support collapsed connectivity in the θ and α frequency bands [
42,
43]. Interestingly, in contrast to the decreased connectivity observed in AD patients, coherence increased in the θ, high β, and γ frequency bands in PD patients [
44,
45]. In the MEG study, low-α coherence (8–10 Hz) increased in the early stages of PD, while θ, high α, and β coherence increased in patients with severe PD [
46]. In comparing coherence among AD patients, PD-D patients, PD patients without dementia, and controls, β frontal-occipital inter-hemispheric coherence and α and β frontal inter-hemispheric coherence were found to be increased in PD-D patients and decreased in AD patients [
23]. The increased coherence in PD patients suggests that abnormal synchronization in basal ganglia output and thalamo-cortical coherence occur in PD [
47,
48]. Similar patterns of decreased coherence in AD patients and increased coherence in PD-D patients were observed in the current study. In particular, decreased WC was primarily found in the γ band, while increased WC was primarily found in the α and β bands (
Figure 3). In addition, in AD patients, decreased WC was primarily observed in links related to frontal region; in PD-D patients, increased WC was primarily observed in temporo-parietal links. To examine connectivity patterns, the mean WC values of different regions were compared (
Table 3). To minimize contamination from the volume conduction effect, the following representative non-adjacent channels in each region were selected: Fp1 and Fp2 in the frontal region, T3 and T4 in the temporal region, O1 and O2 in the occipital region, and CZ in the parietal region. Then, the fronto-temporal channel pairs, fronto-occipital channel pairs, fronto-parietal channel pairs, temporo-parietal channel pairs, tempo-occipital channel pairs, and occipito-parietal channel pairs were compared across all three groups. The mean WC values in the AD patients were lower in the fronto-temporal connection in the α and β bands than those in the PD-D and control groups. In the temporo-parietal connection in the β and γ bands, the mean WC values in the PD-D group were larger than those in the AD and control groups. The lower WC in the AD patients might imply that the neuronal path related to the frontal lobes is functionally broken in these patients either due to a loss of neurotransmitters or from other causes [
15,
39]. Because higher WC was found in temporo-parietal channel pairs in the PD-D group, this abnormal synchrony might result from impairment of the sensorimotor cortex. Abnormal synchrony might cause motor symptoms such as tremors [
36,
49]. Several studies have reported that high WC might result from synchrony of thalamo-cortical oscillatory activity due to the deterioration of the substantia nigra in PD patients [
45,
46].
The discriminant abilities of RWE and WC among the PD-D patients, AD patients, and controls were evaluated using LDA. RWE measurement, which is similar concept to spectral density estimation using fast Fourier transform, is a good method of differentiating dementia patients, including those with PD-D and AD, from normal subjects because dementia patients have slower EEG activity than normal subjects. However, RWE values alone are not sufficient to differentiate between PD-D and AD. Alternatively, WC, which was increased in PD-D patients and decreased in AD patients, is a good candidate for distinguishing the two diseases. The performances of PD-D patients
vs. control and AD patients
vs. controls in this study were relatively lower than in previous studies, which have shown 100% accuracy (AD
vs. controls) using probabilistic neural networks [
50]; 97% (AD
vs. controls), 93.6% (AD-MCI
vs. controls), and 97% (AD
vs. AD-MCI) accuracy using coherence networks [
51], and 80% (PD
vs. PD-MCI) using β peak frequency, α relative power, and α/θ power [
24]. However, it should be noted that no previous studies have distinguished between EEG of AD patients and PD-D patients as well as between EEG of PD patients and elderly healthy subjects. Because the prognoses and treatments for AD and PD-D are completely different, differentiation between the two diseases, which was the aim of this study, is clinically required. Severe PD usually accompanies dementia symptoms, which can be subdivided into PD-D, diffuse DLB, and PD with AD. To date, differentiating between these diseases has been a controversial undertaking [
3,
52]. In addition, there are many common motor symptoms between PD patients and AD patient as the latter begin to deteriorate [
53]. Therefore, it is difficult to distinguish between PD-D and AD in hospitalized patients with advanced disease based on clinical signs alone. Analyzing differences in EEG coherences, which we found to be decreased in AD patients and increased in PD-D patients, may help in this differentiation.
In the current study, the discriminant abilities of the different measurements used were not as robust as those in other studies. This limitation may potentially be an artifact of the data because our previous studies using the same measurement with the current dataset also showed fewer significant differences than those in other reports. We speculate that improved methods of analysis and consistent data collection may solve this problem. Although the smaller RWE values in the PD-D and AD groups, smaller WC values in the AD group, the larger WC in the PD-D group were statistically significant and could be used for classification, there is a potential risk of over-fitting because the training subjects and test subjects were equal. It is difficult to identify a global standard with exact parameters owing to the subject individuality of EEG results. In the future, complex network analysis and the application of advanced machine learning techniques, such as neural networks, should be applied to improve the performance of the classification. Additionally, different types of PD, including PD-MCI and PD-D, should be examined after collecting sufficient samples in each dataset.


