Article

Effect of a Percutaneous Coronary Intervention Procedure on Heart Rate Variability and Pulse Transit Time Variability: A Comparison Study Based on Fuzzy Measure Entropy

1
Affiliated Shandong Provincial Qianfoshan Hospital, Shandong University, Jinan 250014, China
2
School of Control Science and Engineering, Shandong University, Jinan 250061, China
3
School of Computer Science and Technology, Shandong University, Jinan 250100, China
*
Authors to whom correspondence should be addressed.
Submission received: 11 April 2016 / Revised: 22 June 2016 / Accepted: 24 June 2016 / Published: 9 July 2016
(This article belongs to the Special Issue Entropy on Biosignals and Intelligent Systems)

Abstract

:
Percutaneous coronary intervention (PCI) is a common treatment method for patients with coronary artery disease (CAD), but its effect on synchronously measured heart rate variability (HRV) and pulse transit time variability (PTTV) have not been well established. This study aimed to verify whether PCI for CAD patients affects both HRV and PTTV parameters. Sixteen CAD patients were enrolled. Two five-minute ECG and finger photoplethysmography (PPG) signals were recorded, one within 24 h before PCI and another within 24 h after PCI. The changes of RR and pulse transit time (PTT) intervals due to the PCI procedure were first compared. Then, HRV and PTTV were evaluated by a standard short-term time-domain variability index of standard deviation of time series (SDTS) and our previously developed entropy-based index of fuzzy measure entropy (FuzzyMEn). To test the effect of different time series length on HRV and PTTV results, we segmented the RR and PTT time series using four time windows of 200, 100, 50 and 25 beats respectively. The PCI-induced changes in HRV and PTTV, as well as in RR and PTT intervals, are different. PCI procedure significantly decreased RR intervals (before PCI 973 ± 85 vs. after PCI 907 ± 100 ms, p < 0.05) while significantly increasing PTT intervals (207 ± 18 vs. 214 ± 19 ms, p < 0.01). For HRV, SDTS-only output significant lower values after PCI when time windows are 100 and 25 beats while presenting no significant decreases for other two time windows. By contrast, FuzzyMEn gave significant lower values after PCI for all four time windows (all p < 0.05). For PTTV, SDTS hardly changed after PCI at any time window (all p > 0.90) whereas FuzzyMEn still reported significant lower values (p < 0.05 for 25 beats time window and p < 0.01 for other three time windows). For both HRV and PTTV, with the increase of time window values, SDTS decreased while FuzzyMEn increased. This pilot study demonstrated that the RR interval decreased whereas the PTT interval increased after the PCI procedure and that there were significant reductions in both HRV and PTTV immediately after PCI using the FuzzyMEn method, indicating the changes in underlying mechanisms in cardiovascular system.

Graphical Abstract

1. Introduction

Heart rate variability (HRV) refers to the variability of RR intervals between successive sinus beats, which results from the impact of the autonomic nervous system tone on sinus node function [1]. Pulse transit time (PTT) is the interval from the R wave peaks to the feet of the corresponding pulse in the same cardiac cycle [2] and its variability, i.e., pulse transit time variability (PTTV), can also provide insight into the inherent mechanisms of the cardiovascular system. Physiological time series variability has been shown to have the potential to predict cardiovascular diseases [3,4]. Moreover, due to either the fact that it is a time-consuming technique associated with long-term physiological signal recordings or a lack of standardization of diagnostic methods as well as some technical difficulties for variability analysis, short-term measures lasting 2 to 15 min have been welcomed in clinical practice [5]. New analysis methods as well as possibilities for their more common application in clinical practice have been sought [6,7,8].
It has been shown that HRV indices decrease after a percutaneous coronary intervention (PCI) procedure [3] and this drop is accompanied by an increased sympathetic tone [9]. Studies have invariably demonstrated that coronary artery bypass grafting (CABG) also leads to significant HRV reduction [10,11,12,13]. In addition, HRV reduction after cardiac surgery is not exclusively related to PCI or CABG, as it is also recorded in patients undergoing valve surgery [14]. However, opposite conclusions still exist to show the HRV reduction after PCI is not significant [15]. Consequently, the first aim of this study is to test the effect of the PCI procedure on the HRV changes in coronary artery disease (CAD) patients. If the HRV parameters change a lot between before and after the PCI procedure, the clinical attention should be paid for the measurement time point for the HRV indices. This means the comparison of HRV parameters before and after the PCI procedure is important in clinical application.
Another motivation of this study is based on the fact that no related studies exist for exploring the effects of PCI on PTT interval and PTTV results, and thus to reveal the PCI effect on peripheral circulation. Peripheral circulation plays a fundamental role in the pathophysiology of the cardiovascular diseases. A better understanding of the change in mechanical properties of peripheral arteries is of particular importance because modest changes in ventricular function can have profound haemodynamic and clinical effects [16,17]. Wagner et al. reported that PTT measured from ECG to the finger PPG can indicate the impaired ventricular-arterial coupling [18]. This study will synchronously record the ECG and finger PPG signals and aims to reveal the PCI-induced changes in PTT and PTTV.
As for the variability analysis methods, entropy-based measures have been widely used in the past few decades, typically approximate entropy (ApEn) [19] and sample entropy (SampEn) [20]. Entropy measures could provide a valuable tool for quantifying the regularity of physiological time series and provide important insights into the underlying mechanisms of the cardiovascular system [19,20]. However, recent studies find ApEn and SampEn measures have poor statistical stability for the HRV analysis [21,22,23], so fuzzy theory-based entropy methods have been developed [7,8,24,25]. We previously proposed a fuzzy measure entropy (FuzzyMEn) method [7,24]. The essential difference between the FuzzyMEn and traditional entropy methods is that ApEn and SampEn both use the Heaviside function as the decision rule for vector similarity, whereas FuzzyMEn uses the fuzzy function. The rigid membership degree determination in Heaviside function could induce the weak consistency of ApEn and SampEn, which means that the entropy value may have a sudden change when threshold parameter r changes slightly. This phenomenon has been reported in recent studies [7,8,24]. For FuzzyMEn, this determination criterion exhibits the gentle boundary effect. Also, FuzzyMEn uses the information from both local and global vector sequences by removing both local baseline and global mean values, which means that FuzzyMEn have better consistency than ApEn and SampEn. In this study, we will employ our previously developed FuzzyMEn method to test the PCI effect on short-term (5 min) HRV and PTTV. In addition, considering that it is difficult to acquire large time series during practical measurement, the ability of a variability measure for analyzing relatively short time series is critical for clinical applications. This is especially true for studies with pathological populations that are limited in their clinical measurement.
This study therefore aimed to verify whether the CAD patients undergoing PCI affects both HRV and PTTV parameters. Meanwhile, we used different time windows to segment the RR and PTT time series for HRV and PTTV analysis, aiming to test the effect of different time series lengths on HRV and PTTV parameters.

2. Methods

2.1. Subjects

A total of 16 CAD patients with coronary artery stenosis (13 males and 3 females, aged between 44 and 80) were enrolled in this study. All patients received typical medical treatment for CAD. Routine ECG and echocardiography examinations were implemented. The patients were confirmed by coronary angiography, and they all had at least one main coronary branch stenosed for over 50%. Coronary angioplasty was performed according to the well-established PCI standards. A PCI procedure was considered successful if the presence of residual stenosis is not exceeding 20% and no complications during either the procedure or in-hospital stay. All patients gave their informed consent. The study obtained full approval from the Institutional Review Board of Shandong Provincial Qianfoshan Hospital. The basic characteristics of the patients are shown in Table 1.

2.2. Protocol

Measurements were undertaken in a quiet and temperature controlled (25 ± 3 °C) room at Shandong Provincial Qianfoshan Hospital and were performed within 24 h before and after the PCI intervention operation. Standard limb II-lead ECG and fingertip photoplethysmography (PPG) signals were synchronously recorded for about 5 min using the Signal Synchronous Acquisition Card NI PCI-6123 by the National Instruments Corporation (Austin, TX, USA). The sampling frequency is 1000 Hz. Table 2 shows the detailed moments for each 5 min signal measurement before and after the PCI procedure. In addition, the patients were asked to lie supine on a measurement bed for a 10 min rest period to allow cardiovascular system stabilization. ECG electrodes were attached to the right wrist and the right and left ankles to acquire a standard limb lead-II ECG. A photoelectric sensor was attached to the left forefinger tip to acquire fingertip PPG waves. During the signal measurement, the patients were asked to breathe peacefully.

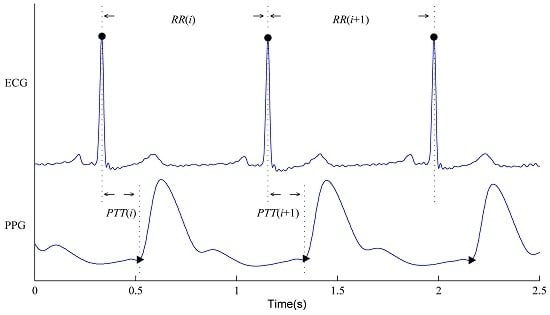
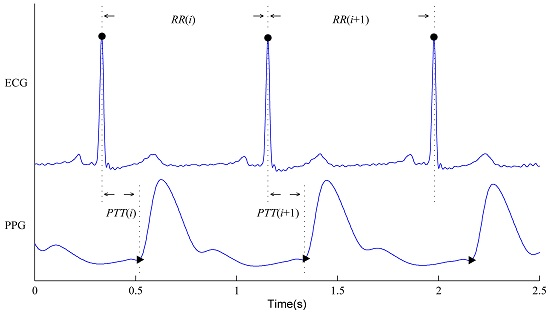
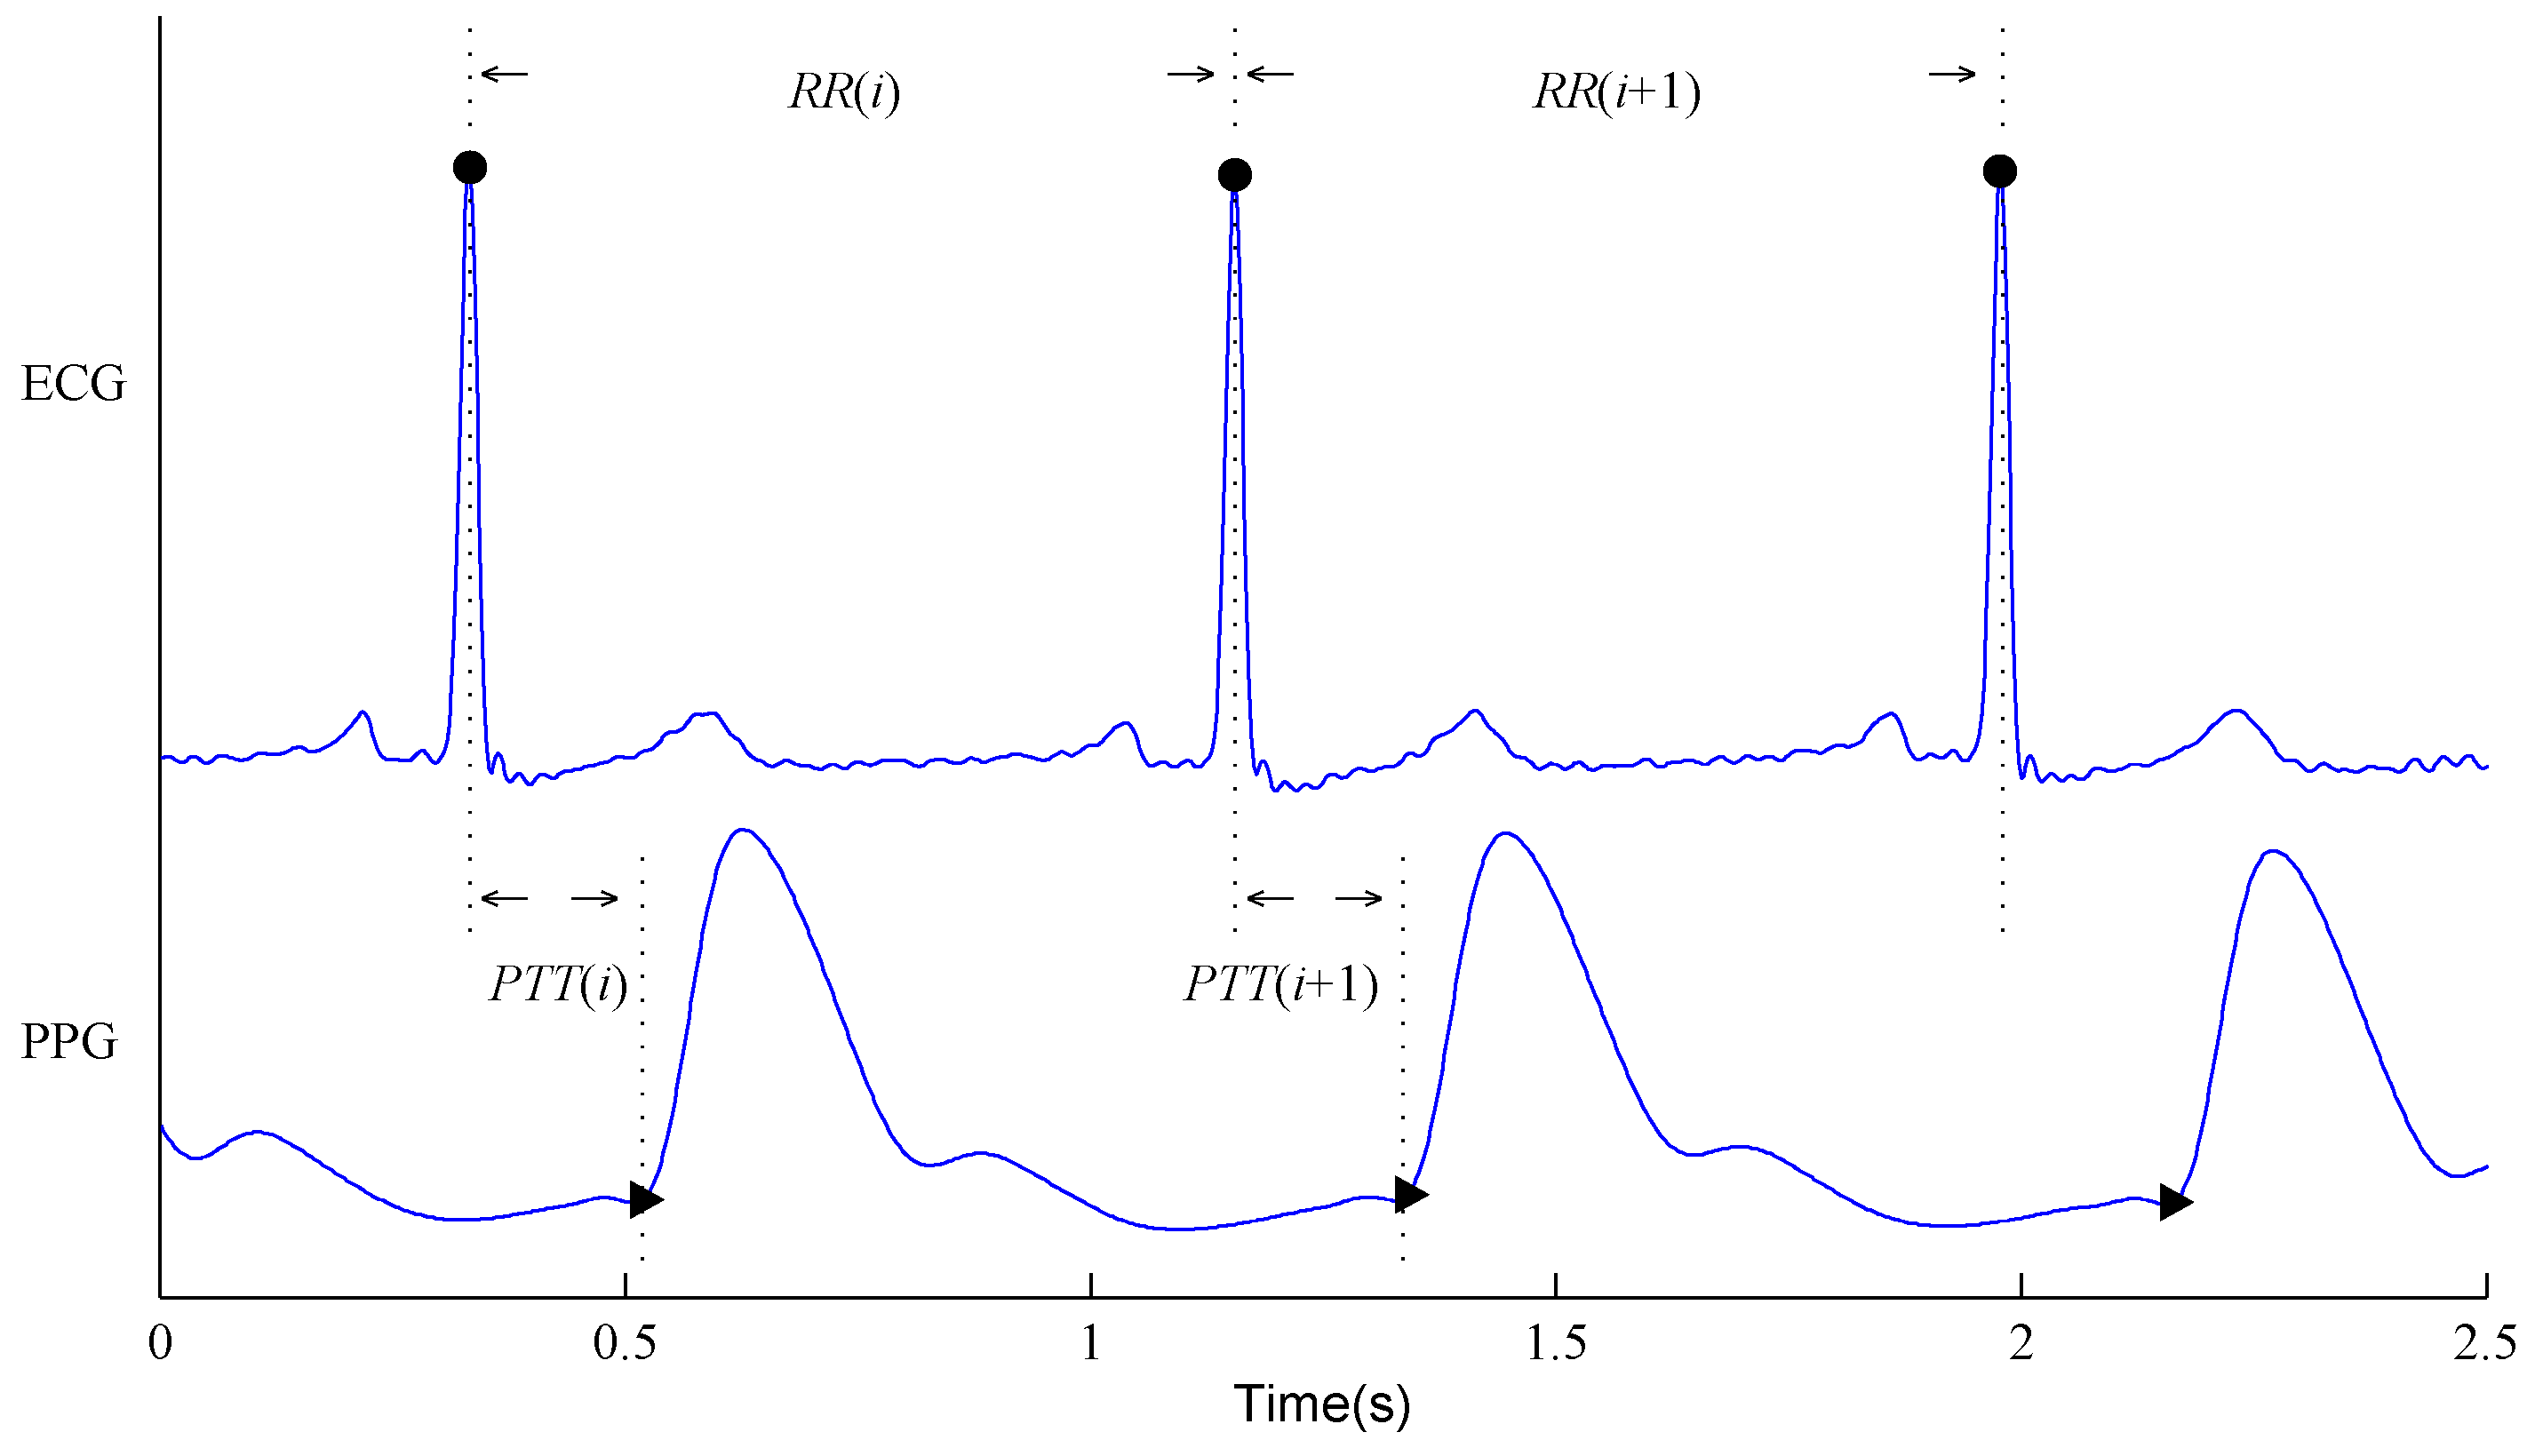
2.3. RR and PTT Series Construction

Figure 1 gives a demonstration of the synchronously recorded ECG and PPG signals. First, the slow varying components (0–0.05 Hz) were removed from the ECG and PPG signals; second, R-wave peaks of ECG signals were extracted by a template-matching procedure [26]. Ectopic beats were identified and excluded using our previously developed method [27]. After the location of R-wave peaks, the corresponding pulse feet (start points of PPG pulse) were found by the first-order differential signals [28]. Finally, RR time series were obtained from the adjacent R-wave peaks and pulse transit time (PTT) time series were obtained from the R wave peaks to the feet of the corresponding pulse in the same cardiac cycle [2]. The construction approach of RR and PTT time series are shown in Figure 1. A manual check was also performed to ensure the anomalous intervals due to ectopic beats or poor signal quality were removed from the RR and PTT time series.
Figure 2 shows the examples of the RR time series from before (a) and after (b) PCI procedure, as well as the corresponding scatter plots (c and d) for the two RR time series respectively. The initial 200 heart beats are shown in Figure 2. Figure 3 shows similar examples for the PTT time series from before and after the PCI procedure.

2.4. Variability Indices for HRV and PTTV

The RR and PTT time series were firstly 50% overlapped segmented into several segments using four types of different time window (n = 200, 100, 50 and 25 beats respectively), permitting the variability results from different time windows to be observed. Then, two variability indices, i.e., a standard short-term time-domain variability index of standard deviation of time series (SDTS) [1] and our recently developed entropy-based measure of fuzzy measure entropy (FuzzyMEn) [7,24], were employed for the HRV and PTTV analysis. The detailed calculation processes of SDTS and FuzzyMEn can be referred in the Appendix.
The reason for choosing the SDTS and FuzzyMEn is that common time- and frequency-domain HRV indices have been widely used for exploring the inherent changes of RR time series in different situations. In the current study, we aimed to test the efficiency of the FuzzyMEn method of measuring the changes of RR and PTT time series after PCI procedure, especially on the PTT time series since the previous studies hardly involved the analysis of PTTV. We used the common HRV index of SDTS as the comparable index because this index can show the variability of the time series and can be easily understood.

2.5. Statistical Analysis

First, the individual RR (or PTT) interval was obtained from the mean of the RR (or PTT) time series for each patient. The RR and PTT intervals from before PCI procedure were compared with those from after PCI procedure to observe the corresponding changes due to the PCI procedure. Then, the two variability indices of SDTS and FuzzyMEn were calculated for both RR and PTT time series for each patient, separately by the four types of the time windows. For each time window, the SDTS and FuzzyMEn values were obtained from the mean of the results from the several RR and PTT segments.
The results (RR interval, PTT interval, SDTS and FuzzyMEn) from before and after PCI procedure were tested if they are normal distributions by the Kolmogorov–Smirnov test. If they met the normal distribution, the paired t-test was used to test the statistical difference before and after PCI procedures. If not, a non-parametric test was used. All statistical analyses were performed using the SPSS software (Version 20). Statistical significance was set a priori at p < 0.05.

3. Results

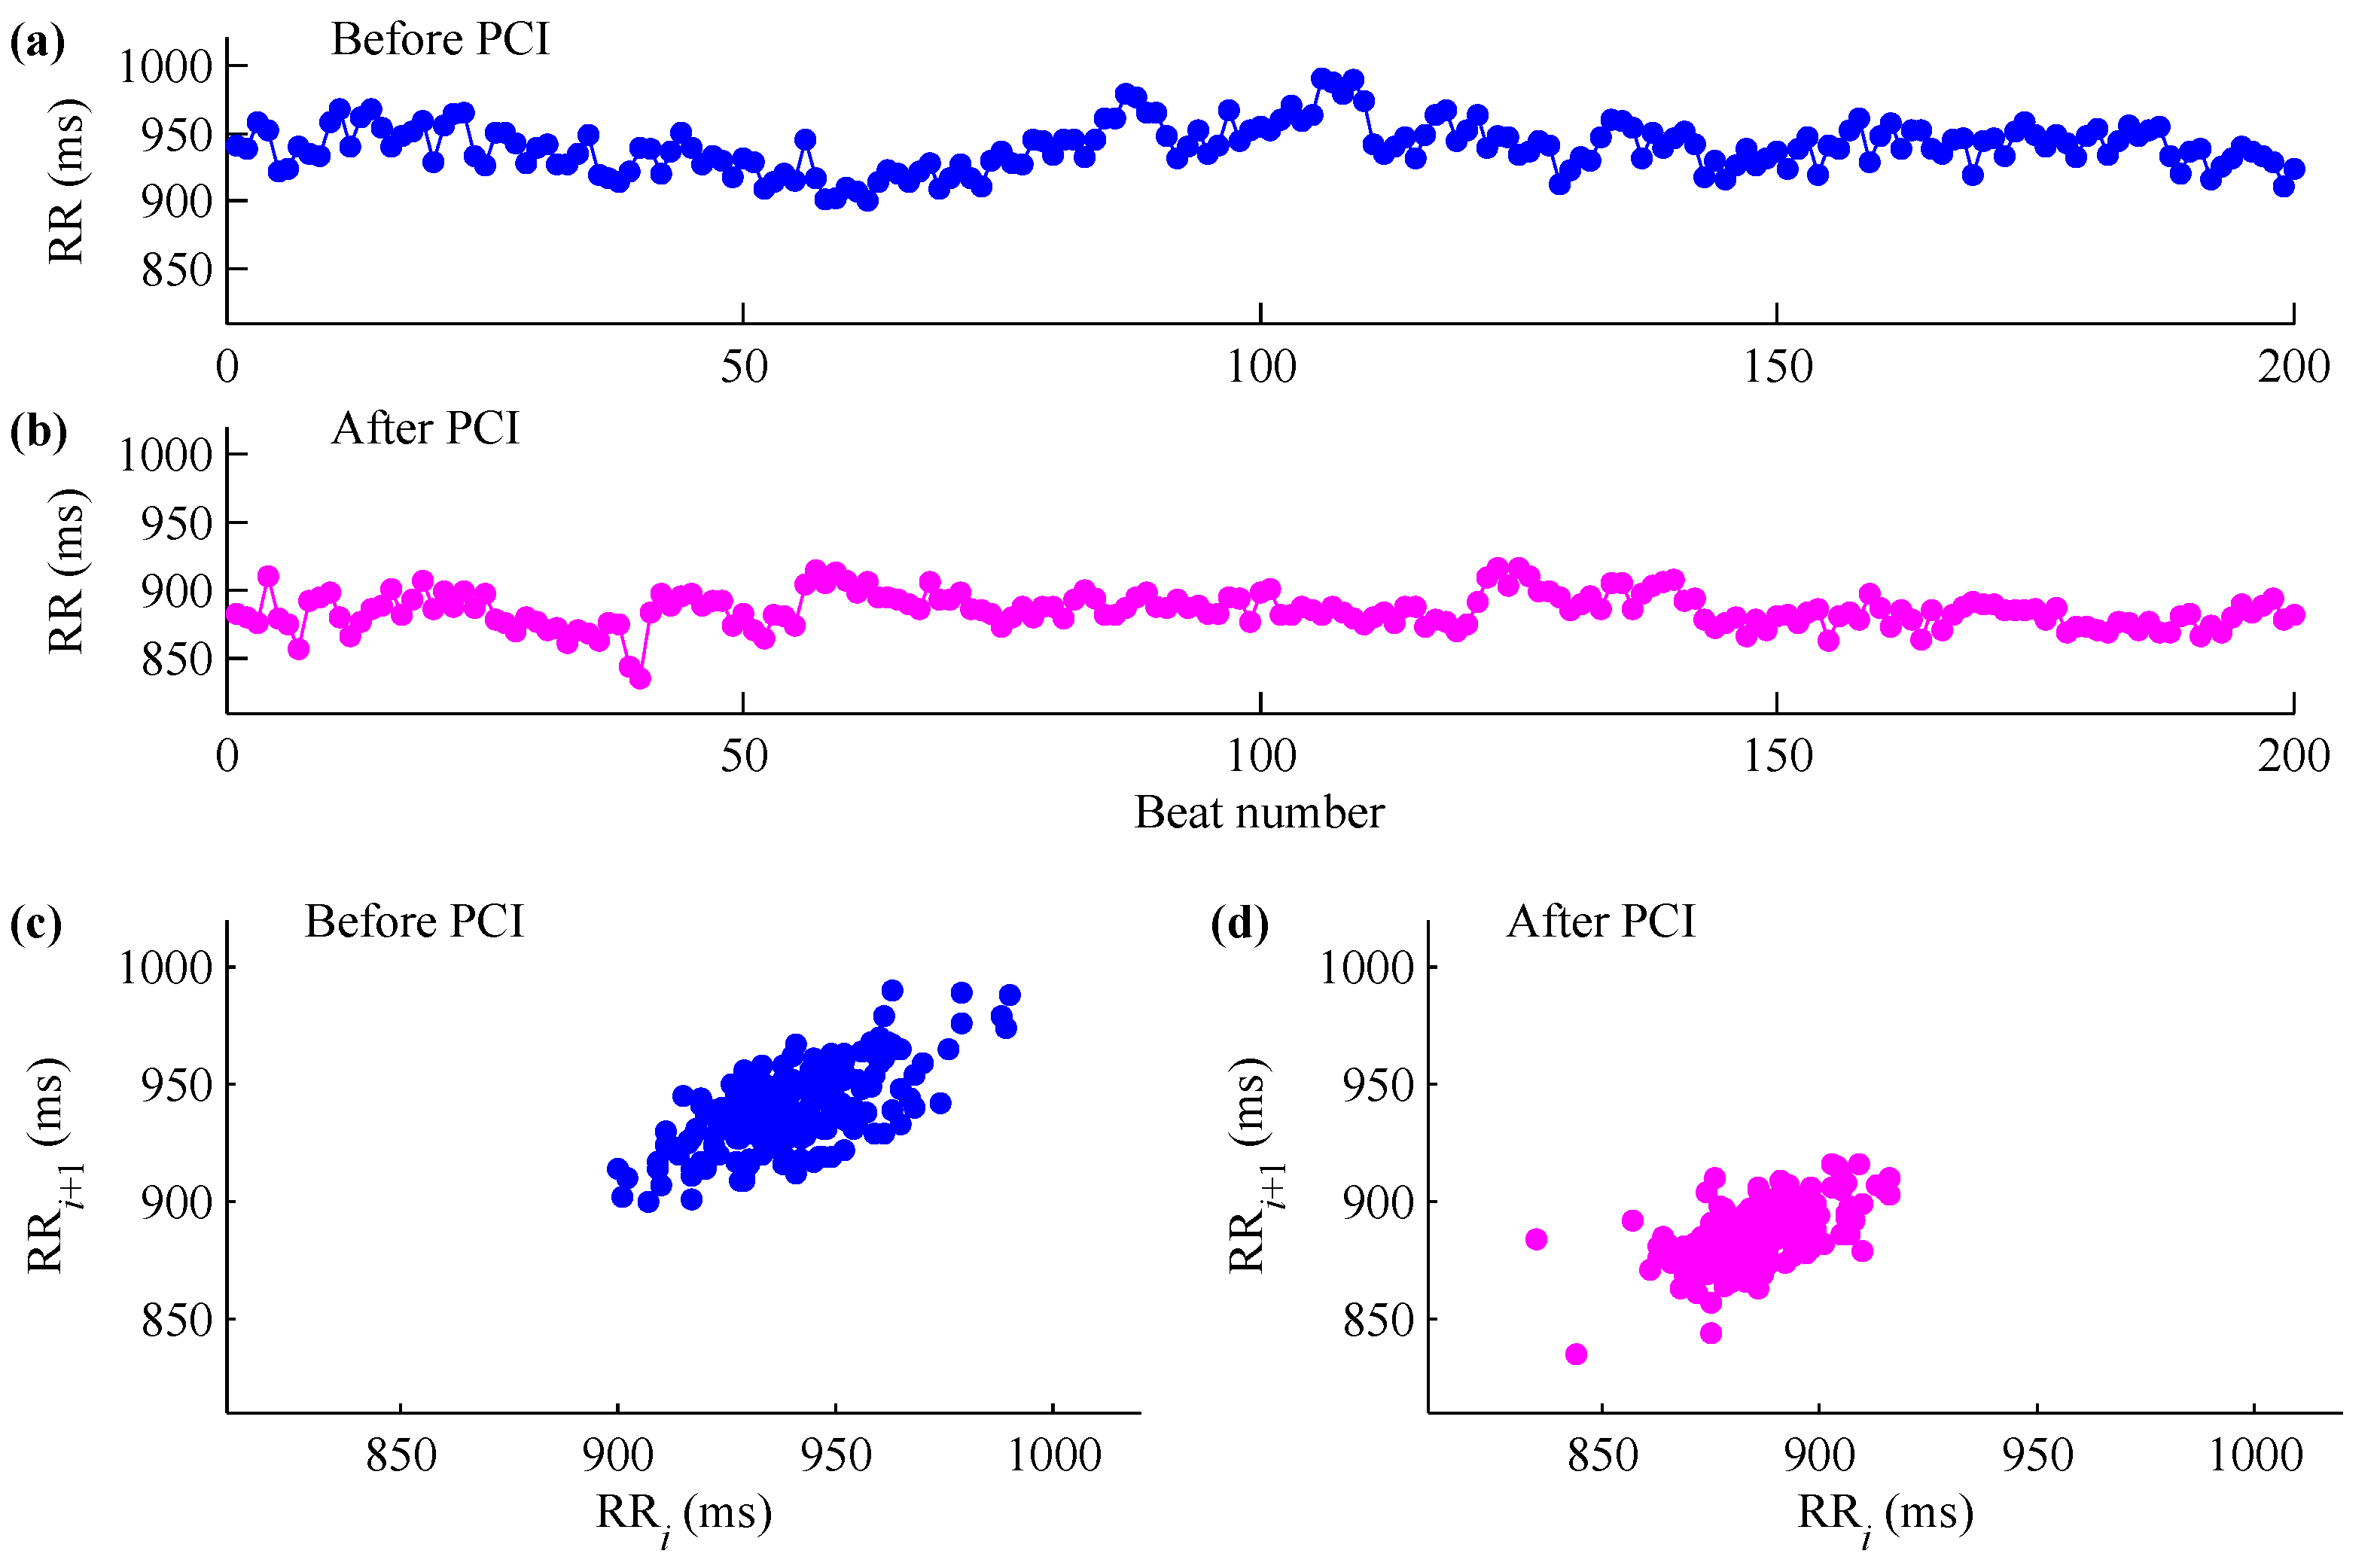
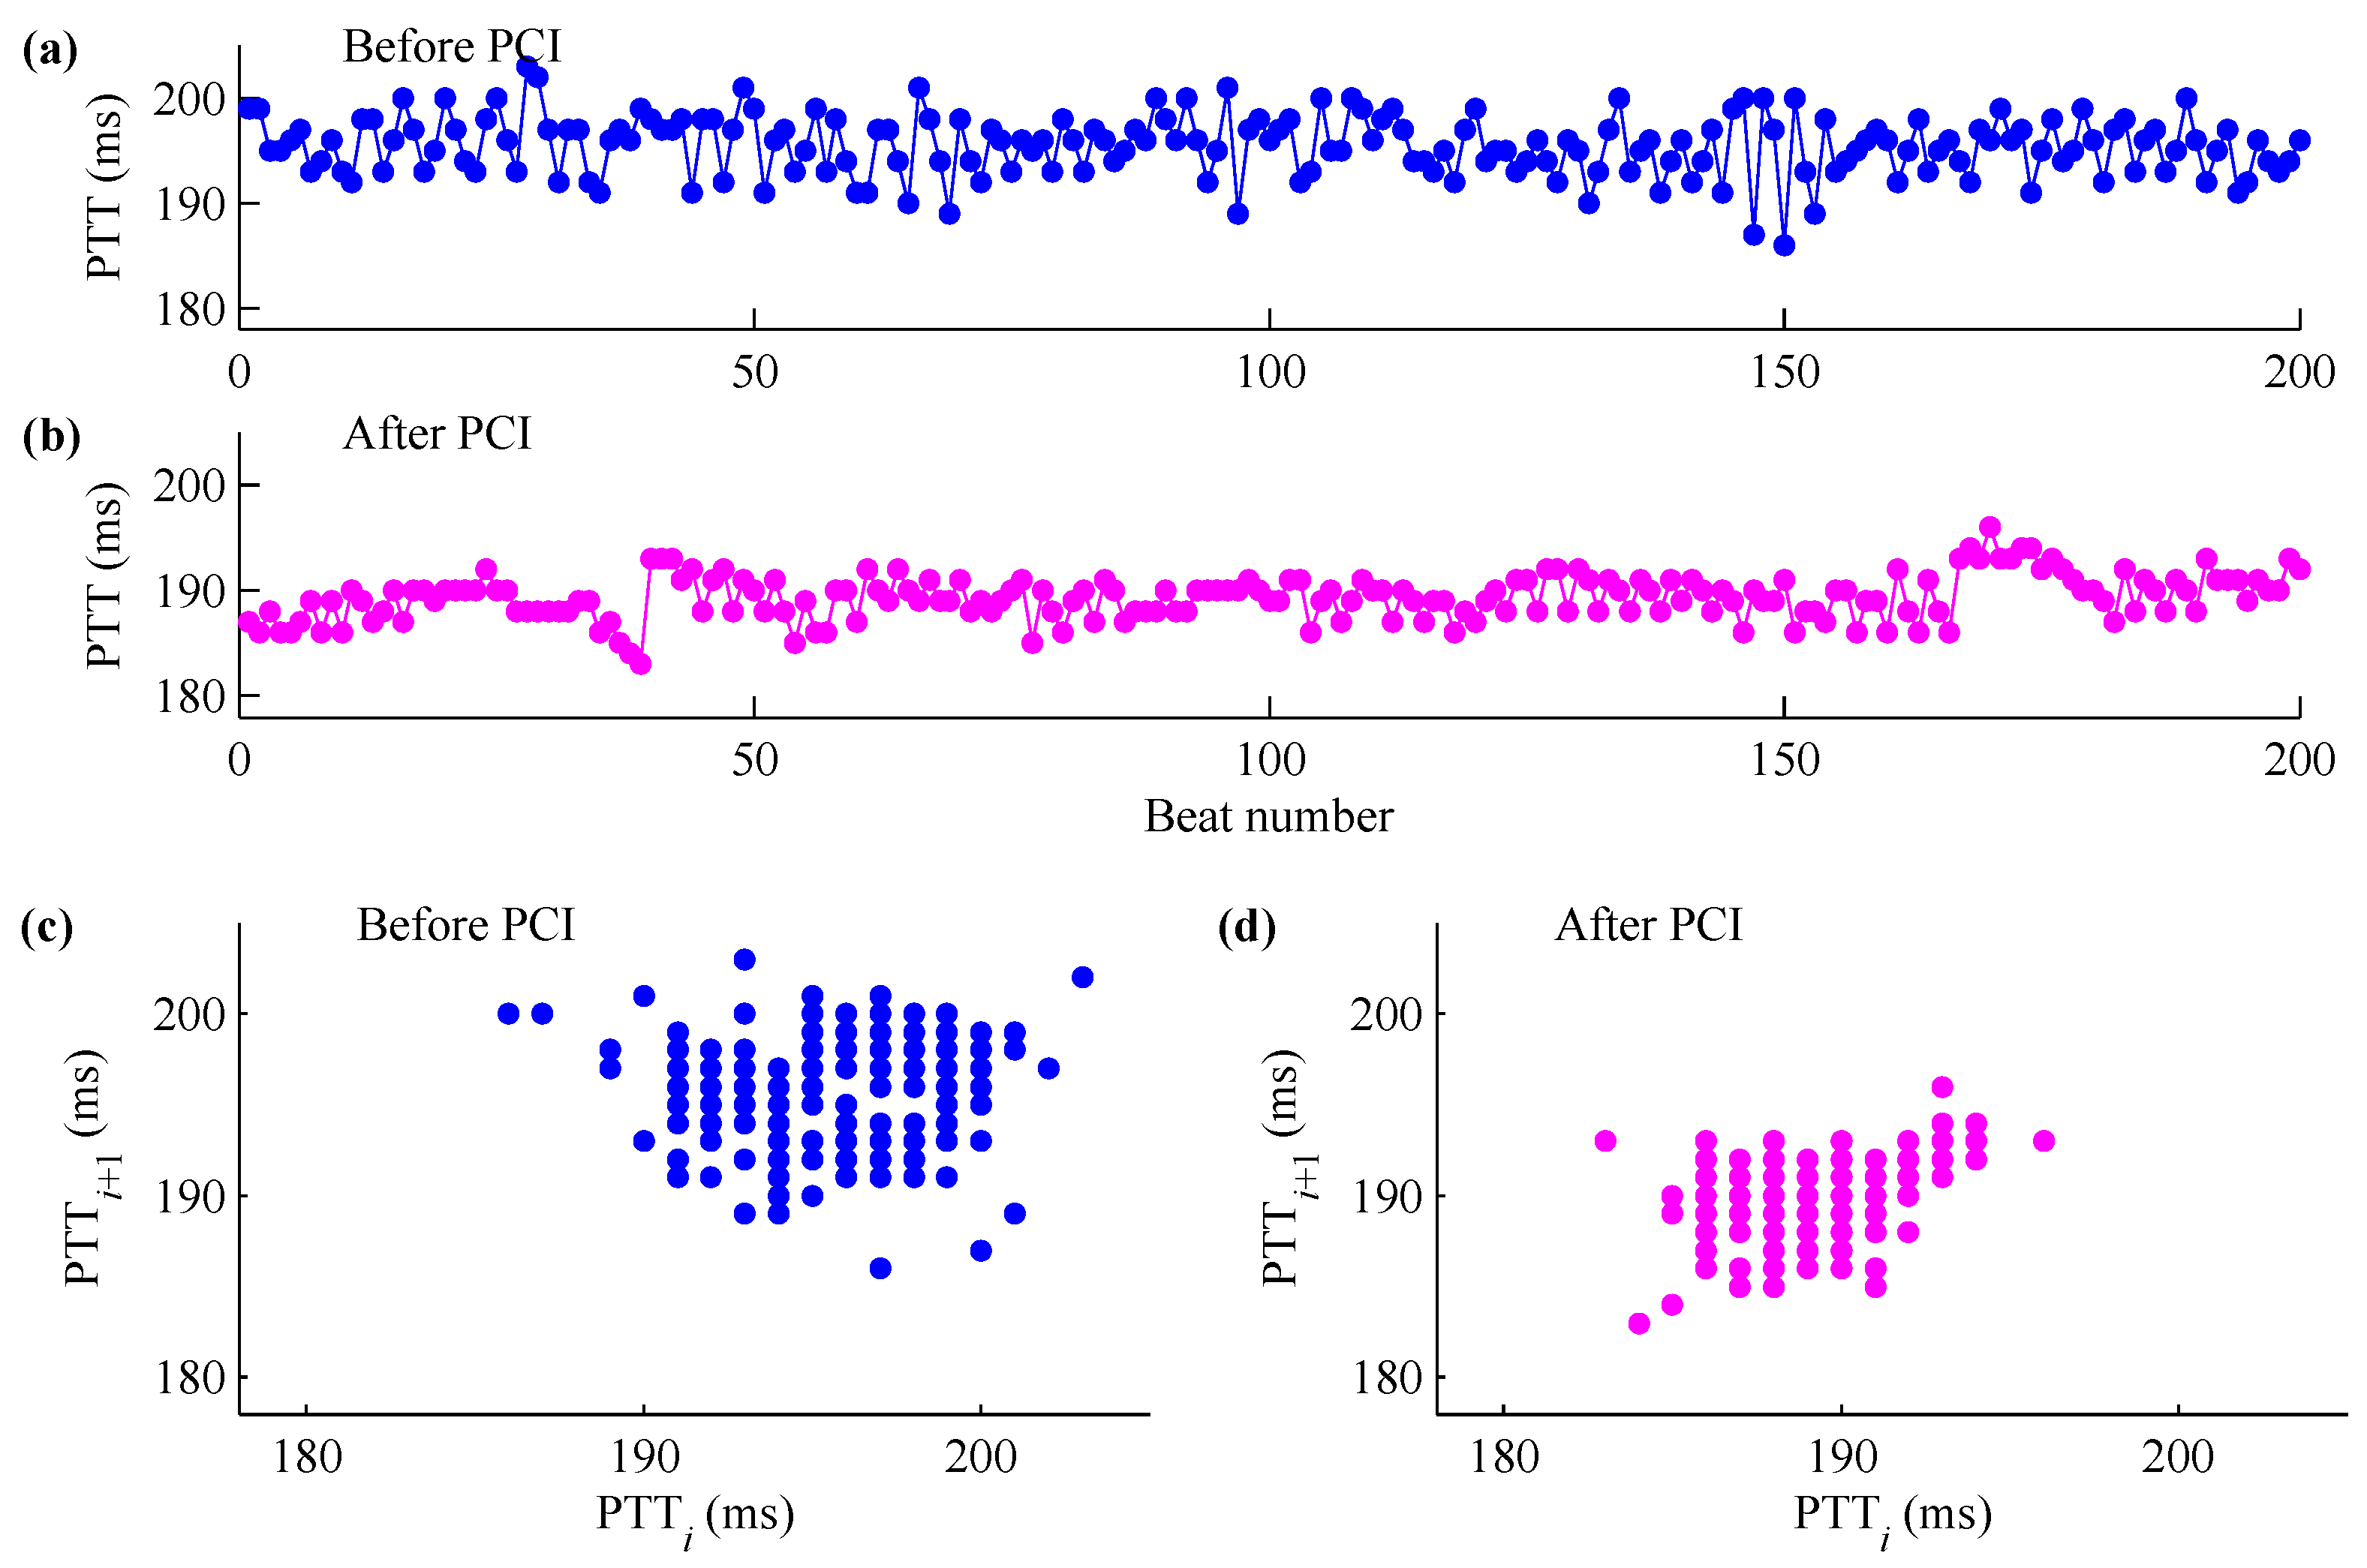
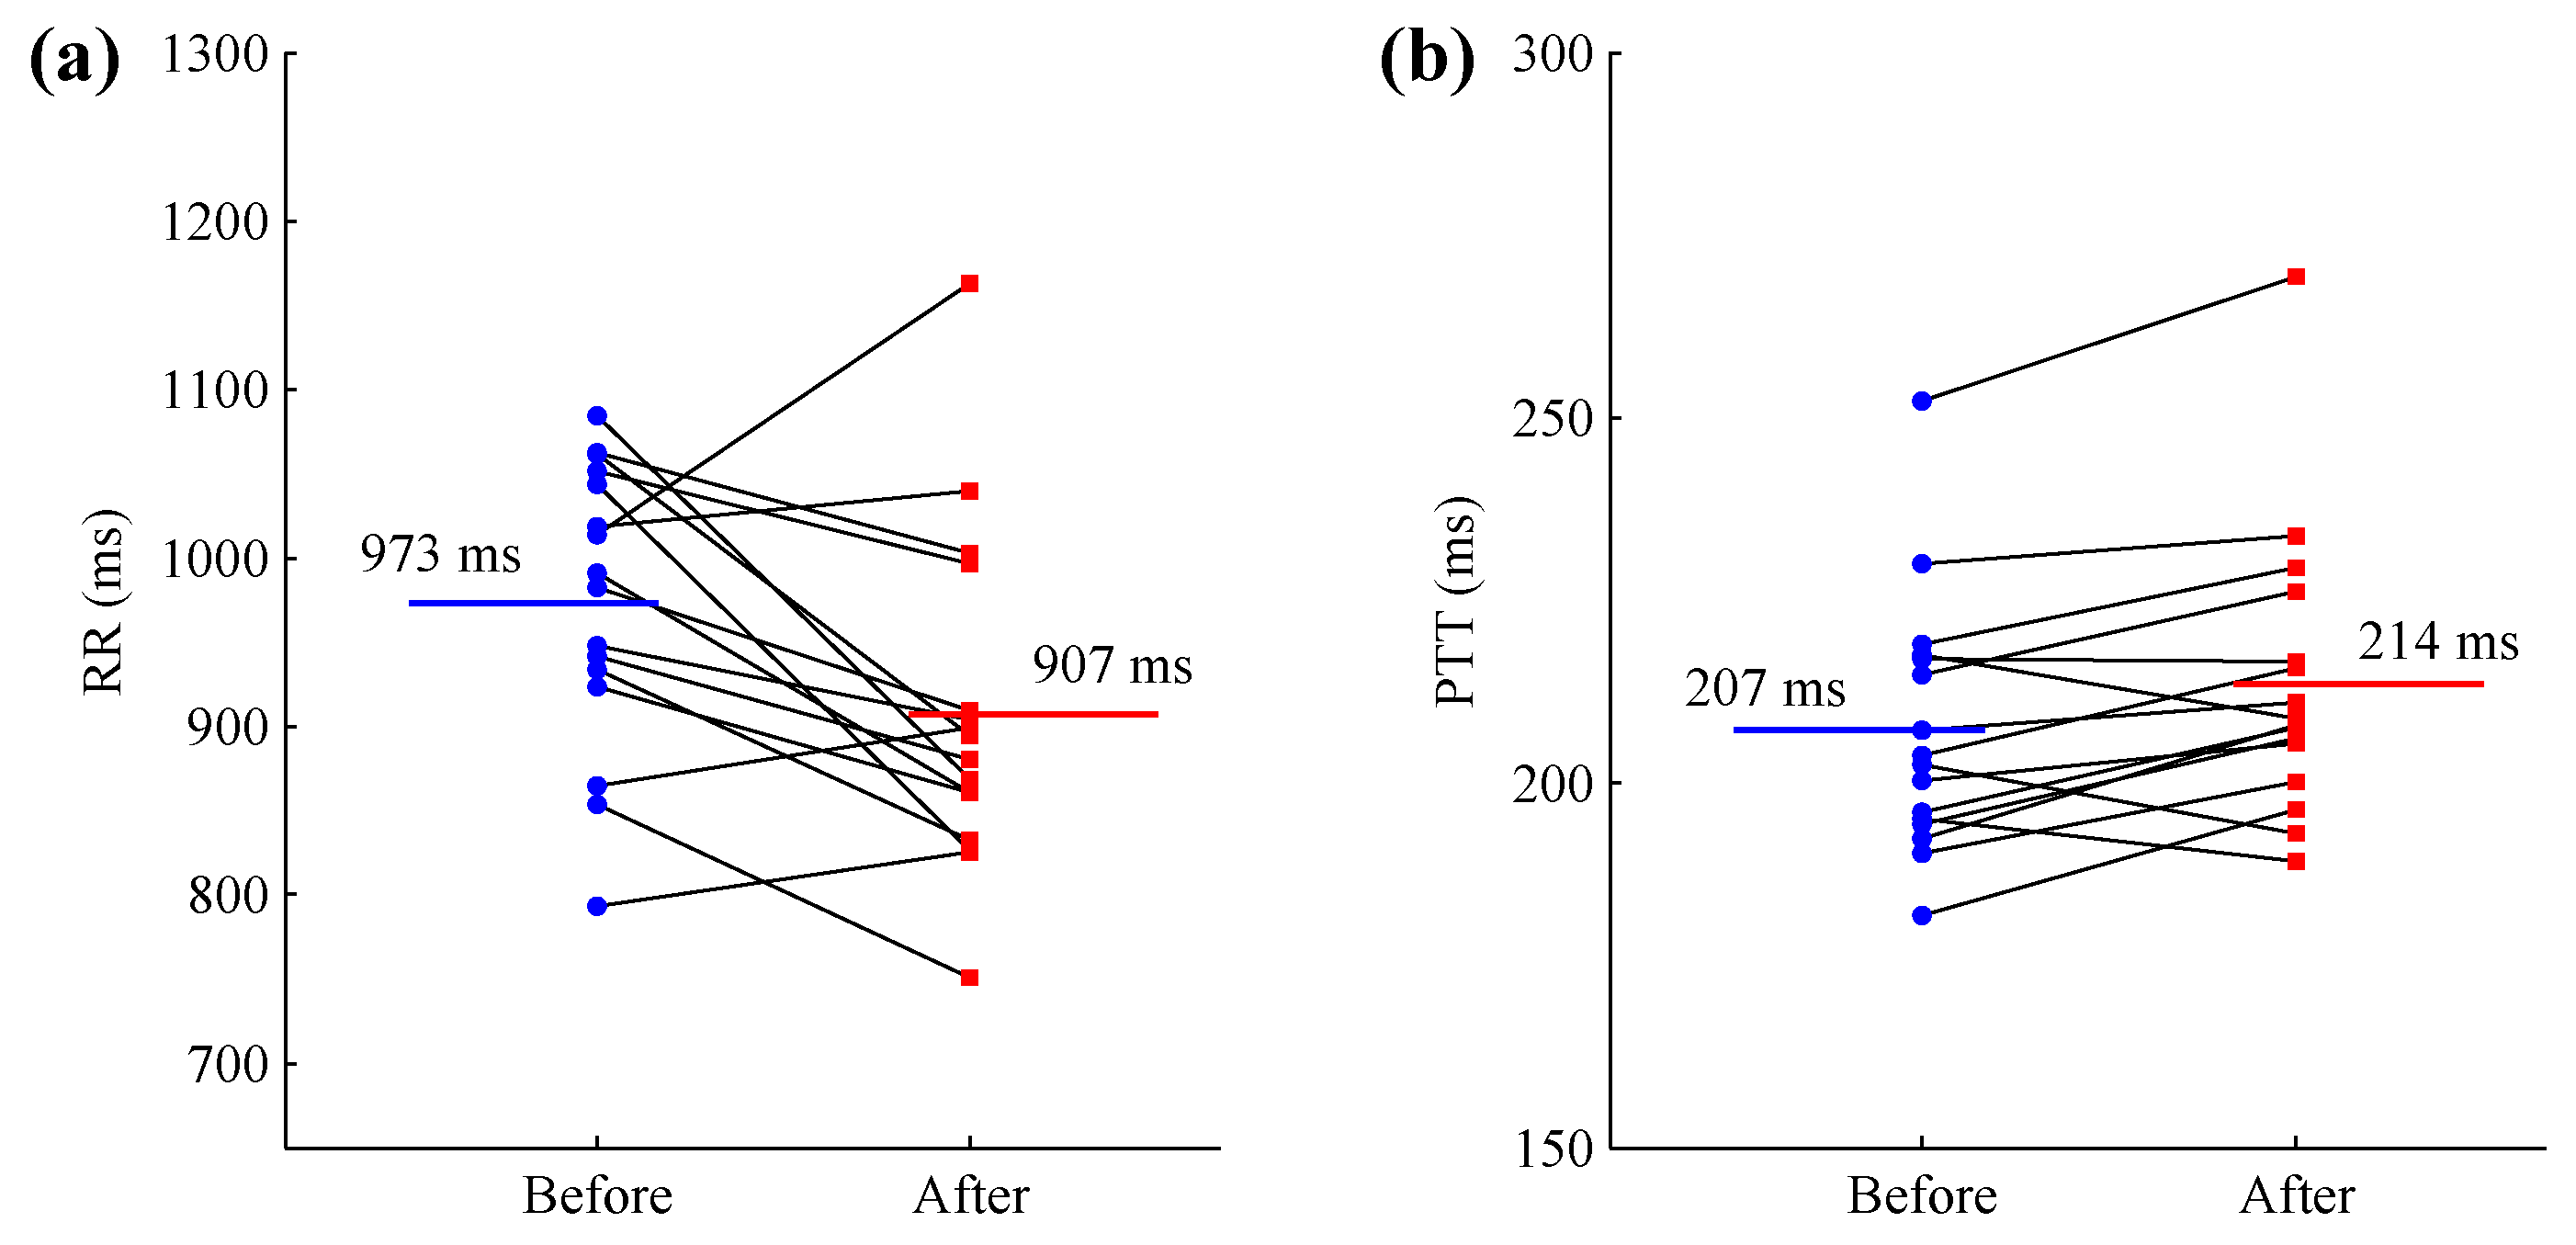
3.1. RR and PTT Intervals: Comparison before and after PCI Procedure

Table 3 shows the results of RR and PTT intervals, as well as the blood pressure results, from before and after PCI procedure. Paired t-test results showed that blood pressure values did not have statistical differences between before and after PCI procedure (for SBP, before 130 ± 14 vs. after 131 ± 18 mmHg, p = 0.4; for DBP, before 79 ± 10 vs. after 79 ± 11 mmHg, p = 0.9). Paired t-test results showed that after PCI procedure, RR interval significantly decreased (907 ± 100 vs. before PCI 973 ± 85 ms, p < 0.05) whereas PTT interval significantly increased (214 ± 19 vs. before PCI 207 ± 18 ms, p < 0.01). The changes were observed in each individual, as shown from the ladder plots in Figure 4. The group mean values for RR and PTT intervals were also shown.

3.2. HRV and PTTV Results: Comparison between before and after PCI Procedure

Table 4 gives an overview of HRV and PTTV results from the two PCI stages when using the different time windows N. Comparison of HRV indices before and after PCI procedure in all enrolled patients revealed that, both SDTS and FuzzyMEn decreased after PCI for all n values. However, SDTS only output significant lower values when n = 100 and n = 25 beats while reported no significant decreases for other two N settings. By contrast, FuzzyMEn reported significant lower values for all of four types of N values (all p < 0.05), and even the decrease after PCI became more significant when n = 25 beats (p < 0.01). In addition, it was noteworthy that with the increase of n values, SDTS decreased while FuzzyMEn increased.
PTTV results showed different trends compared with HRV results. For PTTV, SDTS hardly changed after PCI at any of the four n settings (all p > 0.90). However, FuzzyMEn still reported significant lower values for all of four n values (p < 0.01 for n = 200, 100 and 50 beats, and p < 0.05 for n = 25 beats). The similar trends in PTTV compared with HRV are that with the decrease of n values, SDTS decreased while FuzzyMEn increased.

4. Discussion

This study showed a decrease of parasympathetic tone and autonomic balance shift towards sympathetic domination after the PCI procedure, indicated by the decreased SDTS in HRV and further confirmed by the FuzzyMEn analysis. Our results also reported the effect of the PCI procedure on the PTT interval and PTTV results. To the best of our knowledge, it is the first study to explore the PCI procedure’s effect on PTTV indices.
The SDTS changes in HRV were consistent with the findings of Janowska-Kulinska et al. [3], where SDTS changed from 27.2 ± 18.6 ms before PCI to 21.3 ± 32.8 ms after PCI (p = 0.044). The decrease of parasympathetic tone was also consistent with the findings of Kanadasi et al. [9], who showed the parasympathetically modulated HRV reduction occurred after PCI procedure in patients with single-vessel disease. However, they were in opposition to the results reported by Tseng et al. [15], where the HRV parameters recorded before PCI procedure did not differ significantly from those assessed directly after the PCI procedure. Moreover, many studies have demonstrated that coronary artery bypass grafting (CABG) also leads to significant HRV reduction, which is even more pronounced than after myocardial infarction [10,11,12,13]. In addition, HRV reduction after cardiac surgery is not exclusively related to PCI or CABG, as it is also recorded in patients undergoing valve surgery [14]. Unlike myocardial infarction where the main reason of the HRV reduction is ischaemia and myocyte necrosis, the probable reasons for considerable HRV reduction immediately after PCI or CABG include a combined effect of surgical manipulation during operative procedure on the heart and adjacent anatomical structures, prolonged anaesthesia [29,30] and cardioplegia [10].
Entropy-based measures can quantify the regularity of the time series and provide important insight for understanding the underlying mechanisms of the cardiovascular system. Thus they have been widely used in clinical research for the early detection of cardiovascular diseases. The results in the current study verified the reduction of irregularity in the RR time series after PCI procedure, indicated by the decreased both SDTS and FuzzyMEn values after PCI. The reduction of irregularity in RR time series could also be explained by the combined effect of surgical manipulation during operative procedure on the heart, prolonged anaesthesia and cardioplegia.
Our results showed a significant increase in PTT interval after PCI procedure. It is widely accepted that the increase of peripheral PTT is linked to the increase of arterial compliance [31,32,33,34,35]. Thus, the PCI procedure was observed in this study to have a positive effect on the improvement of the arterial function. However, the underlying mechanism of this improvement is still unknown and should be further explored. For PTTV, as shown in Table 2, the SDTS in PTTV had no significant difference between before and after PCI procedure while the FuzzyMEn had. This indicated that although the PCI procedure did not have effect on the variation of PTT time series, it did have an effect on the inherent regularity of PTT time series. The significant decreases of FuzzyMEn values suggested the PTT time series became more regular after the PCI procedure. The inherent mechanism of this change is still unknown.
Previous studies reported that the time series length n did not have a great impact on entropy measures if n > 200 [20,36] but had a great impact if n is less than 200 [37]. Consequently, stabilization in entropy would be expected with greater n. Our recent study on distance-based entropy suggested that this distance-based entropy could be applied in relative shorter time series [6]. However, the usability of the FuzzyMEn method in the relative shorter time series still needs to be confirmed. Thus, in the current study, we used different time windows (200, 100, 50 and 25 beats respectively) to segment the RR and PTT time series to test on relatively short time series. For all four time windows, FuzzyMEn in HRV is able to significantly discriminate between before and after PCI procedure while SDTS cannot. As shown in Table 2, SDTS only output significant differences when time windows were 100 and 25 beats. The weak consistency of SDTS values presented here indicates the difficulty of clinical application. However, from Table 2, we observed that FuzzyMEn showed greater consistency: the results from after PCI were consistently lower than those before PCI and there were significant differences between the two stages for both HRV and PTTV analysis.
Referring to the effect of the baseline demographics, previous studies demonstrated that blood pressure was a significant factor for the incidence of stent restenosis in patients treated with PCI [38]. However, this conclusion was from a long-term (10 years) follow-up study aiming to identify the hypertension risk on the cardiovascular morbidity and mortality. In this study, we compared the blood pressure differences before and after the PCI procedure and found that both SBP and DBP did not have statistical changes after the PCI procedure. Moreover, the LVEF parameter is important for CAD patients. We reported the LVEF results before PCI procedure. However, their values were not recorded after PCI procedure, which is definitely a limitation for the current study. In addition, a significant decrease in the RR intervals was observed after PCI procedures, indicating the significant increase of the heart rate (HR) parameter. We did not include the specific HR change in this study, and we did not explore the inherent mechanism of the changes in RR and PTT intervals, as well as in HRV and PTTV parameters. This work can be considered a pilot study, and we only collected the data from before and after PCI procedure from 16 CAD patients. Furthermore, the findings of this work will be incorporated into the follow-up studies and the inherent mechanism of the changes, especially for the clinical practice, should be further explored. In addition, as reported in references [29,30], anesthesia has a non-negligible effect on the HRV parameters in 24 h post-surgery, so we could not regard the changes in HRV and PTTV parameters, as well as in RR and PTT intervals, as totally the effect of the PCI procedure without considering the effect of anesthesia. We also identified this is a limitation in the current study and we need to perform further experiments to confirm or exclude the effect of anesthesia.

5. Conclusions

The present study has demonstrated that the RR interval decreased while the PTT interval increased after the PCI procedure. More important, the reduction in both HRV and PTTV were significant immediately after PCI, indicating the changes in underlying mechanisms in the cardiovascular system.

Acknowledgments

This work was supported by the National Natural Science Foundation of China (61471223 and 61201049), Shandong Province Natural Science Foundation (ZR2014HM065), and Medical and Health Science and Technology Development Plan of China (2014WS0109).

Author Contributions

Guang Zhang, Chengyu Liu, Jing Yang and Changchun Liu designed the study. Guang Zhang and Lizhen Ji were responsible for data collection. Chengyu Liu and Lizhen Ji were responsible for data analysis. Chengyu Liu, Jing Yang and Changchun Liu reviewed relevant literature and interpreted the acquired data. Chengyu Liu drafted the manuscript. All authors have read and approved the final manuscript.

Conflicts of Interest

The authors declare no conflict of interest.

Appendix

Appendix A1. SDTS

For the RR or PTT time series x ( i ) ( 1 i N ), SDTS is defined as [1]:
SDTS = 1 N 1 i = 1 N ( x ( i ) MEAN ) 2
where MEAN is the mean value of the time series, i.e., MEAN = 1 N i = 1 N x ( i ) .

Appendix A2. FuzzyMEn

The calculation process of FuzzyMEn is summarized as follows [7,24]:
For the RR or PTT segment x ( i ) ( 1 i N ), firstly form the local vector sequences X L i m and global vector sequences X G i m respectively:
X L i m = { x ( i ) , x ( i + 1 ) , , x ( i + m 1 ) } x ¯ ( i ) X G i m = { x ( i ) , x ( i + 1 ) , , x ( i + m 1 ) } x ¯     1 i N m
The vector X L i m represents m consecutive x ( i ) values but removing the local baseline x ¯ ( i ) , which is defined as:
x ¯ ( i ) = 1 m k = 0 m 1 x ( i + k )     1 i N m
The vector X G i m also represents m consecutive x ( i ) values but removing the global mean value x ¯ of the segment x ( i ) , which is defined as:
x ¯ = 1 N i = 1 N x ( i )
Then the distance between the local vector sequences X L i m and X L j m and the distance between the global vector sequences X G i m and X G j m are defined respectively:
d L i , j m = d [ X L i m , X L j m ] = max k = 0 m 1 | ( x ( i + k ) x ¯ ( i ) ) ( x ( j + k ) x ¯ ( j ) ) | d G i , j m = d [ X G i m , X G j m ] = max k = 0 m 1 | ( x ( i + k ) x ¯ ) ( x ( j + k ) x ¯ ) |
Given the parameters nL, rL, nG and rG, calculate the similarity degree D L i , j m ( n L , r L ) between the local vectors X L i m and X L j m by the fuzzy function μ L ( d L i , j m , n L , r L ) , as well as calculate the similarity degree D G i , j m ( n G , r G ) between the global vectors X G i m and X G j m by the fuzzy function μ G ( d G i , j m , n G , r G ) :
D L i , j m ( n L , r L ) = μ L ( d L i , j m , n L , r L ) = exp ( ( d L i , j m ) n L r L ) D G i , j m ( n G , r G ) = μ G ( d G i , j m , n G , r G ) = exp ( ( d G i , j m ) n G r G )
Define the function ϕ L m ( n L , r L ) and ϕ G m ( n G , r G ) as:
ϕ L m ( n L , r L ) = 1 N m i = 1 N m ( 1 N m j = 1 N m D L i , j m ( n L , r L ) ) ϕ G m ( n G , r G ) = 1 N m i = 1 N m ( 1 N m j = 1 N m D G i , j m ( n G , r G ) )
Similarly, define the function ϕ L m + 1 ( n L , r L ) for m + 1 dimension vectors X L i m + 1 and X L j m + 1 and the function ϕ G m + 1 ( n G , r G ) for m + 1 dimension vectors X G i m + 1 and Y G j m + 1 :
ϕ L m + 1 ( n L , r L ) = 1 N m i = 1 N m ( 1 N m j = 1 N m D L i , j m + 1 ( n L , r L ) ) ϕ G m + 1 ( n L , r L ) = 1 N m i = 1 N m ( 1 N m j = 1 N m D G i , j m + 1 ( n G , r G ) )
Then the fuzzy local measure entropy (FuzzyLMEn) and fuzzy global measure entropy (FuzzyGMEn) are defined by:
FuzzyLMEn ( m , n L , r L , N ) = ln ( ϕ L m + 1 ( n L , r L ) / ϕ L m ( n L , r L ) ) FuzzyGMEn ( m , n G , r G , N ) = ln ( ϕ G m + 1 ( n G , r G ) / ϕ G m ( n G , r G ) )
Finally, the FuzzyMEn of RR segment x ( i ) is calculated as follows:
FuzzyMEn ( m , n L , r L , n G , r G , N ) = FuzzyLMEn ( m , n L , r L , N ) + FuzzyGMEn ( m , n G , r G , N )
In this study, the local similarity weight nL = 3 and global vector similarity weight nG = 2, the local tolerance threshold rL was set equal to the global threshold rG, i.e., rL = rG = r. So the Formula (A10) becomes:
FuzzyMEn ( m , r , N ) = FuzzyLMEn ( m , r , N ) + FuzzyGMEn ( m , r , N )
For FuzzyMEn, the entropy results were only based on the three parameters: embedding dimension m, tolerance threshold r and RR segment length N. The parameters of FuzzyMEn used in this study are m = 1 and r = 0.1 [23].

References

  1. La Rovere, M.T.; Pinna, G.D.; Maestri, R.; Mortara, A.; Capomolla, S.; Febo, O.; Ferrari, R.; Franchini, M.; Gnemmi, M.; Opasich, C.; et al. Short-term heart rate variability strongly predicts sudden cardiac death in chronic heart failure patients. Circulation 2003, 107, 565–570. [Google Scholar] [CrossRef] [PubMed]
  2. Liu, C.Y.; Zhang, C.Q.; Zhang, L.; Zhao, L.N.; Liu, C.C.; Wang, H.J. Measuring synchronization in coupled simulation and coupled cardiovascular time series: A comparison of different cross entropy measures. Biomed. Signal Process. Control 2015, 21, 49–57. [Google Scholar] [CrossRef]
  3. Janowska-Kulinska, A.; Torzynska, K.; Markiewicz-Grochowalska, A.; Sowinska, A.; Majewski, M.; Jerzykowska, O.; Pawlak-Bus, K.; Kramer, L.; Moczko, J.; Siminiak, T. Changes in heart rate variability caused by coronary angioplasty depend on the localisation of coronary lesions. Kardiologia Polska 2009, 67, 130–138. [Google Scholar] [PubMed]
  4. Liu, C.Y.; Liu, C.C.; Li, L.P.; Zhang, Q.G.; Li, B. Systolic and Diastolic Time Interval Variability Analysis and Their Relations with Heart Rate Variability. In Proceedings of the 3rd International Conference on Bioinformatics and Biomedical Engineering, Beijing, China, 11–13 June 2009; pp. 1–4.
  5. Bigger, J.T.; Fleiss, J.L.; Rolnitzky, L.M.; Steinman, R.C. The ability of several short-term measures of RR variability to predict mortality after myocardial infarction. Circulation 1993, 88, 927–934. [Google Scholar] [CrossRef] [PubMed]
  6. Li, P.; Liu, C.Y.; Li, K.; Zheng, D.C.; Liu, C.C.; Hou, Y. Assessing the complexity of short-term heartbeat interval series by distribution entropy. Med. Biol. Eng. Comput. 2015, 53, 77–87. [Google Scholar] [CrossRef] [PubMed]
  7. Liu, C.Y.; Zhao, L.N. Using Fuzzy Measure Entropy to Improve the Stability of Traditional Entropy Measures. In Proceedings of the Computing in Cardiology, Hangzhou, China, 18–21 September 2011; pp. 681–684.
  8. Chen, W.T.; Zhuang, J.; Yu, W.X.; Wang, Z.Z. Measuring complexity using fuzzyen, apen, and sampen. Med. Eng. Phys. 2009, 31, 61–68. [Google Scholar] [CrossRef] [PubMed]
  9. Kanadasi, M.; Kudaiberdieva, G.; Birand, A. Effect of the final coronary arterial diameter after coronary angioplasty on heart rate variability responses. Ann. Noninvasive Electrocardiol. 2002, 7, 106–113. [Google Scholar] [CrossRef] [PubMed]
  10. Lakusic, N.; Mahovic, D.; Kruzliak, P.; Habek, J.C.; Novak, M.; Cerovec, D. Changes in heart rate variability after coronary artery bypass grafting and clinical importance of these findings. BioMed Res. Int. 2015, 2015, 680515. [Google Scholar] [CrossRef] [PubMed]
  11. Laitio, T.T.; Huikuri, H.V.; Kentala, E.S.; Makikallio, T.H.; Jalonen, J.R.; Helenius, H.; Sariola-Heinonen, K.; Yli-Mayry, S.; Scheinin, H. Correlation properties and complexity of perioperative RR-interval dynamics in coronary artery bypass surgery patients. Anesthesiology 2000, 93, 69–80. [Google Scholar] [CrossRef] [PubMed]
  12. Hogue, C.W.J.; Stein, P.K.; Apostolidou, I.; Lappas, D.G.; Kleiger, R.E. Alterations in temporal patterns of heart rate variability after coronary artery bypass graft surgery. Anesthesiology 1994, 81, 1356–1364. [Google Scholar] [CrossRef] [PubMed]
  13. Wu, Z.K.; Vikman, S.; Laurikka, J.; Pehkonen, E.; Iivainen, T.; Huikuri, H.V.; Tarkka, M.R. Nonlinear heart rate variability in cabg patients and the preconditioning effect. Eur. J. Cardiothorac. Surg. 2005, 28, 109–113. [Google Scholar] [CrossRef] [PubMed]
  14. Lakusic, N.; Slivnjak, V.; Baborski, F.; Sonicki, Z. Heart rate variability in patients after cardiac valve surgery. Cent. Eur. J. Med. 2008, 3, 65–70. [Google Scholar] [CrossRef]
  15. Tseng, C.D.; Wang, T.L.; Lin, J.L.; Hsu, K.L.; Chiang, F.T.; Tseng, Y.Z. The cause-effect relationship of sympathovagal activity and the outcome of percutaneous transluminal coronary angioplasty. Jpn. Heart J. 1996, 37, 455–462. [Google Scholar] [CrossRef] [PubMed]
  16. Liu, C.Y.; Zheng, D.C.; Zhao, L.N.; Li, P.; Li, B.; Murray, A.; Liu, C.C. Elastic properties of peripheral arteries in heart failure patients in comparison with normal subjects. J. Physiol. Sci. 2013, 63, 195–201. [Google Scholar] [CrossRef] [PubMed]
  17. Gharacholou, S.M.; Scott, C.G.; Borlaug, B.A.; Kane, G.C.; McCully, R.B.; Oh, J.K.; Pellikka, P.A. Relationship between diastolic function and heart rate recovery after symptom-limited exercise. J. Card. Fail. 2012, 18, 34–40. [Google Scholar] [CrossRef] [PubMed]
  18. Wagner, D.; Roesch, N.; Harpes, P.; Körtke, H.; Plumer, P.; Saberin, A.; Chakoutio, V.; Oundjede, D.; Delagardelle, C.; Beissel, J.; et al. Relationship between pulse transit time and blood pressure is impaired in patients with chronic heart failure. Clin. Res. Cardiol. 2010, 99, 657–664. [Google Scholar] [CrossRef] [PubMed]
  19. Pincus, S.M.; Goldberger, A.L. Physiological time-series analysis: What does regularity quantify? Am. J. Physiol. Heart Circ. Physiol. 1994, 266, H1643–H1656. [Google Scholar]
  20. Richman, J.S.; Moorman, J.R. Physiological time-series analysis using approximate entropy and sample entropy. Am. J. Physiol. Heart Circ. Physiol. 2000, 278, H2039–H2049. [Google Scholar] [PubMed]
  21. Liu, C.Y.; Liu, C.C.; Shao, P.; Li, L.P.; Sun, X.; Wang, X.P.; Liu, F. Comparison of different threshold values r for approximate entropy: Application to investigate the heart rate variability between heart failure and healthy control groups. Physiol. Meas. 2011, 32, 167–180. [Google Scholar] [CrossRef] [PubMed]
  22. Lu, S.; Chen, X.; Kanters, J.K.; Solomon, I.C.; Chon, K.H. Automatic selection of the threshold value R for approximate entropy. IEEE Trans. Biomed. Eng. 2008, 55, 1966–1972. [Google Scholar] [PubMed]
  23. Zhao, L.N.; Wei, S.S.; Zhang, C.Q.; Zhang, Y.T.; Jiang, X.E.; Liu, F.; Liu, C.Y. Determination of sample entropy and fuzzy measure entropy parameters for distinguishing congestive heart failure from normal sinus rhythm subjects. Entropy 2015, 17, 6270–6288. [Google Scholar] [CrossRef]
  24. Liu, C.Y.; Li, K.; Zhao, L.N.; Liu, F.; Zheng, D.C.; Liu, C.C.; Liu, S.T. Analysis of heart rate variability using fuzzy measure entropy. Comput. Biol. Med. 2013, 43, 100–108. [Google Scholar] [CrossRef] [PubMed]
  25. Chen, W.T.; Wang, Z.Z.; Xie, H.B.; Yu, W.X. Characterization of surface emg signal based on fuzzy entropy. IEEE Trans. Neural Syst. Rehabil. Eng. 2007, 15, 266–272. [Google Scholar] [CrossRef] [PubMed]
  26. Li, P.; Liu, C.Y.; Wang, X.P.; Zheng, D.C.; Li, Y.Y.; Liu, C.C. A low-complexity data-adaptive approach for premature ventricular contraction recognition. Signal Image Video Process. 2014, 8, 111–120. [Google Scholar] [CrossRef]
  27. Liu, C.Y.; Li, L.P.; Zhao, L.N.; Zheng, D.C.; Li, P.; Liu, C.C. A combination method of improved impulse rejection filter and template matching for identification of anomalous intervals in electrocardiographic RR sequences. J. Med. Biol. Eng. 2012, 32, 245–250. [Google Scholar] [CrossRef]
  28. Yambe, T.; Shiraishi, Y.; Saijo, Y.; Liu, H.; Nitta, S.; Imachi, K.; Baba, A.; Yamaguchi, T.; Sugawara, S.; Katahira, Y.; et al. Clinical research on the accuracy in determining the pulse wave rising point. SCR Med. 2009, 82, 164–174. [Google Scholar]
  29. Shu, A.; Zhan, L.; Fang, H.; Lv, E.; Chen, X.; Zhang, M.; Wang, Q. Evaluation of remifentanil anesthesia for off-pump coronary artery bypass grafting surgery using heart rate variability. Exp. Ther. Med. 2013, 6, 253–259. [Google Scholar] [CrossRef] [PubMed]
  30. Soares, P.P.S.; Moreno, A.M.; Cravo, S.L.D.; Nobrega, A.C.L. Coronary artery bypass surgery and longitudinal evaluation of the autonomic cardiovascular function. Crit. Care 2005, 9, R124–R131. [Google Scholar] [CrossRef] [PubMed] [Green Version]
  31. Sharwood-Smith, G.; Bruce, J.; Drummond, G. Assessment of pulse transit time to indicate cardiovascular changes during obstetric spinal anaesthesia. Br. J. Anaesth. 2006, 96, 100–105. [Google Scholar] [CrossRef] [PubMed]
  32. Zhang, Y.L.; Zheng, Y.Y.; Ma, Z.C.; Sun, Y.N. Radial pulse transit time is an index of arterial stiffness. Hypertens. Res. 2011, 34, 884–887. [Google Scholar] [CrossRef] [PubMed]
  33. Liu, C.Y.; Zheng, D.C.; Zhao, L.N.; Liu, C.C. Gaussian fitting for carotid and radial artery pressure waveforms: Comparison between normal subjects and heart failure patients. Biomed. Mater. Eng. 2014, 24, 271–277. [Google Scholar] [PubMed]
  34. Liu, C.Y.; Zheng, D.C.; Murray, A. Arteries stiffen with age, but can retain an ability to become more elastic with applied external cuff pressure. Medicine 2015, 94, e1831. [Google Scholar] [CrossRef] [PubMed]
  35. Allen, J. Photoplethysmography and its application in clinical physiological measurement. Physiol. Meas. 2007, 28, R1–R39. [Google Scholar] [CrossRef] [PubMed]
  36. Aktaruzzaman, M.; Sassi, R. Parametric estimation of sample entropy in heart rate variability analysis. Biomed. Signal Process. Control 2014, 14, 141–147. [Google Scholar] [CrossRef]
  37. Yentes, J.M.; Hunt, N.; Schmid, K.K.; Kaipust, J.P.; McGrath, D.; Stergiou, N. The appropriate use of approximate entropy and sample entropy with short data sets. Ann. Biomed. Eng. 2013, 41, 349–365. [Google Scholar] [CrossRef] [PubMed]
  38. Tocci, G.; Barbato, E.; Coluccia, R.; Modestino, A.; Pagliaro, B.; Mastromarino, V.; Giovannelli, F.; Berni, A.; Volpe, M. Blood pressure levels at the time of percutaneous coronary revascularization and risk of coronary in-stent restenosis. Am. J. Hypertens. 2015, 29, 509–518. [Google Scholar] [CrossRef] [PubMed]
Figure 1. Synchronously recorded ECG and finger PPG signals. The detected R-wave peaks are denoted as “●” and the feet of PPG are denoted as “►”. RR interval is the interval between two adjacent R-wave peaks and PTT interval is the interval from the R-wave peak to the foot of PPG signal.
Entropy 18 00246 g001
Figure 2. Examples of the RR time series from before (a) and after (b) PCI procedure; (c) and (d) show the corresponding scatter plots for the two RR time series, respectively.
Entropy 18 00246 g002
Figure 3. Examples of the PTT time series from before (a) and after (b) PCI procedure. (c) and (d) show the corresponding scatter plots for the two PTT time series, respectively.
Entropy 18 00246 g003
Figure 4. Ladder plots for the changes of RR interval (a) and PTT interval (b) from before and after PCI procedure for each individual of the 16 patients. Their mean values are also given.
Entropy 18 00246 g004
Table 1. Basic characteristics for the enrolled 16 CAD patients.
VariablesValueRange
Number (M/F)16 (13/3)-
Age (year)61 ± 944–80
Height (cm)169 ± 7157–181
Weight (kg)72 ± 956–90
BMI (kg/m2)25.1 ± 2.520.8–28.7
SBP (mmHg)130 ± 14111–150
DBP (mmHg)79 ± 1067–103
LVEF (%)61 ± 650–72
Note: value is expressed as number (male/female) or mean ± standard deviation (SD). BMI: body mass index; SBP: systolic blood pressure; DBP: diastolic blood pressure; LVEF: left ventricular ejection fraction.
Table 2. Detailed recording times for all ECG and PPG signals before and after the PCI procedure.
Subject No.Time Interval between the Singal Recording and PCI Intervention Operation
Before PCI (h)After PCI (h)
119.618.8
223.624.0
321.622.1
421.722.5
519.720.3
621.619.4
717.318.5
824.023.3
918.321.8
1023.219.4
1123.724.0
1216.021.6
1318.018.9
1418.58.9
1519.422.7
1623.320.6
Average20.620.4
SD2.63.6
Table 3. Changes of RR and PTT intervals from before and after PCI procedure as well as their blood pressure measurement results.
ParametersBefore PCIAfter PCIp-Value
RR (ms)973 ± 85907 ± 100<0.05
PTT (ms)207 ± 18214 ± 19<0.01
SBP (mmHg)130 ± 14131 ± 180.4
DBP (mmHg)79 ± 1079 ± 110.9
Note: value is expressed as mean ± standard deviation (SD). SBP: systolic blood pressure; DBP: diastolic blood pressure.
Table 4. HRV and PTTV results from before and after PCI procedure when setting the different time windows.
VariablesHRVPTTV
Before PCIAfter PCIp-ValueBefore PCIAfter PCIp-Value
n = 200
SDTS (ms)23.8 ± 10.419.2 ± 7.40.104.29 ± 1.774.29 ± 1.830.99
FuzzyMEn0.83 ± 0.240.64 ± 0.34<0.051.09 ± 0.130.96 ± 0.16<0.01
n = 100
SDTS (ms)23.3 ± 10.118.1 ± 6.8<0.054.16 ± 1.684.20 ± 1.910.90
FuzzyMEn0.85 ± 0.270.70 ± 0.30<0.051.11 ± 0.120.99 ± 0.14<0.01
n = 50
SDTS (ms)21.7 ± 10.216.7 ± 6.20.064.06 ± 1.664.09 ± 1.880.93
FuzzyMEn0.95 ± 0.230.82 ± 0.27<0.051.15 ± 0.131.04 ± 0.15<0.01
n = 25
SDTS (ms)20.8 ± 10.815.3 ± 5.7<0.053.99 ± 1.663.97 ± 1.860.95
FuzzyMEn1.10 ± 0.200.99 ± 0.21<0.011.22 ± 0.131.14 ± 0.15<0.05
Note: value is expressed as mean ± standard deviation (SD).

