Information Theoretical Study of Cross-Talk Mediated Signal Transduction in MAPK Pathways


1
Department of Chemistry, University of Calcutta, 92 Acharya Prafulla Chandra Road, Kolkata 700009, India
2
Department of Chemistry, Bose Institute, 93/1 Acharya Prafulla Chandra Road, Kolkata 700009, India
*
Author to whom correspondence should be addressed.
†
Current Address: Department of Chemistry and Biochemistry, University of California, Los Angeles, CA 90095, USA.
Entropy 2017, 19(9), 469; https://0-doi-org.brum.beds.ac.uk/10.3390/e19090469
Submission received: 28 June 2017
/
Revised: 30 August 2017
/
Accepted: 1 September 2017
/
Published: 5 September 2017
(This article belongs to the Special Issue Information Decomposition of Target Effects from Multi-Source Interactions)
Abstract
:Biochemical networks having similar functional pathways are often correlated due to cross-talk among the homologous proteins in the different networks. Using a stochastic framework, we address the functional significance of the cross-talk between two pathways. A theoretical analysis on generic MAPK pathways reveals cross-talk is responsible for developing coordinated fluctuations between the pathways. The extent of correlation evaluated in terms of the information theoretic measure provides directionality to net information propagation. Stochastic time series suggest that the cross-talk generates synchronisation in a cell. In addition, the cross-interaction develops correlation between two different phosphorylated kinases expressed in each of the cells in a population of genetically identical cells. Depending on the number of inputs and outputs, we identify signal integration and signal bifurcation motif that arise due to inter-pathway connectivity in the composite network. Analysis using partial information decomposition, an extended formalism of multivariate information calculation, also quantifies the net synergy in the information propagation through the branched pathways. Under this formalism, signature of synergy or redundancy is observed due to the architectural difference in the branched pathways.
1. Introduction
The decision making processes at the cellular level are initiated by some specialised signalling networks [1,2]. These networks play a pivotal role in making robust and precise cellular response towards endogenic and exogenic perturbations. In addition, the process of decision making resolves cellular fate as well as survival strategies in diverse peripheral conditions. Although both prokaryotic and eukaryotic cells are comprised of several common signalling networks, few signalling networks are incorporated mostly in the eukaryotes [3].
As an evolutionary outcome, cells have developed an optimal protein-protein (cognate and noncognate) interaction within the signalling pathway to transduce extra-cellular information efficiently [4]. One such signalling network is the mitogen-activated protein kinase (MAPK) pathway that plays the central role to attune with extra-cellular signal in eukaryotic cells [5,6,7,8,9]. Although different MAPK pathways with diverse inputs and outputs belong to a higher living species, they are sometimes interconnected through overlapping sets of signalling components. Depending on the interconnections, MAPK pathways can be classified into different groups that use one or more than one common signalling components. Moreover, as a result of cross-interaction, a single regulon regulates multiple targets in addition to its cognate target. Such type of signal association is defined as cross-talk. Cross-coupling in the signalling network can modify the functionality of a network topology and can subsume errors compared to the uncoupled one. Cross-interactions have been identified not only in eukaryotes but also in prokaryotes, as observed in the bacterial two-component system [10,11,12,13,14]. In the eukaryotic system, cross-talk has been identified in numerous situations [15,16,17]. Furthermore, cross-talk and several of its variants have also been identified at different stages of gene regulation [18,19,20,21,22].
Since cross-talk is observed in a broad range of biological processes, one may interrogate the functional utility of such network coordination. The cross-coupling mechanism is conveyed through generations and observed in a significant number of evolutionary descent. This signature remains prominent in the course of evolution in spite of other modifications that are taking place at the cellular level. Such character indicates that cross-talk might have a definite functional role to build up synchronised cellular regulations by spending the stored energy. If this is true, how does a cell balance the trade-off between network association and potential cost? Few comprehensive experiments on the network connectivity suggest that networks of a well-delineated cluster are correlated with each other but are uncorrelated to the rest of the network [8]. Synchronisation is necessary to attain natural activity but needs to maintain a threshold value. Otherwise, too much synchronisation may lead to a physiological disorder like epilepsy [23]. Inter-pathway cross-talk becomes prominent due to the limitation of common resources, defined as the overloaded condition. However, cross-talk effect becomes faint in the underloaded condition, where the level of available resources are present in sufficient amount [19,20,22,24,25]. A key source of survival strategy under diverse environmental conditions is the generation of fluctuations which induces non-genetic variability in a cellular population. In such a situation, cells readjust to cope with the limited resources by introducing cross-correlation among a set of genes and thus implementing a successful bet-hedging program [22]. Cross-talk also facilitates synchronisation in different organs such as cardio-respiratory interaction, brain and tissues [23].
To address the functionality of cross-talk, we undertake a representative network comprised of well-characterized features of signal transduction. To be specific, we focus on MAPK pathway, a well-studied eukaryotic signalling machinery, conserved with three kinase cascades. In S. cerevisiae, five MAPK signalling pathways are present, out of which only three (pheromone response, filamentous growth response and osmostress adaptation) use a common kinase protein Ste11 [5,8]. In fact, pheromone response and filamentous growth pathways also use the same kinase Ste7. Pheromone MAPK cascade (Ste11 → Ste7 → Fus3) is activated by mating pheromone. Under low nutrient condition, filamentous growth MAPK cascade (Ste11 → Ste7 → Kss1) becomes active whereas high external osmolarity activates the osmoadaption cascade (Ste11 → Pbs2 → Hog1) [5,8]. Due to inter-cascade correlation among the three signalling pathways, one pathway can be activated by the signal of another pathway in the absence of its own signal. Several experimental results suggest that such cross-talk is filtered out by cross-pathway inhibition, kinetic insulation and formation of scaffold protein [5,8,26,27,28,29]. Although activation through inter-pathway cross-talk and cross-pathway inhibition compensates each other, information is exchanged among the pathways during these interactions. This leads to distinct queries (i) is it possible for an individual signalling pathway to convey its input signal reliably downstream without experiencing any influence from the other channels of signal? (ii) Since the inter-pathway connectivity is known not to allow the uniqueness of transduced signals - what are the physiological advantages of cross-talk? (iii) Is there any participation of pathway output in the cooperative regulation of a downstream target in a synchronised manner? (iv) How is it possible for correlated pathways to keep up static as well as dynamic synchronisation in a single cell environment that is prevalently stochastic in nature? (v) Do correlated fluctuations have any capability to control the variability in the correlation between two different proteins?
In the present manuscript, we study generic S. cerevisiae MAPK pathways to address the potential functionality of inter-pathway cross-talk within a stochastic framework. We consider two equivalent interacting MAPK pathways, each one consisting of a linear chain of three MAPK cascade proteins [5,8]. Both pathways get activated by their corresponding external signals propagating downstream through phosphorylation (activation) and dephosphorylation (deactivation) of the cascade proteins. In addition, due to cross-talk, phosphorylation of the intermediate components of the two pathways is influenced by the activated kinase of the other pathway along with the cognate one. As the population of each cascade protein is not sufficiently high within a single cell and experiences a fluctuating environment, we express all associated chemical reactions in terms of the stochastic differential equation. We solve the coupled set of nonlinear Langevin equations using linear noise approximation (LNA) [30,31] and calculate the variance of each kinase and covariance between two different kinases (see Section 2 and Appendix). Recent theoretical development [32] shows that LNA is not only limited to high copy number but also exact up to second moments of any chemical species involved in a second-order reaction. The fluctuations associated with at least one of the species participating in each of the second-order reaction are Poissonian and uncorrelated with the fluctuations of other species. Also, LNA remains valid for faster activation and deactivation (or synthesis and degradation) rates of the corresponding components compared to the coarse-grained (steady state) time scale [30,31,32,33,34,35,36,37,38,39,40].
To classify the signal transduction efficacy through two pathways in the presence of cross-association, we quantify two as well as multivariate mutual information. Distributions of all kinase proteins are approximately considered Gaussian, allowing us to adopt a reduced expression of mutual information [41,42]. The reduced equation mainly depends on the variance and the covariance of the corresponding kinase. We validate our analytical calculation by exact stochastic simulation [43]. In the first subsection, we quantify two variable mutual information under the influence of cross-talk parameter. We also investigate the mutual information between two non-cognate kinases and find causality of this coordination. Since causality leads to synchronisation [23,44], it is important to measure causality relation between the pathways, i.e., who regulates whom and to which extent. If both pathways interact with each other and transduce information of the corresponding input signal with different degrees, then it is challenging to characterize the magnitude and direction of signal propagation. To overcome such difficulty, we define a new measure, net information transduction, using the expressions of two cross mutual information, which satisfactorily quantifies the amount of net signal propagation. In the connection of measuring directionality, it is important to mention the concept of transfer entropy [45] which has been applied in several systems [46,47,48,49]. Transfer entropy quantifies the directed information transfer within a system. In the calculation of transfer entropy, one considers the time series of the random variable and makes use of the time lagged data. In our study, however, we make use of mutual information evaluated at steady state to define a relative dimensionless measure, net information transduction D (see Equation (1)). D is a normalized quantity and is bounded within a range . It helps to diagnose the direction of net information flow between the two parallel cross interacting signalling pathways. We also verify inter-pathway synchronisation with the help of coordinated fluctuations of stochastic trajectories of two parallel kinases. This result implies how two kinases are synchronised within a cell. To understand this phenomenon further, we investigate how much correlation develops between the steady state levels of two different kinases in a hypothetical population of genetically identical cells.
In the second subsection, we quantify three variable mutual information (i.e., two sources to one target, or one source to two targets) when both the channels of information flow work separately. We make use of three variable mutual information along with two variable mutual information to define the measure of net synergy [50]. In the present work, we quantify net synergy using the theory of partial information decomposition (PID) [51] as the formalism deals with the calculation of multivariate mutual information. Furthermore, it defines unique, synergistic and redundant information among the variables of interest. Following the initial development by Williams and Beer [51], several modifications of the formalism have been proposed till date [52,53,54]. In the context of dynamical systems obeying Gaussian noise processes the formalism has been further extended by Barrett [55]. We note here that the measure of interaction information is the negative of the measure of net synergy [56]. Considering the interactions between two parallel MAPK pathway, we identify signal integration and signal bifurcation motif. In signal integration motif, two MAPKKK proteins transmit signal into a single MAPKK protein which amounts to a sub-motif with two inputs and one output. On the other hand, in signal bifurcation motif, a single MAPKKK protein transmits signal to two MAPKK protein thus leading into a sub-motif with one input and two outputs. Quantification of information transmission in these two sub-motifs requires calculation of both two variable and multivariate mutual information which in turn provides the metric of net synergy. We observe the sign of net synergy value changes depending on the signal integration as well as signal bifurcation and is mainly controlled by pathway architecture.
2. Results and Discussion
2.1. Two Variable Mutual Information
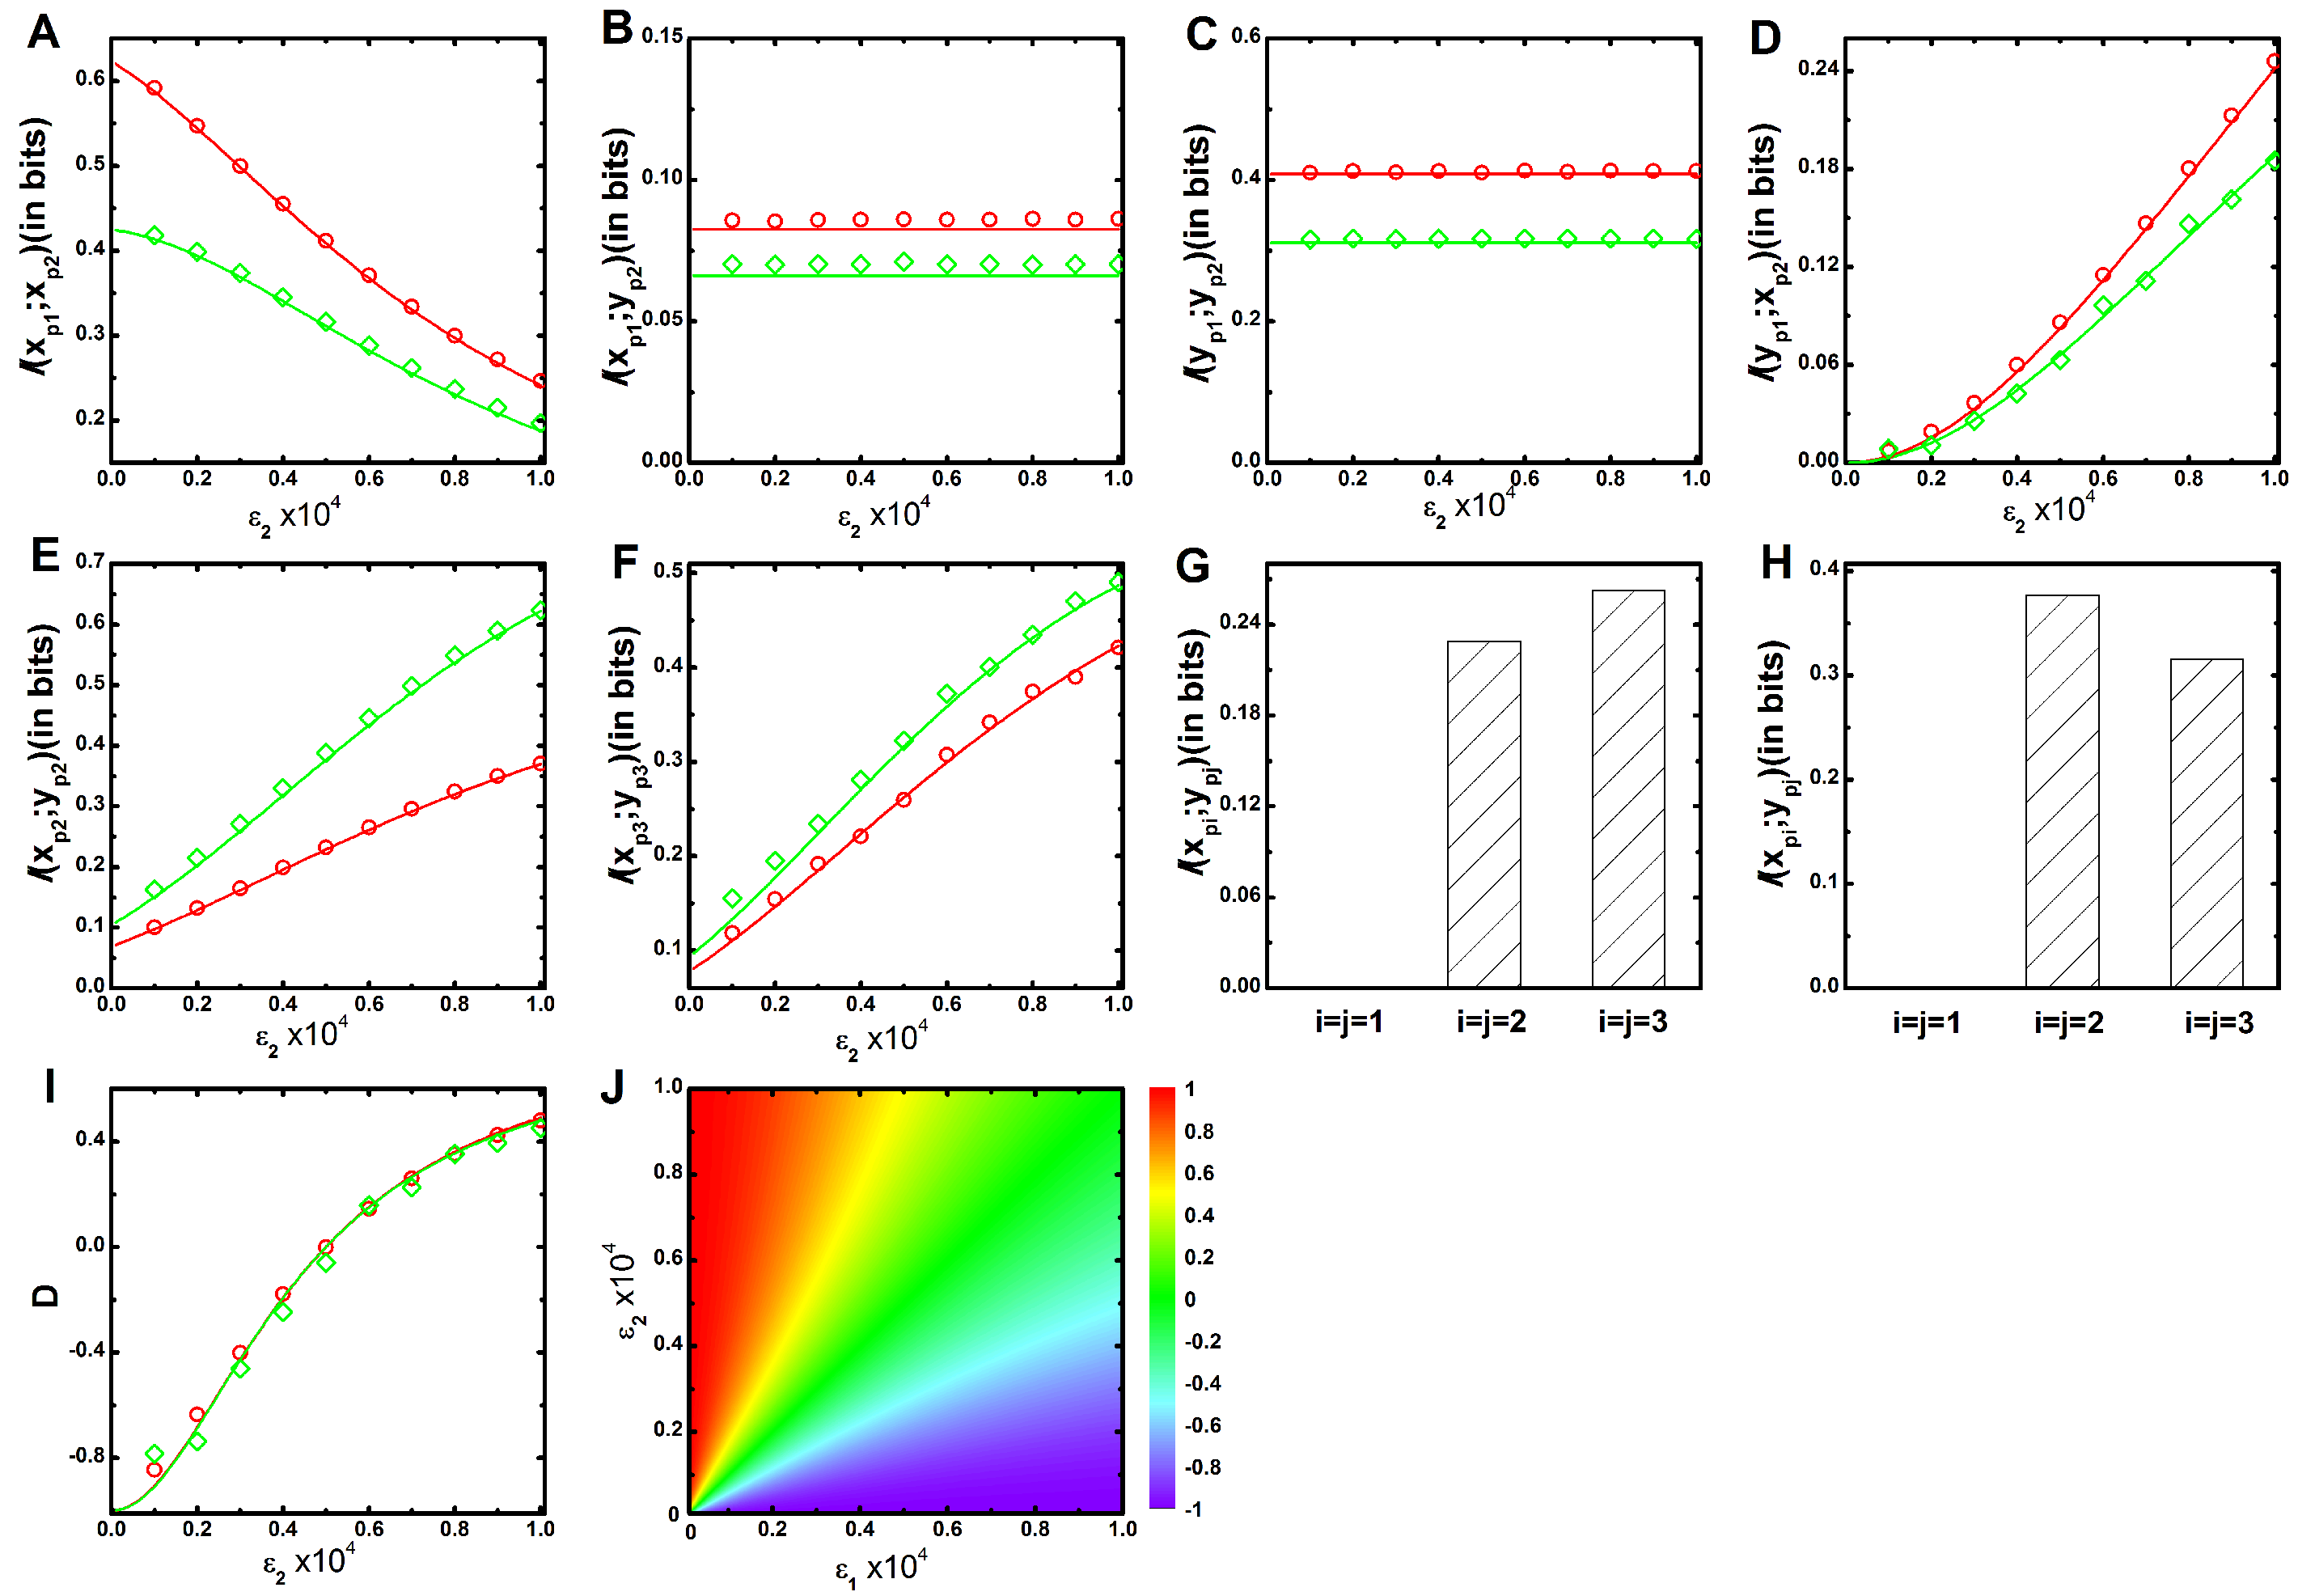
The parameters and control the signalling channel X and Y, respectively. In Figure 1, we show the mutual information profile as a function of for two different sets of parameters (see Table 1 and Table 2) while keeping constant. Figure 1A shows that mutual information between and kinases decays with the increment of . Augmentation of includes a competition between and to phosphorylate the kinase. During phosphorylation, mutual association is originated, and signal transduction is ensued. Thus, for the low value of , maximum level of mutual information is attained due to minimal phosphorylation competition. On the other hand, minimum level of mutual information is propagated at high value due to maximum phosphorylation contribution of . In Figure 1B, mutual information between and is plotted, which shows a constant value as a function of . This happens as has no influence in the alteration of mutual information. The same logic is applicable to the mutual information between and shown in Figure 1C. In Figure 1D, mutual information between and increases as a function of , as is only responsible for establishing the cross-talk between and . This result implies that with the enhancement of cross-talk the process of signal integration through increases. The same profiles can be generated as a function of , while keeping fixed. These results together indicate that and depend on , whereas and depend on . In Figure 1A–D, the green lines drawn for slower relaxation rate (see Table 2) always maintains a lower mutual information value compared to the red lines drawn for faster relaxation rate (see Table 1). Relaxation rates of the corresponding kinases i.e., , , , , and are , , , , and , respectively, where the angular bracket indicates the deterministic copy number at long time limit (see Appendix). An input signal can reliably flow downstream if relaxation rate (or degradation rate) of a cascade protein is higher than that of its upstream cascade proteins [35]. For red line, we consider higher degradation rate for and ( and ) compared to (). Thus, faster relaxation rates are attained under this condition with high information propagation capacity.
Next, we quantify mutual information between two parallel kinases ( and , with ) of the two equivalent interacting MAPK pathways. The inter pathway coupling is unidirectional when either or is zero but is bidirectional when both are non-zero. In this situation, both variables ( and ) do not interact with each other but are regulated by a common kinase regulon incorporating coordinated fluctuations into these variables. In other words, quantification of mutual information actually evaluates the extent of cross-correlation between these two variables. We observe zero mutual information value between and , as these are uncorrelated. In Figure 1E, we show mutual information between and as a function of keeping fixed. The profile shows an increasing trend as cross-talk parameter increases. Similarly, in Figure 1F, mutual information between and is shown with a similar trend as in Figure 1E. Interestingly, for faster relaxation time scale, mutual information between similar cascade kinases increases while moving from second ( and ) to third ( and ) cascade. On the other hand, an opposite trend is observed for slower relaxation time scale. This characteristic trend is further shown in Figure 1G,H using bar diagram. These results together suggest that fluctuations due to faster relaxation rate transduce correlated fluctuations in a better way compared to the slower one. In Figure 1E, mutual information is high for slower relaxation rate than the faster one, as slower rate parameters yield high level of and which in turn incorporate extra fluctuations that help to increase mutual association. A similar result is also observed in Figure 1F. Identical mutual information profiles of and can be generated as function of keeping fixed. These results suggest that both the cross-talk parameters and contribute equally to the development of an association between two parallel pathways.
Both the mutual information between and , and are capable of providing a satisfactory explanation of enhancement of cross-talk with the increment of inter pathway interaction parameters ( and ). Under equivalent interactions condition (), each pathway shares its information with other to an equal extent and is quantified not only by and but also by and . However, characterization of the direction of information transduction is difficult under unequal condition (). Except the equivalent condition () where the net information ( ) flow is zero, it has a definite value with directionality (positive or negative value) at all other conditions. Since the definition of mutual information is symmetric in nature and usage of the same is difficult to provide directionality of information propagation, we define a dimensionless quantity, net information transduction (D) using and as
The above expression implies that it is maximal () when is zero, i.e., no information propagation from to (). It is minimal () when is zero, which specifies zero information propagation from to (). In Figure 1I, we show the profile of D as a function of while keeping fixed, where the value of D changes from negative to positive as increases. It suggests that at low , information flowing from X to Y pathway dominates over the flow from Y to X. In other words, in this regime, the net information flow is accounted for by X → Y, leading to a negative value of D. On the other hand, at high , the direction of net information propagation is from Y to X due to reverse situation and generates a positive D value. The opposite scenario can be observed if one generates the profile of D as a function of for fixed In this connection, it is important to mention that both the relaxation time scale limits generate a similar profile of D. As a result, both the profiles of D exhibit data collapse when depicted as a function of for fixed (Figure 1I) or vice versa. This observation indicates that normalised profiles of D are independent of relaxation time scales. In Figure 1J, we also show a 2d-surface plot of D as a function of both and for faster relaxation time scale (Table 1). The surface plot indicates zero (or near to zero) value of D along the diagonal region (). However, the off diagonal region is positive for and negative for .
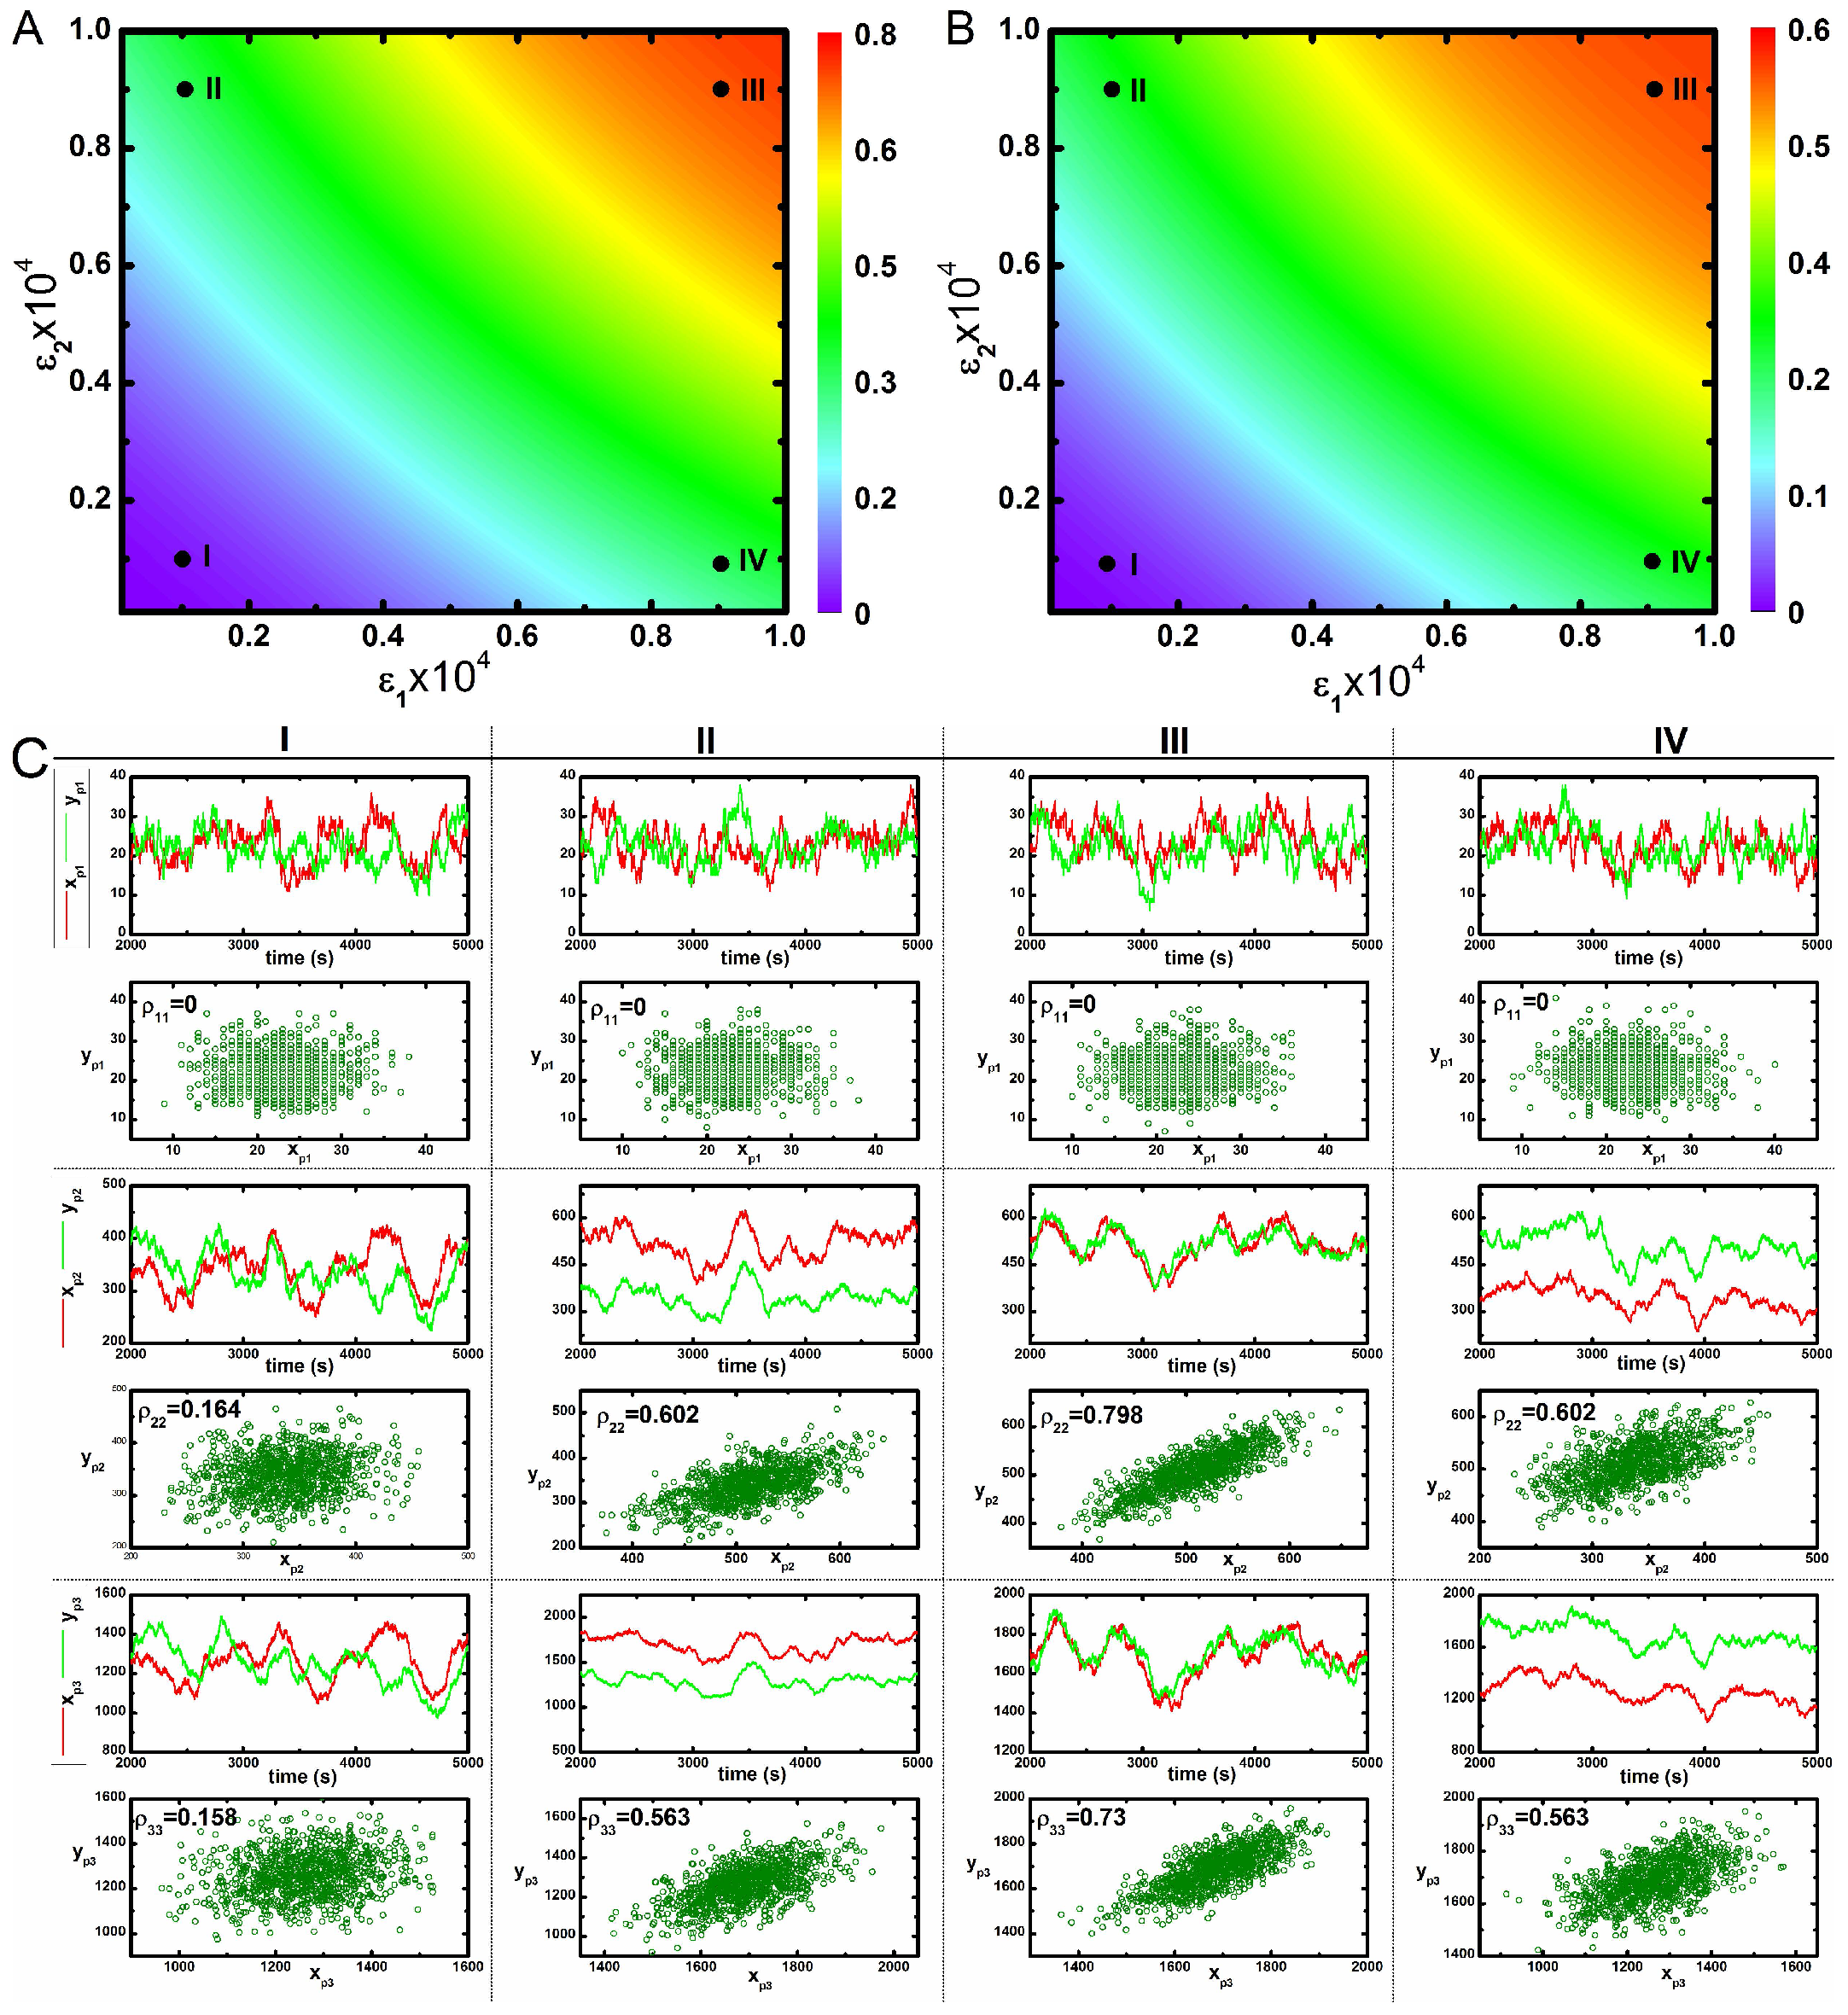
In Figure 2A,B, we show two 2d-surface plots of mutual information between and , and kinases, respectively, as a function of two cross-interaction parameters and under faster relaxation time scale (Table 1). Both figures show maximum mutual information at high values of the two parameters. Since, and are equally responsible for developing the cross-correlation between two pathways, one can check the effect of maximisation of mutual information by increasing any one of these two parameters. Although we can quantify the influence of cross-talk with the help of two variable mutual information, and , it is difficult to get an insight how the static and dynamic populations of the phosphorylated kinases are correlated. To this end, we have checked such correlation as shown in Figure 2C. Dynamic correlation can be measured using stochastic trajectories of the two variables in a single cell. If sufficient association between two trajectories exist, then correlated fluctuations are observed i.e., one trajectory closely follows the other. Otherwise, uncorrelated fluctuations (trajectories do not follow each other) are seen in the absence of cross-talk. In Figure 2C, we show stochastic time series of different phosphorylated kinases under varied conditions. Here, four different sets of and parameters have been used - mentioned as I, II, III and IV in Figure 2A,B. The stochastic time series exhibit correlated fluctuations at high and . However, uncorrelated time series are seen at low and . Each of these time series are generated from a single run of stochastic simulation and represents the dynamics in a single cell.
Next, we have executed 1000 independent stochastic simulations and measured the steady state phosphorylated kinase levels from each run to draw a scatter plot. Here, the collection of symbols mimics the behaviour of a hypothetical population of 1000 genetically identical cells. Each symbol in the scatter plots is due to a single stochastic run and represents copies of phosphorylated kinases ( and , ) in a single cell expressed at steady state. In other words, each symbol signifies the steady state phosphorylated protein levels in an individual cell within a hypothetical population. Using this concept, we measure static correlation among the pairs of phosphorylated kinases (, etc.) produced in different cells within the population. The motivation behind creating a scatter plot is to measure the static correlation between two phosphorylated protein levels expressed in different cells [57,58,59]. In Figure 2C, we show static correlation between different phosphorylated kinases expressed in different cells. For plots with high and values, most of the symbols are aligned diagonally in a narrow strip but for low and , symbols are distributed in a much larger space.
Correlated variation of these kinases in the population is observed along the diagonal direction. However, an uncorrelated variation along the off-diagonal direction reflects an increase in variability between two phosphorylated kinases with respect to each other in a population. Therefore, enhancement of cross-talk decreases variability between two kinases in a population. These results imply that cross-talk develops correlated fluctuations between kinases in a population, thereby assisting in the successful development of a robust adaptation machinery as observed in the bet-hedging program under diverse environmental conditions [22]. Here, an increase in the correlation between two different protein pool (with high Pearson’s correlation coefficient) is observed for maximal cross-talk. On the other hand, a decrease in correlation is seen for minimal cross-interaction. Similar behaviour can be seen under slower relaxation time scale (Table 2) as shown in Figure 3. The primary difference between the nature of correlation between and are visible from Figure 2 and Figure 3. In Figure 2, the correlation between is always higher than for all four conditions. On the other hand, in Figure 3, it shows an opposite trend. We note that coordinated fluctuations of different MAPK proteins are generated due to cross-talk between two parallel pathways that ultimately lead to similar cellular function with high reliability. Fluctuations in the transcription factor are much faster than the transcript dynamics. On the other hand, fluctuations in the transcription factor (known as extrinsic fluctuations) are comparable with the gene switching (on-off) time scale. Such time scale agreement gets reflected in the dynamics of the transcript [36].
2.2. Three Variable Mutual Information
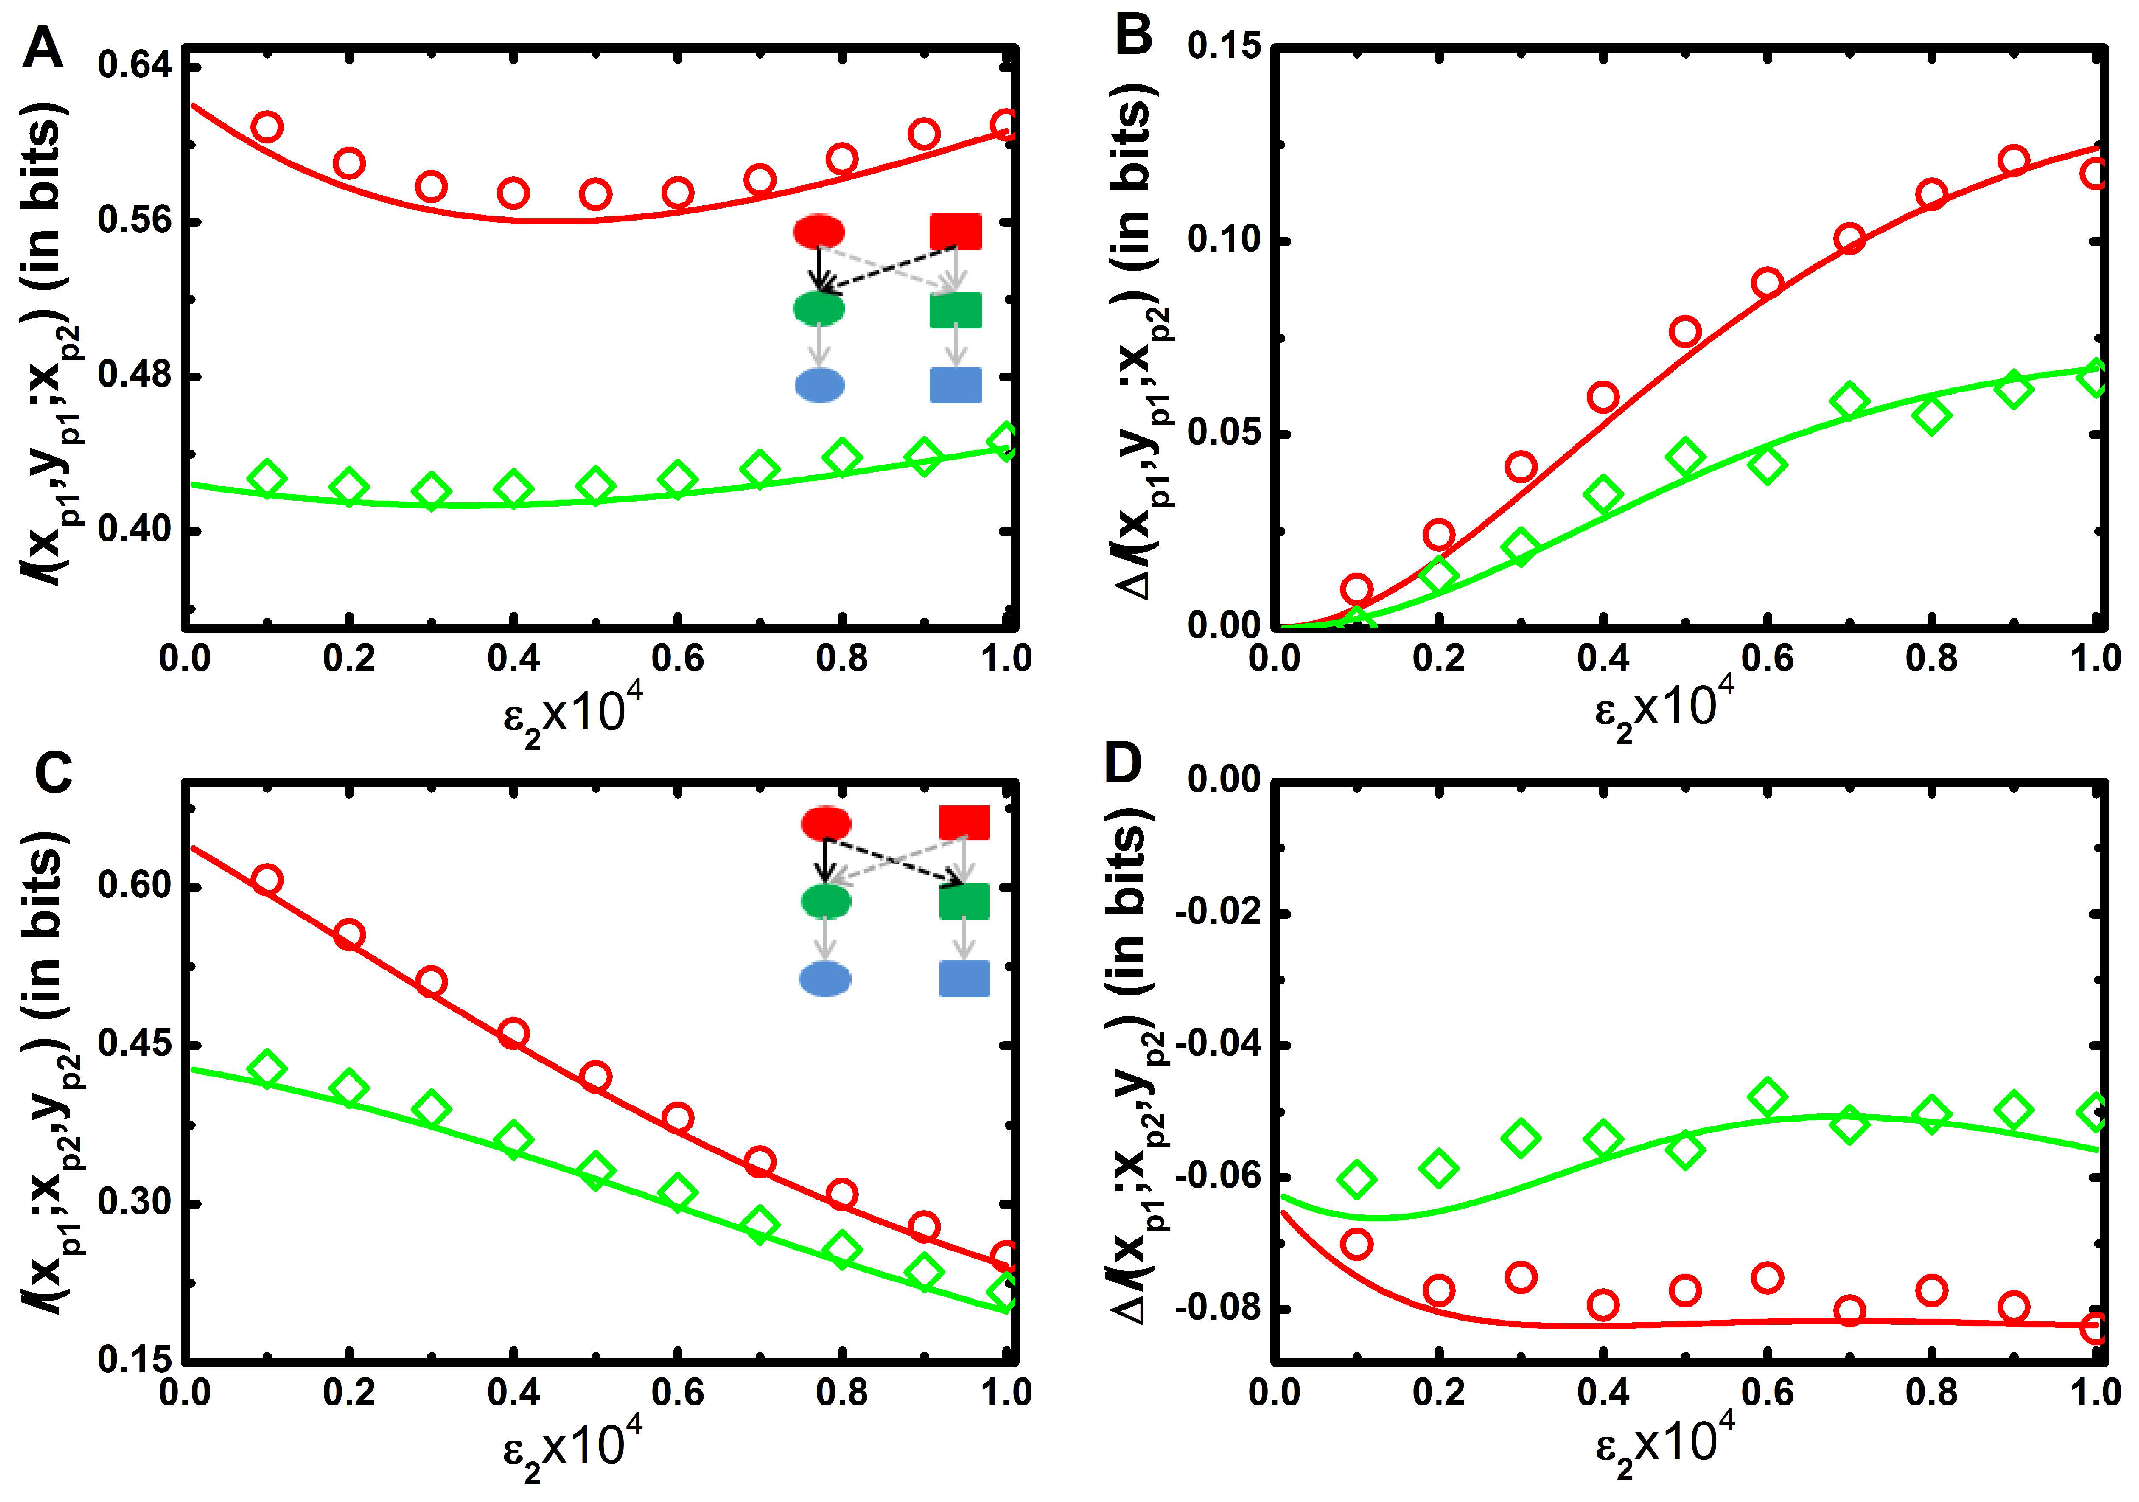
In the foregoing discussion, we have shown the effect of cross-talk in terms of conventional two variable mutual information. However, as cross-interaction between two pathways develops a complex network, a comprehensive study of three variable mutual information provides an extra insight. In the present study, three variable mutual information is defined as and for two types of branched pathways (see Section 3.2). One of the branched pathways is two inputs ( and ) and one output ( or ) motif where two input signals are integrated into a single output. The other is one input ( or ) and two outputs ( and ) motif where the input signal is bifurcated into two outputs. In this subsection, we investigate the efficacy of such signal integration as well as signal bifurcation. Since marginal and joint distributions of all cascade proteins are considered approximately Gaussian, we adopt multivariate mutual information theory [49,50,51] to analytically estimate three variable mutual information [55]. Each branched motif consists of two signal propagating channels that work together. It is thus interesting to investigate whether these signalling channels perform separately and what significant change arises in the estimation of three variable mutual information. The change in the magnitude of mutual information is defined by net synergy [50] and is evaluated using the theory of partial information decomposition [49,51,55] in terms of the difference between three variable mutual information and two corresponding two variable mutual information. The value of net synergy is either positive or negative; a positive value indicates synergy (extra information) whereas negative value measures redundancy (deficit of information) [50,55].
In Figure 4A, we show mutual information, of two inputs and one output model as a function of for a fixed value of . The profile shows a bifunctional behaviour with the increment of ; initially it decreases up to a certain value of , and then it increases. At low , a minimal amount of signal is propagated from to . Consequently, the motif reduces to a single input-output motif and the motif regains its native form due to the significant contribution of . In Figure 1A, we show that two variable mutual information between and decreases with the increment of . Similar situation arises in Figure 4A for low value of . On the contrary, increases with the increment of (Figure 1D). Thus, two opposing effects work together to generate the convex profile. In Figure 4B, we plot net synergy of the motif as a function of for a fixed value of and it is seen to increase monotonically. It is pertinent to mention here that for this motif, one always gets a positive net synergy value as a function of . This result implies that an integrating signalling motif transduces more information compared to the summation of two isolated channels. The extra information, i.e., synergy facilitates fidelity of the output kinase. Intuitively, the sum of the reduction in the uncertainty (cross-correlation) of the output kinase contributed by each input signal is lower than the reduction in the uncertainty of the output provided by both signals together. This phenomenon implicates the aspect of integration of multiple signals in cellular signalling network motif as observed in V. harveyi quorum-sensing circuit [60,61].
In Figure 4C, we show mutual information of one input and two outputs motif with the increment of for a fixed value of . The mutual information value decreases with since propagation of information from to is only inhibited by the cross-interaction. However, does not have any influence in information propagation from to and remains unaltered. Thus, three variable mutual information profile follows a decreasing trend. Figure 4D shows decreasing trend of net synergy profile as a function of for a fixed value of . Importantly, for this motif negative values of net synergy are observed irrespective of the value of . This indicates redundancy in the information transmission in this composite motif compared to the sum of the individual one. Naturally, predictability about the output kinases decreases when two isolated signal propagation channels work together to form a bifurcated signal transduction motif. This result implies that although bifurcated signalling model reduces mutual information, it has a biological significance of the activation of multiple signalling channels in the presence of a single input as identified in the chemotaxis system of E. coli [62]. In all figures (Figure 4A–D), the red lines are plotted for faster relaxation rate constants (Table 1) of and and the green lines are for slower relaxation rate constants (Table 2).
3. Materials and Methods
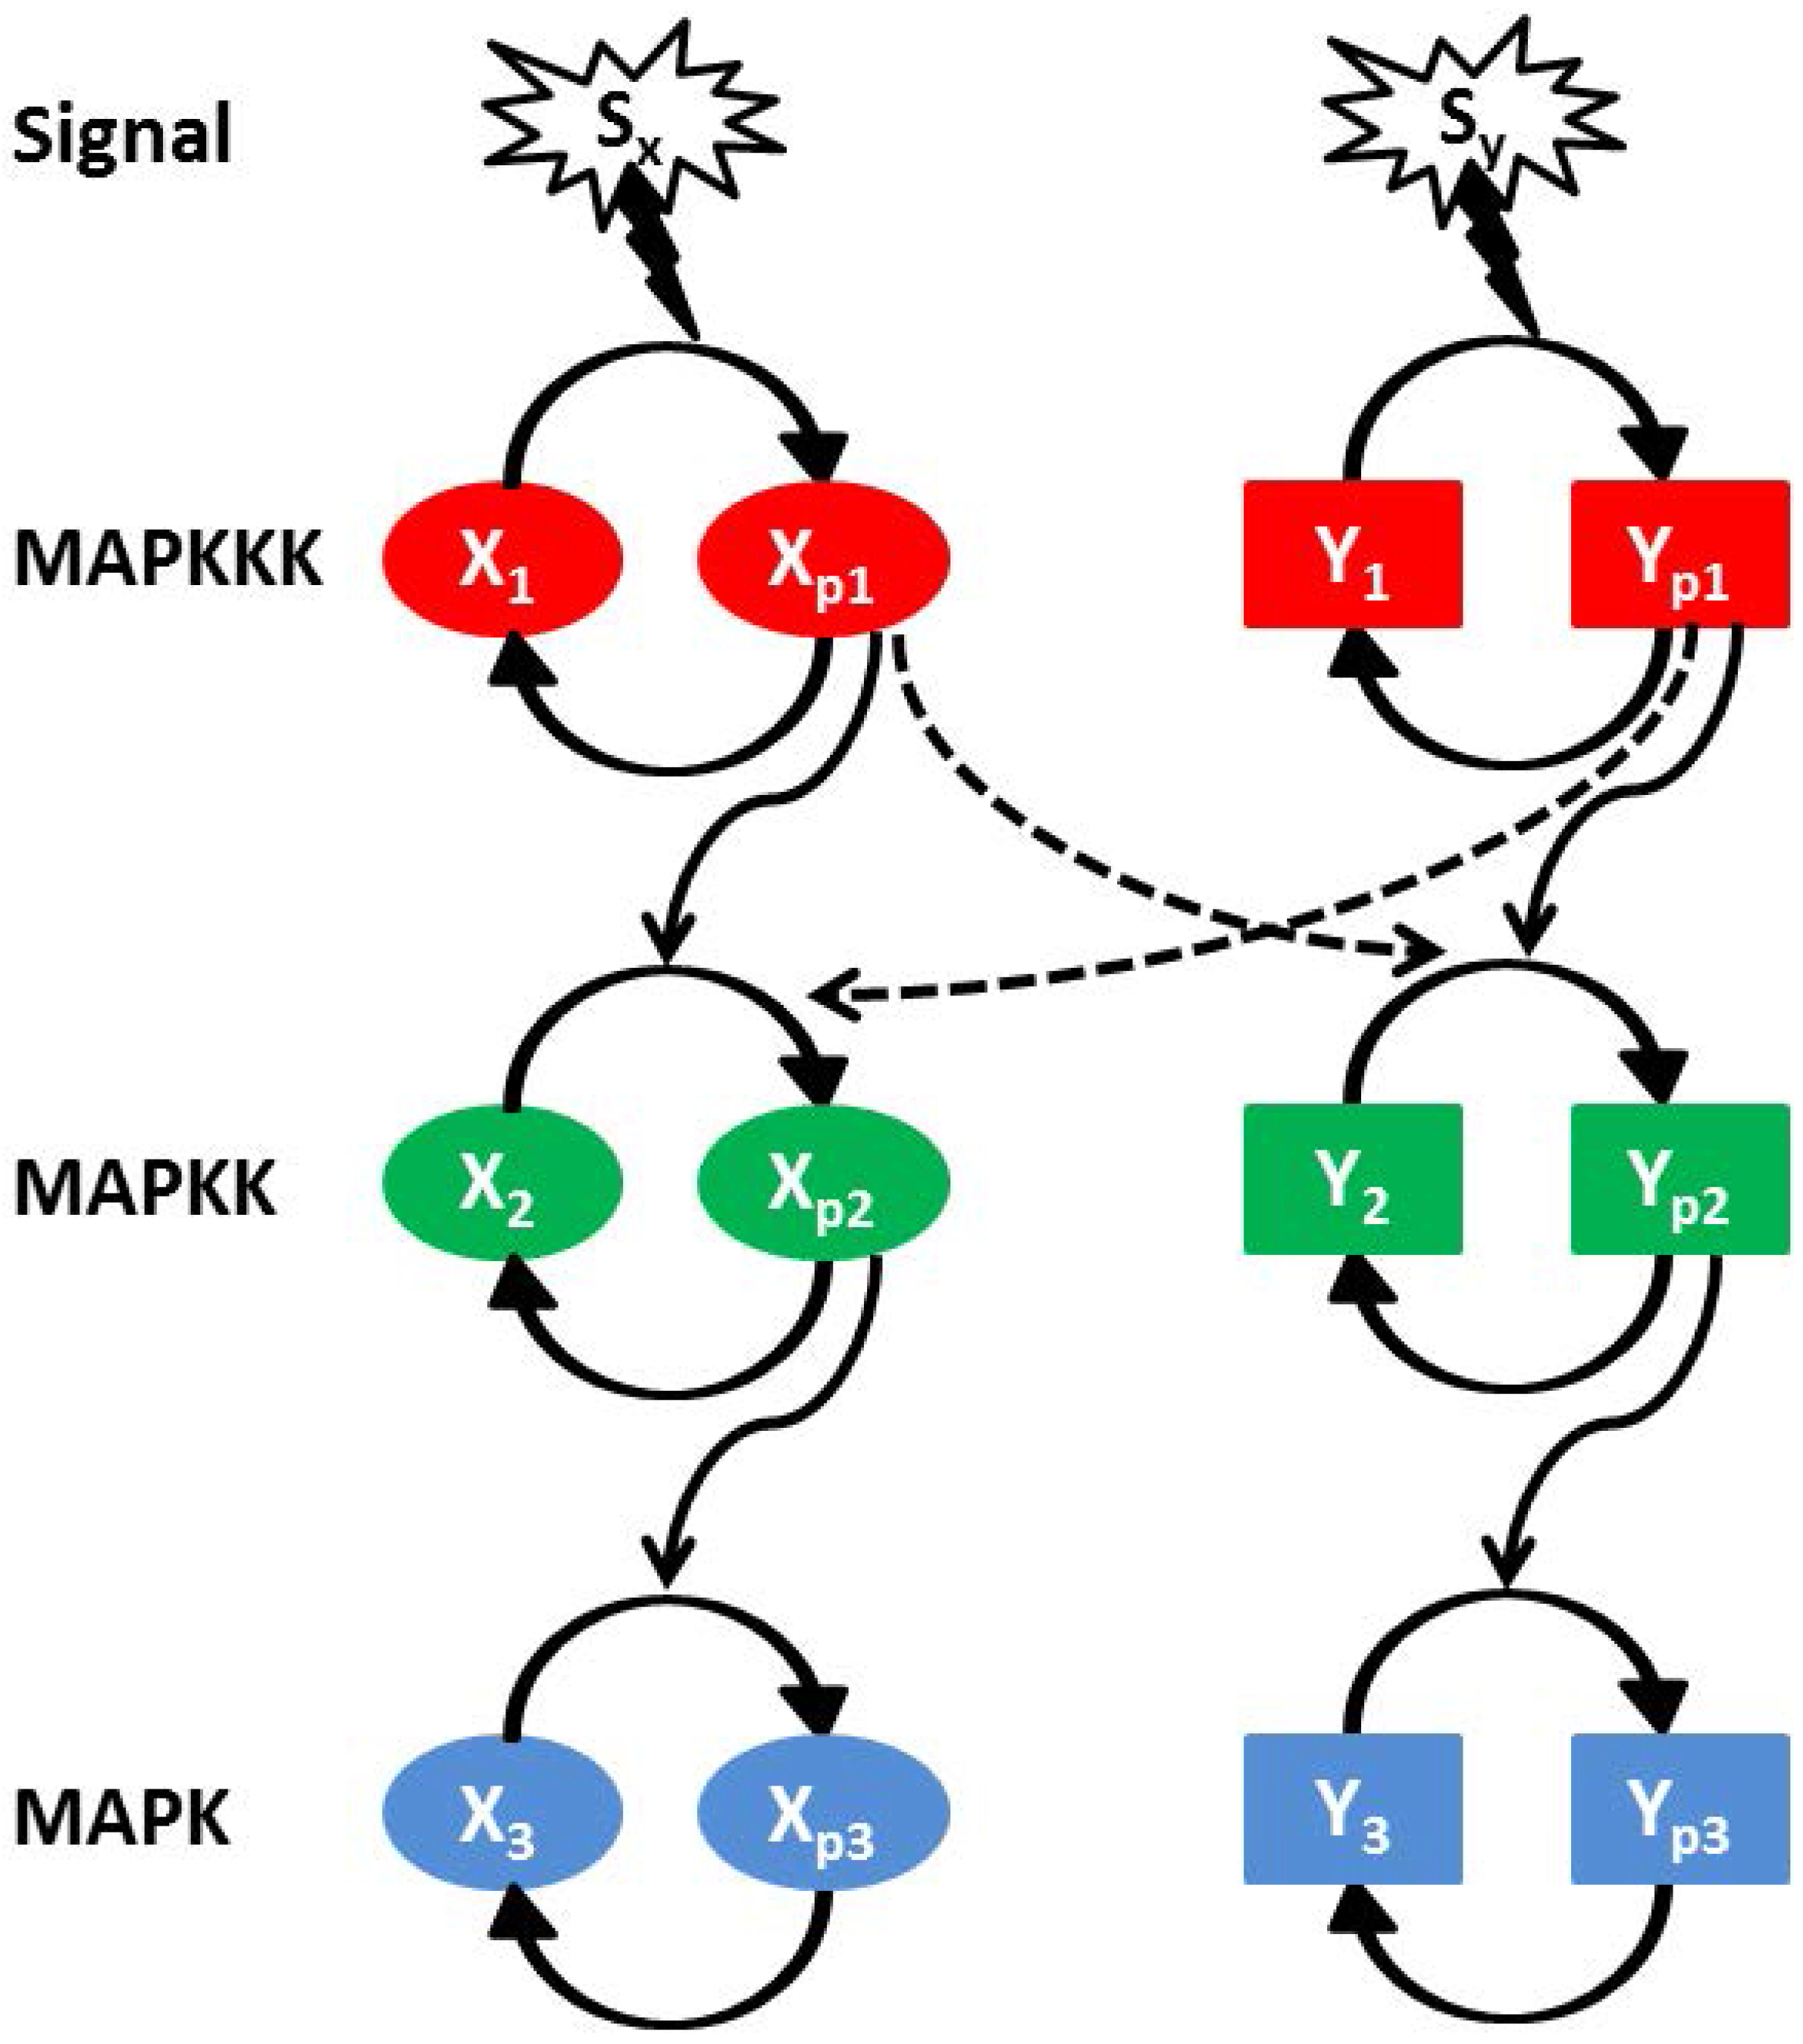
In Figure 5, we show a schematic diagram of two interacting parallel MAPK pathways (named as X and Y). Each MAPK pathway consists of three kinase components, i.e., , , (X pathway) and , , (Y pathway) [7,28,63,64,65]. and represent dephosphorylated and phosphorylated form of a kinase proteins, respectively, and the same applies to and (here ). The first cascade protein of a MAPK pathway gets phosphorylated with an exposure to the external stimulus. While phosphorylated, it positively regulates the phosphorylation of its own downstream kinase along with the kinase of the other pathway. The phosphorylated intermediate kinase regulates phosphorylation of the last kinase. To maintain the pool of phosphorylated kinase within a cell, a dephosphorylation process is in action with the help of phosphatase molecules. The cross-pathway interactions between two parallel MAPK pathways are denoted by the dashed lines in Figure 5 along with the cross-interaction rate parameters and . and are the two extra-cellular signals acting on the X and Y pathway, respectively.
Both pathways get causally correlated through cross-interactions, and a cross-talk develops as a consequence. Causal relationships are frequently examined in various circumstances that are subjected to stochastic fluctuations [23,44,50,55]. In the present manuscript, we quantify the causal relationship in terms of mutual information. Here, the two cross-interaction parameters and play a significant role in establishing different levels of cross-talk. The parameter controls information flow from X to Y pathway (), but the parameter is responsible for Y to X pathway () information flow. In this connection, it is important to mention that during mating process, both pheromone and filamentous growth pathways are activated to a roughly equal extent, whereas during invasive growth process, only filamentous growth pathway is activated [26]. These observations corroborate with our model development. In our calculation, we only consider the post-translationally modified forms of all MAPK proteins. Thus, in the model, the total population of a MAPK protein is the sum of the phosphorylated and the unphosphorylated form of the protein and is considered to be constant ( constant, here ). In addition, we consider a physiologically relevant parameter set for our calculation [6,9,66].
3.1. Two Variable Mutual Information
Adopting Shannon’s information theory [41,42], we have calculated two variable mutual information between two phosphorylated kinases,
A generalised index and have been considered to represent the copy number of two different phosphorylated kinases. Similarly, and are the marginal and is the joint probability distributions associated with the corresponding kinases. For the calculation of mutual information between two kinases of X signalling pathway, we have replaced by (where ) and the reverse replacement has been followed for Y signalling pathway. For the estimation of mutual information between two equivalent kinases ( and ) of the respective pathways, we have used the same formula for condition. Mutual information can also be written in the form of the entropy function. Hence, Equation (2) can be redefined as
Here, and are individual and is total entropy of the respective kinases. In the present study, both probability distribution functions (marginal and joint) are approximately considered to be Gaussian as experimental studies on MAPK pathway show Gaussian dynamics [67]. Thus, using Gaussian channel approximation [41,42,55], Equation (3) takes the reduced form
where and are variances and is covariance of the corresponding kinases (for detailed calculation see Appendix). At this point it is important to mention that no prior knowledge is required about the nature of probability distribution function for evaluating mutual information using Equation (2). For exact or approximate Gaussian distribution, one can reduce Equation (2) to Equation (4) applying Gaussian channel approximation. However, for systems with non-Gaussian distribution, one can still use Equation (2) with proper analytical expressions of probability distribution functions that may contribute expressions of higher moments in Equation (4).
In the present work, all expressions of two variable mutual information are calculated using Equation (4). The analytical results are then validated by evaluating probability distribution functions (Equation (2)) using exact numerical simulation [43]. The two variable mutual information value is bounded within a scale . To quantify the association between two equivalent kinases, we have used Pearson’s correlation coefficient () [68]
3.2. Three Variable Mutual Information
The three variable mutual information are calculated for both signal integration and signal bifurcation motif. In the first motif, two phosphorylated input kinases interact with one output kinase. Hence the complete description of mutual information is given by
where and are the joint distribution functions of the corresponding components. On the other hand, is the marginal distribution of phosphorylated kinase. One can also write Equation (6) in terms of the respective entropy
Similarly, using Gaussian approximation [41,42,55], one can reduce Equation (7) into the following form
with
Here, the magnitude of three variable mutual information is bounded within a scale . Using PID formalism, the three variable mutual information can be decomposed into two parts [50,55]. As a result, the net synergy expression becomes
Furthermore, one can calculate mutual information for the signal bifurcating motif with the help of associated distribution functions
and the entropy representation of Equation (10) is
Using Gaussian approximation [41,42,55] Equation (11) becomes
with
In addition, the three variable mutual information value is bounded within a range , . In this case, one can also use the theory of PID to decompose the three variable mutual information into two parts and calculate the net synergy [50]
For analytical calculation, we have adopted Equations (4), (5), (8), (9), (12) and (13) which contain only variance and covariance expressions, whereas we adopt numerical simulation for evaluation of the expressions given in Equations (2), (6) and (10).
At this point it is important to mention that we validate our analytical calculation by exact stochastic simulation, commonly known as stochastic simulation algorithm or Gillespie algorithm [43]. The validation signifies how much closer the system dynamics with the Gaussian statistics. Corroboration of analytical and simulation results indicate a valid consideration of linear noise approximation. In our numerical simulation, we have used trajectories. We note that the dynamics of different MAPK pathways exhibit different temporal evolution [8]. However, the average physiological time scale for the activation of MAPK pathways is ∼ 1 h [15]. Keeping this information in mind, each stochastic simulation was executed for 5000 s (∼ 1.38 h) to ensure that the system dynamics reaches steady state. Using the final value of the variables of each run we carry out the calculation of different variances and covariances to evaluate different expressions of mutual information.
4. Conclusions
To summarize, we have investigated evolutionarily conserved yeast MAPK signalling pathway. In our phenomenological model, we study two parallel MAPK signalling pathways where one signalling pathway in addition to its cognate pathway activates the non-cognate pathway through cross-talk with an emphasis to understand the change in the dynamical behaviour of the system in the presence of cross-talk at the single cell level. The model nonlinear Langevin equations have been solved under the purview of LNA to quantify the variance and the covariance associated with the different phosphorylated kinase. These quantities assist in the evaluation of mutual information (two variable and multivariate) under Gaussian channel approximation. Quantification of mutual information has been carried out with the variation of two cross-talk parameters and . The two variable mutual information shows that cross-talk establishes correlation in the signal propagation among the two pathways. To represent a better insight into the directionality of the net information flow, we have defined a new dimensionless parameter (net information transduction D), which varies on a scale of to . Depending on the sign of D, we have deciphered the fidelity of one pathway compared to the other.
We show that cross-talk generates correlated fluctuations at the population level. A minimum and a maximum degree of coordination are observed at the low and high level of cross-talk, respectively. Our analysis thus suggests that coordinated fluctuations are the causal effect of cross-talk in MAPK signalling pathways. Furthermore, we demonstrate the impact of correlated fluctuations in the reduction of variability between two different kinases using scatter plots. At the high degree of cross-talk, scatter plots show high correlation coefficient compared to the lower level of cross talk. These results together imply that cross-talk not only develops synchronisation in a cell but also reduces variability due to the development of correlation between two different phosphorylated kinase levels in a population. Depending on the number of inputs and outputs, we have identified two types of signalling motifs from the composite network. Also, quantification of multivariate mutual information allows us to calculate the net synergy associated with these two different motifs. The signal integration motif (two inputs and one output) reveals high fidelity, whereas the signal bifurcation motif (one input and two outputs) shows redundancy in information propagation.
Based on the aforesaid theoretical discussion, we suggest a satisfactory explanation about the synchronisation in the outputs - a causal effect of cross-talk in parallel MAPK signalling pathways. Nevertheless, one question apparently arises - what is the importance of such synchronisation in cellular physiology? Such functional correlation is possibly required for both the outputs to perform in a combined way to regulate several essential downstream genes. Several experimental results on MAPK cross-talk in S. cerevisiae provide interesting evidence that corroborates with our theoretical analysis. Phosphorylated Fus3 and Kss1 are both responsible for the activation of transcription factor Ste12 that regulates different downstream genes [64]. Additionally, both activated Fus3 and Hog1 assist in arresting the cell cycle in G1 phase temporarily [5,8]. Cross-talk is also highly significant for the eukaryotic cells where the promoter of TATA binding proteins is solely controlled by MAPK signalling pathways [15,69], whereas these binding proteins are essential for the expression of most nuclear genes. Also, they act as a potential vehicle for developing coordination among the multiple disparate classes of genes. Thus, coordinated signalling of MAPK pathways paves the way for TATA binding proteins to establish the association among large-scale nuclear genes. Gene regulation in S. cerevisiae is known to be controlled by more than one transcription factors that bind cooperatively at many promoter sites. This phenomenon suggests that coordinated fluctuations between the outputs of MAPK signalling pathways are necessary to express the gene product in a controlled way. It is also noticed that coordinated fluctuations among gene products are developed through transcriptional as well as translational cross-talk [25,57,58,70]. We propose that it could be more convenient for a cell to establish a functional connection among all intracellular processes if the correlation is initiated in the signalling pathway, not solely in the gene regulation stage. In fact, one interesting signature which was observed in different experiments is that cross-talk is prominent at the low concentration level that is manifested in diverse environmental cues [22,24]. Thus, in these situations, fluctuations in the cellular components are very high, and it is improbable for cells to adopt a constructive decision for survival [71]. Our results indicate that such decision making program becomes easy when correlated fluctuations among the essential proteins are successfully implemented through the bet-hedging program [22].
Overall, we suggest that synchronisation between MAPK signalling pathways is a result of cross-talk. Our analytical calculation supplemented by exact numerical simulation is a general approach and can be applied to other cross-talk pathways to quantify the strength of cross-interactions. In future, we plan to address the influence and physiological relevance of cross-talk in other network motifs. Our theoretical observations in the present work could be verified upon the quantification of phosphorylated kinase protein in a single cell using flow cytometry and time lapse microscopy [72,73,74]. These experimental approaches can be implemented to measure the amount of intra-cellular phosphorylated kinases by treating cells with external stimuli, fixing and permeabilizing cells with appropriate chemicals, and then staining with phospho-specific antibodies for different kinases. After that, one can quantify the intensity of phosphorylated kinases in individual cells of a colony. Using these data, distribution profiles of the concentration of phosphorylated kinases could be developed. These quantifiable distribution profiles could be used to quantify the mutual information.
Acknowledgments
We thank Debi Banerjee, Ayan Biswas, Sandip Kar and Jayanta Mukhopadhyay for critical reading and for making constructive suggestions. Alok Kumar Maity acknowledges University Grants Commission for a research fellowship (UGC/776/JRF(Sc)). Suman K. Banik acknowledges financial support from Council of Scientific and Industrial Research, Government of India (01(2771)/14/EMR-II) and Bose Institute (Institutional Programme VI - Systems Biology), Kolkata.
Author Contributions
Alok Kumar Maity conceived and designed the experiments; Alok Kumar Maity performed the experiments; Alok Kumar Maity, Pinaki Chaudhury and Suman K. Banik analyzed the data; Pinaki Chaudhury and Suman K. Banik contributed reagents/materials/analysis tools; Alok Kumar Maity, Pinaki Chaudhury and Suman K. Banik wrote the paper.
Conflicts of Interest
The authors declare no conflict of interest.
Abbreviations
The following abbreviations are used in this manuscript:
| MAPK | Mitogen activated protein kinase |
| LNA | Linear noise approximation |
| PID | Partial information decomposition |
Appendix A. Calculation of variance and covariance
The MAPK network motif shown in Figure 5 is explicated through stochastic Langevin equations. Each pathway (X or Y) is activated by the initiation of an extra cellular signal ( or ). When the first cascade kinase is activated, it regulates the activation of downstream kinases of the same as well as the parallel pathway through cross-interaction. Once activated, the second kinase regulates the activation of the last kinase. The active and inactive states can be identified in terms of phosphorylated ( and ) and dephosphorylated ( and ) forms of each kinase (), respectively. To construct the theoretical model of the composite MAPK network motif, we have considered the total population (phosphorylated and dephosphorylated form) of all kinases to be a constant ( constant; ). Thus, for X pathway the stochastic differential equations for , and are [63]
The first and the second terms on the right hand side of Equation (A.1) denote phosphorylation and dephosphorylation rate of the corresponding kinase. Here, , and are activation and , and are deactivation rate constants of , and , respectively. is the cross-interaction parameter that controls signal propagation from Y to X pathway (). The -s () are Gaussian white noise terms with zero mean and finite noise strength. While writing Equation (A.1) we have used the conservation relation . Similarly, the stochastic Langevin equations associated with the components of the Y pathway can be written as [63]
In Equation (A.2), the first and the second terms stand for phosphorylation and dephosphorylation rate. Here, , and are activation and , and are deactivation rate constants of , and , respectively. The cross-interaction parameter is that controls signal transduction from X to Y pathway (). The noise terms -s () are considered to be Gaussian white noise with zero mean and finite noise strength. For Y pathway, constant constraint is also valid. The statistical properties of -s and -s () are
To solve the nonlinear Equations (A.1–A.2), we adopt LNA [30,31,32,33,34,36,37,38,39,40,75,76,77]. Linearizing Equations (A.1–A.2) around steady state , where is the average population of z at long time limit, one arrives at
Here
The generalised matrix form of Equation (A.3) is
where is the Jacobian matrix evaluated at steady state. The diagonal elements of matrix define the relaxation rate of each kinase and the off-diagonal elements represent the interaction rate between two different kinases [75,76,77]. Moreover, and are the fluctuations matrix and the noise matrix of the kinases, respectively. To calculate the different variances and covariances in the stationary state we make use of the Lyapunov matrix equation [33,36,37]
where is the covariance matrix and is the diffusion matrix that depends on different noise strengths. Here, represents ensemble average and T stands for transpose of a matrix. Solution of Equation (A.5) provides the expressions of variance and covariance of the kinases
Here,
In our calculation, we use the analytical expressions of variance and covariance for evaluating the value of mutual information and correlation coefficient.
References
- Tyson, J.J.; Chen, K.C.; Novak, B. Sniffers, buzzers, toggles and blinkers: dynamics of regulatory and signaling pathways in the cell. Curr. Opin. Cell Biol. 2003, 15, 221–231. [Google Scholar] [CrossRef]
- Alon, U. An Introduction to Systems Biology: Design Principles of Biological Circuits; CRC Press: Boca Raton, FL, USA, 2006. [Google Scholar]
- Lyons, S.M.; Prasad, A. Cross-Talk and Information Transfer in Mammalian and Bacterial Signaling. PLoS ONE 2012, 7. [Google Scholar] [CrossRef] [PubMed]
- Tareen, A.; Wingreen, N.S.; Mukhopadhyay, R. Modeling Evolution of Crosstalk in Noisy Signal Transduction Networks. arXiv, 2017; arXiv:physics.bio-ph/1707.01467. [Google Scholar]
- Bardwell, L. Mechanisms of MAPK signalling specificity. Biochem. Soc. Trans. 2006, 34, 837–841. [Google Scholar] [CrossRef] [PubMed]
- Ferrell, J.E. Tripping the switch fantastic: How a protein kinase cascade can convert graded inputs into switch-like outputs. Trends Biochem. Sci. 1996, 21, 460–466. [Google Scholar] [CrossRef]
- Huang, C.Y.F.; Ferrell, J.E. Ultrasensitivity in the mitogen-activated protein kinase cascade. Proc. Natl. Acad. Sci. USA 1996, 93, 10078–10083. [Google Scholar] [CrossRef] [PubMed]
- Saito, H. Regulation of cross-talk in yeast MAPK signaling pathways. Curr. Opin. Microbiol. 2010, 13, 677–683. [Google Scholar] [CrossRef] [PubMed]
- Voliotis, M.; Perrett, R.M.; McWilliams, C.; McArdle, C.A.; Bowsher, C.G. Information transfer by leaky, heterogeneous, protein kinase signaling systems. Proc. Natl. Acad. Sci. USA 2014, 111, E326–E333. [Google Scholar] [CrossRef] [PubMed]
- Laub, M.T.; Goulian, M. Specificity in two-component signal transduction pathways. Annu. Rev. Genet. 2007, 41, 121–145. [Google Scholar] [CrossRef] [PubMed]
- Posas, F.; WurglerMurphy, S.M.; Maeda, T.; Witten, E.A.; Thai, T.C.; Saito, H. Yeast HOG1 MAP kinase cascade is regulated by a multistep phosphorelay mechanism in the SLN1-YPD1-SSK1 ”two-component” osmosensor. Cell 1996, 86, 865–875. [Google Scholar] [CrossRef]
- Rowland, M.A.; Deeds, E.J. Crosstalk and the evolution of specificity in two-component signaling. Proc. Natl. Acad. Sci. USA 2014, 111. [Google Scholar] [CrossRef] [PubMed]
- Siryaporn, A.; Perchuk, B.S.; Laub, M.T.; Goulian, M. Evolving a robust signal transduction pathway from weak cross-talk. Mol. Syst. Biol. 2010, 6. [Google Scholar] [CrossRef] [PubMed]
- Trach, K.A.; Hoch, J.A. Multisensory Activation of the Phosphorelay Initiating Sporulation in Bacillus Subtilis—Identification and Sequence of the Protein-Kinase of the Alternate Pathway. Mol. Microbiol. 1993, 8, 69–79. [Google Scholar] [CrossRef] [PubMed]
- Gustin, M.C.; Albertyn, J.; Alexander, M.; Davenport, K. MAP kinase pathways in the yeast Saccharomyces cerevisiae. Microbiol. Mol. Biol. Rev. 1998, 62, 1264–1300. [Google Scholar] [PubMed]
- Kunkel, B.N.; Brooks, D.M. Cross talk between signaling pathways in pathogen defense. Curr. Opin. Plant Biol. 2002, 5, 325–331. [Google Scholar] [CrossRef]
- Oeckinghaus, A.; Hayden, M.S.; Ghosh, S. Crosstalk in NF-κB signaling pathways. Nat. Immunol. 2011, 12, 695–708. [Google Scholar] [CrossRef] [PubMed]
- Iborra, F.J.; Escargueil, A.E.; Kwek, K.Y.; Akoulitchev, A.; Cook, P.R. Molecular cross-talk between the transcription, translation, and nonsense-mediated decay machineries. J. Cell Sci. 2004, 117, 899–906. [Google Scholar] [CrossRef] [PubMed]
- Mather, W.H.; Hasty, J.; Tsimring, L.S.; Williams, R.J. Translational Cross Talk in Gene Networks. Biophys. J. 2013, 104, 2564–2572. [Google Scholar] [CrossRef] [PubMed]
- Mauri, M.; Klumpp, S. A Model for Sigma Factor Competition in Bacterial Cells. PLoS Comput. Biol. 2014, 10. [Google Scholar] [CrossRef] [PubMed]
- Riba, A.; Bosia, C.; El Baroudi, M.; Ollino, L.; Caselle, M. A Combination of Transcriptional and MicroRNA Regulation Improves the Stability of the Relative Concentrations of Target Genes. PLoS Comput. Biol. 2014, 10. [Google Scholar] [CrossRef] [PubMed]
- Tsimring, L.S. Noise in biology. Rep. Prog. Phys. 2014, 77. [Google Scholar] [CrossRef] [PubMed]
- Palus, M.; Komarek, V.; Hrncir, Z.; Sterbova, K. Synchronization as adjustment of information rates: Detection from bivariate time series. Phys. Rev. E 2001, 63. [Google Scholar] [CrossRef] [PubMed]
- Cookson, N.A.; Mather, W.H.; Danino, T.; Mondragon-Palomino, O.; Williams, R.J.; Tsimring, L.S.; Hasty, J. Queueing up for enzymatic processing: correlated signaling through coupled degradation. Mol. Syst. Biol. 2011, 7. [Google Scholar] [CrossRef] [PubMed]
- Komili, S.; Silver, P.A. Coupling and coordination in gene expression processes: a systems biology view. Nat. Rev. Genet. 2008, 9, 38–48. [Google Scholar] [CrossRef] [PubMed]
- Bardwell, L.; Zou, X.F.; Nie, Q.; Komarova, N.L. Mathematical models of specifcity in cell signaling. Biophys. J. 2007, 92, 3425–3441. [Google Scholar] [CrossRef] [PubMed]
- Komarova, N.L.; Zou, X.F.; Nie, Q.; Bardwell, L. A theoretical framework for specificity in cell signaling. Mol. Syst. Biol. 2005, 1. [Google Scholar] [CrossRef] [PubMed]
- McClean, M.N.; Mody, A.; Broach, J.R.; Ramanathan, S. Cross-talk and decision making in MAP kinase pathways. Nat. Genet. 2007, 39, 567. [Google Scholar] [CrossRef]
- Ubersax, J.A.; Ferrell, J.E. Mechanisms of specificity in protein phosphorylation. Nat. Rev. Mol. Cell Biol. 2007, 8, 530–541. [Google Scholar] [CrossRef] [PubMed]
- Van Kampen, N.G. Stochastic Processes in Physics and Chemistry; North-Holland: Amsterdam, The Netherlands, 2011. [Google Scholar]
- Gardiner, C.W. Stochastic Methods, 4th ed.; Springer: Berlin, Germany, 2009. [Google Scholar]
- Grima, R. Linear-noise approximation and the chemical master equation agree up to second-order moments for a class of chemical systems. Phys. Rev. E 2015, 92. [Google Scholar] [CrossRef] [PubMed]
- Elf, J.; Ehrenberg, M. Fast evaluation of fluctuations in biochemical networks with the linear noise approximation. Genome Res. 2003, 13, 2475–2484. [Google Scholar] [CrossRef] [PubMed]
- Maity, A.K.; Bandyopadhyay, A.; Chaudhury, P.; Banik, S.K. Role of functionality in two-component signal transduction: a stochastic study. Phys. Rev. E 2014, 89. [Google Scholar] [CrossRef] [PubMed]
- Maity, A.K.; Chaudhury, P.; Banik, S.K. Role of relaxation time scale in noisy signal transduction. PLoS ONE 2015, 10. [Google Scholar] [CrossRef] [PubMed]
- Paulsson, J. Summing up the noise in gene networks. Nature 2004, 427, 415–418. [Google Scholar] [CrossRef] [PubMed]
- Paulsson, J. Models of stochastic gene expression. Phys. Life Rev. 2005, 2, 157–175. [Google Scholar] [CrossRef]
- Grima, R.; Thomas, P.; Straube, A.V. How accurate are the nonlinear chemical Fokker-Planck and chemical Langevin equations? J. Chem. Phys. 2011, 135. [Google Scholar] [CrossRef] [PubMed]
- Thomas, P.; Matuschek, H.; Grima, R. How reliable is the linear noise approximation of gene regulatory networks? BMC Genom. 2013, 14 (Suppl. S4). [Google Scholar] [CrossRef] [PubMed]
- Thomas, P.; Straube, A.V.; Timmer, J.; Fleck, C.; Grima, R. Signatures of nonlinearity in single cell noise-induced oscillations. J. Theor. Biol. 2013, 335, 222–234. [Google Scholar] [CrossRef] [PubMed]
- Cover, T.M.; Thomas, J.A. Elements of Information Theory; Wiley Interscience: Hoboken, NJ, USA, 2012. [Google Scholar]
- Shannon, C.E. A Mathematical Theory of Communication. Bell Syst. Tech. J. 1948, 27, 623–656. [Google Scholar] [CrossRef]
- Gillespie, D.T. A general method for numerically simulating the stochastic time evolution of coupled chemical reactions. J. Comput. Phys. 1976, 22, 403–434. [Google Scholar] [CrossRef]
- Granger, C.W.J. Investigating Causal Relations by Econometric Models and Cross-Spectral Methods. Econometrica 1969, 37. [Google Scholar] [CrossRef]
- Schreiber, T. Measuring Information Transfer. Phys. Rev. Lett. 2000, 85, 461–464. [Google Scholar] [CrossRef] [PubMed]
- Faes, L.; Kugiumtzis, D.; Nollo, G.; Jurysta, F.; Marinazzo, D. Estimating the decomposition of predictive information in multivariate systems. Phys. Rev. E 2015, 91. [Google Scholar] [CrossRef] [PubMed]
- Faes, L.; Porta, A.; Nollo, G. Information Decomposition in Bivariate Systems: Theory and Application to Cardiorespiratory Dynamics. Entropy 2015, 17, 277–303. [Google Scholar] [CrossRef]
- Spinney, R.E.; Lizier, J.T.; Prokopenko, M. Transfer entropy in physical systems and the arrow of time. Phys. Rev. E 2016, 94. [Google Scholar] [CrossRef] [PubMed]
- Wibral, M.; Priesemann, V.; Kay, J.W.; Lizier, J.T.; Phillips, W.A. Partial information decomposition as a unified approach to the specification of neural goal functions. Brain Cognit. 2017, 112, 25–38. [Google Scholar] [CrossRef] [PubMed]
- Schneidman, E.; Bialek, W.; Berry, M.J. Synergy, redundancy, and independence in population codes. J. Neurosci. 2003, 23, 11539–11553. [Google Scholar] [PubMed]
- Williams, P.L.; Beer, R.D. Nonnegative decomposition of Multivariate Information. arXiv, 2010; arXiv:cs.IT/1004.2515. [Google Scholar]
- Harder, M.; Salge, C.; Polani, D. Bivariate measure of redundant information. Phys. Rev. E 2013, 87. [Google Scholar] [CrossRef] [PubMed] [Green Version]
- Bertschinger, N.; Rauh, J.; Olbrich, E.; Jost, J.; Ay, N. Quantifying Unique Information. Entropy 2014, 16, 2161–2183. [Google Scholar] [CrossRef]
- Griffith, V.; Koch, C. Quantifying synergistic mutual information. In Guided Self-Organization: Inception, Emergence, Complexity and Computation; Prokopenko, M., Ed.; Springer: Berlin, Germany, 2014; Volume 9, pp. 159–190. [Google Scholar]
- Barrett, A.B. Exploration of synergistic and redundant information sharing in static and dynamical Gaussian systems. Phys. Rev. E 2015, 91. [Google Scholar] [CrossRef] [PubMed]
- Faes, L.; Porta, A.; Nollo, G.; Javorka, M. Information Decomposition in Multivariate Systems: Definitions, Implementation and Application to Cardiovascular Networks. Entropy 2017, 19, 5. [Google Scholar] [CrossRef]
- Dunlop, M.J.; Cox, R.S.; Levine, J.H.; Murray, R.M.; Elowitz, M.B. Regulatory activity revealed by dynamic correlations in gene expression noise. Nat. Genet. 2008, 40, 1493–1498. [Google Scholar] [CrossRef] [PubMed]
- Munsky, B.; Neuert, G.; van Oudenaarden, A. Using Gene Expression Noise to Understand Gene Regulation. Science 2012, 336, 183–187. [Google Scholar] [CrossRef] [PubMed]
- Elowitz, M.B.; Levine, A.J.; Siggia, E.D.; Swain, P.S. Stochastic gene expression in a single cell. Science 2002, 297, 1183–1186. [Google Scholar] [CrossRef] [PubMed]
- Waters, C.M.; Bassler, B.L. Quorum sensing: Cell-to-cell communication in bacteria. Ann. Rev. Cell Dev. Biol. 2005, 21, 319–346. [Google Scholar] [CrossRef] [PubMed]
- Mehta, P.; Goyal, S.; Long, T.; Bassler, B.L.; Wingreen, N.S. Information processing and signal integration in bacterial quorum sensing. Mol. Syst. Biol. 2009, 5. [Google Scholar] [CrossRef] [PubMed]
- Armitage, J.P. Bacterial tactic responses. Adv. Microb. Physiol. 1999, 41, 229–289. [Google Scholar] [PubMed]
- Heinrich, R.; Neel, B.G.; Rapoport, T.A. Mathematical models of protein kinase signal transduction. Mol. Cell 2002, 9, 957–970. [Google Scholar] [CrossRef]
- Suderman, R.; Deeds, E.J. Machines vs. Ensembles: Effective MAPK Signaling through Heterogeneous Sets of Protein Complexes. PLoS Comput. Biol. 2013, 9. [Google Scholar] [CrossRef] [PubMed]
- Tănase-Nicola, S.; Warren, P.B.; ten Wolde, P.R. Signal detection, modularity, and the correlation between extrinsic and intrinsic noise in biochemical networks. Phys. Rev. Lett. 2006, 97. [Google Scholar] [CrossRef] [PubMed]
- Bardwell, L.; Cook, J.G.; Chang, E.C.; Cairns, B.R.; Thorner, J. Signaling in the yeast pheromone response pathway: specific and high-affinity interaction of the mitogen-activated protein (MAP) kinases Kss1 and Fus3 with the upstream MAP kinase kinase Ste7. Mol. Cell Biol. 1996, 16, 3637–3650. [Google Scholar] [CrossRef] [PubMed]
- Atay, O.; Skotheim, J.M. Spatial and temporal signal processing and decision making by MAPK pathways. J. Cell Biol. 2017, 216, 317–330. [Google Scholar] [CrossRef] [PubMed]
- Whitlock, M.C.; Schluter, D. The Analysis of Biological Data; Roberts and Company Publishers: Greenwood Village, CO, USA, 2009. [Google Scholar]
- White, R.J.; Sharrocks, A.D. Coordinated control of the gene expression machinery. Trends Genet. 2010, 26, 214–220. [Google Scholar] [CrossRef] [PubMed]
- Stewart-Ornstein, J.; Weissman, J.S.; El-Samad, H. Cellular Noise Regulons Underlie Fluctuations in Saccharomyces cerevisiae. Mol. Cell 2012, 45, 483–493. [Google Scholar] [CrossRef] [PubMed]
- Junttila, M.R.; Li, S.P.; Westermarck, J. Phosphatase-mediated crosstalk between MAPK signalling pathways in the regulation of cell survival. FASEB J. 2008, 22, 954–965. [Google Scholar] [CrossRef] [PubMed]
- Gao, R.; Stock, A.M. Probing kinase and phosphatase activities of two-component systems in vivo with concentration-dependent phosphorylation profiling. Proc. Natl. Acad. Sci. USA 2013, 110, 672–677. [Google Scholar] [CrossRef] [PubMed]
- Schulz, K.R.; Danna, E.A.; Krutzik, P.O.; Nolan, G.P. Single-cell phospho-protein analysis by flow cytometry. Curr. Protoc. Immunol. 2012, Chapter 8, 1–20. [Google Scholar] [CrossRef]
- Yaginuma, H.; Kawai, S.; Tabata, K.V.; Tomiyama, K.; Kakizuka, A.; Komatsuzaki, T.; Noji, H.; Imamura, H. Diversity in ATP concentrations in a single bacterial cell population revealed by quantitative single-cell imaging. Sci. Rep. 2014, 4. [Google Scholar] [CrossRef] [PubMed] [Green Version]
- De Ronde, W.H.; Tostevin, F.; ten Wolde, P.R. Feed-forward loops and diamond motifs lead to tunable transmission of information in the frequency domain. Phys. Rev. E 2012, 86. [Google Scholar] [CrossRef] [PubMed]
- Mehta, P.; Goyal, S.; Wingreen, N.S. A quantitative comparison of sRNA-based and protein-based gene regulation. Mol. Syst. Biol. 2008, 4. [Google Scholar] [CrossRef] [PubMed]
- Thattai, M.; van Oudenaarden, A. Stochastic gene expression in fluctuating environments. Genetics 2004, 167, 523–530. [Google Scholar] [CrossRef] [PubMed]
Figure 1.
(color online) Two variable mutual information and net information transduction as a function of cross-talk parameter. (A–F) Two variable mutual information profiles , , , , and as a function of cross-interaction parameter for a fixed value of . In all figures, red (with open circle) and green (with open diamond) lines are generated using faster (Table 1) and slower (Table 2) relaxation rate parameters, respectively. The symbols are generated using stochastic simulation algorithm [43] and the lines are due to theoretical calculation; (G,H) Bar diagram of two variable mutual information of three parallel cascade kinases under an equivalent cross-talk condition () for faster (Table 1) and slower (Table 2) relaxation rate parameters, respectively; (I) Net information transduction D as a function of cross-interaction parameter for a fixed value of . The red (with open circle) and the green (with open diamond) lines are due to faster (Table 1) and slower (Table 2) relaxation rate parameters, respectively. The figure indicates data collapse for two relaxation rate parameters. The symbols are generated using stochastic simulation algorithm [43] and the lines are obtained from theoretical calculation. All the simulation data (open circles and open diamonds) are ensemble average of independent trajectories; (J) 2d-surface plot of net information transduction D as a function of two cross-talk parameters and for faster (Table 1) relaxation rate parameters.

Figure 2.
(color online) 2d-surface plots of two variable mutual information, stochastic time trajectories and scatter plots. (A,B) 2d-surface plot of two variable mutual information and as a function of two cross-talk parameters and for faster relaxation rate parameters (Table 1). In both figures, I, II, III and IV correspond to four different values of and ; (C) Stochastic time trajectories and steady state population of two parallel kinases for four different sets of and . For CI, CII, CIII and CIV we have used and , and and , respectively. In each scatter plot, represents analytical value of Pearson’s correlation coefficient. The stochastic trajectories and the scatter plots are generated using stochastic simulation algorithm [43] and the surface plots are due to theoretical calculation.

Figure 3.
(color online) 2d-surface plots of two variable mutual information, stochastic time trajectories and scatter plots. (A,B) 2d-surface plot of two variable mutual information and as a function of two cross-talk parameters and for slower relaxation rate parameters (Table 2). In both figures, I, II, III and IV correspond to four different values of and ; (C) Stochastic time trajectories and steady state population of two parallel kinases for four different sets of and . For CI, CII, CIII and CIV we have used and , and and , respectively. In each scatter plot, represents analytical value of Pearson’s correlation coefficient. The stochastic trajectories and the scatter plots are generated using stochastic simulation algorithm [43] and the surface plots are due to theoretical calculation.

Figure 4.
(color online) Three variable mutual information as a function of cross-talk parameter. (A,B) Three variable mutual information (A) and net synergy ((B) for signal integration motif. Schematic diagram of signal integration motif in composite MAPK network (see inset in (A). (C,D) - Three variable mutual information (C) and net synergy (D) for signal bifurcation motif. Schematic diagram of signal bifurcation motif in composite MAPK network (see inset in (C). All the figures are drawn as a function of cross-interaction parameter for a fixed value of . Here red (with open circle) and green (with open diamond) lines are drawn for faster (Table 1) and slower (Table 2) relaxation rate parameters, respectively. The symbols are generated using stochastic simulation algorithm [43] and the lines are obtained from theoretical calculation. All the simulation data (open circles and open diamonds) are ensemble average of independent trajectories.

Figure 5.
(color online) Schematic diagram of two parallel MAPK (equivalent and identical) signalling pathways (X and Y). Each pathway consists of three successively connected cascade kinases, MAPKKK (red), MAPKK (green) and MAPK (blue). The first activated kinase facilitates the activation of the second one and then the second kinase regulates the activation of the last one. Both signalling pathways are exposed to two different signals ( and ). Cross-talk is developed due to inter-pathway interactions. and are the cross-interaction parameters and the directionality of these interactions are and , respectively.


Table 1.
Reactions and corresponding parameter values for the MAPK network motif of S. cerevisiae [6,9,66], related to faster relaxation rate. Other Parameters are molecules/cell, molecules/cell, molecules/cell, molecules/cell, molecules/cell, molecules/cell and molecules/cell. The kinetic schemes adopted in the present work follows the model of Heinrich et al. [63].
| Description | Reaction | Propensity Function | Rate Constant | |
|---|---|---|---|---|
| Activation of | molecules s | |||
| Deactivation of | s | |||
| Activation of | molecules s | |||
| Deactivation of | s | |||
| Activation of | molecules s | |||
| Activation of | molecules s | |||
| Deactivation of | s | |||
| Activation of | molecules s | |||
| Activation of | molecules s | |||
| Deactivation of | s | |||
| Activation of | molecules s | |||
| Deactivation of | s | |||
| Activation of | molecules s | |||
| Deactivation of | s |
Table 2.
Reactions and corresponding parameter values for the MAPK network motif of S. cerevisiae [6,9,66], related to slower relaxation rate. Other Parameters are molecules/cell, molecules/cell, molecules/cell, molecules/cell, molecules/cell, molecules/cell and molecules/cell. The kinetic schemes adopted in the present work follows the model of Heinrich et al. [63].
| Description | Reaction | Propensity Function | Rate Constant | |
|---|---|---|---|---|
| Activation of | molecules s | |||
| Deactivation of | s | |||
| Activation of | molecules s | |||
| Deactivation of | s | |||
| Activation of | molecules s | |||
| Activation of | molecules s | |||
| Deactivation of | s | |||
| Activation of | molecules s | |||
| Activation of | molecules s | |||
| Deactivation of | s | |||
| Activation of | molecules s | |||
| Deactivation of | s | |||
| Activation of | molecules s | |||
| Deactivation of | s |
© 2017 by the authors. Licensee MDPI, Basel, Switzerland. This article is an open access article distributed under the terms and conditions of the Creative Commons Attribution (CC BY) license (http://creativecommons.org/licenses/by/4.0/).
Share and Cite
MDPI and ACS Style
Maity, A.K.; Chaudhury, P.; Banik, S.K. Information Theoretical Study of Cross-Talk Mediated Signal Transduction in MAPK Pathways. Entropy 2017, 19, 469. https://0-doi-org.brum.beds.ac.uk/10.3390/e19090469
AMA Style
Maity AK, Chaudhury P, Banik SK. Information Theoretical Study of Cross-Talk Mediated Signal Transduction in MAPK Pathways. Entropy. 2017; 19(9):469. https://0-doi-org.brum.beds.ac.uk/10.3390/e19090469
Chicago/Turabian StyleMaity, Alok Kumar, Pinaki Chaudhury, and Suman K. Banik. 2017. "Information Theoretical Study of Cross-Talk Mediated Signal Transduction in MAPK Pathways" Entropy 19, no. 9: 469. https://0-doi-org.brum.beds.ac.uk/10.3390/e19090469
Note that from the first issue of 2016, this journal uses article numbers instead of page numbers. See further details here.