Identifying Systemically Important Companies by Using the Credit Network of an Entire Nation


1
International Institute for Applied Systems Analysis, Schlossplatz 1, 2361 Laxenburg, Austria
2
Complexity Science Hub Vienna, Josefstädter Straße 39, 1080 Vienna, Austria
3
Section for Science of Complex Systems, Medical University of Vienna, Spitalgasse 23, 1090 Vienna, Austria
4
Santa Fe Institute, 1399 Hyde Park Road, Santa Fe, NM 87501, USA
*
Author to whom correspondence should be addressed.
Entropy 2018, 20(10), 792; https://0-doi-org.brum.beds.ac.uk/10.3390/e20100792
Submission received: 27 July 2018
/
Revised: 8 October 2018
/
Accepted: 8 October 2018
/
Published: 16 October 2018
(This article belongs to the Special Issue Economic Fitness and Complexity)
Abstract
:The notions of systemic importance and systemic risk of financial institutions are closely related to the topology of financial liability networks. In this work, we reconstruct and analyze the financial liability network of an entire economy using data of 50,159 firms and banks. Our analysis contains 80.2% of the total liabilities of firms towards banks and all interbank liabilities in the Austrian banking system. The combination of firm-bank networks and interbank networks allows us to extend the concept of systemic risk to the real economy. In particular, the systemic importance of individual companies can be assessed, and for the first time, the financial ties between the financial and the real economy become explicitly visible. We find that firms contribute to systemic risk in similar ways as banks do. We identify a set of mid-sized companies that carry substantial systemic risk. Their default would affect up to 40% of the Austrian financial market. We find that all firms together create more systemic risk than the entire financial sector. In 2008, the total systemic risk of the Austrian interbank network amounted to only 29% of the total systemic risk of the entire financial network consisting of firms and banks. The work demonstrates that the notions of systemically important financial institutions (SIFIs) can be directly extended to firms.
1. Introduction
The financial crisis of 2007–2008 was triggered by the default of a single investment bank. The consequences of this default propagated through the financial system, bringing it to the brink of collapse. Because of close links between the financial and the real economy, the financial crisis spread quickly and was followed by a global economic downturn, the so-called Great Recession. The mechanisms of how a financial crisis may lead to an economic recession, and vice versa, are not understood on a fundamental level. To clarify and map the financial ties between the financial and the real economy, which are at the core of such potential spreading mechanisms, are more important than ever.
In response to the financial crisis, the Basel III framework recognizes systemically important financial institutions (SIFIs) and, in particular, global and domestic systemically important banks (G-SIBs or D-SIBs). For those, Basel III recommends increased capital requirements, so-called SIFI surcharges [1]. In this context, several network-based measures that identify systemically important financial institutions have been proposed and were recently applied [2,3,4,5,6,7,8]. These measures introduce the notion of the systemic importance of a financial institution within a financial network and are based on network centrality, or closely related measures. Network-based approaches typically work well for small financial networks (e.g., banking networks) with a relatively small number of financial institutions (nodes), usually less than a thousand. A serious disadvantage of many centrality measures is, however, that the values associated with particular institutions have no clear interpretation as a measure of expected losses. A solution that solves this problem is the so-called “DebtRank”, a recursive method suggested by Battiston et al. [2], that quantifies the systemic importance of financial institutions in terms of losses that the institution would contribute to the total loss in the system in the event of a default. Since data on financial networks are hard to obtain outside central banks, there have been several attempts to quantify the systemic importance of institutions without explicit knowledge of the underlying networks [9,10,11,12].
The vast majority of systemic risk analyses have focused on financial systems, with little emphasis placed on the real economy [13]. Driven by recent data availability, research on financial networks has focused on default contagion, mostly on direct lending networks between financial institutions [14,15,16,17,18,19,20,21,22] and, to a lesser degree, on derivative exposures [3,23]. Research on financial multi-layer networks that considers contagion channels in multiple financial asset markets (not only credit) emerged only recently. Poledna et al. [24] and León et al. [25] studied the interactions between financial institutions on different financial markets in Mexico and Colombia, respectively. Only a few works have studied the detailed relations between the financial and the real economy empirically. These focused on Japan and were mainly concerned with the topology of credit networks between banks and large firms [26,27,28,29]. De Masi et al. [30] and Miranda and Tabak [31] studied credit networks in Italy and Brazil, and Lux [32] developed a theoretical model of a bipartite credit network between banks and the non-bank corporate sector. De Masi et al. [30] and De Masi and Gallegati [27] used network analysis to study the credit networks in Italy and Japan, while Fujiwara et al. [26] and Marotta et al. [29] investigated the evolution of the network structure in Japan. Marotta et al. [29] used community detection to identify communities of both banks and firms. Miranda and Tabak [31] and Aoyama [28] made a first attempt to analyze empirically systemic risk in credit networks in Japan and Brazil. Aoyama [28] used DebtRank to study risk propagation from banks to firms with a dataset, provided by Nikkei Inc. that contains approximately 2000 firms and 200 banks in Japan; however, it does not include interbank data. Miranda and Tabak [31] presented the first study that included interbank and firm loans. The used dataset was relatively small, as it contained only about 50 banks and 351 firms in Brazil.
In this work, we analyze a large financial credit network that not only includes all interbank liabilities, but also nearly all liabilities between banks and firms. We reconstruct the network by combing datasets that contain annual financial statements of nearly all firms and banks in Austria (approximately 170,000 firms and close to 1000 banks) with anonymized interbank liabilities from the Austrian banking system. This combined financial network of firms and banks allows us to identify systemically important firms by extending DebtRank to the combined financial networks. We estimate the share of systemic risk introduced by firms and compare the systemic risk levels of the interbank network with those of the combined financial network. It becomes obvious that the notion of SIFIs and G-SIBs, or D-SIBs, can be directly extended to firms.
The paper is structured as follows. Section 2 provides an overview of the datasets used in this study. In Section 3, we explain the methodology to reconstruct the entire financial network from data. In Section 4 and Section 5, we present the results by first presenting classical network statistics of the entire financial network, followed by an analysis of systemic importance of firms and banks. Finally, Section 6 discusses the results and provides conclusions.
2. Data
We use two data sources for the analysis: annual financial statements of nearly all firms and banks in Austria and anonymized interbank liabilities from the Austrian banking system. Financial statements of firms were obtained from the SABINAdatabase (The SABINA database is provided by Bureau van Dijk; see https://0-www-bvdinfo-com.brum.beds.ac.uk/en-us/our-products/company-information/national-products/sabina), which provides information on about 170,000 firms in Austria. This database contains detailed company financials for up to 10 years, as well as data on shareholders and subsidiaries, activity codes and trade descriptions and stock data for listed companies. The database includes bank-firm relations and allows us to identify which firm is a customer of which bank.
The financial statements of banks are made publicly available by the Austrian Central Bank (OeNB) (https://www.oenb.at/jahresabschlusski/jahresabschlusski). Interbank data provided by the OeNB contain fully-anonymized and linearly-transformed interbank liabilities from the entire Austrian banking system over 12 consecutive quarters from 2006–2008. The dataset additionally includes total assets, total liabilities, assets due from banks, liabilities due to banks and liquid assets (without interbank assets/liabilities) for all banks, again in anonymized form.
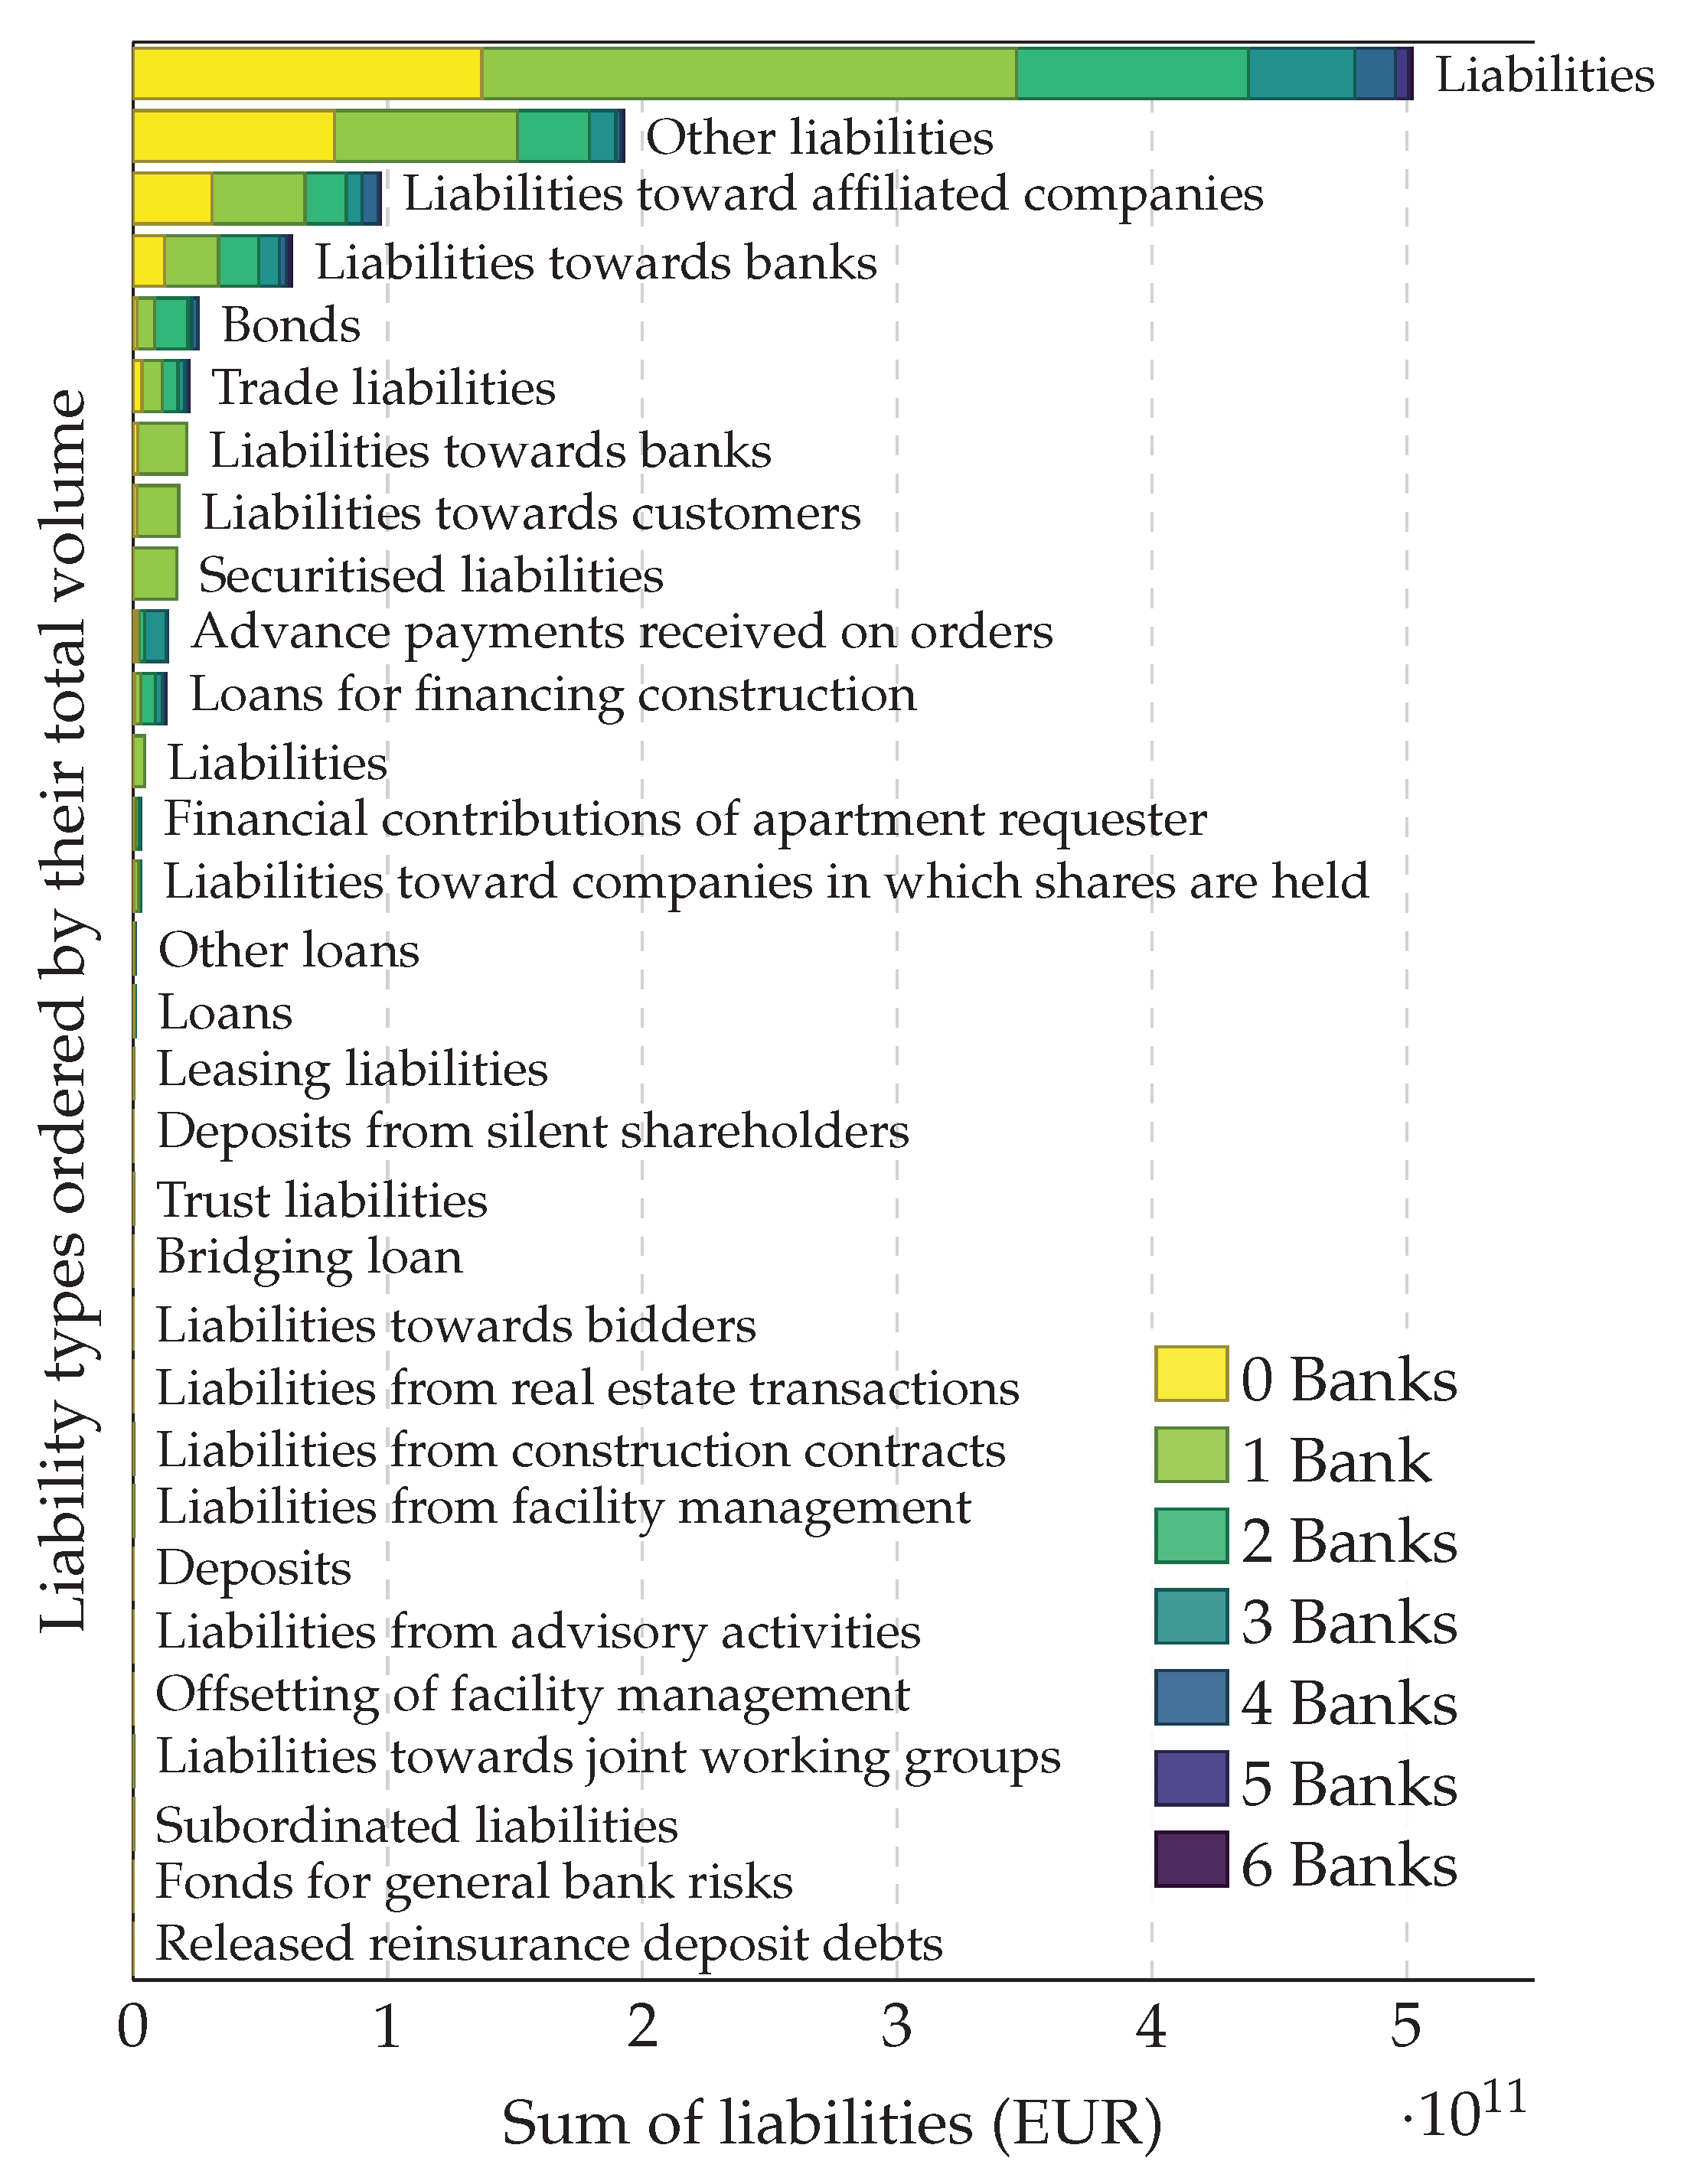
A total of 106,919 firms and 796 banks filed a financial statement in the 2008 calendar year. Figure 1 shows the aggregated debt structure of firms in Austria in 2008. The top bar shows the total liabilities with respect to the number of lending banks associated with each firm. The other stack bars show the structure of different components of liabilities in the balance sheets.
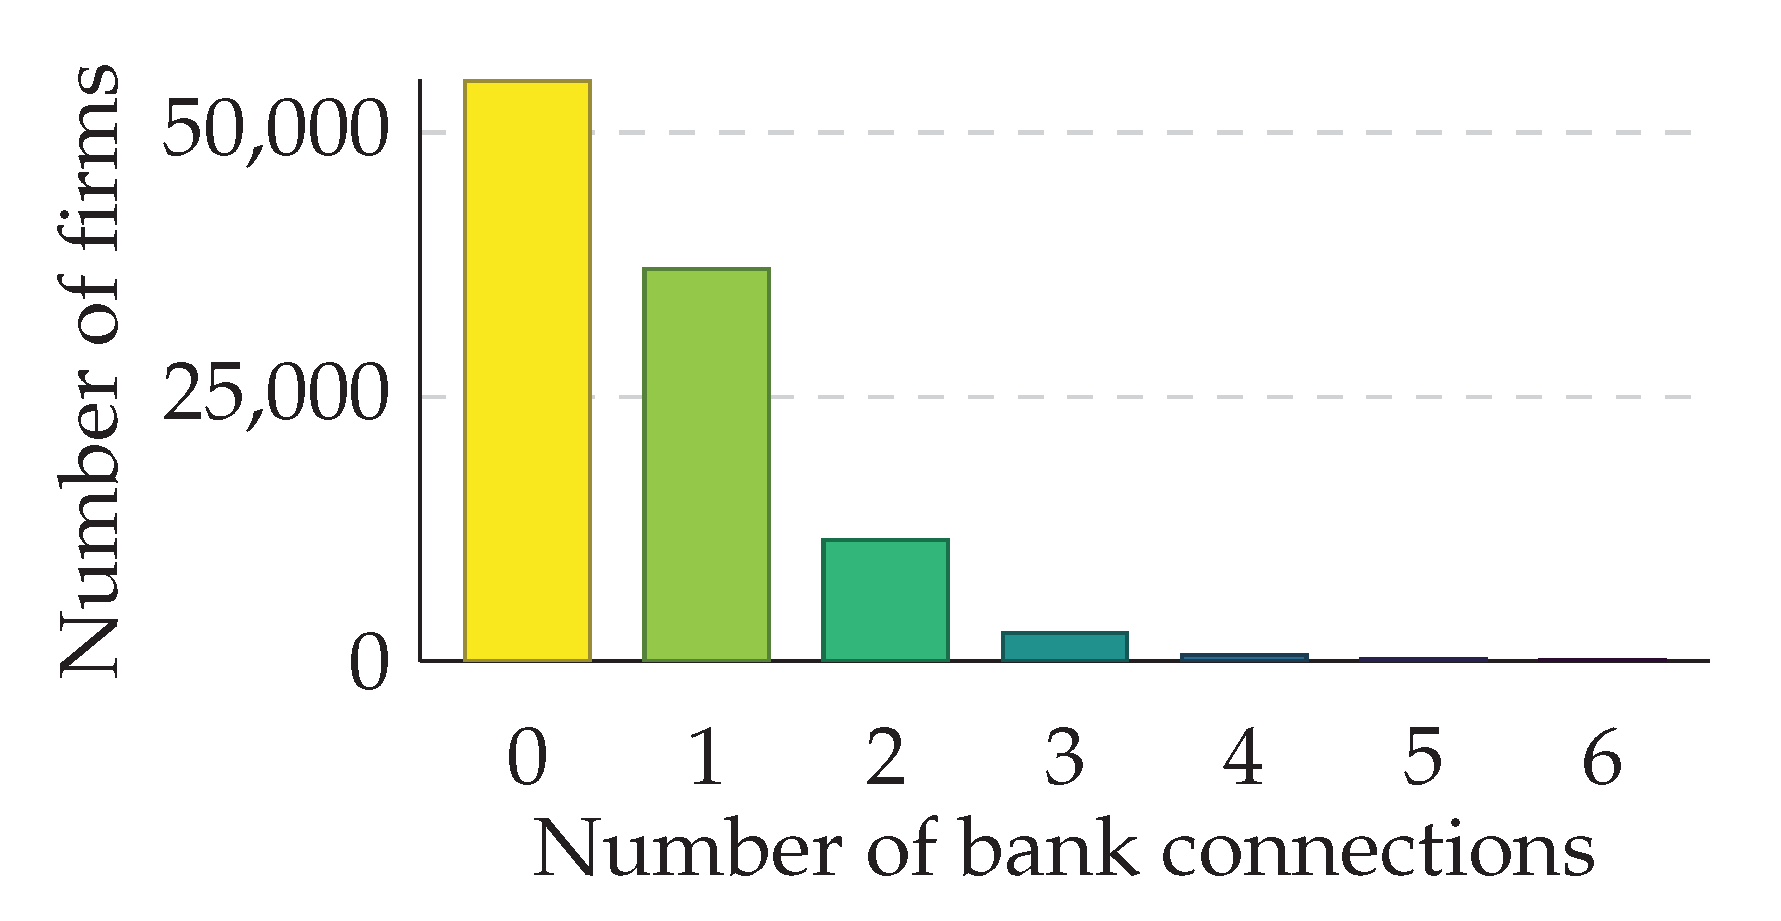
In Figure 2, the number of banks associated with each firm is shown. Approximately 48.6% of the firms representing about 80.2% of total liabilities towards banks can be associated with one or more banks. Firms that cannot be associated with a bank are excluded from the analysis. For small firms that do not provide an exact breakdown of liabilities, we estimate liabilities towards banks by the average ratio of liabilities towards banks of firms in the same line of business, as indicated by their OeNACE code [33]. We reconstruct the liability network of 796 banks and 49,363 firms that contains 80.2% of the total liabilities of firms towards banks and all interbank liabilities.
3. Reconstruction of the Liability Network
We combined the two datasets to extract the bipartite network that represents the liabilities and assets of the Austrian economy. This network consists of two disjunct sets of nodes: banks B and firms C, for which the trivial equations hold, , and . Links either connect banks with other banks (interbank liabilities), banks with firms (deposits of firms at banks) or firms with banks (liabilities of firms) as illustrated in Figure 3. The weighted adjacency matrix:
is called the liability matrix, where each entry indicates the liability that node i (which is a bank if and a firm if ) has towards node j. The matrix is partitioned into four parts:
- Interbank network , connecting banks with banks.
- Bank-firm network , containing information about deposits firms have at financial institutions.
- Firm-bank network , containing information about liabilities firms have towards financial institutions (bank loans).
- Firm-firm network with inter-firm liabilities, which are omitted in this work; thus, for all .
The interbank network is obtained from the interbank dataset. In a first step, data on bank-firm relations are used to establish an unweighted bipartite network between firms and banks. This bipartite network is used as a basis for the and adjacency matrices, which are (after assigning weights; see below) combined with to obtain the liability network L. To match the interbank network with the bipartite bank-firm networks and , the banks of both datasets were ranked according to total assets. The resulting tables were then joined with their rank as a common column. In a second step, the weights of the bipartite liability network of firms and banks are assigned as follows:
- For every firm c, take the aggregated liabilities the firm has toward banks from the balance sheet.
- Then, take the set of aggregated loans (referred to as assets, or , where i is the index of a bank/firm) of all banks from their balance sheets, and assign them to the entries of the vector ℓ in the following way:
- Normalize the resulting vector,
- Partition the aggregated liabilities with the distribution to obtain the entries for the firm-bank network, , where we use vector notation and : means column.
Note that we partition the liabilities of each firm to their banks according to the relative size of the lending banks.
4. The Liability Network of Austria
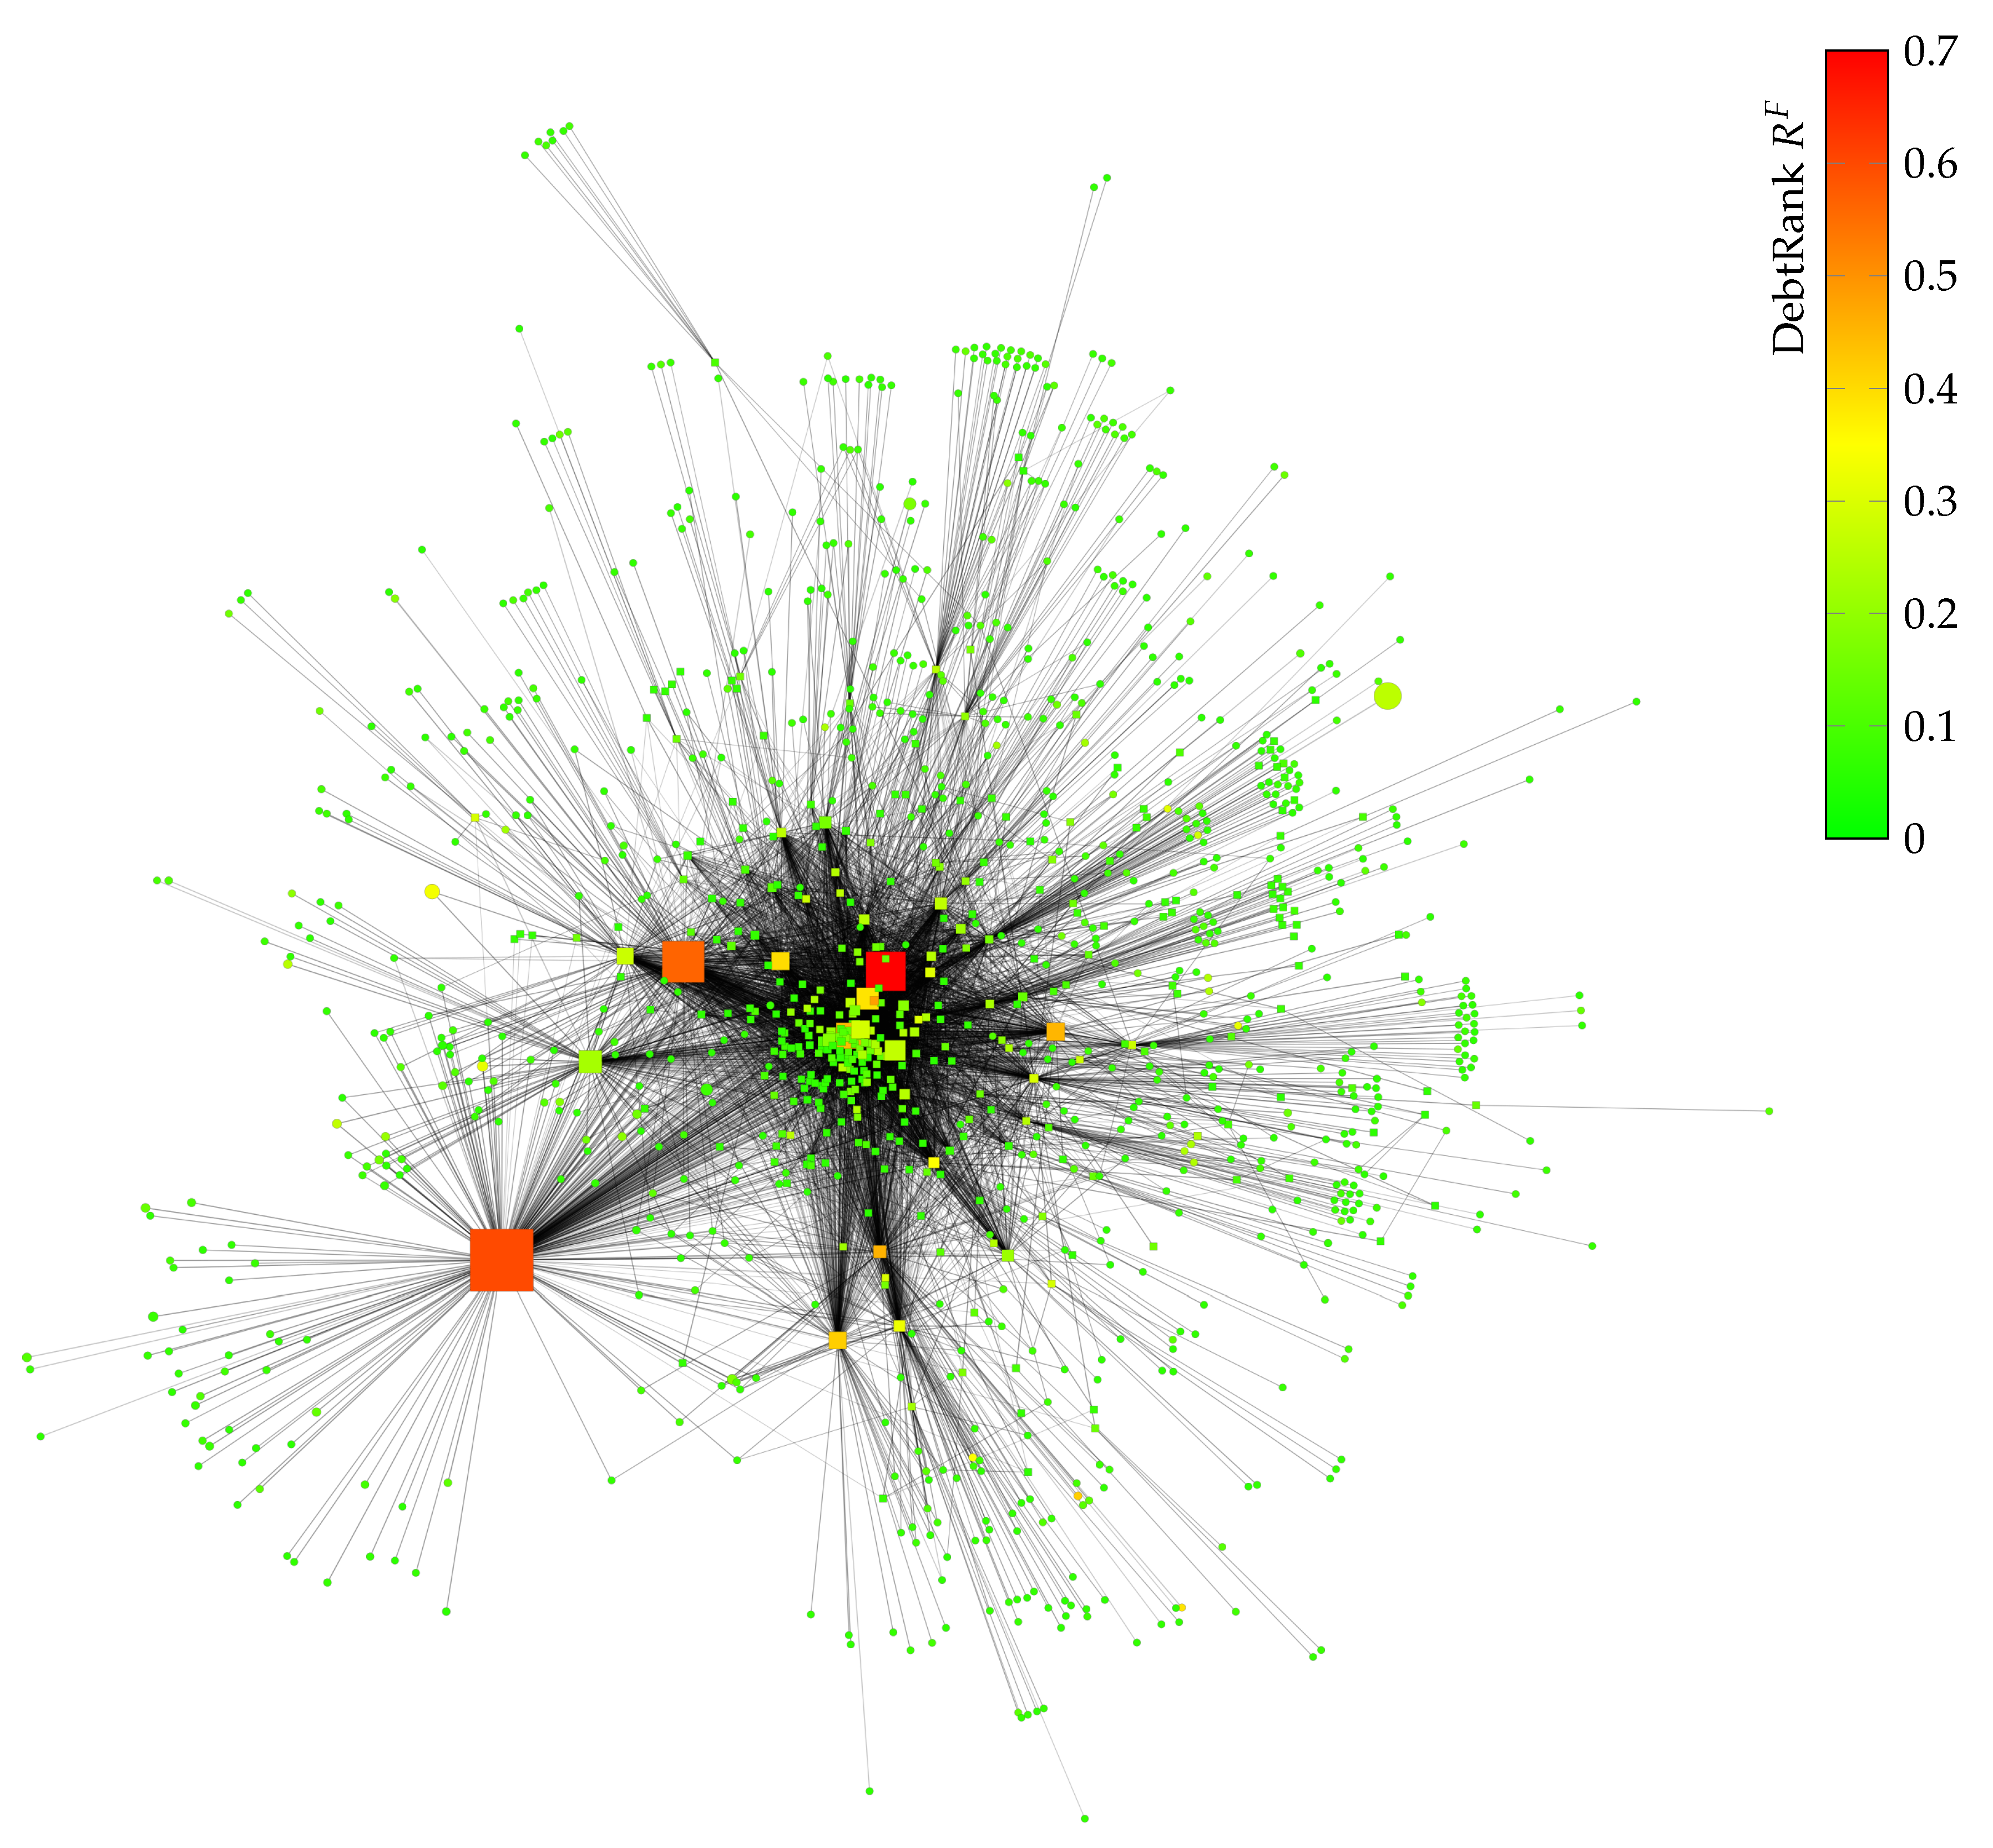
We use empirical data (see Section 2) to reconstruct the liability network of Austria, as outlined in Section 3. The resulting network with 50,159 nodes is visualized in Figure 4 and represents approximately 80.2% of total liabilities towards banks of firms and all interbank liabilities (we use the Hu Yifan network layout algorithm [34] in Gephi [35] for visualization). Bank nodes are represented by squares and firms by circles. The node size corresponds to the total assets held by each node.
Table 1 shows the directed and unweighted global clustering coefficients of the entire liability network, as well as the interbank network. Clustering coefficients are significantly larger than those of the corresponding random graphs with an identical number of nodes and links.
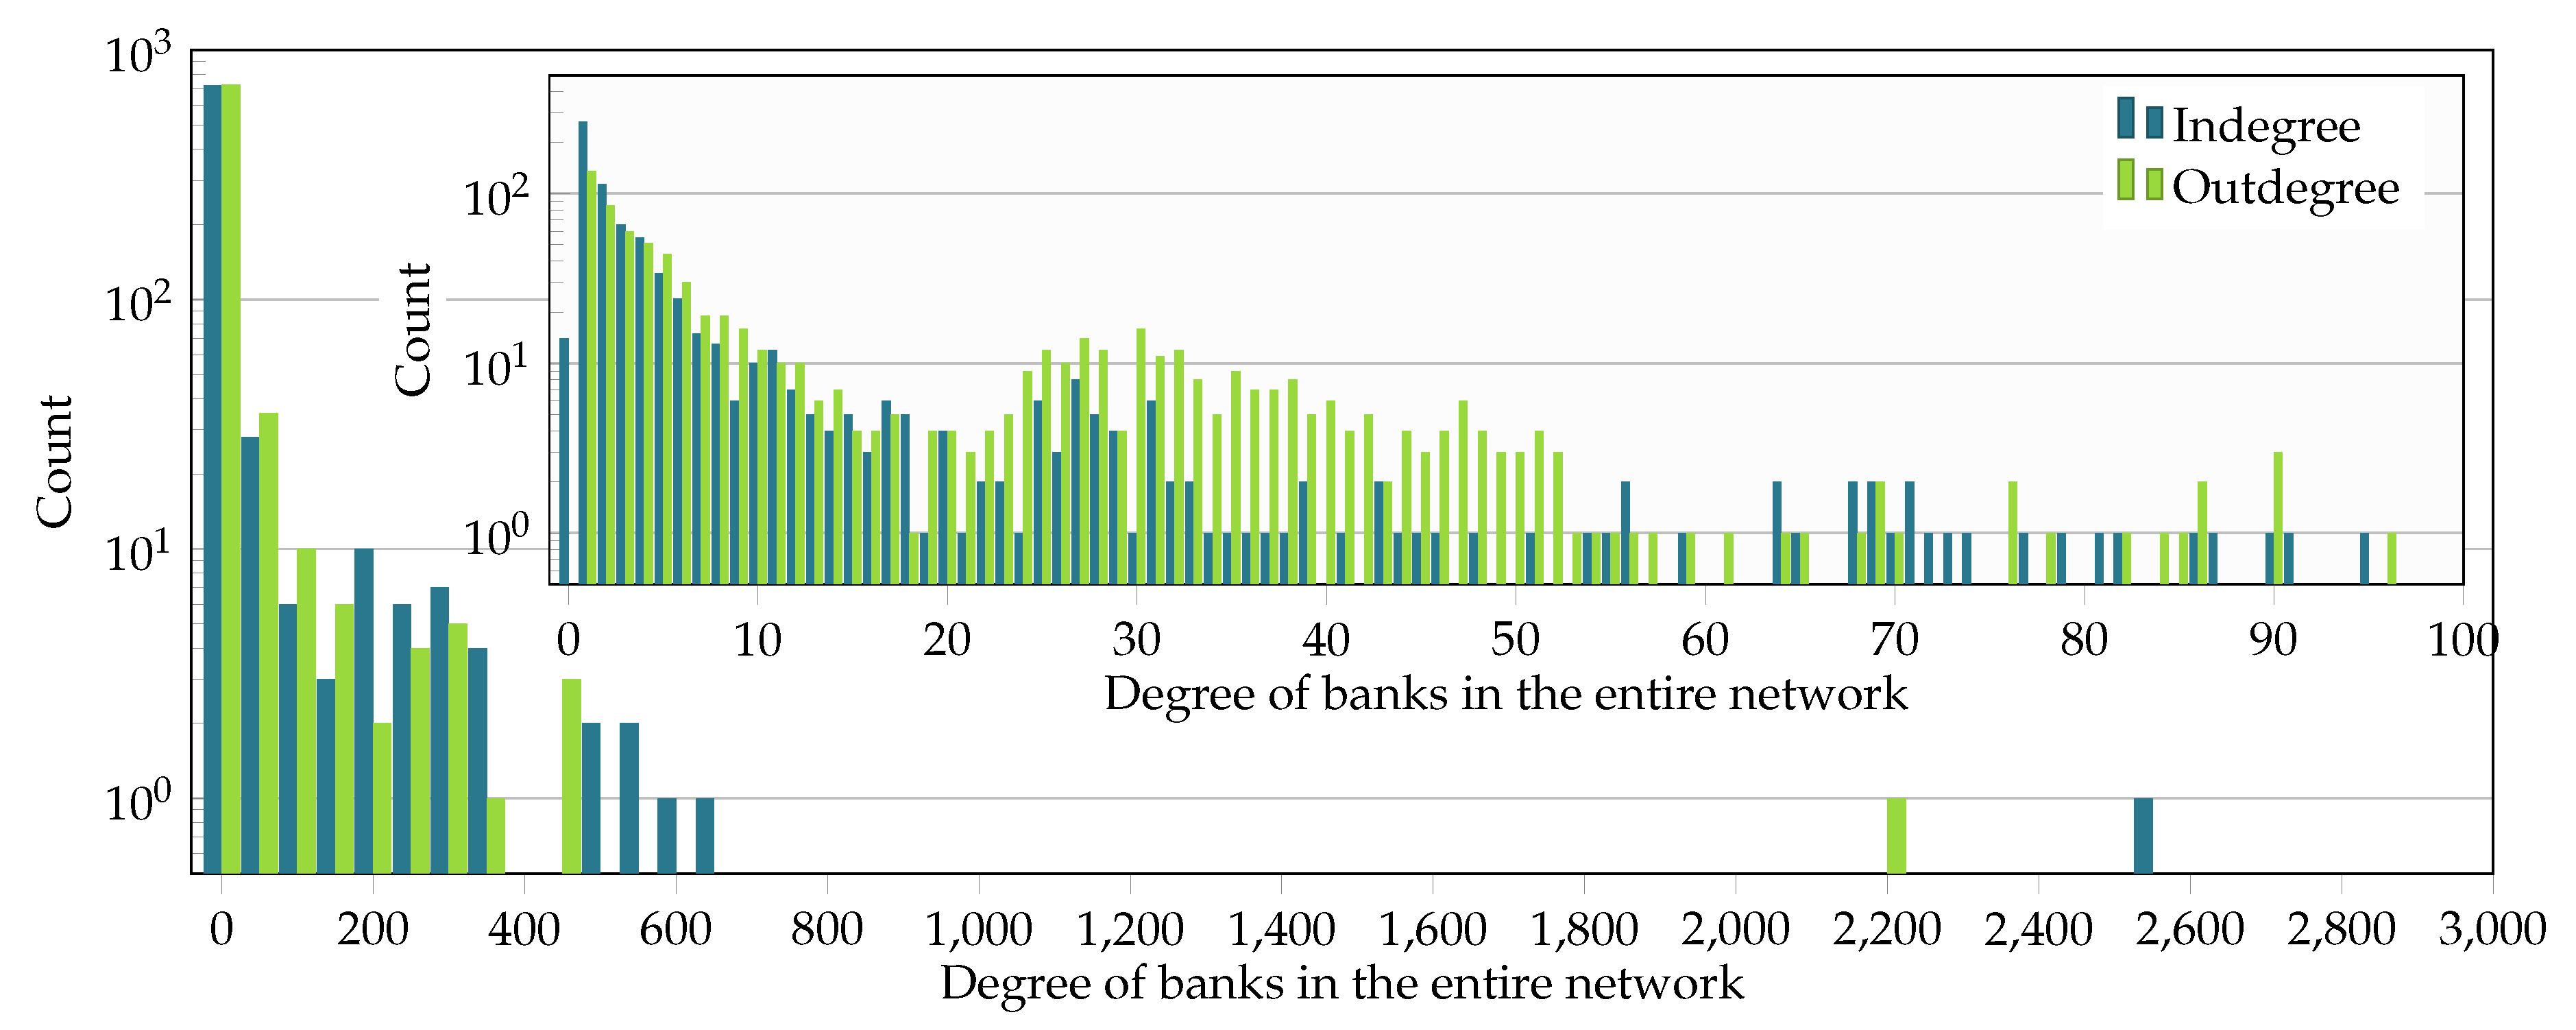
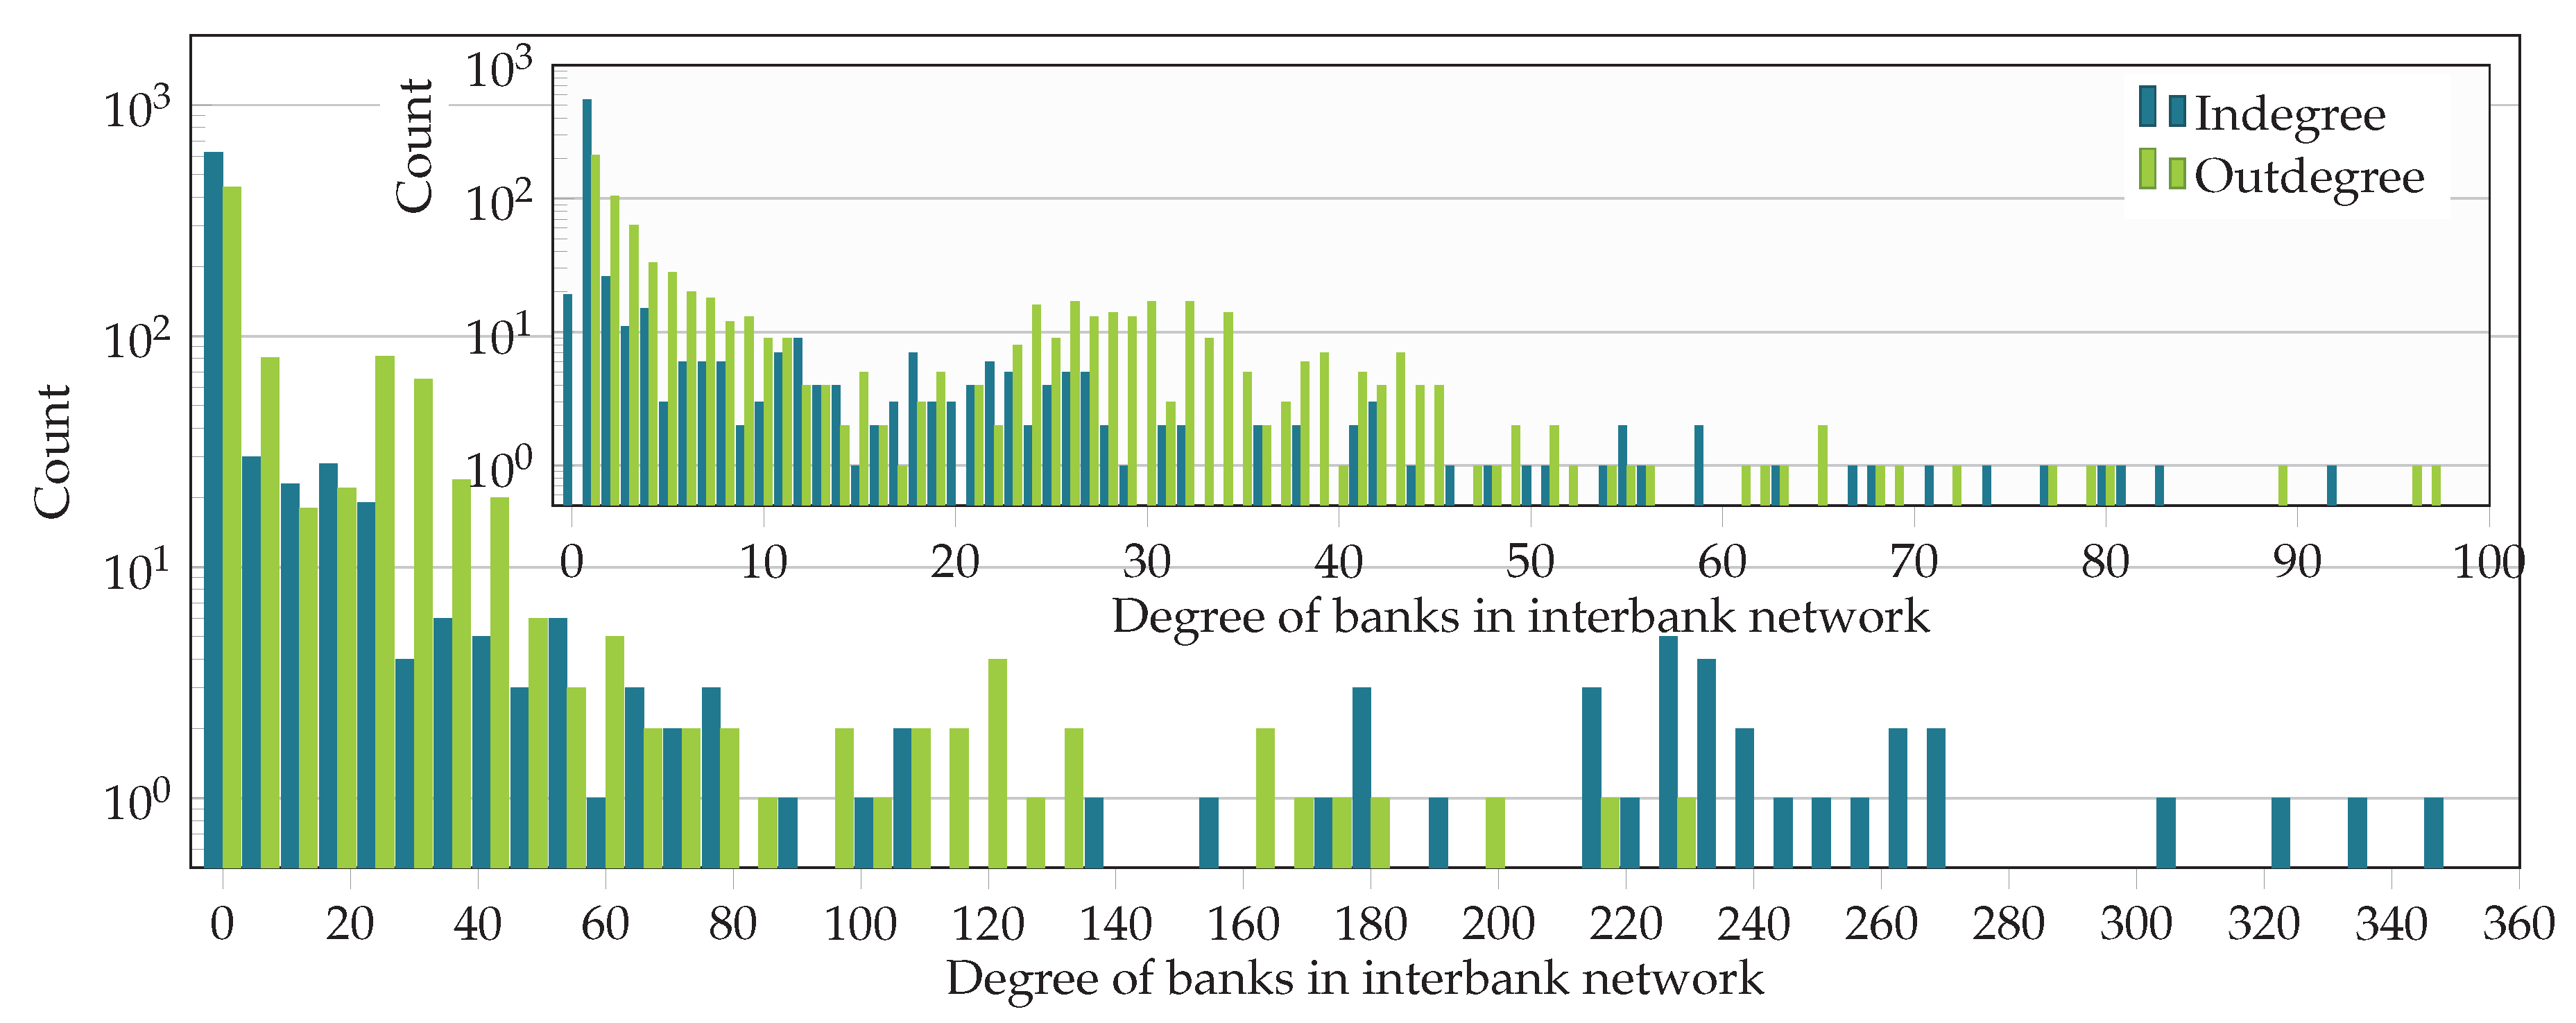
For the following analysis, we chose the subgraph induced by the set of all 796 banks in the Austrian banking system and the 5000 firms with the highest liabilities. The degree distributions of the banks in the entire liability network and the interbank network are illustrated in Figure 5 and Figure 6. The in- and out-degree distributions are depicted in Figure 5 for the entire liability network F and in Figure 6 for the interbank network B only. In Figure 5 and Figure 6, the main plots show the whole degree range, and the insets provide a finer resolution in the ranges with higher density. Out-degrees are smaller than in-degrees, suggesting that highly interconnected banks provide interbank loans to more banks than from which they receive loans.
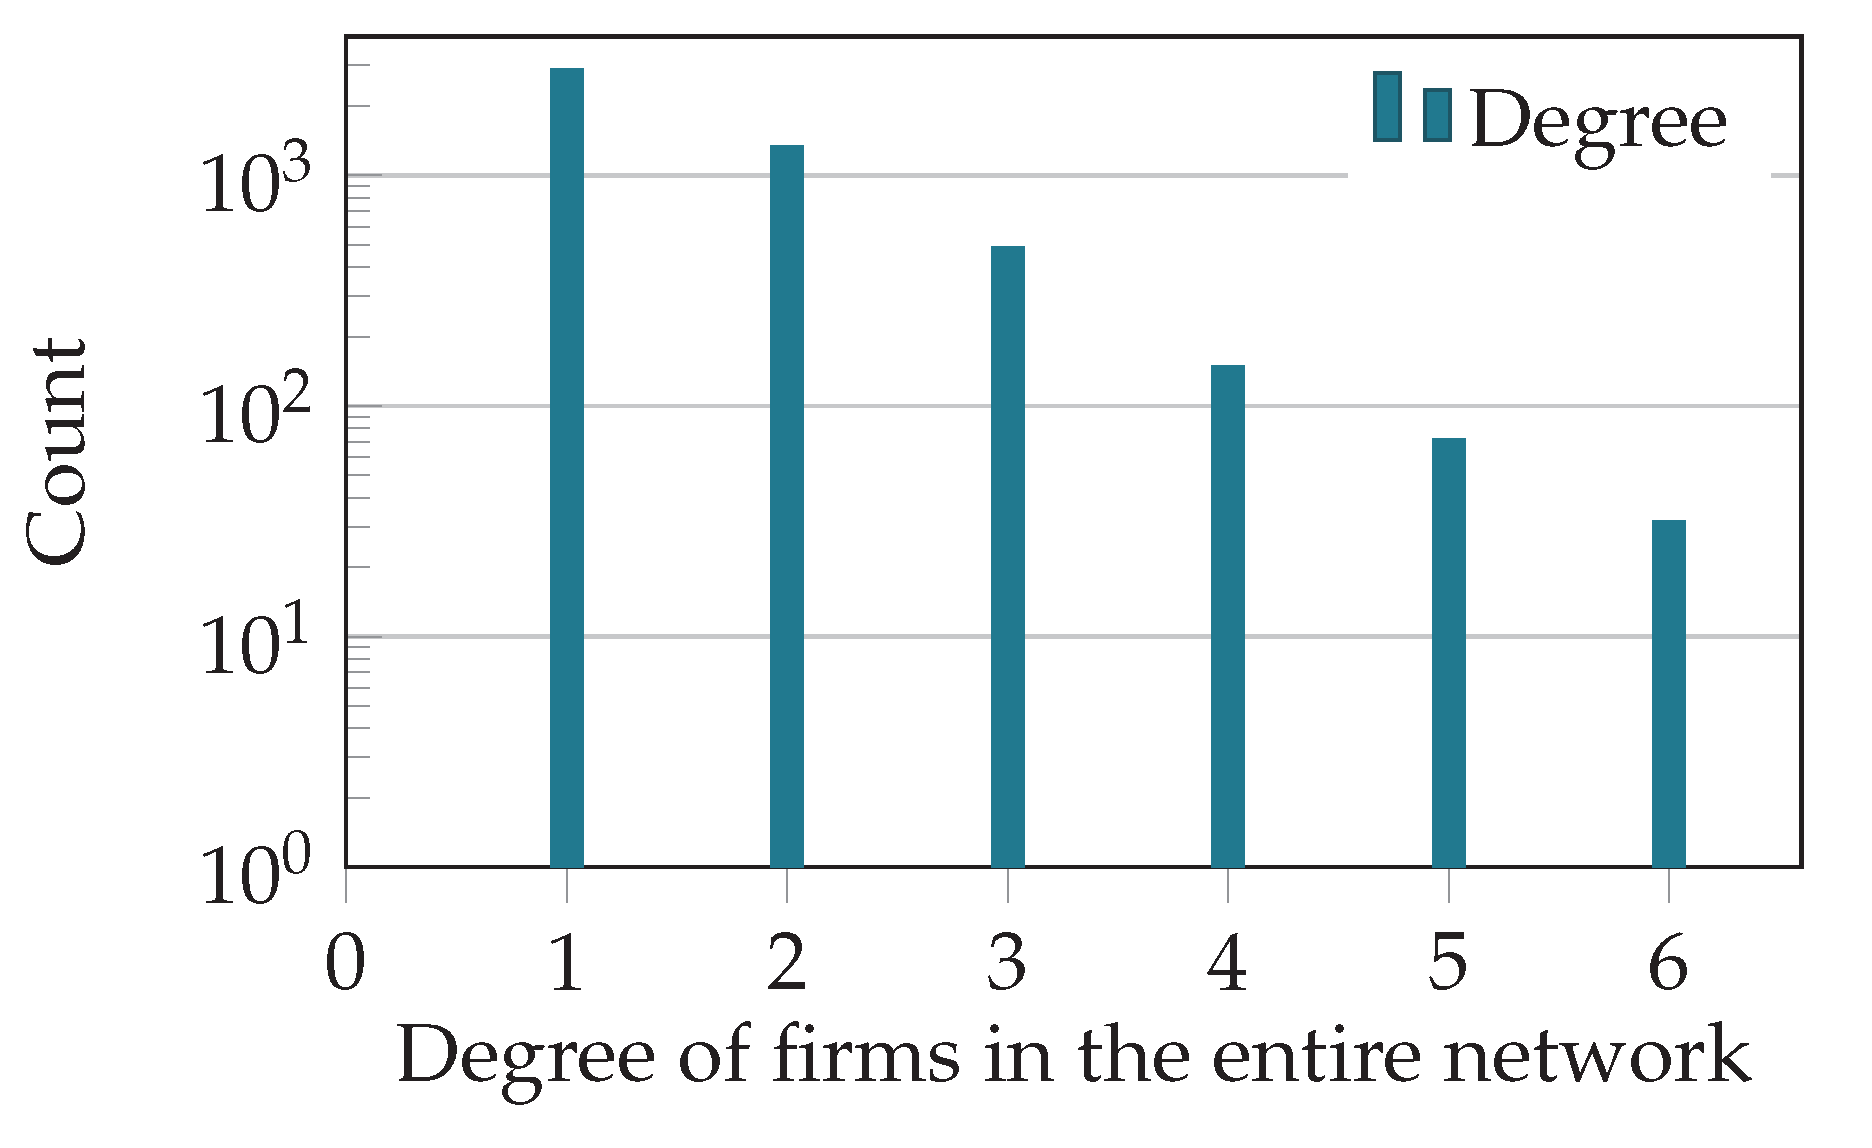
Figure 7 shows the degree distribution of firms in the entire liability network (similar to Figure 2). The degree distribution is restricted to firms with degree >0 and contains the 5000 firms with the highest liabilities in 2008. Note that the in- and out-degree of firms are identical, since the bank-firm connections provided by the commercial register were used for deposits and liabilities.
5. Systemically Important Firms and Banks in Austria
To identify systemically important firms and banks, we use DebtRank. DebtRank is a recursive method to determine the systemic importance of nodes within financial networks [2]. It is a quantity, (or ), that measures the fraction of the total economic value V, in the network that is potentially affected by the distress of an individual node i (or by a set of nodes S). For details, see Appendix A. Figure 8 shows all banks (squares) and firms (circles) with a DebtRank . Node size represents the total assets, while the color encodes the DebtRank. Nodes with the highest DebtRank typically are large banks with substantial total assets. However, there are also several mid-sized banks and firms with a high DebtRank. Note that some mid-sized banks and firms (total assets below one billion EUR) have a very high DebtRank (≈0.4).
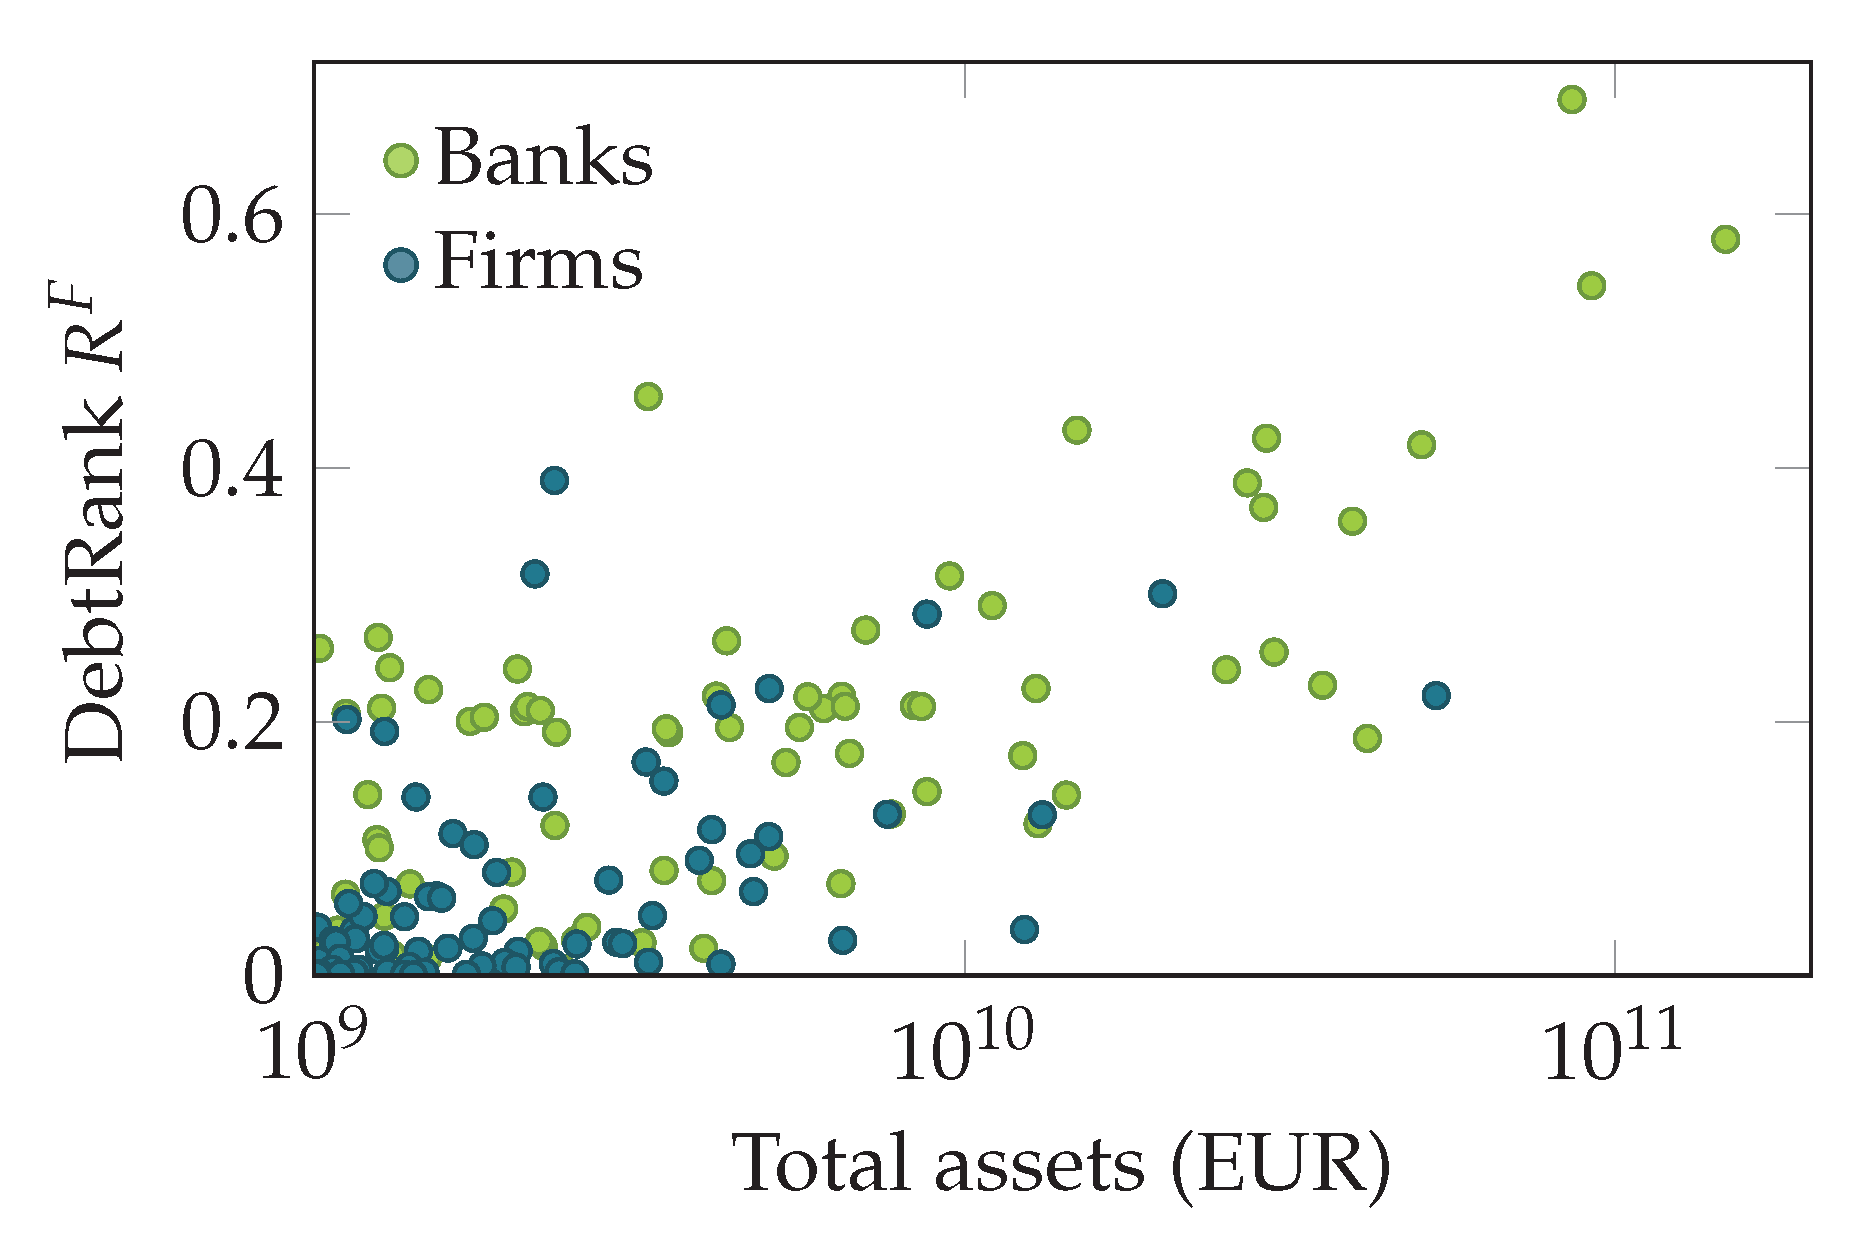
This can also be seen in Figure 9, which shows the DebtRank of firms and banks plotted in relation to their total assets. In general, firms, as well as banks with larger assets tend to have a higher DebtRank. However, firms with a similar DebtRank show a large variation in their total assets (multiple orders of magnitude). The distributions of banks and firms across the asset-DebtRank plain do not seem to be qualitatively different.
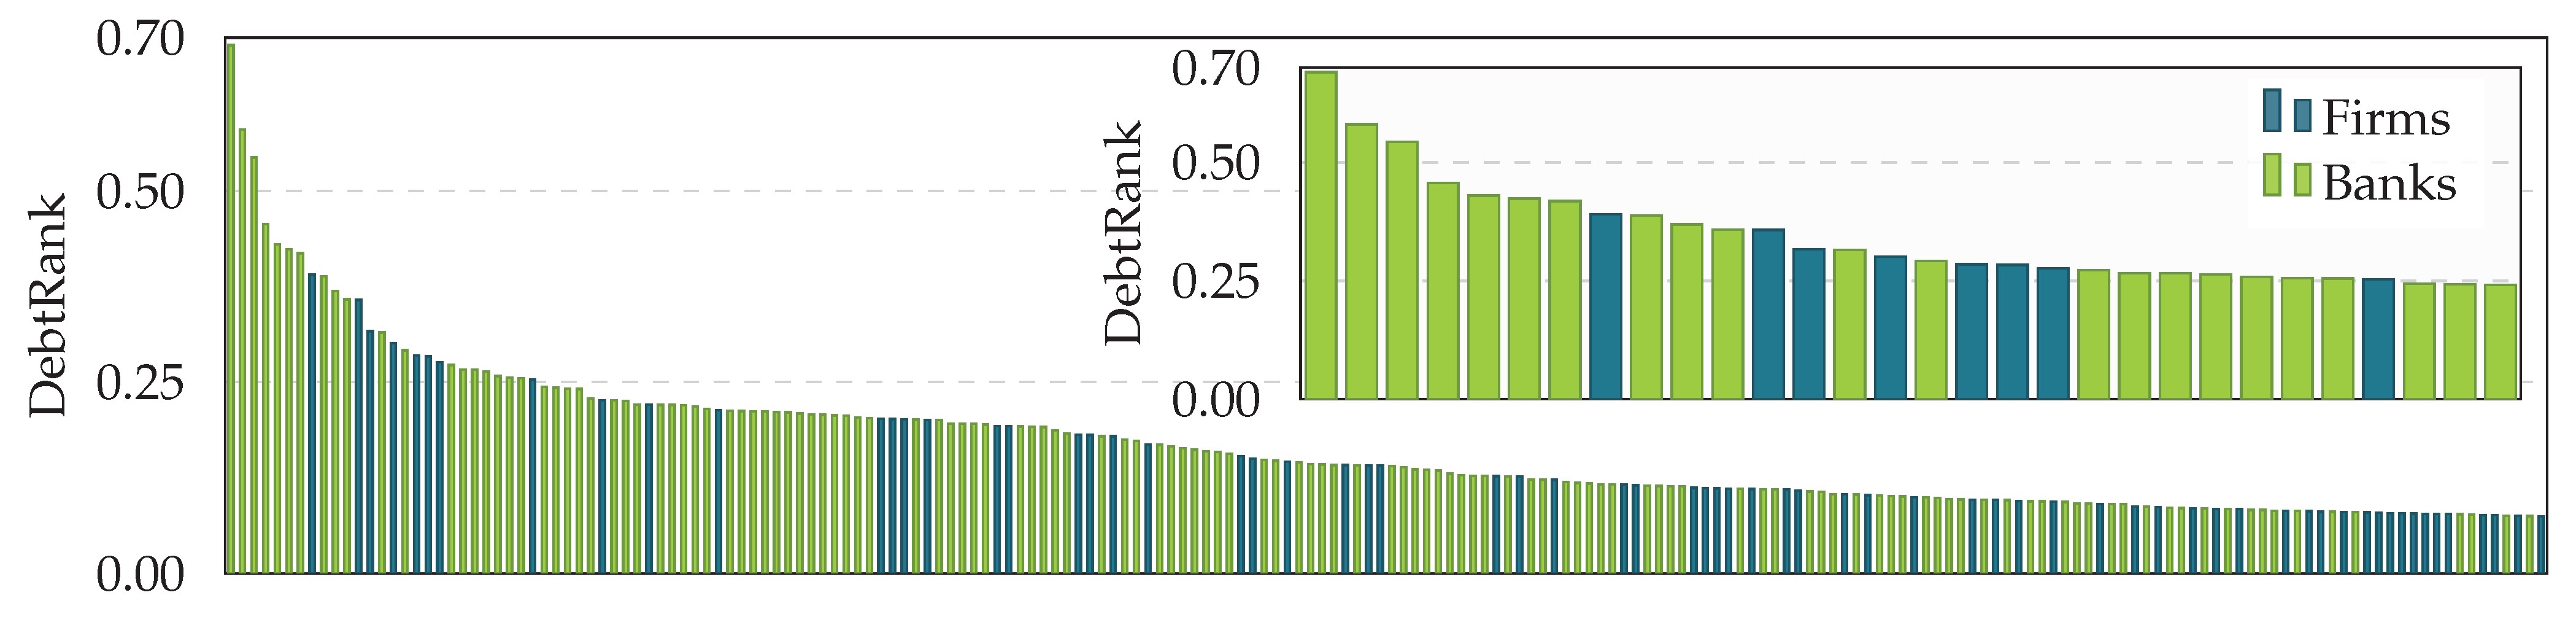
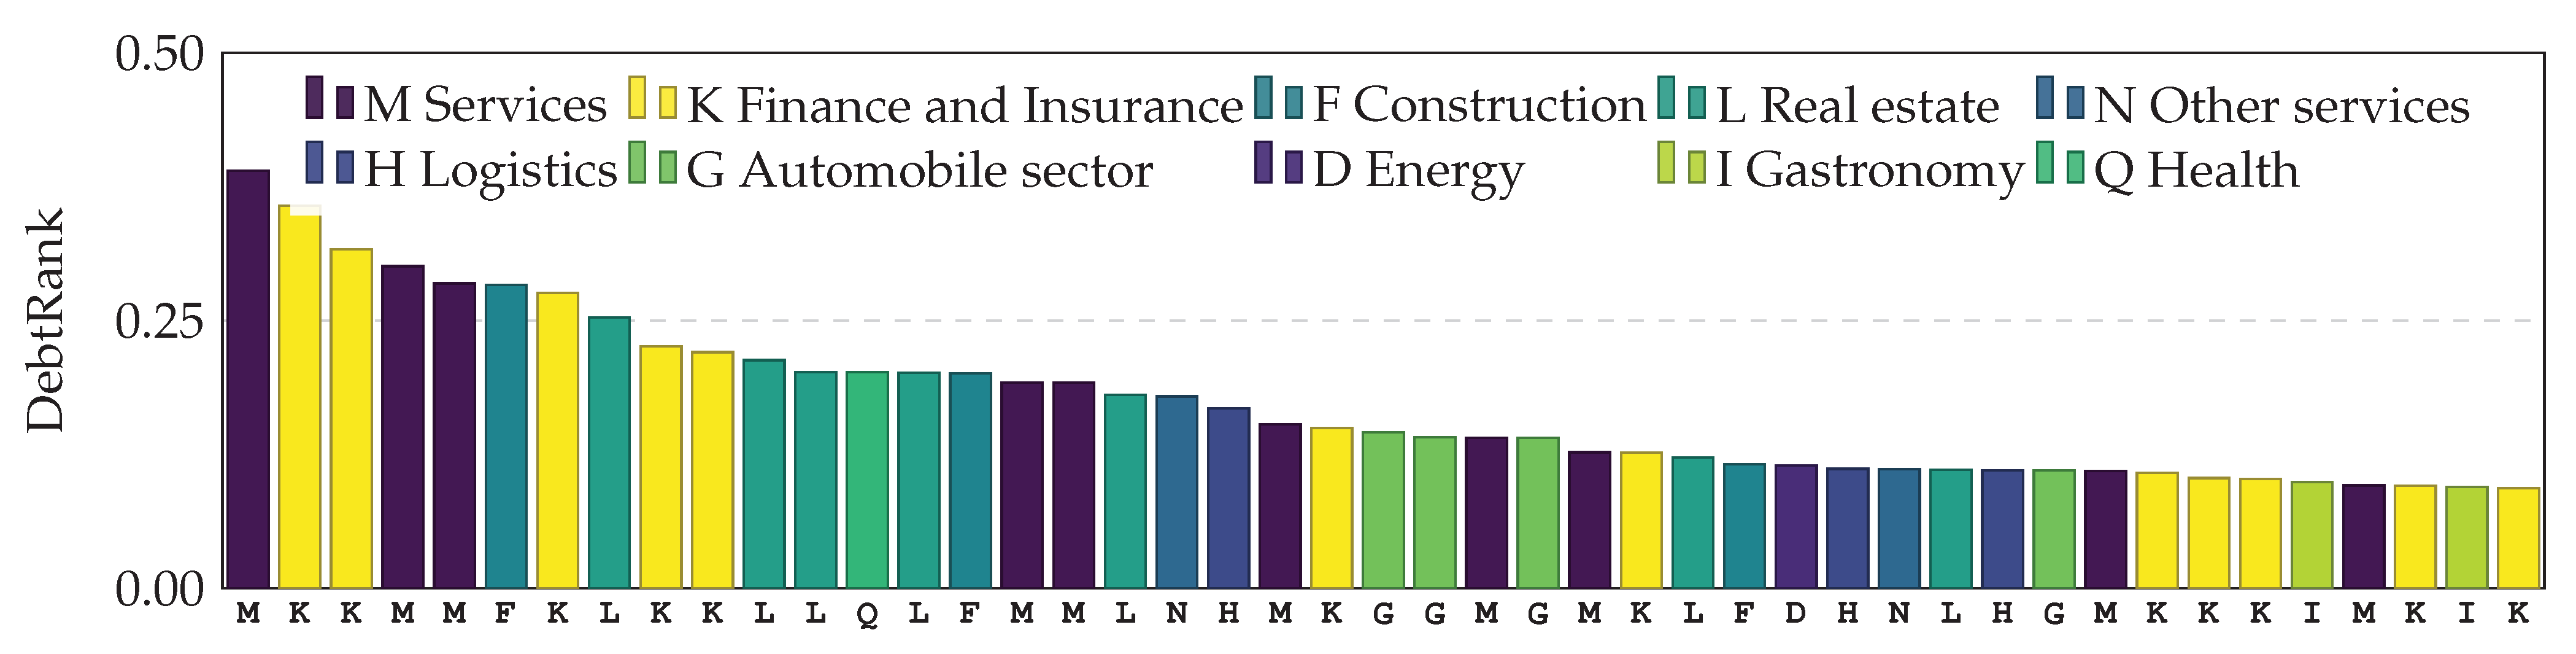
In Figure 10, we see 200 firms (dark green) and banks (light green) in Austria, ranked according to their systemic importance measured by DebtRank. It is not surprising that the most systemically important nodes are banks. It is, however, very interesting to find that the 8th most systemically important node already is a company. The DebtRank of that company is 0.39, meaning that the default of this firm would affect up to 39% of the Austrian financial system. Figure 11 shows the 45 firms with the highest DebtRank, where colors indicate their line of business according to the first level of their OeNACE code (below the bars) that is used to classify economic activities in Austria [33]. Systemically important firms are found across various industry sectors.
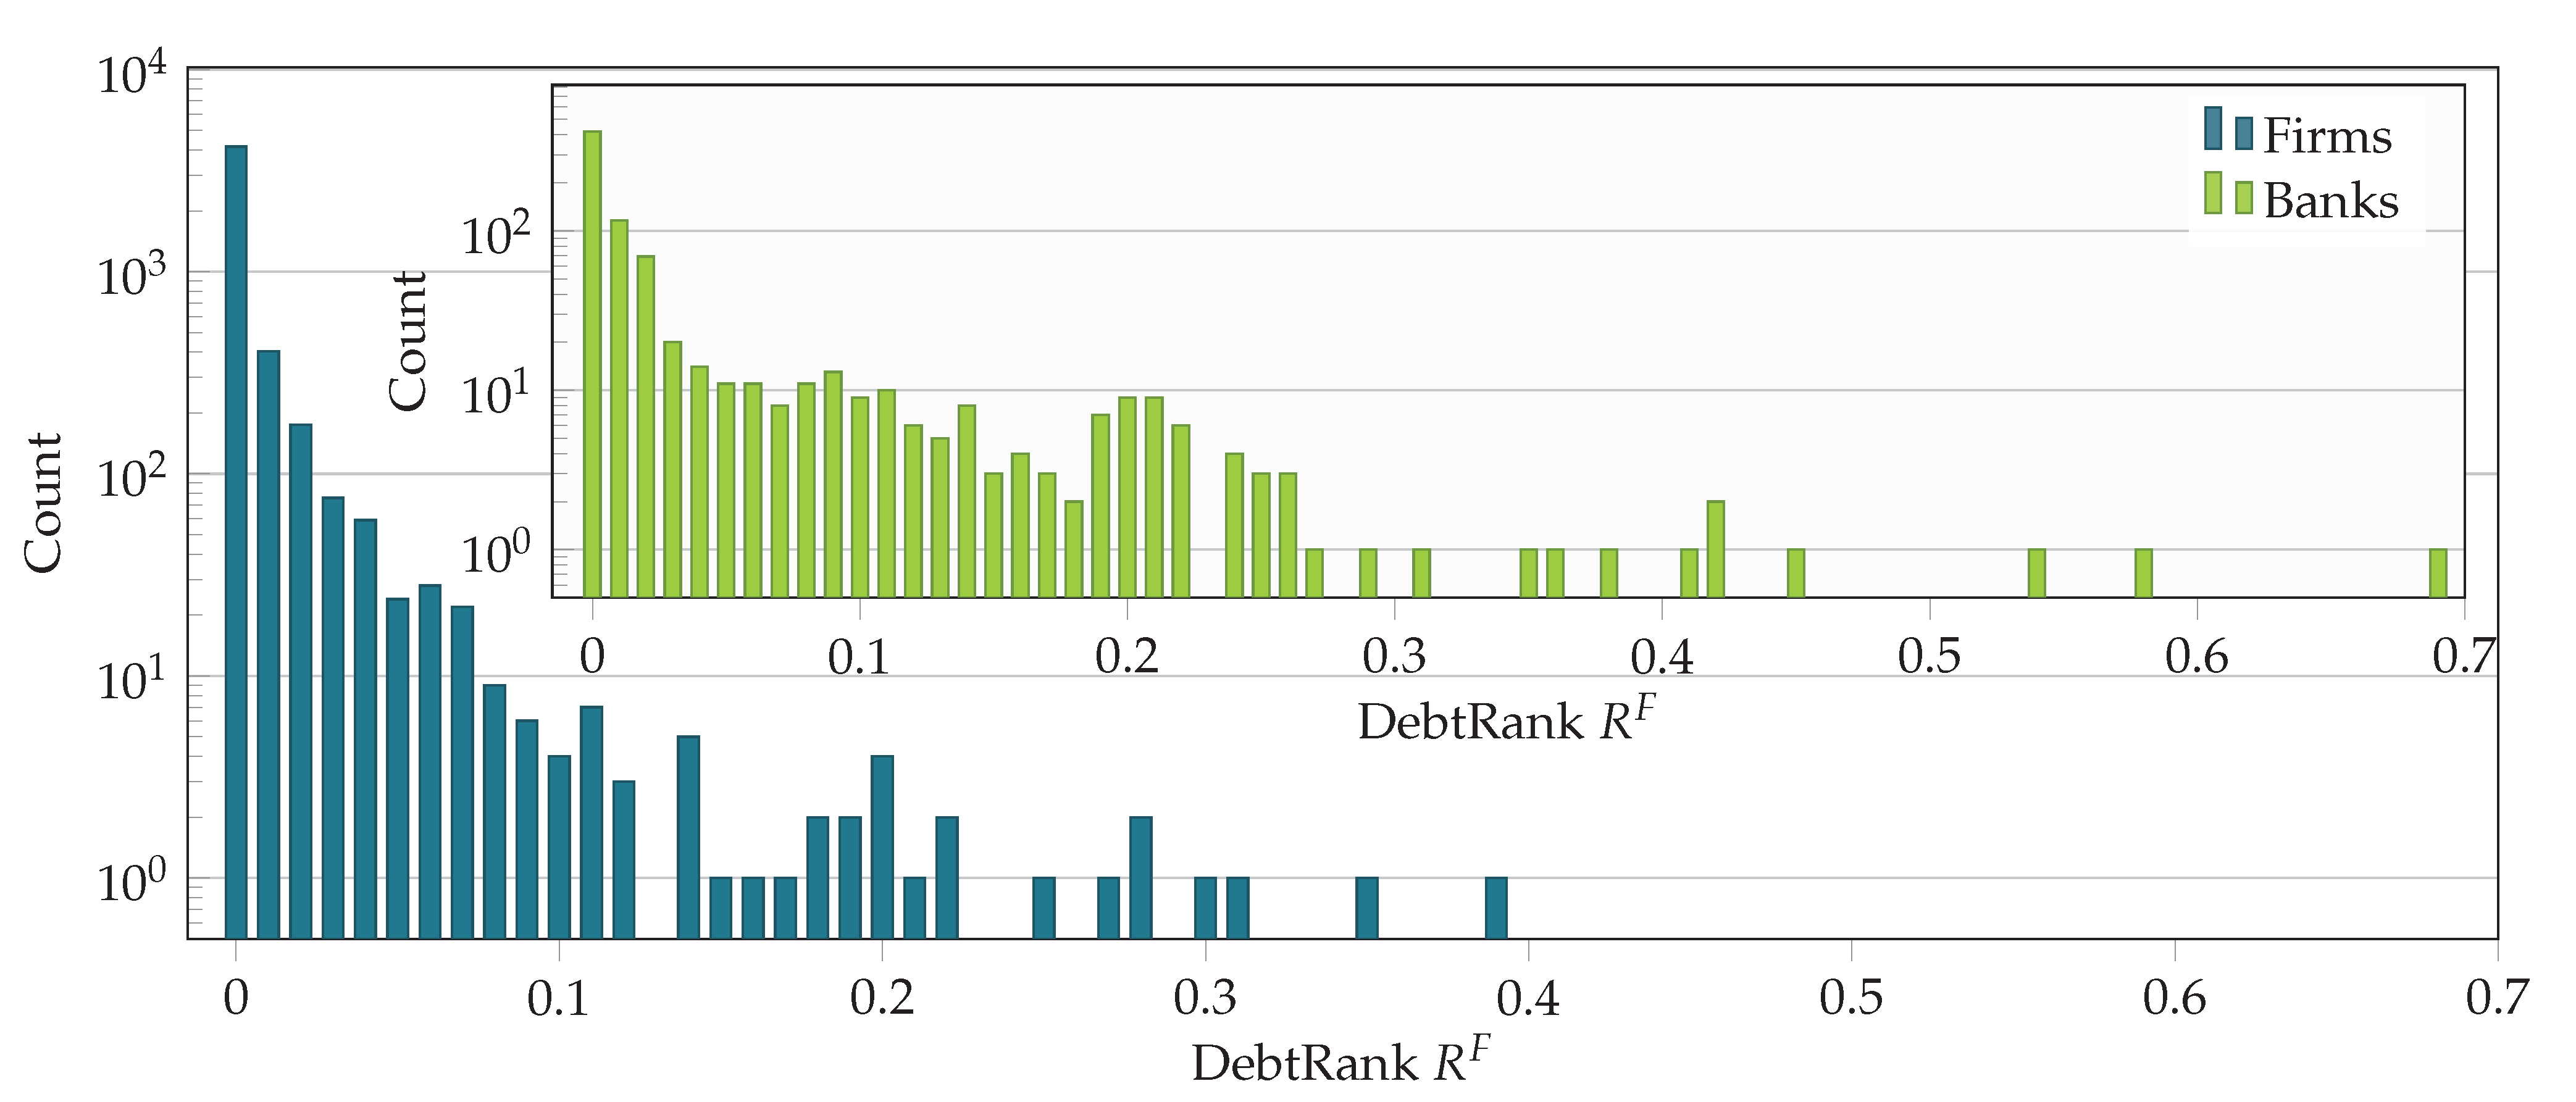
In Figure 12, the distribution of the DebtRank values of firms and banks (inset) is shown. Banks and firms have a qualitatively similar DebtRank distribution. Systemically important firms contribute systemic risk in a similar way as banks do.
Finally, we estimate the fraction of systemic risk contributed by firms in the entire liability network. We define as the ratio of the sum of the DebtRank values of all firms, divided by the sum of all DebtRank values in the entire liability network (including banks),
We find that in Austria for 2008. Firms introduce more than half of the systemic risk in the entire liability network (more than banks). To compare the systemic risk of the interbank network with the systemic risk of the entire liability network, we define a similar ratio,
where and refer to the total economic values of the interbank network and the entire liability network, respectively. In this case, we must take the different economic values of the two networks into account, since the DebtRank is a relative measure. We find in Austria for 2008, that is the total systemic risk of the interbank network amounts to only 29% of the total systemic risk of the entire liability network.
6. Conclusions
The systemic importance of financial institutions is closely related to the topology of financial liability networks. In this work, we reconstruct and analyze the financial credit network of 50,159 firms and banks that contains 80.2% of the total liabilities of firms towards banks and all interbank liabilities in the entire Austrian banking system. The network allows us to understand the detailed credit linkage between the complete financial economy with a significant fraction of the real economy of an entire nation. To our knowledge, this is the most comprehensive financial network ever analyzed.
We find that firms introduce systemic risk in similar ways as banks. Banks and firms qualitatively show similar distributions of systemic importance. In particular, we identify several mid-sized banks and firms (with total assets below one billion EUR) in Austria that are systemically important in the entire financial network. The systemic importance of these firms is primarily driven by their position in the network. Moreover, systemically important firms are not associated with specific industrial sectors, but are spread across many different industries. We find that banks and firms of similar systemic importance (DebtRank) show a large variance in asset sizes that spans several orders of magnitude. Our main result is that firms introduce more systemic risk than the financial sector. The total systemic risk of the Austrian interbank network in 2008 amounted to only 29% of the total systemic risk of the entire financial network consisting of firms and banks.
These results come with three caveats due to partially missing and partly inaccurate data. First, the analyzed financial network had to be reconstructed from balance sheet data and could not be directly assessed from empirical data sources. The uncertainty in the reconstruction arises in the estimation of the weights (size of firm liabilities towards banks) of the (unweighted) adjacency matrix. The latter is directly observable in the empirical data. For a large subset of firms, the liabilities ( of total liabilities towards banks) are known exactly and do not need to be reconstructed, since these firms are only customers of one bank (Figure 2). In addition, the interbank liabilities did not have to be reconstructed. Moreover, systemic risk, as measured by DebtRank, does seem to be rather robust against variations of reconstructed networks [36]. Second, interbank liabilities from the Austrian banking system are fully anonymized and linearly transformed. Thus, there remains a small uncertainty in the absolute value of the interbank liabilities, which also introduces some uncertainty in the matching process of the various datasets. Third, our analysis involves only one snapshot of the Austrian financial system in 2008, which is the only year where the two datasets overlap in time.
It would be interesting to extend this study to other countries and to investigate the evolution of similarly large financial networks that cover the financial and the real economy of an entire nation. It is a first step towards understanding the detailed linkage between the financial industry and the real economy. We believe that without that knowledge, it will remain hard to estimate the influence of financial crises on the real economy; in particular, under which circumstances a financial crisis will lead to an economic downturn and when will it not. The opposite question might also become answerable: Given an economic crisis, under which circumstances will it cause financial distress that might become systemic? Further investigation is needed to confirm and deepen the findings with other countries and across longer time horizons. However, we believe that it is clear from this contribution that the notion of systemically important financial institutions (SIFIs) or global and domestic systemically important banks can be directly extended to companies in the real economy. In Austria, we identify several mid-sized firms that carry substantial systemic risk, a fact that was hitherto not known. In conclusion, our analysis suggests that not only systemically important financial institutions, but also systemically important firms should be subject to macro-prudential regulation.
Author Contributions
S.P. and S.T. designed the research. S.P. and A.H. curated the data. A.H. reconstructed the network, performed the computations, and created the figures. S.P., A.H., and S.T. analyzed the results and wrote the manuscript.
Funding
We acknowledge funding by the Anniversary Fund of the Oesterreichische Nationalbank (OeNB) grant number 17795.
Acknowledgments
We thank Anita Wanjek, Ansa Heyl, Rudolf Hanel and Michael Miess for helping us with the manuscript.
Conflicts of Interest
The authors declare no conflict of interest.
Appendix A. DebtRank
The financial dependencies of the nodes in the network are given in a liability matrix L with entries, , denoting that node j has given node i a loan (or investment/deposit) of size . A capital (or equity) vector C with entries contains the capital of node i. The relative economic value of a node i is given by:
where is the sum of the outstanding liabilities of node i. The default of node i then affects all nodes j, where . The impact of the default of i on j is defined as:
The impact of a shock is thus measured as the fraction of capital loss due to the credit default. It is therefore a value in the range . means that the default of node i does not affect node j, while means that the default of node i results in a loss that matches or exceeds the capital of node j.
The economic value of the impact is obtained by multiplying the impact with the relative economic value from Equation (A1). The economic value of the impact of i on its neighbors is therefore given by:
If the neighbors of i do not have enough capital to compensate for the default of i, they default themselves and might cause an impact on their neighbors, as well as reverberations in the network, along paths in the impact network W. To prevent cycles (no bank defaults more than once), Battiston et al. [2] proposed to consider paths without repeating links. This is achieved by introducing two time-dependent state variables for each node, and (t). takes one of three values:
| Interpretation | |
| U | Node i is undistressed at time t |
| D | Node i is in distress at time t |
| I | Node i is inactive at time t |
The variable has a value within the range and is known as the level of distress. means undistressed, and signals the case of default. The value of is defined as:
whereas is given by:
To calculate the DebtRank of a node d (d for defaulting), the distress and status at time step are initialized as follows:
Then, the values of and are calculated for every node i and time step t, according to Equations (A4) and (A5), until all nodes are either inactive or undistressed at . The DebtRank of node d can then be calculated as the sum of the distress in the whole network at time , reduced by the distress at the beginning, that is the initial distress of node d at :
It is possible to calculate the DebtRank of a set S of simultaneously defaulting nodes by replacing the conditions in the initialization Equation (A7) by , and changing Equation (A8) to one of the following equations:
Equation (A9) excludes the impact of the initial shock, whereas Equation (A10) does not. In this work, DebtRank is calculated for two different networks, the interbank network B and the entire liability network F. We use and to discriminate between the two.
References
- Bank for International Settlements. Basel III: A Global Regulatory Framework for More Resilient Banks and Banking Systems; Bank for International Settlements: Basel, Switzerland, 2010. [Google Scholar]
- Battiston, S.; Puliga, M.; Kaushik, R.; Tasca, P.; Caldarelli, G. DebtRank: Too Central to Fail? Financial Networks, the FED and Systemic Risk. Sci. Rep. 2012, 2, 541. [Google Scholar] [CrossRef] [PubMed] [Green Version]
- Markose, S.; Giansante, S.; Shaghaghi, A.R. Too interconnected to fail financial network of US CDS market: Topological fragility and systemic risk. J. Econ. Behav. Organ. 2012, 83, 627–646. [Google Scholar] [CrossRef] [Green Version]
- Billio, M.; Getmansky, M.; Lo, A.W.; Pelizzon, L. Econometric measures of connectedness and systemic risk in the finance and insurance sectors. J. Financ. Econ. 2012, 104, 535–559. [Google Scholar] [CrossRef] [Green Version]
- Thurner, S.; Poledna, S. DebtRank-transparency: Controlling systemic risk in financial networks. Sci. Rep. 2013, 3, 1888. [Google Scholar] [CrossRef] [PubMed] [Green Version]
- Poledna, S.; Thurner, S. Elimination of systemic risk in financial networks by means of a systemic risk transaction tax. Quant. Financ. 2016, 16, 1599–1613. [Google Scholar] [CrossRef] [Green Version]
- Leduc, M.V.; Poledna, S.; Thurner, S. Systemic Risk Management in Financial Networks with Credit Default Swaps. J. Netw. Theory Financ. 2017, 3, 1–21. [Google Scholar] [CrossRef]
- Poledna, S.; Bochmann, O.; Thurner, S. Basel III capital surcharges for G-SIBs are far less effective in managing systemic risk in comparison to network-based, systemic risk-dependent financial transaction taxes. J. Econ. Dyn. Control 2017, 77, 230–246. [Google Scholar] [CrossRef] [Green Version]
- Adrian, T.; Brunnermeier, M. CoVaR; Technical Report; National Bureau of Economic Research: Cambridge, MA, USA, 2011.
- Acharya, V.; Pedersen, L.; Philippon, T.; Richardson, M. Measuring Systemic Risk; Technical Report; CEPR: Washington, DC, USA, 2012; Available online: http://ssrn.com/abstract=1573171 (accessed on 27 July 2018).
- Brownlees, C.T.; Engle, R.F. Volatility, Correlation and Tails for Systemic Risk Measurement. Available at SSRN 1611229. Available online: https://ssrn.com/abstract=1611229 (accessed on 27 July 2018).
- Huang, X.; Zhou, H.; Zhu, H. Systemic risk contributions. J. Financ. Serv. Res. 2012, 42, 55–83. [Google Scholar] [CrossRef]
- Saracco, F.; Di Clemente, R.; Gabrielli, A.; Squartini, T. Detecting early signs of the 2007–2008 crisis in the world trade. Sci. Rep. 2016, 6, 30286. [Google Scholar] [CrossRef] [PubMed] [Green Version]
- Upper, C.; Worms, A. Estimating Bilateral Exposures in the German Interbank Market: Is There a Danger of Contagion? Technical Report 9; Deutsche Bundesbank, Research Centre: Frankfurt am Main, Germany, 2002. [Google Scholar]
- Boss, M.; Summer, M.; Thurner, S. Contagion flow through banking networks. Lect. Notes Comput. Sci. 2004, 3038, 1070–1077. [Google Scholar]
- Boss, M.; Elsinger, H.; Summer, M.; Thurner, S. The network topology of the interbank market. Quant. Financ. 2005, 4, 677–684. [Google Scholar] [CrossRef]
- Soramäki, K.; Bech, M.L.; Arnold, J.; Glass, R.J.; Beyeler, W.E. The topology of interbank payment flows. Phys. A Stat. Mech. Appl. 2007, 379, 317–333. [Google Scholar] [CrossRef] [Green Version]
- Iori, G.; De Masi, G.; Precup, O.V.; Gabbi, G.; Caldarelli, G. A network analysis of the Italian overnight money market. J. Econ. Dyn. Control 2008, 32, 259–278. [Google Scholar] [CrossRef]
- Cajueiro, D.O.; Tabak, B.M.; Andrade, R.F. Fluctuations in interbank network dynamics. Phys. Rev. E 2009, 79, 037101. [Google Scholar] [CrossRef] [PubMed]
- Bech, M.L.; Atalay, E. The topology of the federal funds market. Phys. A Stat. Mech. Appl. 2010, 389, 5223–5246. [Google Scholar] [CrossRef] [Green Version]
- Fricke, D.; Lux, T. Core–periphery structure in the overnight money market: Evidence from the e-mid trading platform. Comput. Econ. 2014, 45, 359–395. [Google Scholar] [CrossRef]
- Iori, G.; Mantegna, R.N.; Marotta, L.; Micciche, S.; Porter, J.; Tumminello, M. Networked relationships in the e-MID Interbank market: A trading model with memory. J. Econ. Dyn. Control 2015, 50, 98–116. [Google Scholar] [CrossRef]
- Markose, S. Systemic Risk from Global Financial Derivatives: A Network Analysis of Contagion and its Mitigation with Super-Spreader Tax; IMF Working Paper WP/12/282; International Monetary Fund: Washington, DC, USA, 2012. [Google Scholar]
- Poledna, S.; Molina-Borboa, J.L.; Martínez-Jaramillo, S.; van der Leij, M.; Thurner, S. The multi-layer network nature of systemic risk and its implications for the costs of financial crises. J. Financ. Stab. 2015, 20, 70–81. [Google Scholar] [CrossRef] [Green Version]
- León, C.; Berndsen, R.; Renneboog, L. Financial Stability and Interacting Networks of Financial Institutions and Market Infrastructures; European Banking Center Discussion Paper Series; SSRN: Amsterdam, The Netherlands, 2014. [Google Scholar]
- Fujiwara, Y.; Aoyama, H.; Ikeda, Y.; Iyetomi, H.; Souma, W. Structure and temporal change of the credit network between banks and large firms in Japan. Economics 2009, 3, 1–18. [Google Scholar]
- De Masi, G.; Gallegati, M. Bank–firms topology in Italy. Empir. Econ. 2012, 43, 851–866. [Google Scholar] [CrossRef]
- Aoyama, H. Systemic risk in Japanese credit network. In Econophysics of Agent-Based Models; Springer: Berlin, Germany, 2014; pp. 219–228. [Google Scholar]
- Marotta, L.; Micciche, S.; Fujiwara, Y.; Iyetomi, H.; Aoyama, H.; Gallegati, M.; Mantegna, R.N. Bank-firm credit network in Japan: An analysis of a bipartite network. PLoS ONE 2015, 10, e0123079. [Google Scholar] [CrossRef] [PubMed] [Green Version]
- De Masi, G.; Fujiwara, Y.; Gallegati, M.; Greenwald, B.; Stiglitz, J.E. An analysis of the Japanese credit network. Evol. Inst. Econ. Rev. 2011, 7, 209–232. [Google Scholar] [CrossRef]
- Miranda, R.; Tabak, B. Contagion Risk within Firm-Bank Bivariate Networks; Technical Report; Central Bank of Brazil, Research Department: Brasilia, Brazil, 2013. [Google Scholar]
- Lux, T. A model of the topology of the bank—Firm credit network and its role as channel of contagion. J. Econ. Dyn. Control 2016, 66, 36–53. [Google Scholar] [CrossRef] [Green Version]
- Wirtschaftskammer Österreich. ÖNACE—Klassifikation der Wirtschaftstätigkeiten. 2008. Available online: http://wko.at/statistik/oenace/oenace2008.pdf (accessed on 27 July 2018).
- Hu, Y. Efficient, high-quality force-directed graph drawing. Math. J. 2006, 10, 37–71. [Google Scholar]
- Bastian, M.; Heymann, S.; Jacomy, M. Gephi: An open source software for exploring and manipulating networks. Icwsm 2009, 8, 361–362. [Google Scholar]
- Anand, K.; van Lelyveld, I.; Banai, Á.; Friedrich, S.; Garratt, R.; Hałaj, G.; Fique, J.; Hansen, I.; Jaramillo, S.M.; Lee, H.; et al. The missing links: A global study on uncovering financial network structures from partial data. J. Financ. Stab. 2018, 35, 107–119. [Google Scholar] [CrossRef]
Figure 1.
Aggregated debt structure of firms in Austria in 2008. The top bar shows the total liabilities ordered by the number of banks associated with each firm. The liabilities that are owed to a given number of banks (per firm) are shown in different colors. For instance, the liabilities of firms that receive loans from only one bank are shown in light green. The other stacked bars show the composition of different components of liabilities in the balance sheets. Different components of liabilities are sorted according to the total volume in each component.

Figure 2.
Number of banks associated with each firm. Different numbers of business relationships are shown in different colors. For instance, 37,079 firms have business relationships with only one bank.
Figure 2.
Number of banks associated with each firm. Different numbers of business relationships are shown in different colors. For instance, 37,079 firms have business relationships with only one bank.

Figure 3.
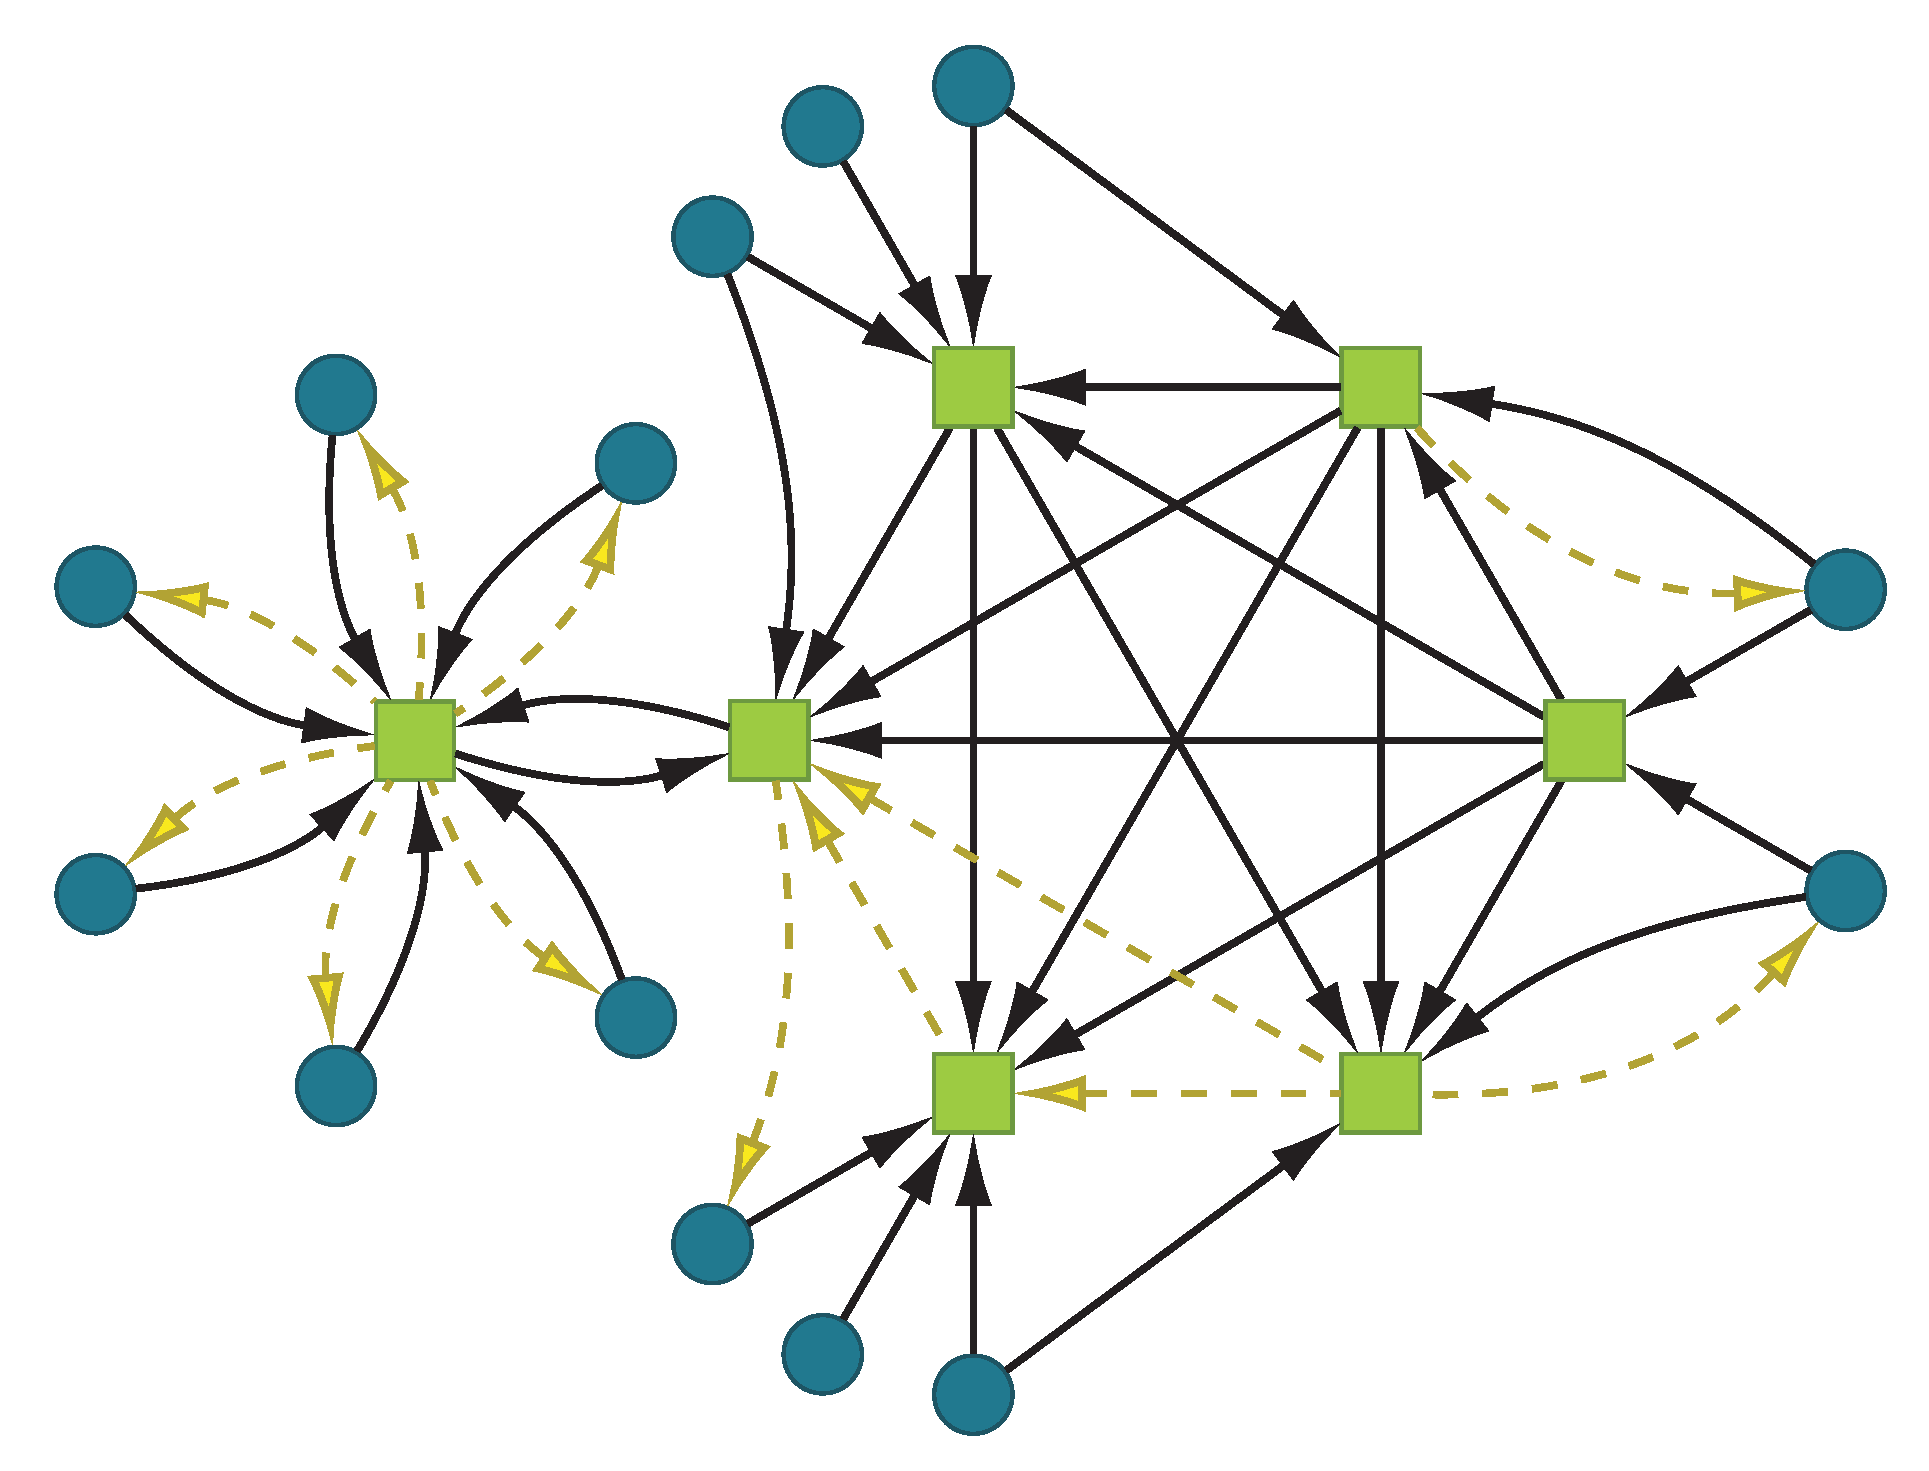
Schematic illustration of a network of banks ![Entropy 20 00792 i001]() and firms
and firms ![Entropy 20 00792 i002]() . Connections are either loans or
. Connections are either loans or ![Entropy 20 00792 i005]() deposits
deposits ![Entropy 20 00792 i006]() . Banks are connected to firms and to each other, whereas firms only interact with banks.
. Banks are connected to firms and to each other, whereas firms only interact with banks.
 and firms
  . Connections are either loans or
  deposits
  . Banks are connected to firms and to each other, whereas firms only interact with banks.
Figure 3.
Schematic illustration of a network of banks ![Entropy 20 00792 i001]() and firms
and firms ![Entropy 20 00792 i002]() . Connections are either loans or
. Connections are either loans or ![Entropy 20 00792 i005]() deposits
deposits ![Entropy 20 00792 i006]() . Banks are connected to firms and to each other, whereas firms only interact with banks.
. Banks are connected to firms and to each other, whereas firms only interact with banks.
and firms . Connections are either loans or deposits . Banks are connected to firms and to each other, whereas firms only interact with banks.
Figure 4.
Reconstructed liability network of Austria with 796 bank nodes ![Entropy 20 00792 i001]() and 49,363 firm nodes
and 49,363 firm nodes ![Entropy 20 00792 i002]() in 2008. The network represents approximately 80.2% of total liabilities towards banks of firms and all interbank liabilities. The node size corresponds to the total assets held by each node.
in 2008. The network represents approximately 80.2% of total liabilities towards banks of firms and all interbank liabilities. The node size corresponds to the total assets held by each node.
and 49,363 firm nodes in 2008. The network represents approximately 80.2% of total liabilities towards banks of firms and all interbank liabilities. The node size corresponds to the total assets held by each node.
Figure 5.
In- and out-degree of banks in the subgraph of 796 banks and 5000 firms. The main plot has 60 uniform bins on the interval , while the inset shows the distribution of degrees in the range .
Figure 5.
In- and out-degree of banks in the subgraph of 796 banks and 5000 firms. The main plot has 60 uniform bins on the interval , while the inset shows the distribution of degrees in the range .

Figure 6.
In- and out-degree of banks in the interbank network B. The main plot has 60 uniform bins on the interval , while the inset shows the distribution of degrees in the range .
Figure 6.
In- and out-degree of banks in the interbank network B. The main plot has 60 uniform bins on the interval , while the inset shows the distribution of degrees in the range .

Figure 7.
Degree of firms in the subgraph of 796 banks and 5000 firms. Values for in- and out-degrees are identical because loans and deposits ( and network; see Section 3) use the same adjacency matrix that specifies the bank-firm connections in the commercial register.
Figure 7.
Degree of firms in the subgraph of 796 banks and 5000 firms. Values for in- and out-degrees are identical because loans and deposits ( and network; see Section 3) use the same adjacency matrix that specifies the bank-firm connections in the commercial register.

Figure 8.
Subgraph of Figure 4 with nodes with a DebtRank . Bank nodes are represented by squares and firms by circles. The node size corresponds to the total assets held by each node. Nodes are colored according to their DebtRank. Nodes representing firms and banks with more assets tend to have a higher DebtRank. However, there are also medium-sized banks and firms that show a high DebtRank.

Figure 9.
DebtRank of firms (dark green) and banks (light green) plotted against their total assets (as a proxy for firm size) in Euros. Note that firms with a similar DebtRank show differences in their asset sizes of multiple orders of magnitude. The distributions of banks and firms in the asset-DebtRank plain do not appear to be qualitatively different.

Figure 10.
DebtRanks of 200 firms (dark green) and banks (light green) sorted by their DebtRank in decreasing order. The inset shows the 20 firms and banks with the highest DebtRank. The most systemically important nodes are banks; however, note that already the 8th most important node is a firm.
Figure 10.
DebtRanks of 200 firms (dark green) and banks (light green) sorted by their DebtRank in decreasing order. The inset shows the 20 firms and banks with the highest DebtRank. The most systemically important nodes are banks; however, note that already the 8th most important node is a firm.

Figure 11.
Firms in different economic sectors ranked by DebtRank (in descending order). Colors denote the economic sector of the firms. We follow the OeNACE classification (used as the x-axis label).
Figure 11.
Firms in different economic sectors ranked by DebtRank (in descending order). Colors denote the economic sector of the firms. We follow the OeNACE classification (used as the x-axis label).

Figure 12.
Histogram of DebtRank in the entire liability network of banks [ ![Entropy 20 00792 i003]() ] and firms [
] and firms [ ![Entropy 20 00792 i004]() ]. Banks and firms have a qualitatively similar DebtRank distribution. The highest DebtRank of a firm is 0.39.
]. Banks and firms have a qualitatively similar DebtRank distribution. The highest DebtRank of a firm is 0.39.
 ] and firms [
  ]. Banks and firms have a qualitatively similar DebtRank distribution. The highest DebtRank of a firm is 0.39.
Figure 12.
Histogram of DebtRank in the entire liability network of banks [ ![Entropy 20 00792 i003]() ] and firms [
] and firms [ ![Entropy 20 00792 i004]() ]. Banks and firms have a qualitatively similar DebtRank distribution. The highest DebtRank of a firm is 0.39.
]. Banks and firms have a qualitatively similar DebtRank distribution. The highest DebtRank of a firm is 0.39.
] and firms [ ]. Banks and firms have a qualitatively similar DebtRank distribution. The highest DebtRank of a firm is 0.39.

Table 1.
Number of nodes and links in the entire liability network and in the interbank network alone. The directed and unweighted global clustering coefficient for both networks show much higher clustering than the corresponding random graphs (same number of nodes and links).
Table 1.
Number of nodes and links in the entire liability network and in the interbank network alone. The directed and unweighted global clustering coefficient for both networks show much higher clustering than the corresponding random graphs (same number of nodes and links).
| Network | Nodes | Links | ||
|---|---|---|---|---|
| Entire network F | 50,159 | 140,528 | 0.126 | 0.001 |
| Interbank network B | 796 | 12,783 | 0.337 | 0.005 |
© 2018 by the authors. Licensee MDPI, Basel, Switzerland. This article is an open access article distributed under the terms and conditions of the Creative Commons Attribution (CC BY) license (http://creativecommons.org/licenses/by/4.0/).
Share and Cite
MDPI and ACS Style
Poledna, S.; Hinteregger, A.; Thurner, S. Identifying Systemically Important Companies by Using the Credit Network of an Entire Nation. Entropy 2018, 20, 792. https://0-doi-org.brum.beds.ac.uk/10.3390/e20100792
AMA Style
Poledna S, Hinteregger A, Thurner S. Identifying Systemically Important Companies by Using the Credit Network of an Entire Nation. Entropy. 2018; 20(10):792. https://0-doi-org.brum.beds.ac.uk/10.3390/e20100792
Chicago/Turabian StylePoledna, Sebastian, Abraham Hinteregger, and Stefan Thurner. 2018. "Identifying Systemically Important Companies by Using the Credit Network of an Entire Nation" Entropy 20, no. 10: 792. https://0-doi-org.brum.beds.ac.uk/10.3390/e20100792
Note that from the first issue of 2016, this journal uses article numbers instead of page numbers. See further details here.