Study in Natural Time of Geoelectric Field and Seismicity Changes Preceding the Mw6.8 Earthquake on 25 October 2018 in Greece


1
Section of Solid State Physics, Department of Physics, National and Kapodistrian University of Athens, Panepistimiopolis, Zografos, 15784 Athens, Greece
2
Solid Earth Physics Institute, Department of Physics, National and Kapodistrian University of Athens, Panepistimiopolis, Zografos, 15784 Athens, Greece
*
Author to whom correspondence should be addressed.
Entropy 2018, 20(11), 882; https://0-doi-org.brum.beds.ac.uk/10.3390/e20110882
Submission received: 5 November 2018
/
Revised: 13 November 2018
/
Accepted: 14 November 2018
/
Published: 16 November 2018
(This article belongs to the Special Issue Entropy, Nonlinear Dynamics, and Methods of Complex Systems in Earthquake Physics including Precursory Phenomena)
Abstract
:A strong earthquake of magnitude M6.8 struck Western Greece on 25 October 2018 with an epicenter at 37.515 N 20.564 E. It was preceded by an anomalous geolectric signal that was recorded on 2 October 2018 at a measuring station 70 km away from the epicenter. Upon analyzing this signal in natural time, we find that it conforms to the conditions suggested for its identification as precursory Seismic Electric Signal (SES) activity. Notably, the observed lead time of 23 days lies within the range of values that has been very recently identified as being statistically significant for the precursory variations of the electric field of the Earth. Moreover, the analysis in natural time of the seismicity subsequent to the SES activity in the area candidate to suffer this strong earthquake reveals that the criticality conditions were obeyed early in the morning of 18 October 2018, i.e., almost a week before the strong earthquake occurrence, in agreement with earlier findings. Finally, when employing the recent method of nowcasting earthquakes, which is based on natural time, we find an earthquake potential score around 80%.
1. Introduction
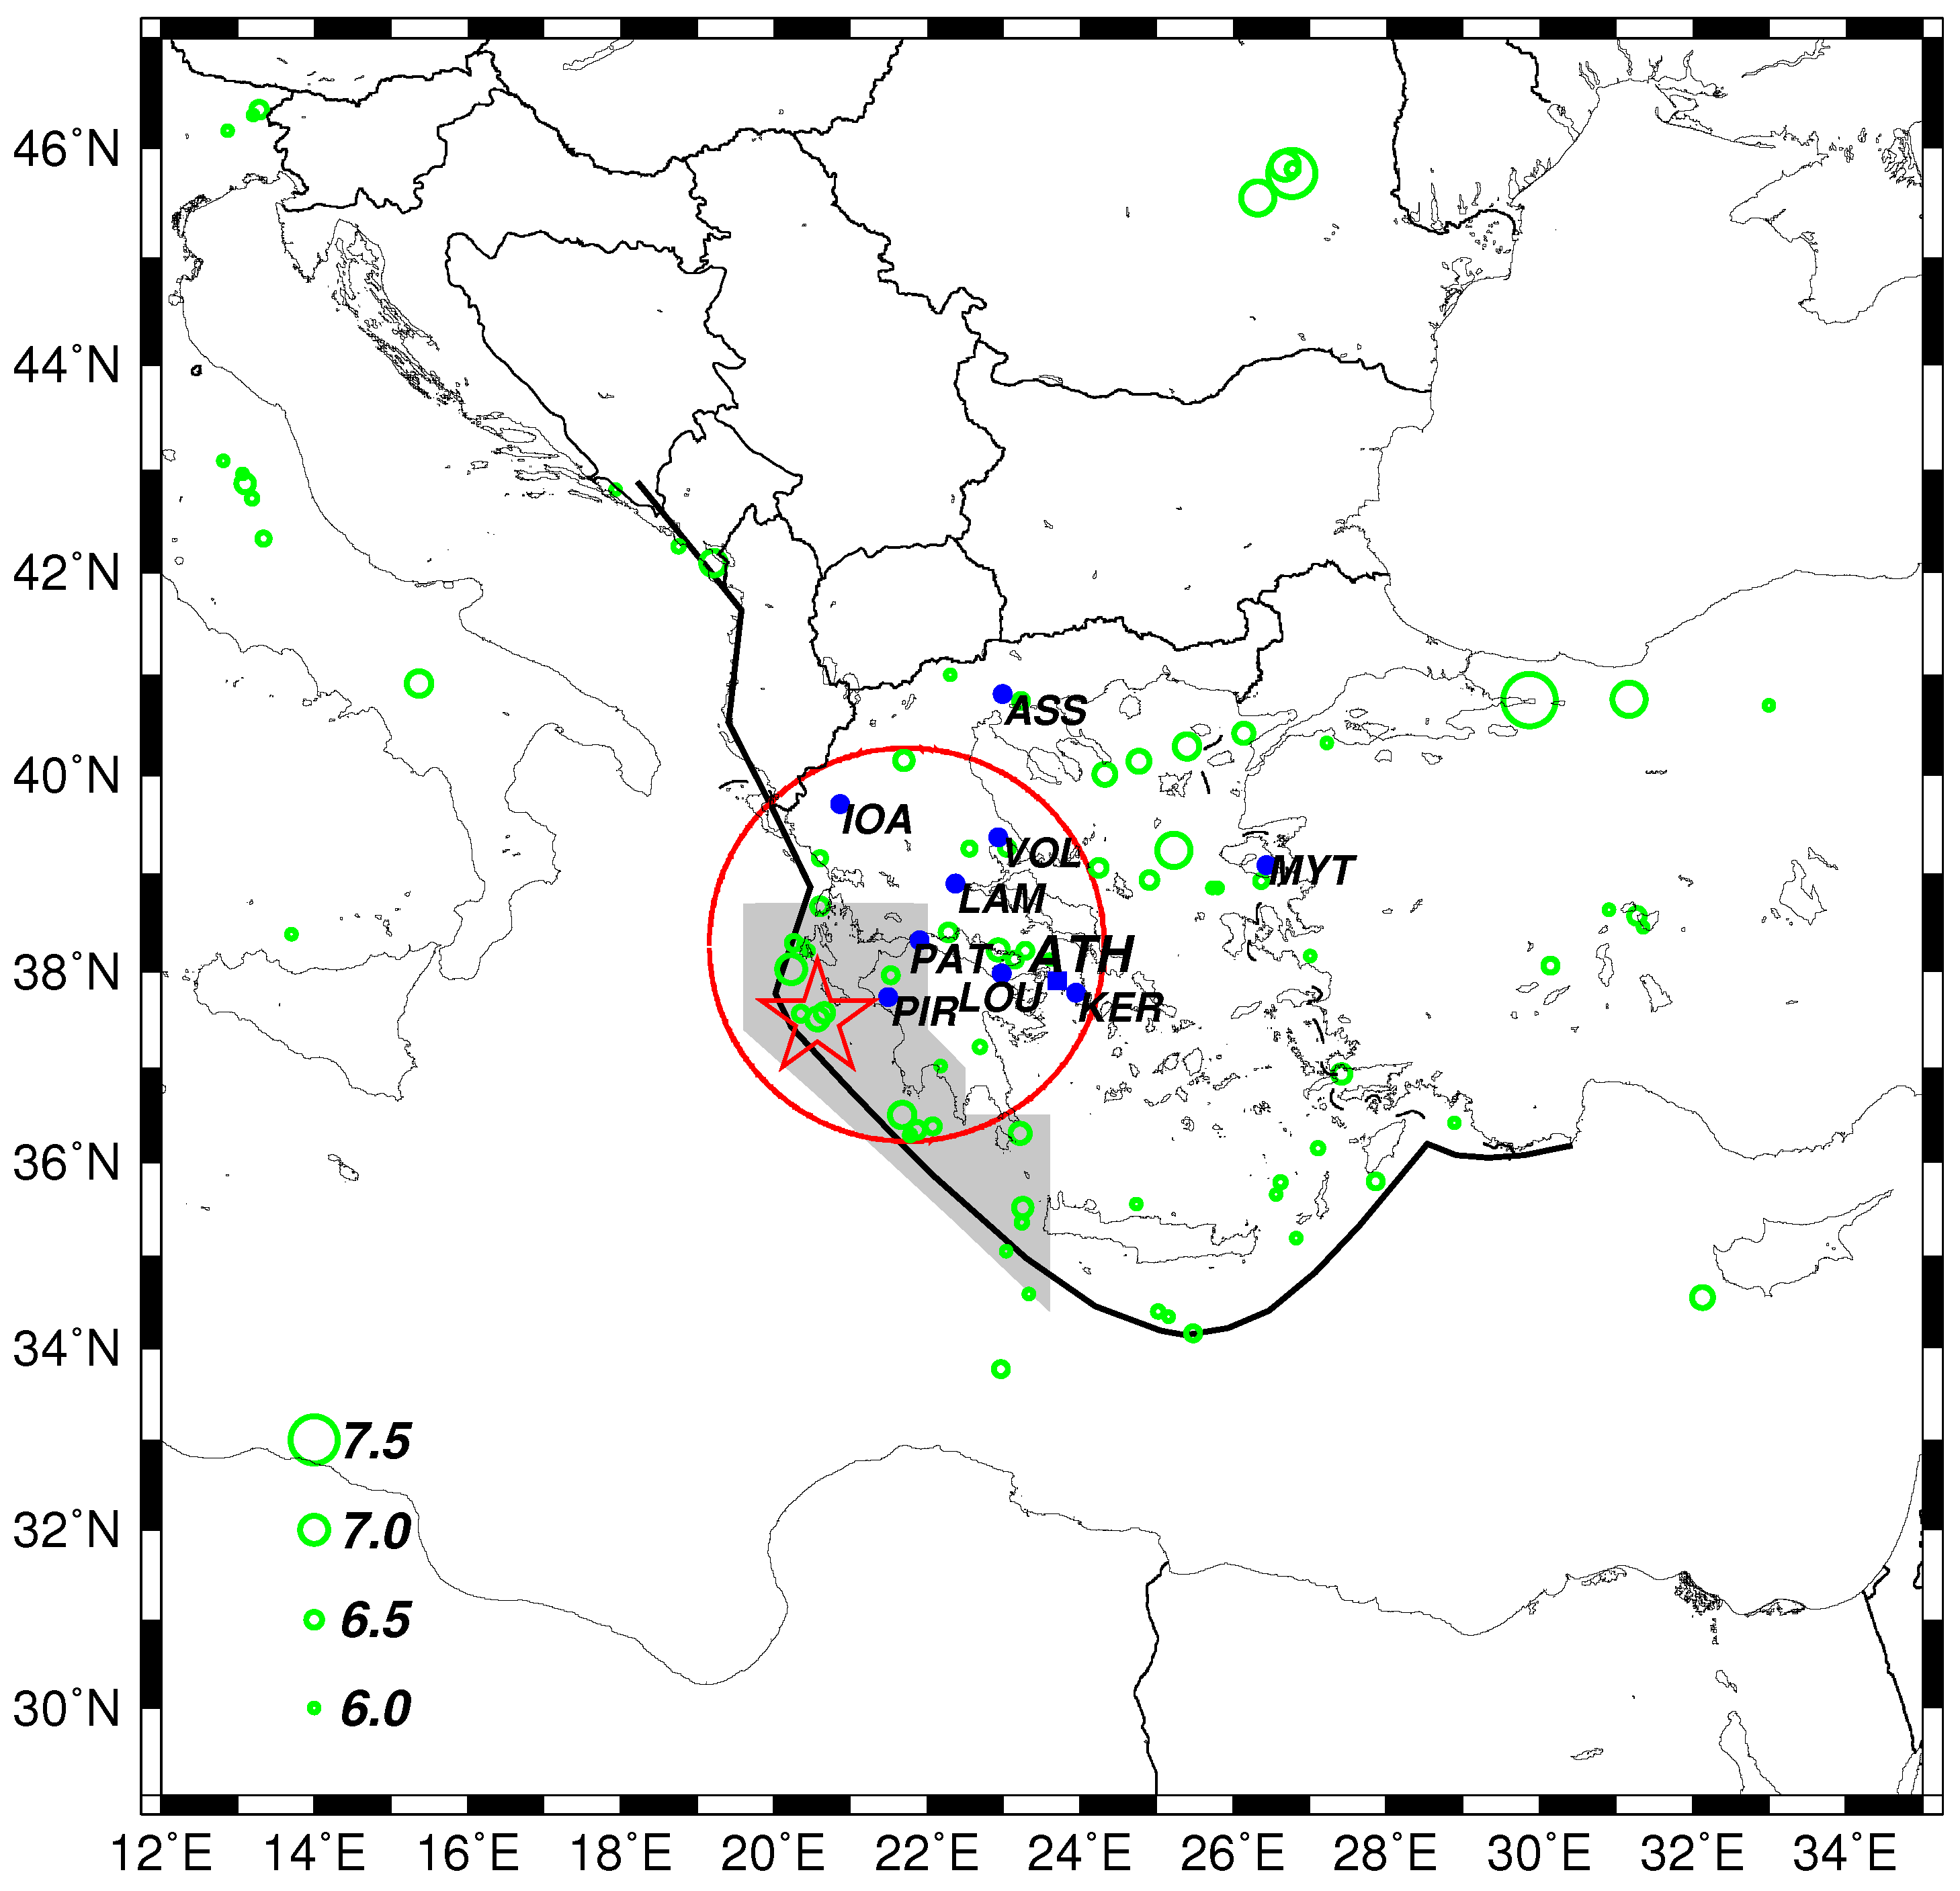
According to the United States Geological Survey (USGS) [1], a strong earthquake (EQ) of moment magnitude M6.8 occurred on 25 October 2018 10:55 p.m. Coordinated Universal Time (UTC) at an epicentral distance around 133 km SW of the city of Patras, Western Greece. Patras has a metropolitan area inhabited by a quarter of a million persons and fatal casualties have been probably avoided because, among others, at 10:23 p.m. UTC, almost half an hour before the strong EQ, a moderate EQ of magnitude M = 5.0 occurred approximately at the same area as the strong EQ [2] (see Figure 1).
Geoelectric field continuous monitoring is operating in Greece by the Solid Earth Physics Institute [4,5,6] at nine measuring field stations (see the blue circles in Figure 1) aiming at detecting Seismic Electric Signals (SES). SES are low frequency (≤1 Hz) variations of the electric field of the Earth that have been found to precede strong EQs in Greece [7,8,9,10,11], Japan [12,13,14], China [15,16,17,18], Mexico [19,20], and elsewhere [21]. They are emitted due to the cooperative orientation of the electric dipoles [5,22,23] (that exist anyhow due to defects [24,25] in the rocks) of the future focal area when the gradually increasing stress before the strong EQ reaches a critical value [10]. SES may appear either as single pulses or in the form of SES activities, i.e., many pulses within a relatively short time period ([9], e.g., see Figure 2). The lead time of single SES is less than or equal to 11 days, while, for SES activities, it varies from a few weeks up to 5 months [6,9]. SES are recorded [9,10] at sensitive points [26] on the Earth’s surface that have been selected after long experimentation in Greece during the 1980s and 1990s that led [27,28] to the construction of the so-called VAN telemetric network (from the acronym of the scientists Varotsos, Alexopoulos and Nomicos who pioneered this research) comprising the nine measuring field stations depicted in Figure 1. Each measuring station records SES from specific EQ prone areas which constitute the so-called selectivity map of the station [3,10,29]. The gray shaded area of Figure 1 depicts the selectivity map for the Pirgos (PIR) measuring station as it resulted after the recording of SES from various epicentral areas [30]. A basic criterion for distinguishing SES from noise is that the recorded signal should [9] exhibit properties compatible with the fact that it was emitted far away from the recording station. This is usually called [9] criterion (where stands for the potential difference between two electrodes that constitute a measuring electric dipole and L for the distance between them) and has been found [31,32,33,34] to be compatible with the aforementioned SES generation model if we take into account that EQs occur in faults (where resistivity is usually orders of magnitude smaller than that of the surrounding rocks, e.g., see [5] and references therein).
The SES research has been greatly advanced after the introduction of the concept of natural time in 2001 [35,36,37]. Firstly, the criticality properties of SES activities (like the existence of long-range correlations and unique entropic properties) has been revealed by natural time analysis and hence new possibilities have been provided for the identification of SES and their distinction from man-made noise [11,38,39,40,41,42,43]. Secondly, natural time analysis allowed the introduction of an order parameter for seismicity the study of which allows the determination of the occurrence time of the strong EQ within a few days up to one week [6,30,40,44,45,46,47]. Thirdly, minima of the fluctuations of the order parameter of seismicity have been identified before all shallow EQs with in Japan during the 27 year period from 1 January 1984 to 11 March 2011, the date of the M9.0 Tohoku EQ occurrence [48,49]. Finally, the interrelation of SES activities and seismicity has been further clarified because, when studying the EQ magnitude time series in Japan, it was found that the minimum of the fluctuations of the order parameter of seismicity, which is observed simultaneously with the initiation of an SES activity [50], appears when long range correlations prevail [51].
The scope of this paper is twofold. First, we report the geoelectrical field changes (SES) observed before the M6.8 EQ that occurred on 25 October 2018. Second, we present the natural time analysis of both the SES activity and the seismicity preceding this EQ. The paper is structured as follows: the background of natural time analysis is presented in the next section. In the subsequent section, we give the results obtained. A discussion follows in Section 4 and a summary of our results and the main conclusions are presented in the final section.
2. Natural Time Analysis Background
Natural time analysis, introduced in the beginning of the 2000s [35,36,37,38,39], uncovers unique dynamic features hidden behind the time series of complex systems. In a time series comprising N events, the natural time serves as an index for the occurrence of the k-th event. This index together with the energy released during the k-th event, i.e., the pair , is studied in natural time analysis. Alternatively, one studies the pair , where
stands for the normalized energy released during the k-th event. As is obvious from Equation (1), the correct estimation of simply demands that should be proportional to the energy emitted during the k-th event. Thus, for SES activities, is proportional to the duration of the k-th pulse while, for EQs, it is proportional to the energy emitted [52] during the k-th EQ of magnitude , i.e., (see also [6,53]). The variance of weighted for , labeled by , is given by [6,35,38,39,40]
For the case of seismicity, the quantity has been proposed to be an order parameter since changes abruptly when a mainshock (the new phase) occurs, and, in addition, the statistical properties of its fluctuations are similar to those in other non-equilibrium and equilibrium critical systems ([40], see also pp. 249–253 of Reference [6]). It has been also found that is a key parameter that enables recognition of the complex dynamical system under study entering the critical stage [6,35,36,37]. This occurs when becomes equal to 0.070 {([54], see also page 343 of Reference [6]). In Table 8.1 of Reference [6], one can find a compilation of 14 cases including a variety of dynamical models in which the condition = 0.070 has been ascertained (cf. this has been also later confirmed in the analyses of very recent experimental results in Japan by Hayakawa and coworkers [55,56,57]). Especially for the case of SES activities, it has been found that, when they are analyzed in natural time, we find values close to 0.070 ([35,36,38,39], e.g., see Table 4.6 on p. 227 of Reference [6]), i.e.,
when analyzing in natural time the small EQs with magnitudes greater than or equal to a threshold magnitude that occur after the initiation of an SES activity within the selectivity map of the measuring station that recorded the SES activity, the condition is found to hold for a variety of a few days up to one week before the strong EQ occurrence [6,30,40,41,44,45,46,47,54,58] . This is very important from a practical point of view because it enables the estimation of the occurrence time of a strong EQ with an accuracy of one week or so.
It is a dynamic entropy showing [60] positivity, concavity and Lesche [61,62] experimental stability. When are independent and identically-distributed random variables, S approaches [59] the value that corresponds to the case , which within the context of natural time is usually termed “uniform” distribution [6,39,53]. Notably, S changes its value to upon time-reversal, i.e., when the first event becomes last (), the second last but one (), etc.,
and hence it gives us the possibility to observe the (true) time-arrow [60]. Interestingly, it has been established [6,53] that both S and for SES activities are smaller than ,
On the other hand, these conditions are violated for a variety of similar looking electrical noises (e.g., see Table 4.6 on p. 228 of Reference [6]).
3. Results
3.1. Geoelectric Field Changes
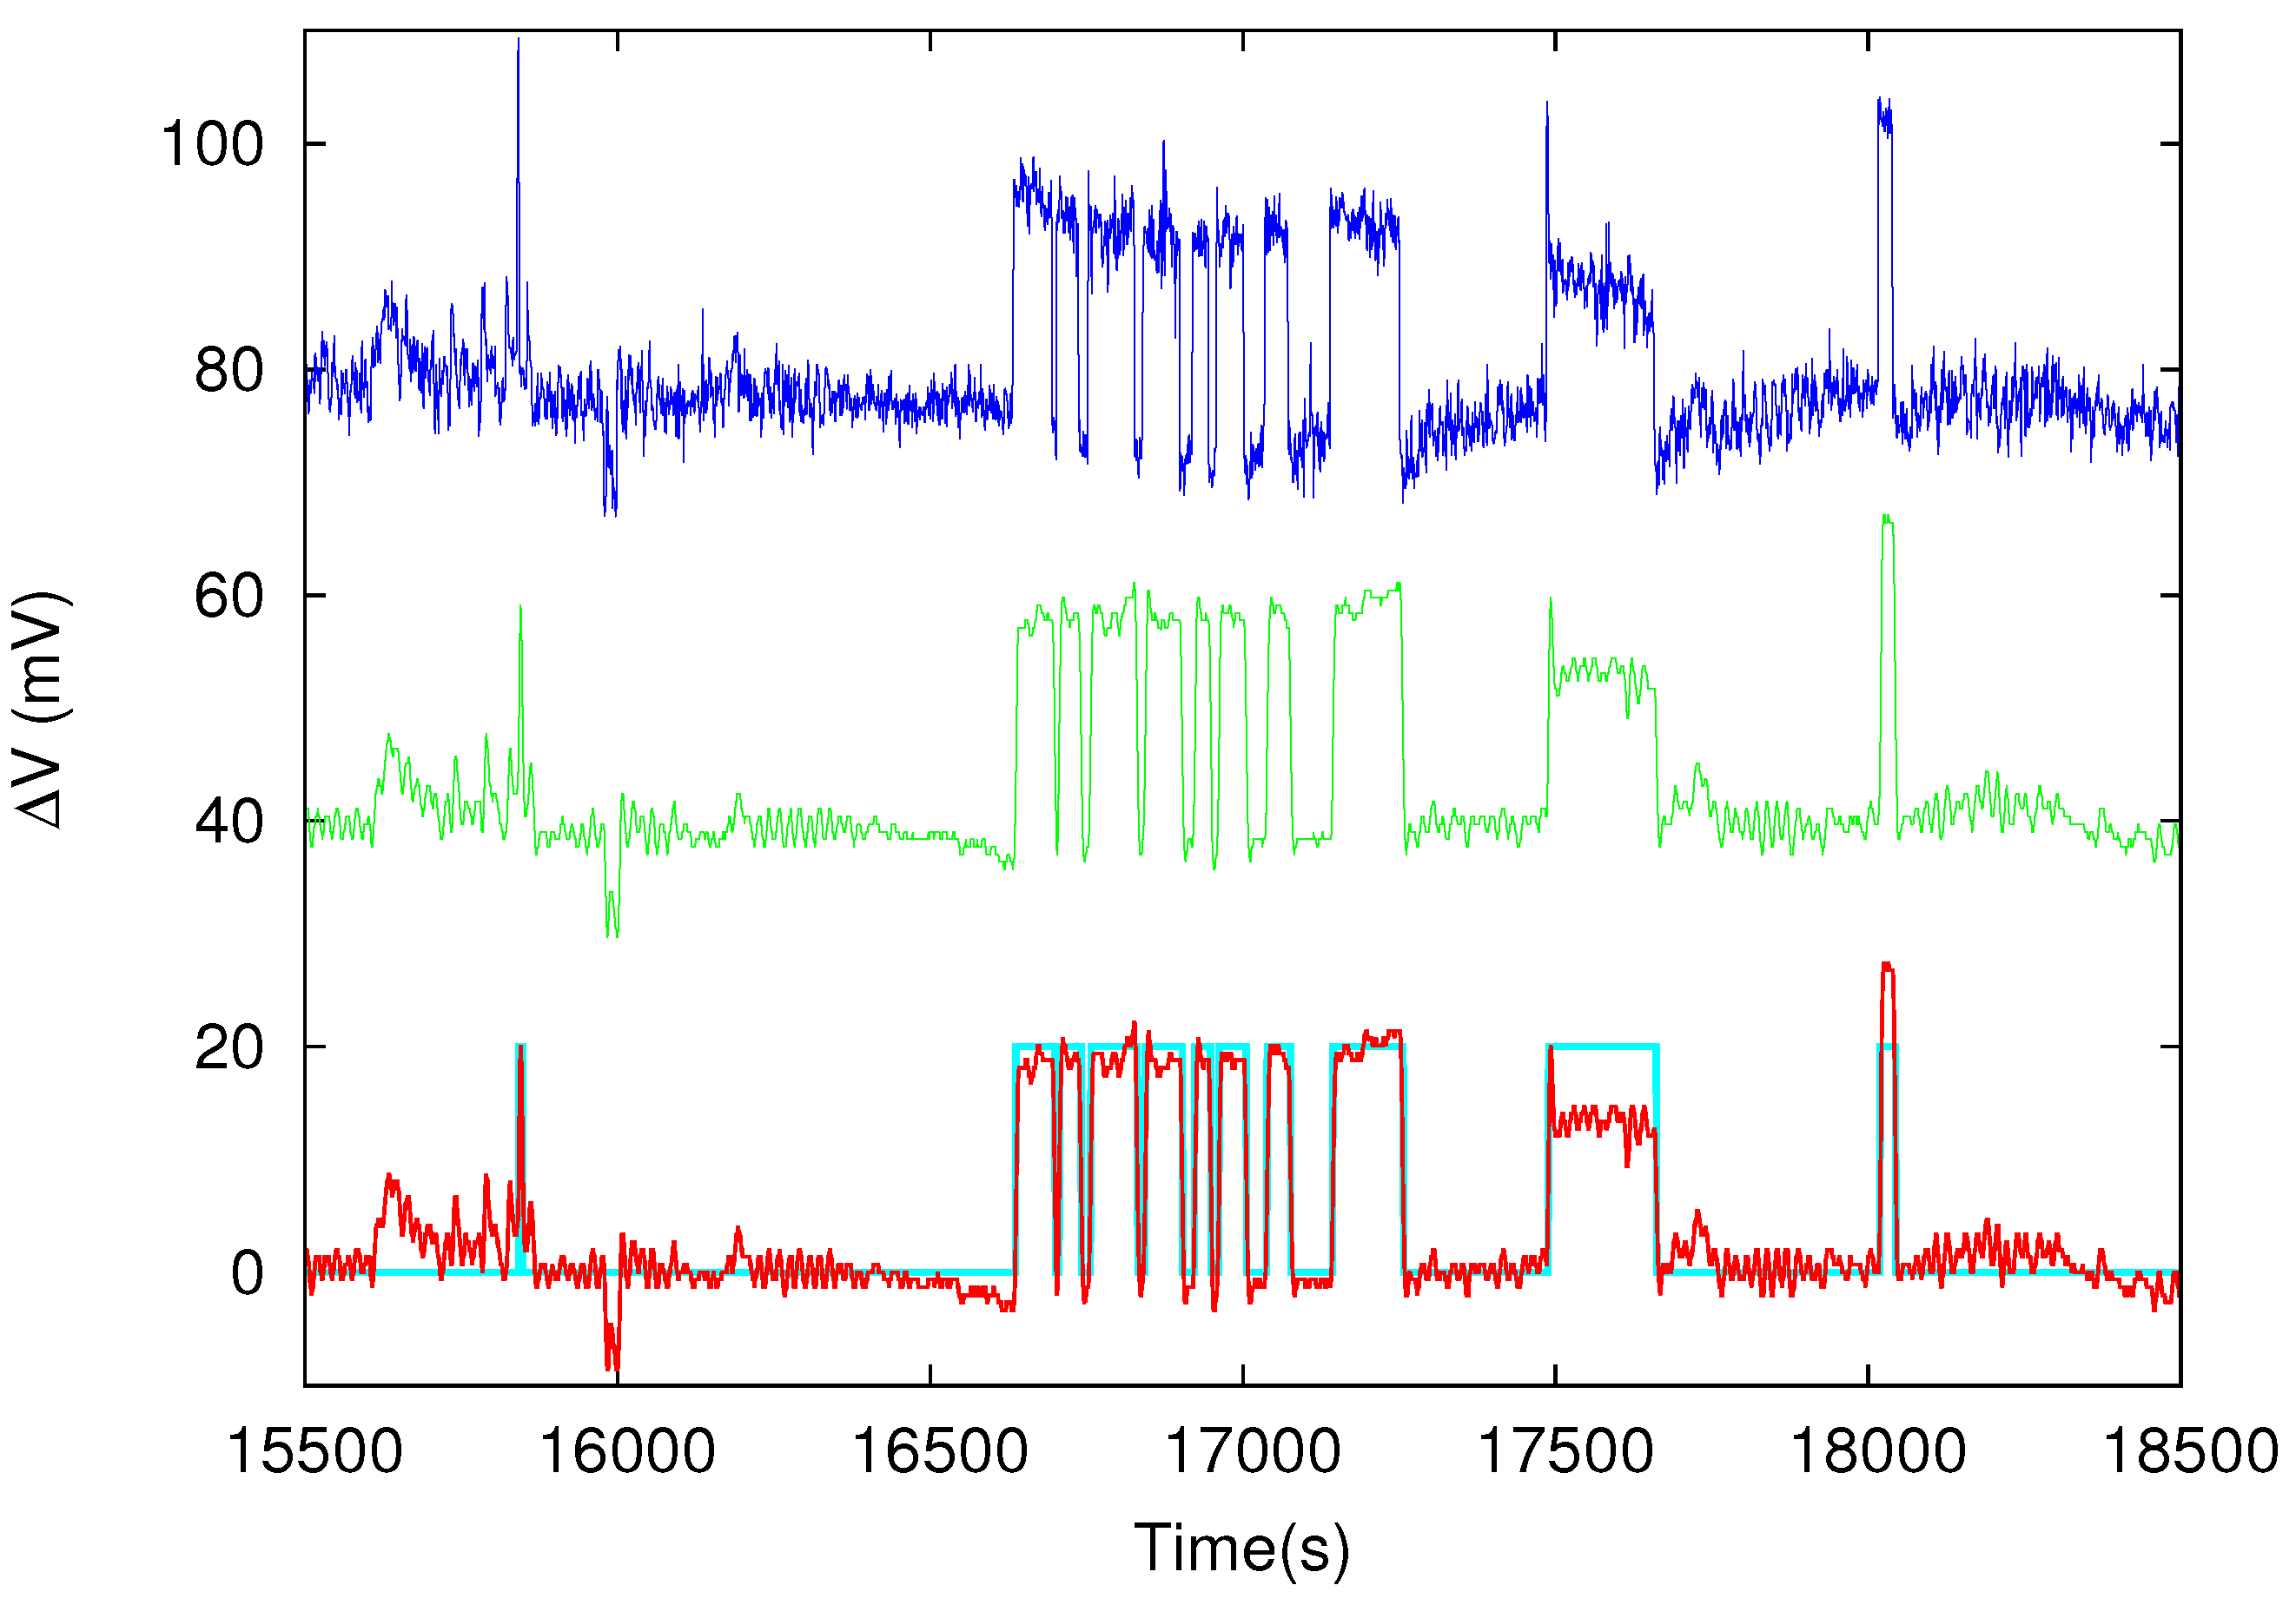
Figure 2 depicts an SES activity that was recorded in the PIR station (see Figure 1), which comprises a multitude of measuring dipoles, on 2 October 2018 between 04:20 a.m. and 05:05 a.m. UTC. The potential differences of three of these electric dipoles of comparable length L (a few km) deployed in the NEE direction are shown. The true headings of these dipoles are from top to bottom in Figure 2 are 75.48, 64.83, and 76.16 . An inspection of this figure reveals that the SES activity resembles a telegraph signal with periods of activity and periods of inactivity as it is usually the case [36,38,39]. If we impose a threshold in the variation [36,38,39], we can obtain the dichotomous (0–1) representation of the SES activity depicted by the cyan color in Figure 2.
3.2. Natural Time Analysis of Geoelectrical Signals. Criteria for Distinguishing SES
Apart from the aforementioned criterion suggested long ago for the distinction of SES from man-made noise [9], natural time analysis has provided, as mentioned, three additional criteria for the classification of an electric signal as SES activity. These criteria are Equation (3) and the conditions (6). The analysis in natural time of the dichotomous representation shown in Figure 2 results in , and , which are obviously compatible with the criteria for distinguishing SES from noise. This leads us to support that the anomalous variation of the electric field of the Earth observed on 2 October 2018 is indeed an SES activity.
3.3. Estimation of the Occurrence Time of the Impending EQ
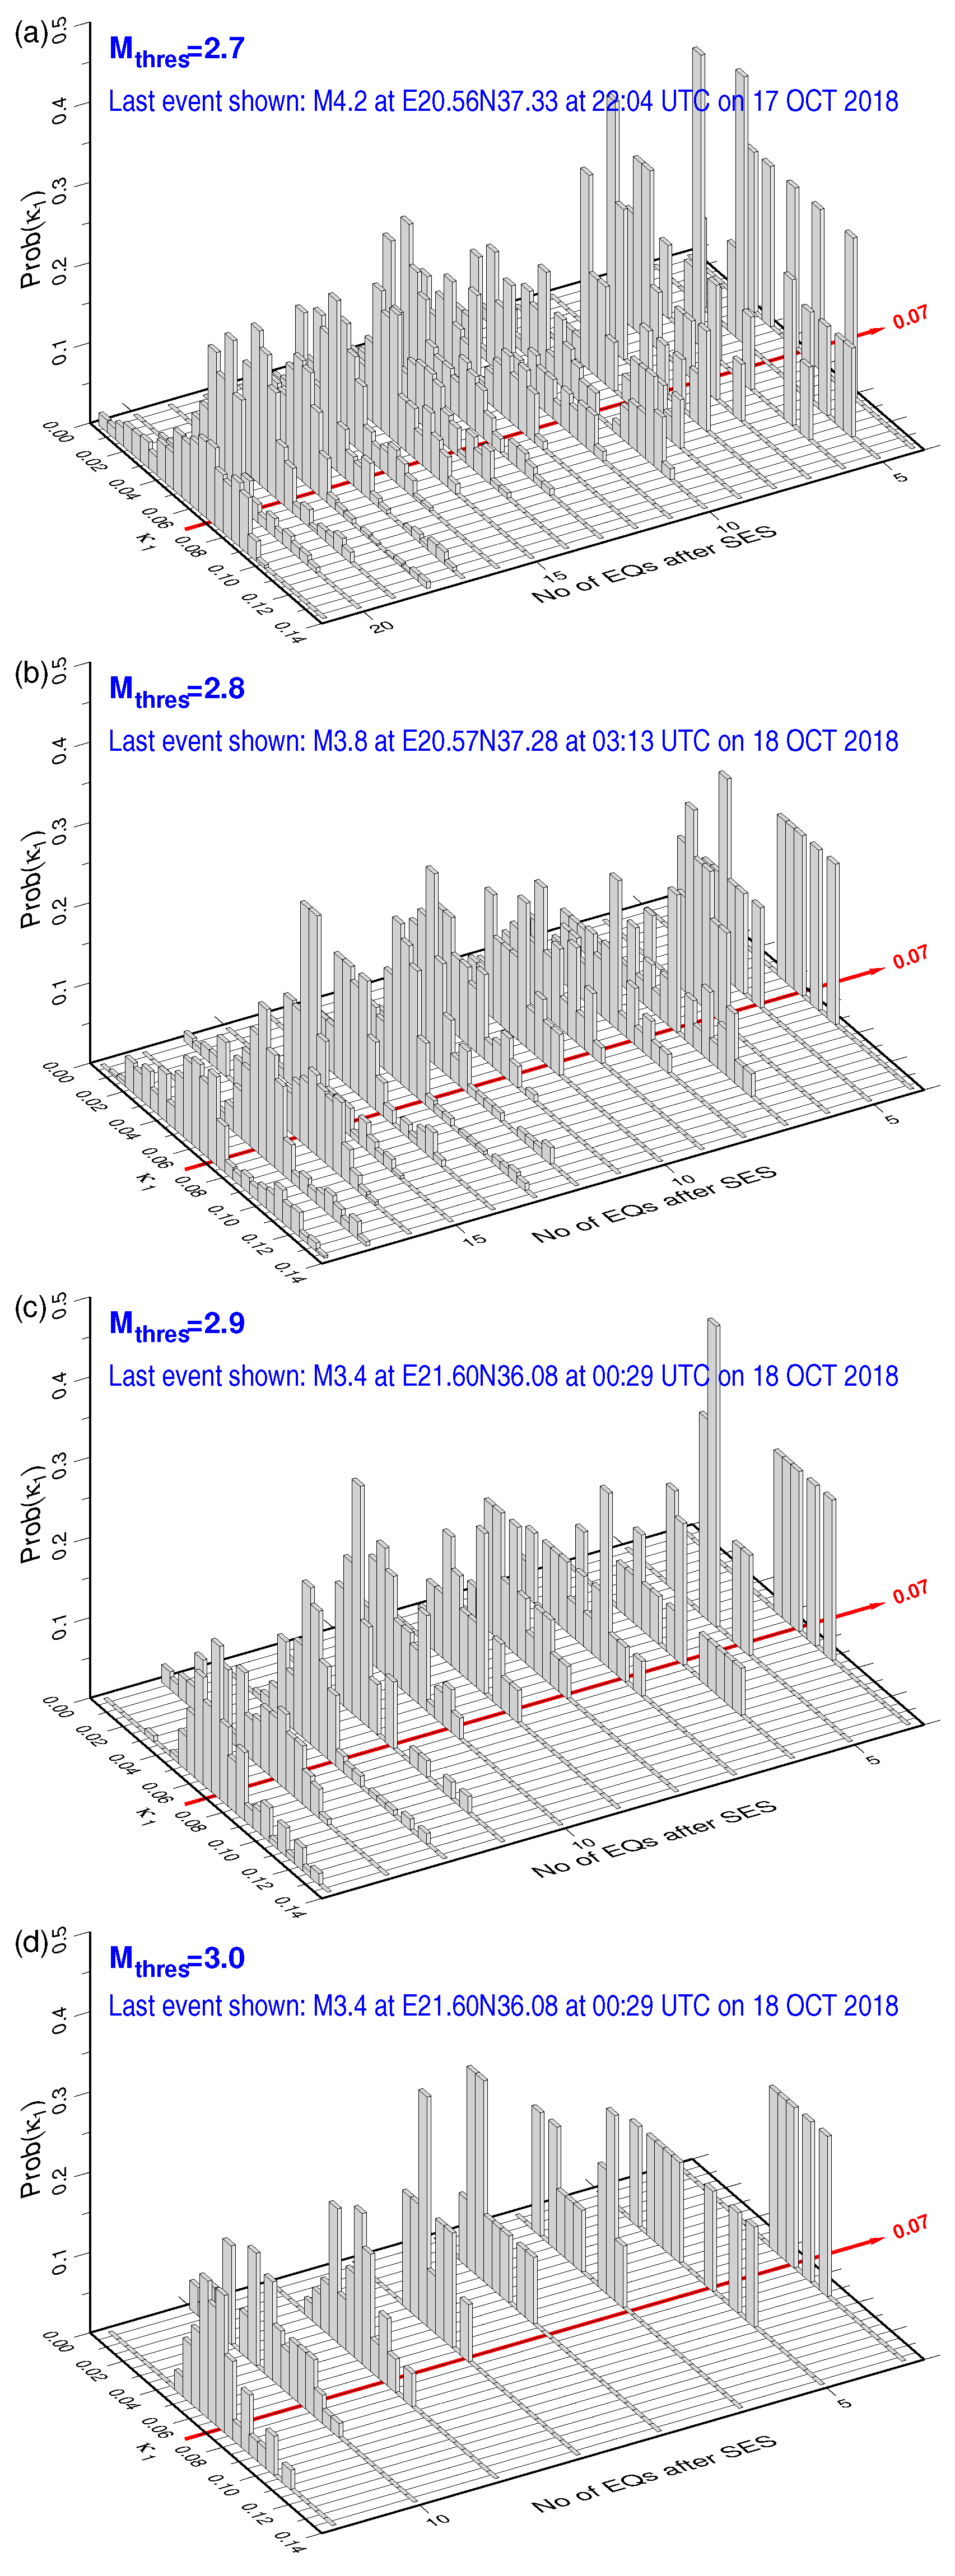
We now follow the method suggested in Reference [30] for the estimation of the occurrence time of the impending strong EQ by analyzing in natural time all the small EQs of magnitude greater than or equal to that occurred after the initiation of the SES activity recorded on 2 October 2018 within the selectivity map of PIR measuring station shown by the gray shaded area in Figure 1. The EQ catalog [67] of the Institute of Geodynamics of the National Observatory of Athens has been used and, each time a new small EQ takes place, we calculate the values corresponding to the events that occurred within all the possible subareas of the PIR selectivity map that include this EQ [30]. This procedure leads to an ensemble of values from which we can calculate the probability Prob() of to lie within . Figure 3a–d depict the histograms of Prob() obtained after the occurrence of each small EQ with magnitude greater than or equal to 2.7, 2.8, 2.9, and 3.0, respectively. We observe that, within a period of 5 h around 18 October 2018 00:30 a.m. UTC, all four of the distributions Prob() exhibit a maximum at . This behavior has been found, as already mentioned, to occur a few days up to one week or so before the strong EQ occurrence [6,30,45,46,47]. Actually, one week later, i.e., on 25 October 2018, a strong M6.8 EQ occurred [1] within the selectivity map of the PIR measuring station (see the red star in Figure 1). Interestingly, as it is written in the legends of the panels of Figure 3, two of the three small EQs that led to the fulfillment of the criticality condition originated from epicentral areas located only 20 or 25 km south that of the strong EQ.
3.4. Estimation of the Current Level of Risk by Applying EQ Nowcasting
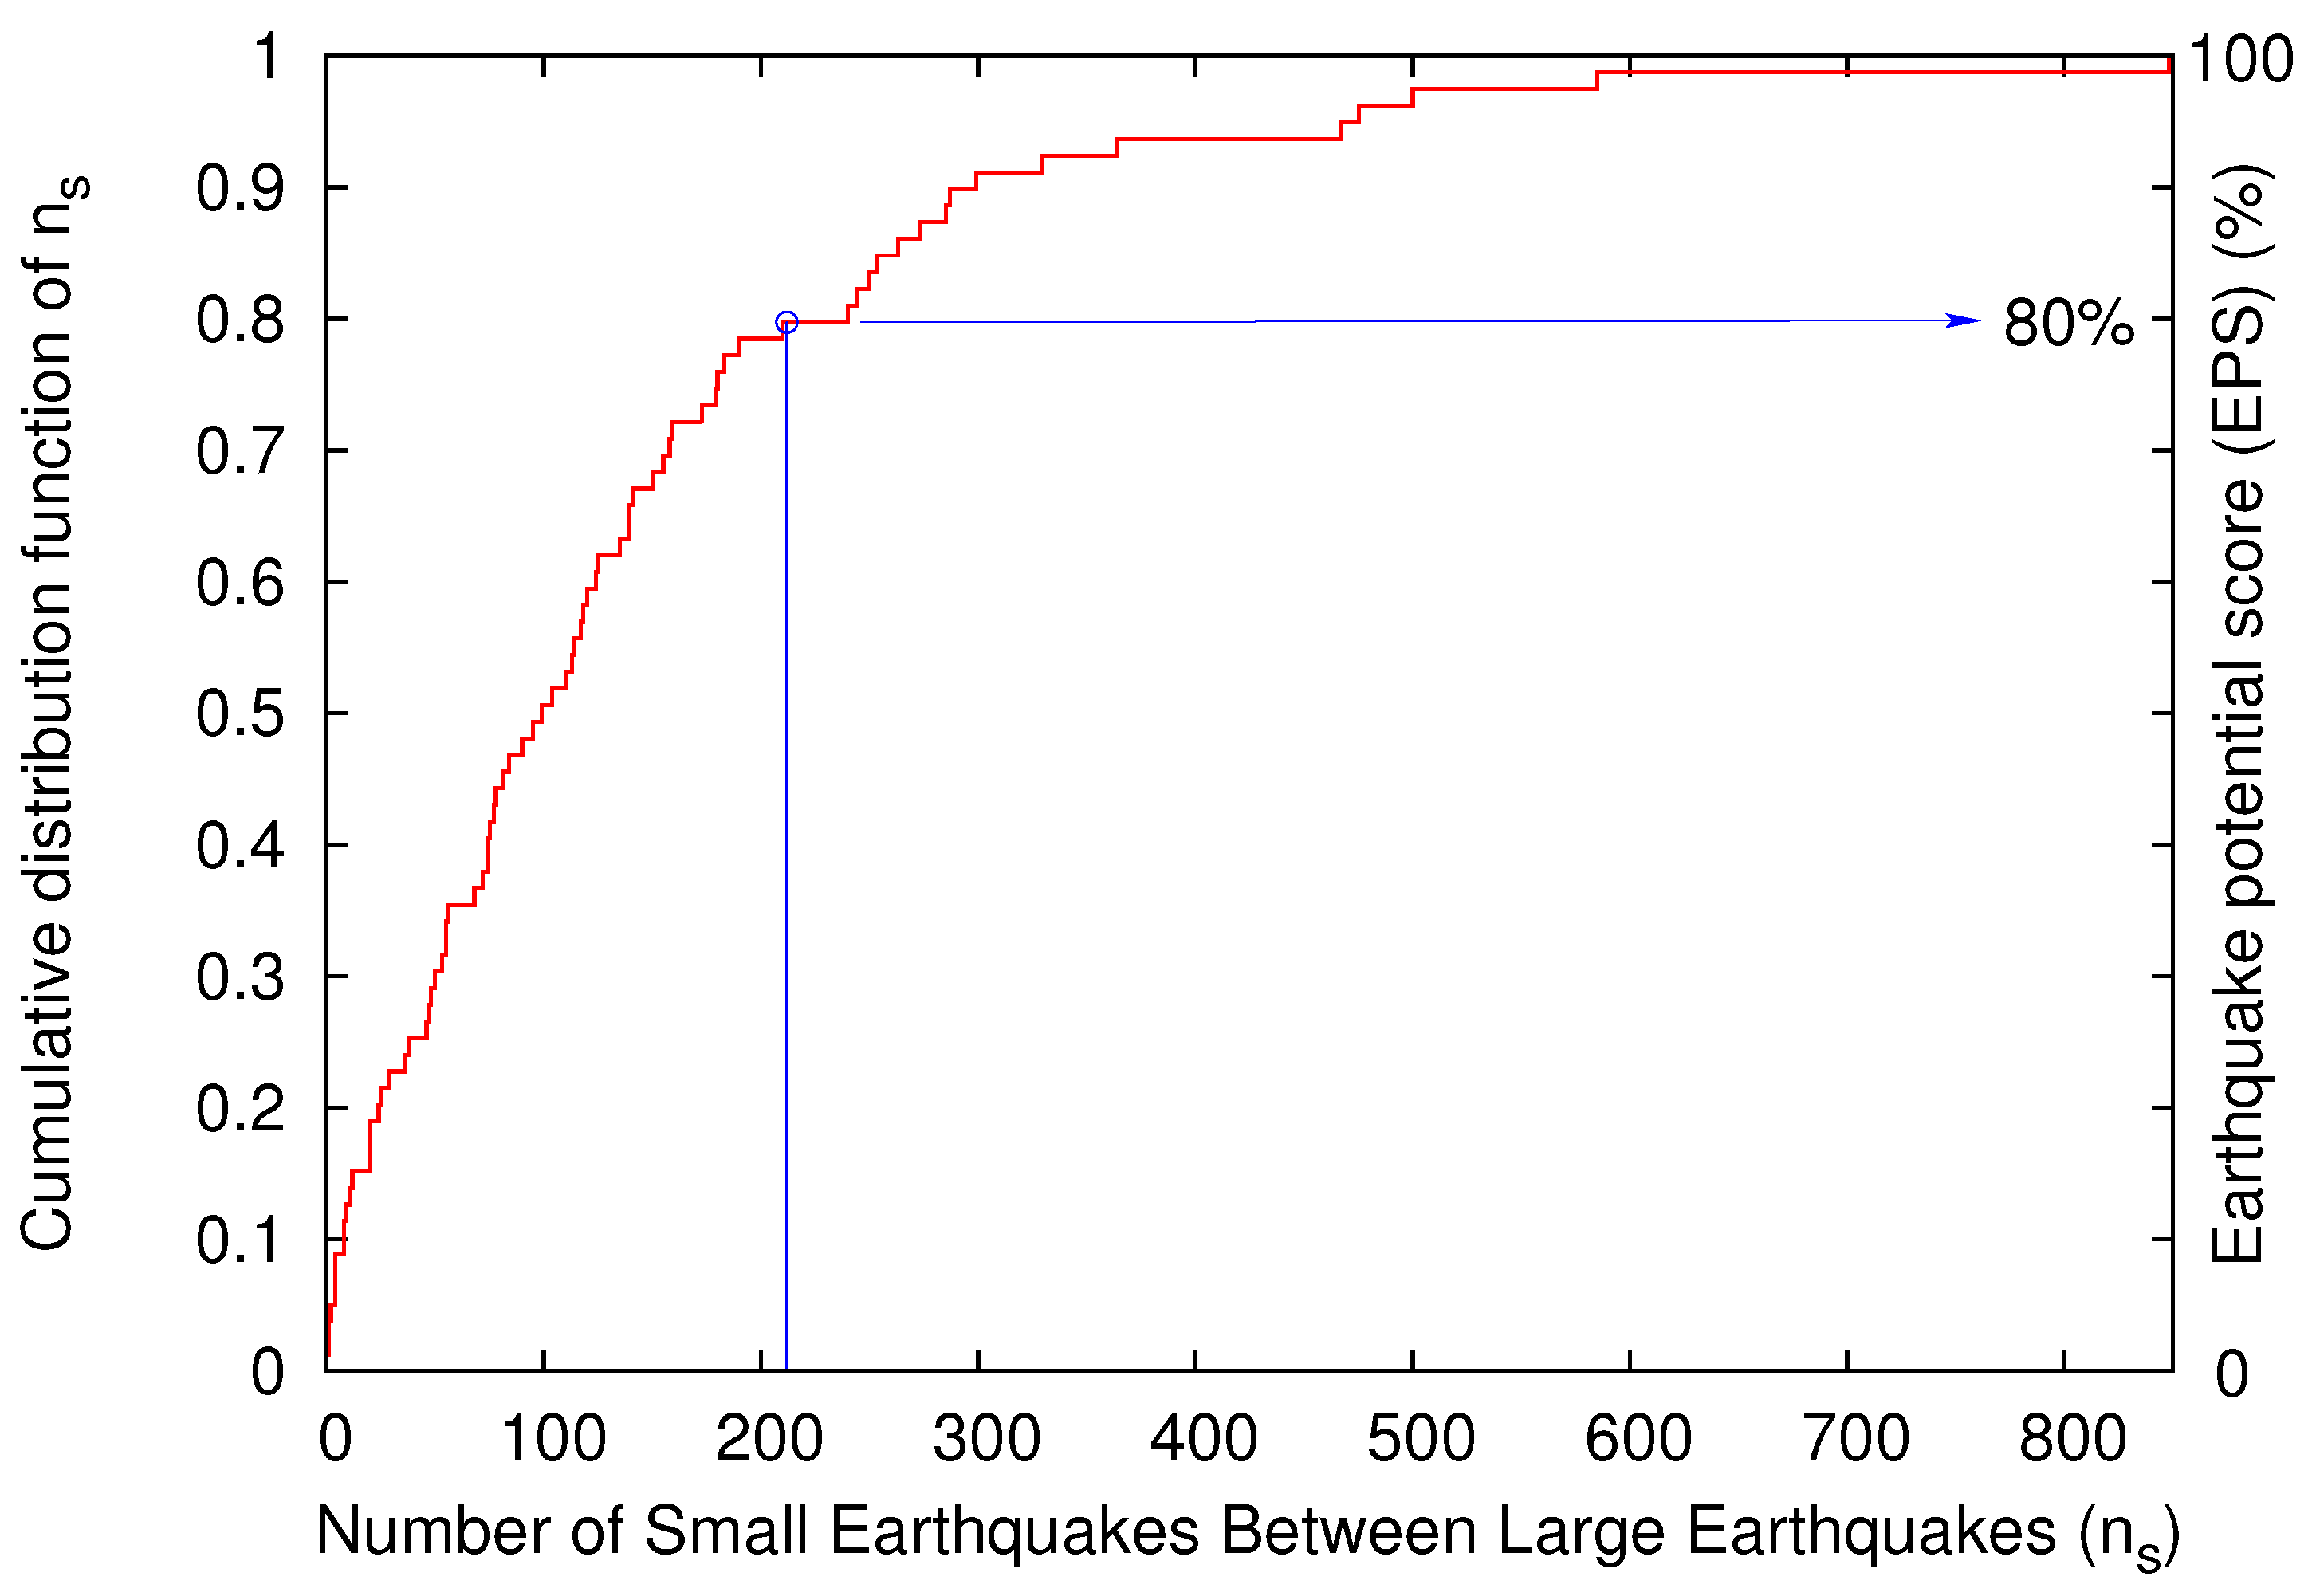
Nowcasting EQs is a recent method for the determination of the current state of a fault system and the estimation of the current progress in the EQ cycle [63]. It uses a global EQ catalog to calculate from “small” EQs the level of hazard for “large” EQs. This is achieved by employing the natural time concept and counting the number of “small” EQs that occur after a “strong” EQ. The current value of since the occurrence of the last “strong” EQ is compared with the cumulative distribution function (cdf) of obtained when ensuring that we have enough data to span at least 20 or more “large” EQ cycles. The EQ potential score (EPS) which equals the “current” cdf value, EPS = is therefore a unique measure of the current level of hazard and assigns a number between 0% and 100% to every region so defined. Nowcasting EQs has already found many useful applications [64,65,66] among which is the estimation of seismic risk to Global Megacities. For this application [64], the EQs with depths smaller than a certain value D within a larger area are studied in order to obtain the cdf . Then, the number of “small” EQs around a Megacity, e.g., EQs in a circular region of epicentral distances smaller than a radius R with hypocenters shallower than D, is counted since the occurrence of the last “strong” EQ in this region. Based on the ergodicity of EQs that has been proven [68,69,70] by using the metric published in References [71,72], Rundle et al. [64] suggested that the seismic risk around a Megacity can be estimated by using the EPS corresponding to the current estimated in the circular region. Especially in their Figure 2, they used the large area in order to estimate the EPS for EQs of magnitude greater than or equal to 6.5 at an area of radius R = 400 km around the capital of Athens in Greece. Figure 4 shows the results of a similar calculation based on the United States National EQ Information Center PDE catalog (the data of which are available from Reference [73]), which we performed focusing on the city of Patras, Greece, for EQs of magnitude greater than or equal to 6.0. Notably, before the occurrence of the M6.8 EQ on 25 October 2018, EPS was found to be as high as 80%.
4. Discussion
Recently, the statistical significance of the Earth’s electric and magnetic field variations preceding EQs has been studied [75] on the basis of the modern tools of event coincidence analysis [76,77,78] and receiver operating characteristics [79,80]. Using an SES dataset [9,10,81] from the 1980s, it was found that SES are statistically significant precursors to EQs for lead times in the following four distinct time periods: 3 to 9 days, 18 to 24 days, 43 to 47 days, and 58 to 62 days (the first one corresponds to single SES, while the latter to three SES activities [75]). Since the SES activity, shown in Figure 2, was recorded on 2 October 2018, the SES lead time for the present case of the M6.8 EQ on 25 October 2018, which is 23 days, falls favorably within the second time period of 18 to 24 days. Moreover, the analysis of the seismicity subsequent to the initiation of the SES activity in the selectivity area of the PIR station has led to the conclusion that the criticality condition has been satisfied early in the morning on 18 October 2018. This compares favorably with the time window of a few days up to one week already found from various SES activities in Greece, Japan and United States [6,30,45,46,47,58].
Let us now turn to the results concerning the entropy of the SES activity of Figure 2 in natural time. As it was reported, both S and are well below in accordance with the findings (e.g., see Reference [53]) so far for SES activities. Based on the critical properties that characterize the emission of signals that precede rupture (i.e., infinite range correlations compatible with a detrended fluctuation analysis (DFA) [82,83,84] exponent ), a fractional Brownian motion [85,86] model has been suggested [41] according to which both S and values should scatter around 0.079 with a standard deviation of 0.011 (see Figure 4 of Reference [41]). Interestingly, the values and of the SES activity recorded on 2 October 2018 are fully compatible with this model.
Finally, the successful results (i.e., the 80% EPS found before the occurrence of the M6.8 EQ on 25 October 2018) from the EQ nowcasting method, which is based on natural time, are very promising. Nowcasting does not involve any model and there are no free parameters to be fit to the data [63].
5. Conclusions
The strong EQ of magnitude M6.8 that occurred in Western Greece on 25 October 2018 was preceded by an SES activity on 2 October 2018 recorded at the PIR measuring station of the VAN telemetric network. The EQ epicenter was located within the selectivity map of PIR depicted by the gray shaded area in Figure 1.
The lead time of 23 days between the precursory SES activity and the strong EQ is statistically significant as recently found by the recent methods of event coincidence analysis and receiver operating characteristics. Both the entropy S and the entropy under time reversal in natural time are compatible with previous observation for SES activities as well as agree with a model for SES activities based on fractional Brownian motion. The analysis in natural time of the seismicity subsequent to the SES activity by considering the events occurring within the selectivity area of PIR shows that criticality has been reached early in the morning on 18 October 2018, almost a week before the strong EQ occurrence, in accordance with the earlier findings. Finally, EQ nowcasting has revealed an 80% EPS. In general, here we showed that the strong EQ under discussion provides an excellent validation of the methods developed so far in natural time for EQ prediction.
Author Contributions
Conceptualization, N.V.S. and E.S.S.; Methodology, N.V.S. and E.S.S.; Software, N.V.S. and E.S.S.; Validation, E.S.S.; Formal Analysis, N.V.S. and E.S.S.; Investigation, N.V.S. and E.S.S.; Resources, E.S.S.; Data Curation, N.V.S.; Writing—Original Draft Preparation, N.V.S.; Writing—Review & Editing, N.V.S. and E.S.S.
Funding
This research received no external funding.
Conflicts of Interest
The authors declare no conflict of interest.
References
- United States Geological Survey, Earthquake Hazards Program. M6.8-33km SW of Mouzaki, Greece. Available online: https://earthquake.usgs.gov/earthquakes/eventpage/us1000hhb1/technical (accessed on 5 November 2018).
- United States Geological Survey, Earthquake Hazards Program. M5.0-30km SSW of Lithakia, Greece. Available online: https://earthquake.usgs.gov/earthquakes/eventpage/us1000hhay/technical (accessed on 5 November 2018).
- Uyeda, S.; Al-Damegh, E.; Dologlou, E.; Nagao, T. Some relationship between VAN seismic electric signals (SES) and earthquake parameters. Tectonophysics 1999, 304, 41–55. [Google Scholar] [CrossRef]
- Varotsos, P.; Eftaxias, K.; Lazaridou, M.; Nomicos, K.; Sarlis, N.; Bogris, N.; Makris, J.; Antonopoulos, G.; Kopanas, J. Recent earthquake prediction results in Greece based on the observation of Seismic Electric Signals. Acta Geophys. Pol. 1996, 44, 301–327. [Google Scholar]
- Varotsos, P. The Physics of Seismic Electric Signals; TERRAPUB: Tokyo, Japan, 2005. [Google Scholar]
- Varotsos, P.A.; Sarlis, N.V.; Skordas, E.S. Natural Time Analysis: The New View of Time. Precursory Seismic Electric Signals, Earthquakes and Other Complex Time-Series; Springer: Berlin/Heidelberg, Germany, 2011. [Google Scholar]
- Varotsos, P.; Alexopoulos, K. Physical Properties of the variations of the electric field of the earth preceding earthquakes, I. Tectonophysics 1984, 110, 73–98. [Google Scholar] [CrossRef]
- Varotsos, P.; Alexopoulos, K. Physical Properties of the variations of the electric field of the earth preceding earthquakes, II. Tectonophysics 1984, 110, 99–125. [Google Scholar] [CrossRef]
- Varotsos, P.; Lazaridou, M. Latest aspects of earthquake prediction in Greece based on Seismic Electric Signals. Tectonophysics 1991, 188, 321–347. [Google Scholar] [CrossRef]
- Varotsos, P.; Alexopoulos, K.; Lazaridou, M. Latest aspects of earthquake prediction in Greece based on Seismic Electric Signals, II. Tectonophysics 1993, 224, 1–37. [Google Scholar] [CrossRef]
- Varotsos, P.A.; Sarlis, N.V.; Skordas, E.S.; Lazaridou, M.S. Fluctuations, under time reversal, of the natural time and the entropy distinguish similar looking electric signals of different dynamics. J. Appl. Phys. 2008, 103, 014906. [Google Scholar] [CrossRef] [Green Version]
- Uyeda, S.; Nagao, T.; Orihara, Y.; Yamaguchi, T.; Takahashi, I. Geoelectric potential changes: Possible precursors to earthquakes in Japan. Proc. Natl. Acad. Sci. USA 2000, 97, 4561–4566. [Google Scholar] [CrossRef] [PubMed] [Green Version]
- Uyeda, S.; Hayakawa, M.; Nagao, T.; Molchanov, O.; Hattori, K.; Orihara, Y.; Gotoh, K.; Akinaga, Y.; Tanaka, H. Electric and magnetic phenomena observed before the volcano-seismic activity in 2000 in the Izu Island Region, Japan. Proc. Natl. Acad. Sci. USA 2002, 99, 7352–7355. [Google Scholar] [CrossRef] [PubMed] [Green Version]
- Orihara, Y.; Kamogawa, M.; Nagao, T.; Uyeda, S. Preseismic anomalous telluric current signals observed in Kozu-shima Island, Japan. Proc. Natl. Acad. Sci. USA 2012, 109, 19125–19128. [Google Scholar] [CrossRef] [PubMed] [Green Version]
- Zlotnicki, J.; Kossobokov, V.; Le Mouël, J.L. Frequency spectral properties of an ULF electromagnetic signal around the 21 July 1995, M = 5.7, Yong Deng (China) earthquake. Tectonophysics 2001, 334, 259–270. [Google Scholar] [CrossRef]
- Huang, Q. Retrospective investigation of geophysical data possibly associated with the Ms8.0 Wenchuan earthquake in Sichuan, China. J. Asian Earth Sci. 2011, 41, 421–427. [Google Scholar] [CrossRef]
- Gao, S.D.; Tang, J.; Du, X.B.; Liu, X.F.; Su, Y.G.; Chen, Y.P.; Di, G.R.; Mei, D.L.; Zhan, Y.; Wang, L.F. The change characteristics of electromagnetic field before to after Wenchuan Ms8.0 earthquake. Chin. J. Geophys. 2010, 53, 512–525. [Google Scholar]
- Fan, Y.Y.; Du, X.B.; Zlotnicki, J.; Tan, D.C.; An, Z.H.; Chen, J.Y.; Zheng, G.L.; Liu, J.; Xie, T. The Electromagnetic Phenomena Before the Ms8.0 Wenchuan Earthquake. Chin. J. Geophys. 2010, 53, 997–1010. [Google Scholar] [CrossRef]
- Ramírez-Rojas, A.; Flores-Márquez, E.L.; Guzmán-Vargas, L.; Gálvez-Coyt, G.; Telesca, L.; Angulo-Brown, F. Statistical features of seismoelectric signals prior to M7.4 Guerrero-Oaxaca earthquake (México). Nat. Hazards Earth Syst. Sci. 2008, 8, 1001–1007. [Google Scholar] [CrossRef] [Green Version]
- Ramírez-Rojas, A.; Telesca, L.; Angulo-Brown, F. Entropy of geoelectrical time series in the natural time domain. Nat. Hazards Earth Syst. Sci. 2011, 11, 219–225. [Google Scholar] [CrossRef] [Green Version]
- Sarlis, N.V.; Varotsos, P.A.; Skordas, E.S.; Zlotnicki, J.; Nagao, T.; Rybin, A.; Lazaridou-Varotsos, M.S.; Papadopoulou, K. Seismic electric signals in seismic prone areas. Earthq. Sci. 2018, 31, 44–51. [Google Scholar] [CrossRef]
- Varotsos, P.; Alexopoulos, K. Thermodynamics of Point Defects and Their Relation with Bulk Properties; North Holland: Amsterdam, The Netherlands, 1986. [Google Scholar]
- Varotsos, P.; Miliotis, D. New aspects on the dielectric properties of the alkali halides with divalent impurities. J. Phys. Chem. Solids 1974, 35, 927–930. [Google Scholar] [CrossRef]
- Lazaridou, M.; Varotsos, C.; Alexopoulos, K.; Varotsos, P. Point-defect parameters of LiF. J. Phys. C Solid State 1985, 18, 3891. [Google Scholar] [CrossRef]
- Varotsos, P. Point defect parameters in β-PbF2 revisited. Solid State Ion. 2008, 179, 438–441. [Google Scholar] [CrossRef]
- Varotsos, P.; Alexopoulos, K. Physical properties of the variations in the electric field of the earth preceding earthquakes, III. Tectonophysics 1987, 136, 335–339. [Google Scholar] [CrossRef]
- Varotsos, P.; Lazaridou, M.; Eftaxias, K.; Antonopoulos, G.; Makris, J.; Kopanas, J. Short term earthquake prediction in Greece by Seismic Electric Signals. In The Critical Review of VAN: Earthquake Prediction from Seismic Electric Signals; Lighthill, S.J., Ed.; World Scientific: Singapore, 1996; pp. 29–76. [Google Scholar]
- Lazaridou-Varotsos, M.S. Earthquake Prediction by Seismic Electric Signals: The Success of the VAN Method over Thirty Years; Springer Praxis Books: Berlin/Heidelberg, Germany, 2013. [Google Scholar]
- Uyeda, S. Introduction to the VAN method of earthquake prediction. In The Critical Review of VAN: Earthquake Prediction from Seismic Electric Signals; Lighthill, S.J., Ed.; World Scientific: Singapore, 1996; Volume 16, pp. 3–28. [Google Scholar]
- Sarlis, N.V.; Skordas, E.S.; Lazaridou, M.S.; Varotsos, P.A. Investigation of seismicity after the initiation of a Seismic Electric Signal activity until the main shock. Proc. Jpn. Acad. Ser. B Phys. Biol. Sci. 2008, 84, 331–343. [Google Scholar] [CrossRef] [PubMed] [Green Version]
- Varotsos, P.; Sarlis, N.; Lazaridou, M.; Kapiris, P. Transmission of stress induced electric signals in dielectric media. J. Appl. Phys. 1998, 83, 60–70. [Google Scholar] [CrossRef]
- Sarlis, N.; Lazaridou, M.; Kapiris, P.; Varotsos, P. Numerical Model of the Selectivity Effect and ΔV/L criterion. Geophys. Res. Lett. 1999, 26, 3245–3248. [Google Scholar] [CrossRef]
- Varotsos, P.; Sarlis, N.; Lazaridou, M. Transmission of stress induced electric signals in dielectric media. Part II. Acta Geophys. Pol. 2000, 48, 141–177. [Google Scholar]
- Varotsos, P.; Sarlis, N.; Skordas, E. Transmission of stress induced electric signals in dielectric media. Part III. Acta Geophys. Pol. 2000, 48, 263–297. [Google Scholar]
- Varotsos, P.A.; Sarlis, N.V.; Skordas, E.S. Spatio-Temporal complexity aspects on the interrelation between Seismic Electric Signals and Seismicity. Pract. Athens Acad. 2001, 76, 294–321. Available online: http://physlab.phys.uoa.gr/org/pdf/p3.pdf (accessed on 5 November 2018).
- Varotsos, P.A.; Sarlis, N.V.; Skordas, E.S. Long-range correlations in the electric signals that precede rupture. Phys. Rev. E 2002, 66, 011902. [Google Scholar] [CrossRef] [PubMed]
- Varotsos, P.A.; Sarlis, N.V.; Skordas, E.S. Seismic Electric Signals and Seismicity: On a tentative interrelation between their spectral content. Acta Geophys. Pol. 2002, 50, 337–354. [Google Scholar]
- Varotsos, P.A.; Sarlis, N.V.; Skordas, E.S. Long-range correlations in the electric signals the precede rupture: Further investigations. Phys. Rev. E 2003, 67, 021109. [Google Scholar] [CrossRef] [PubMed]
- Varotsos, P.A.; Sarlis, N.V.; Skordas, E.S. Attempt to distinguish electric signals of a dichotomous nature. Phys. Rev. E 2003, 68, 031106. [Google Scholar] [CrossRef] [PubMed]
- Varotsos, P.A.; Sarlis, N.V.; Tanaka, H.K.; Skordas, E.S. Similarity of fluctuations in correlated systems: The case of seismicity. Phys. Rev. E 2005, 72, 041103. [Google Scholar] [CrossRef] [PubMed]
- Varotsos, P.A.; Sarlis, N.V.; Skordas, E.S.; Tanaka, H.K.; Lazaridou, M.S. Entropy of seismic electric signals: Analysis in the natural time under time reversal. Phys. Rev. E 2006, 73, 031114. [Google Scholar] [CrossRef] [PubMed]
- Varotsos, P.A.; Sarlis, N.V.; Skordas, E.S.; Tanaka, H.K.; Lazaridou, M.S. Attempt to distinguish long-range temporal correlations from the statistics of the increments by natural time analysis. Phys. Rev. E 2006, 74, 021123. [Google Scholar] [CrossRef] [PubMed]
- Varotsos, P.A.; Sarlis, N.V.; Skordas, E.S. Detrended fluctuation analysis of the magnetic and electric field variations that precede rupture. Chaos 2009, 19, 023114. [Google Scholar] [CrossRef] [PubMed] [Green Version]
- Varotsos, P.A.; Sarlis, N.V.; Skordas, E.S.; Lazaridou, M.S. Identifying sudden cardiac death risk and specifying its occurrence time by analyzing electrocardiograms in natural time. Appl. Phys. Lett. 2007, 91, 064106. [Google Scholar] [CrossRef]
- Varotsos, P.A.; Sarlis, N.V.; Skordas, E.S.; Uyeda, S.; Kamogawa, M. Natural time analysis of critical phenomena. The case of Seismicity. EPL 2010, 92, 29002. [Google Scholar] [CrossRef]
- Varotsos, P.A.; Sarlis, N.V.; Skordas, E.S.; Christopoulos, S.R.G.; Lazaridou-Varotsos, M.S. Identifying the occurrence time of an impending mainshock: A very recent case. Earthq. Sci. 2015, 28, 215–222. [Google Scholar] [CrossRef]
- Varotsos, P.A.; Sarlis, N.V.; Skordas, E.S. Identifying the occurrence time of an impending major earthquake: A review. Earthq. Sci. 2017, 30, 209–218. [Google Scholar] [CrossRef]
- Sarlis, N.V.; Skordas, E.S.; Varotsos, P.A.; Nagao, T.; Kamogawa, M.; Tanaka, H.; Uyeda, S. Minimum of the order parameter fluctuations of seismicity before major earthquakes in Japan. Proc. Natl. Acad. Sci. USA 2013, 110, 13734–13738. [Google Scholar] [CrossRef] [PubMed] [Green Version]
- Sarlis, N.V.; Skordas, E.S.; Varotsos, P.A.; Nagao, T.; Kamogawa, M.; Uyeda, S. Spatiotemporal variations of seismicity before major earthquakes in the Japanese area and their relation with the epicentral locations. Proc. Natl. Acad. Sci. USA 2015, 112, 986–989. [Google Scholar] [CrossRef] [PubMed]
- Varotsos, P.A.; Sarlis, N.V.; Skordas, E.S.; Lazaridou, M.S. Seismic Electric Signals: An additional fact showing their physical interconnection with seismicity. Tectonophysics 2013, 589, 116–125. [Google Scholar] [CrossRef]
- Varotsos, P.A.; Sarlis, N.V.; Skordas, E.S. Study of the temporal correlations in the magnitude time series before major earthquakes in Japan. J. Geophys. Res. Space Phys. 2014, 119, 9192–9206. [Google Scholar] [CrossRef] [Green Version]
- Kanamori, H. Quantification of Earthquakes. Nature 1978, 271, 411–414. [Google Scholar] [CrossRef]
- Sarlis, N.V. Entropy in Natural Time and the Associated Complexity Measures. Entropy 2017, 19, 177. [Google Scholar] [CrossRef]
- Varotsos, P.; Sarlis, N.V.; Skordas, E.S.; Uyeda, S.; Kamogawa, M. Natural time analysis of critical phenomena. Proc. Natl. Acad. Sci. USA 2011, 108, 11361–11364. [Google Scholar] [CrossRef] [PubMed] [Green Version]
- Hayakawa, M.; Schekotov, A.; Potirakis, S.; Eftaxias, K. Criticality features in ULF magnetic fields prior to the 2011 Tohoku earthquake. Proc. Jpn Acad. Ser. B Phys. Biol. Sci. 2015, 91, 25–30. [Google Scholar] [CrossRef] [PubMed] [Green Version]
- Potirakis, S.M.; Asano, T.; Hayakawa, M. Criticality Analysis of the Lower Ionosphere Perturbations Prior to the 2016 Kumamoto (Japan) Earthquakes as Based on VLF Electromagnetic Wave Propagation Data Observed at Multiple Stations. Entropy 2018, 20, 199. [Google Scholar] [CrossRef]
- Potirakis, S.M.; Schekotov, A.; Asano, T.; Hayakawa, M. Natural time analysis on the ultra-low frequency magnetic field variations prior to the 2016 Kumamoto (Japan) earthquakes. J. Asian Earth Sci. 2018, 154, 419–427. [Google Scholar] [CrossRef]
- Uyeda, S.; Kamogawa, M.; Tanaka, H. Analysis of electrical activity and seismicity in the natural time domain for the volcanic-seismic swarm activity in 2000 in the Izu Island region, Japan. J. Geophys. Res. 2009, 114. [Google Scholar] [CrossRef] [Green Version]
- Varotsos, P.A.; Sarlis, N.V.; Skordas, E.S.; Lazaridou, M.S. Entropy in Natural Time Domain. Phys. Rev. E 2004, 70, 011106. [Google Scholar] [CrossRef] [PubMed]
- Varotsos, P.A.; Sarlis, N.V.; Tanaka, H.K.; Skordas, E.S. Some properties of the entropy in the natural time. Phys. Rev. E 2005, 71, 032102. [Google Scholar] [CrossRef] [PubMed]
- Lesche, B. Instabilities of Renyi entropies. J. Stat. Phys. 1982, 27, 419–422. [Google Scholar] [CrossRef]
- Lesche, B. Renyi entropies and observables. Phys. Rev. E 2004, 70, 017102. [Google Scholar] [CrossRef] [PubMed]
- Rundle, J.B.; Turcotte, D.L.; Donnellan, A.; Grant Ludwig, L.; Luginbuhl, M.; Gong, G. Nowcasting earthquakes. Earth Space Sci. 2016, 3, 480–486. [Google Scholar] [CrossRef] [Green Version]
- Rundle, J.B.; Luginbuhl, M.; Giguere, A.; Turcotte, D.L. Natural Time, Nowcasting and the Physics of Earthquakes: Estimation of Seismic Risk to Global Megacities. Pure Appl. Geophys. 2018, 175, 647–660. [Google Scholar] [CrossRef]
- Luginbuhl, M.; Rundle, J.B.; Hawkins, A.; Turcotte, D.L. Nowcasting Earthquakes: A Comparison of Induced Earthquakes in Oklahoma and at the Geysers, California. Pure Appl. Geophys. 2018, 175, 49–65. [Google Scholar] [CrossRef]
- Luginbuhl, M.; Rundle, J.B.; Turcotte, D.L. Natural Time and Nowcasting Earthquakes: Are Large Global Earthquakes Temporally Clustered? Pure Appl. Geophys. 2018, 175, 661–670. [Google Scholar] [CrossRef]
- National Observatory of Athens, Institute of Geodynamics. Recent Earthquakes. Available online: http://www.gein.noa.gr/en/seismicity/recent-earthquakes (accessed on 30 October 2018).
- Ferguson, C.D.; Klein, W.; Rundle, J.B. Spinodals, scaling, and ergodicity in a threshold model with long-range stress transfer. Phys. Rev. E 1999, 60, 1359–1373. [Google Scholar] [CrossRef]
- Tiampo, K.F.; Rundle, J.B.; Klein, W.; Martins, J.S.S.; Ferguson, C.D. Ergodic Dynamics in a Natural Threshold System. Phys. Rev. Lett. 2003, 91, 238501. [Google Scholar] [CrossRef] [PubMed]
- Tiampo, K.F.; Rundle, J.B.; Klein, W.; Holliday, J.; Sá Martins, J.S.; Ferguson, C.D. Ergodicity in natural earthquake fault networks. Phys. Rev. E 2007, 75, 066107. [Google Scholar] [CrossRef] [PubMed]
- Thirumalai, D.; Mountain, R.D.; Kirkpatrick, T.R. Ergodic behavior in supercooled liquids and in glasses. Phys. Rev. A 1989, 39, 3563–3574. [Google Scholar] [CrossRef]
- Mountain, R.D.; Thirumalai, D. Ergodicity and activated dynamics in supercooled liquids. Phys. Rev. A 1992, 45, R3380–R3383. [Google Scholar] [CrossRef] [PubMed]
- United States Geological Survey, Earthquake Hazards Program. Search Earthquake Catalog. Available online: https://earthquake.usgs.gov/earthquakes/eventpage/us1000hhb1/technical (accessed on 27 October 2018).
- United States Geological Survey, Earthquake Hazards Program. M6.5-10km WSW of Nidri, Greece. Available online: https://earthquake.usgs.gov/earthquakes/eventpage/us10003ywp/technical (accessed on 5 November 2018).
- Sarlis, N.V. Statistical Significance of Earth’s Electric and Magnetic Field Variations Preceding Earthquakes in Greece and Japan Revisited. Entropy 2018, 20, 561. [Google Scholar] [CrossRef]
- Donges, J.; Schleussner, C.F.; Siegmund, J.; Donner, R. Event coincidence analysis for quantifying statistical interrelationships between event time series. Eur. Phys. J. Spec. Top. 2016, 225, 471–487. [Google Scholar] [CrossRef] [Green Version]
- Schleussner, C.F.; Donges, J.F.; Donner, R.V.; Schellnhuber, H.J. Armed-conflict risks enhanced by climate-related disasters in ethnically fractionalized countries. Proc. Natl. Acad. Sci. USA 2016, 113, 9216–9221. [Google Scholar] [CrossRef] [PubMed]
- Siegmund, J.F.; Siegmund, N.; Donner, R.V. CoinCalc—A new R package for quantifying simultaneities of event series. Comput. Geosci. 2017, 98, 64–72. [Google Scholar] [CrossRef]
- Fawcett, T. An introduction to ROC analysis. Pattern Recogn. Lett. 2006, 27, 861–874. [Google Scholar] [CrossRef]
- Sarlis, N.V.; Christopoulos, S.R.G. Visualization of the significance of Receiver Operating Characteristics based on confidence ellipses. Comput. Phys. Commun. 2014, 185, 1172–1176. [Google Scholar] [CrossRef] [Green Version]
- Dologlou, E. A three year continuous sample of officially documented predictions issued in Greece using the VAN method: 1987–1989. Tectonophysics 1993, 224, 189–202. [Google Scholar] [CrossRef]
- Peng, C.K.; Buldyrev, S.V.; Havlin, S.; Simons, M.; Stanley, H.E.; Goldberger, A.L. Mosaic organization of DNA nucleotides. Phys. Rev. E 1994, 49, 1685–1689. [Google Scholar] [CrossRef]
- Peng, C.K.; Buldyrev, S.V.; Goldberger, A.L.; Havlin, S.; Mantegna, R.N.; Simons, M.; Stanley, H.E. Statistical properties of DNA sequences. Phys. A 1995, 221, 180–192. [Google Scholar] [CrossRef]
- Kantelhardt, J.W.; Koscielny-Bunde, E.; Rego, H.H.A.; Havlin, S.; Bunde, A. Detecting long-range correlations with detrended fluctuation analysis. Phys. A 2001, 295, 441–454. [Google Scholar] [CrossRef] [Green Version]
- Mandelbrot, B.B.; van Ness, J.W. Fractional Noises and Applications. SIAM Rev. 1968, 10, 422–437. [Google Scholar] [CrossRef]
- Mandelbrot, B.B.; Wallis, J.R. Some long-run properties of geophysical records. Water Resour. Res. 1969, 5, 321–340. [Google Scholar] [CrossRef]
Figure 1.
Map of the larger area in which the EQs of magnitude greater than or equal to 6.0 are shown by the green circles. The locations of the measuring stations operating in Greece of the VAN telemetric network are shown by the blue circles. The thick black line depicts the Hellenic arc [3] while the gray shaded area the selectivity map of Pirgos (PIR) measuring station. The red star corresponds to the epicenter of the M6.8 EQ on 25 October 2018 and the red circle delimits a circular region with radius km around the city of Patras.

Figure 2.
The SES activity recorded at three (almost parallel) measuring dipoles at PIR station. The time is measured in seconds since 00:00 UTC on 2 October 2018. The dichotomous representation of the SES activity is shown in the bottom channel by the cyan line.
Figure 2.
The SES activity recorded at three (almost parallel) measuring dipoles at PIR station. The time is measured in seconds since 00:00 UTC on 2 October 2018. The dichotomous representation of the SES activity is shown in the bottom channel by the cyan line.

Figure 3.
(a–d): the probability distribution Prob of versus as it results after the occurrence of each small EQ within the selectivity area of PIR (see the gray shaded area in Figure 1) for various magnitude thresholds = 2.7, 2.8, 2.9, and 3.0.
Figure 3.
(a–d): the probability distribution Prob of versus as it results after the occurrence of each small EQ within the selectivity area of PIR (see the gray shaded area in Figure 1) for various magnitude thresholds = 2.7, 2.8, 2.9, and 3.0.

Figure 4.
Estimation of the EQ potential score (EPS) based on the cumulative distribution function of the number of the small EQs () that occur within the large area depicted in Figure 1 between the occurrence of two strong () EQs. The number of small EQs that occurred within km with depths km from the city of Patras since the M6.5 EQ on 17 November 2015 07:11 a.m. UTC [74] and before the occurrence of the M6.8 EQ on 25 October 2018 was 212.

© 2018 by the authors. Licensee MDPI, Basel, Switzerland. This article is an open access article distributed under the terms and conditions of the Creative Commons Attribution (CC BY) license (http://creativecommons.org/licenses/by/4.0/).
Share and Cite
MDPI and ACS Style
Sarlis, N.V.; Skordas, E.S. Study in Natural Time of Geoelectric Field and Seismicity Changes Preceding the Mw6.8 Earthquake on 25 October 2018 in Greece. Entropy 2018, 20, 882. https://0-doi-org.brum.beds.ac.uk/10.3390/e20110882
AMA Style
Sarlis NV, Skordas ES. Study in Natural Time of Geoelectric Field and Seismicity Changes Preceding the Mw6.8 Earthquake on 25 October 2018 in Greece. Entropy. 2018; 20(11):882. https://0-doi-org.brum.beds.ac.uk/10.3390/e20110882
Chicago/Turabian StyleSarlis, Nicholas V., and Efthimios S. Skordas. 2018. "Study in Natural Time of Geoelectric Field and Seismicity Changes Preceding the Mw6.8 Earthquake on 25 October 2018 in Greece" Entropy 20, no. 11: 882. https://0-doi-org.brum.beds.ac.uk/10.3390/e20110882
Note that from the first issue of 2016, this journal uses article numbers instead of page numbers. See further details here.