Approaching Retinal Ganglion Cell Modeling and FPGA Implementation for Robotics


 ,
,
Abstract
:1. Introduction
2. Results
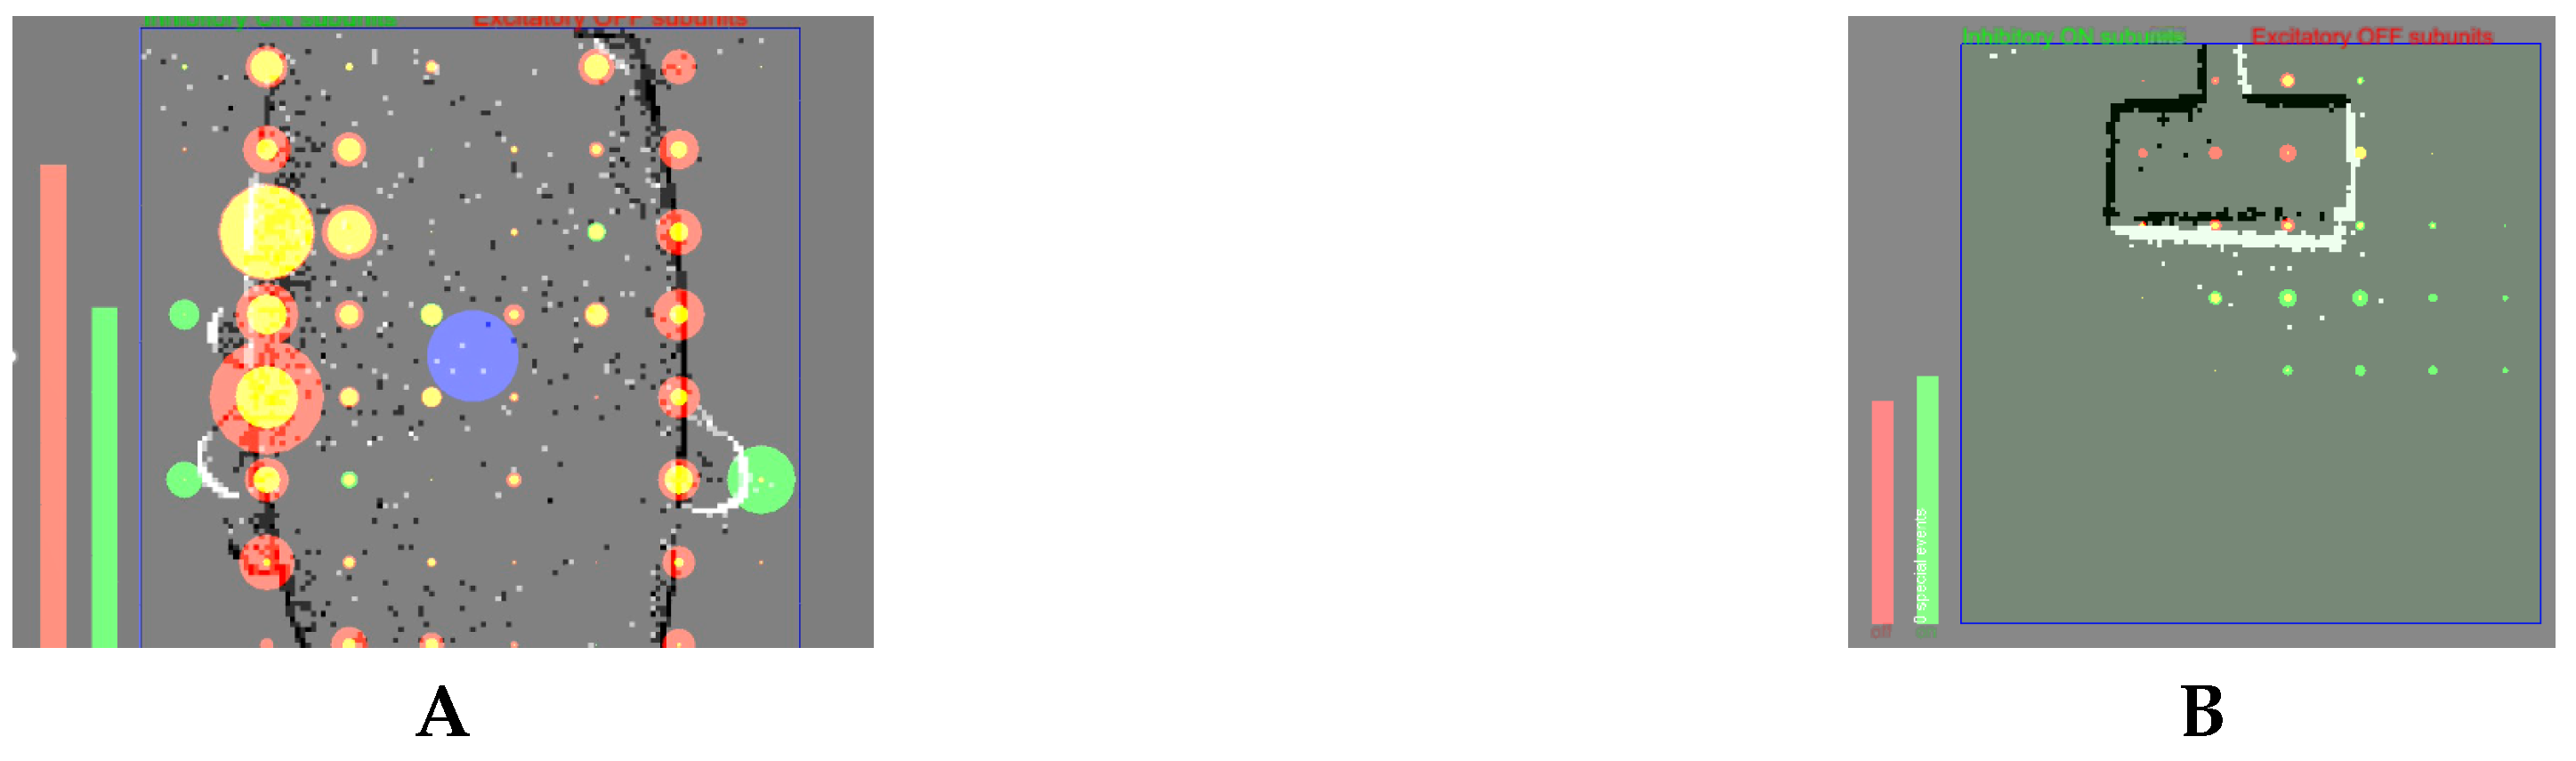
2.1. Software Model
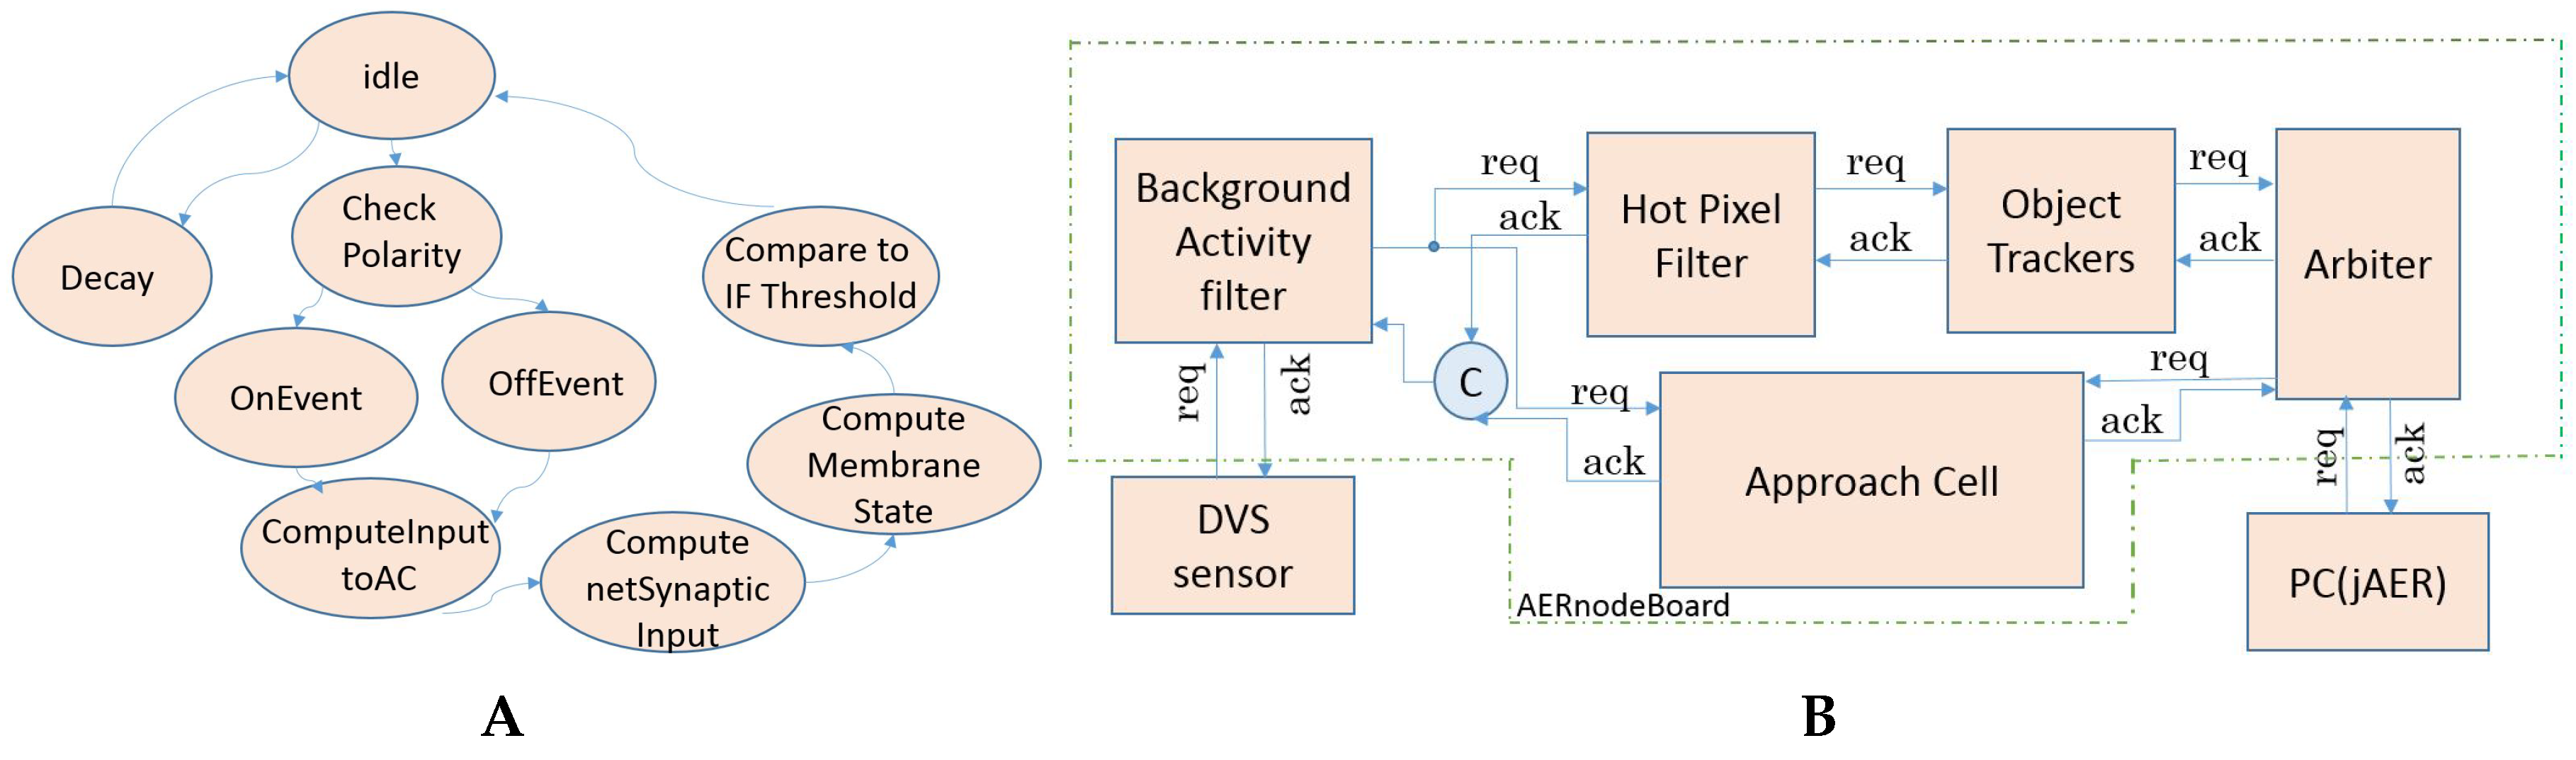
2.2. Hadware Model
2.3. Entropy Analysis
3. Discussion
4. Material and Methods
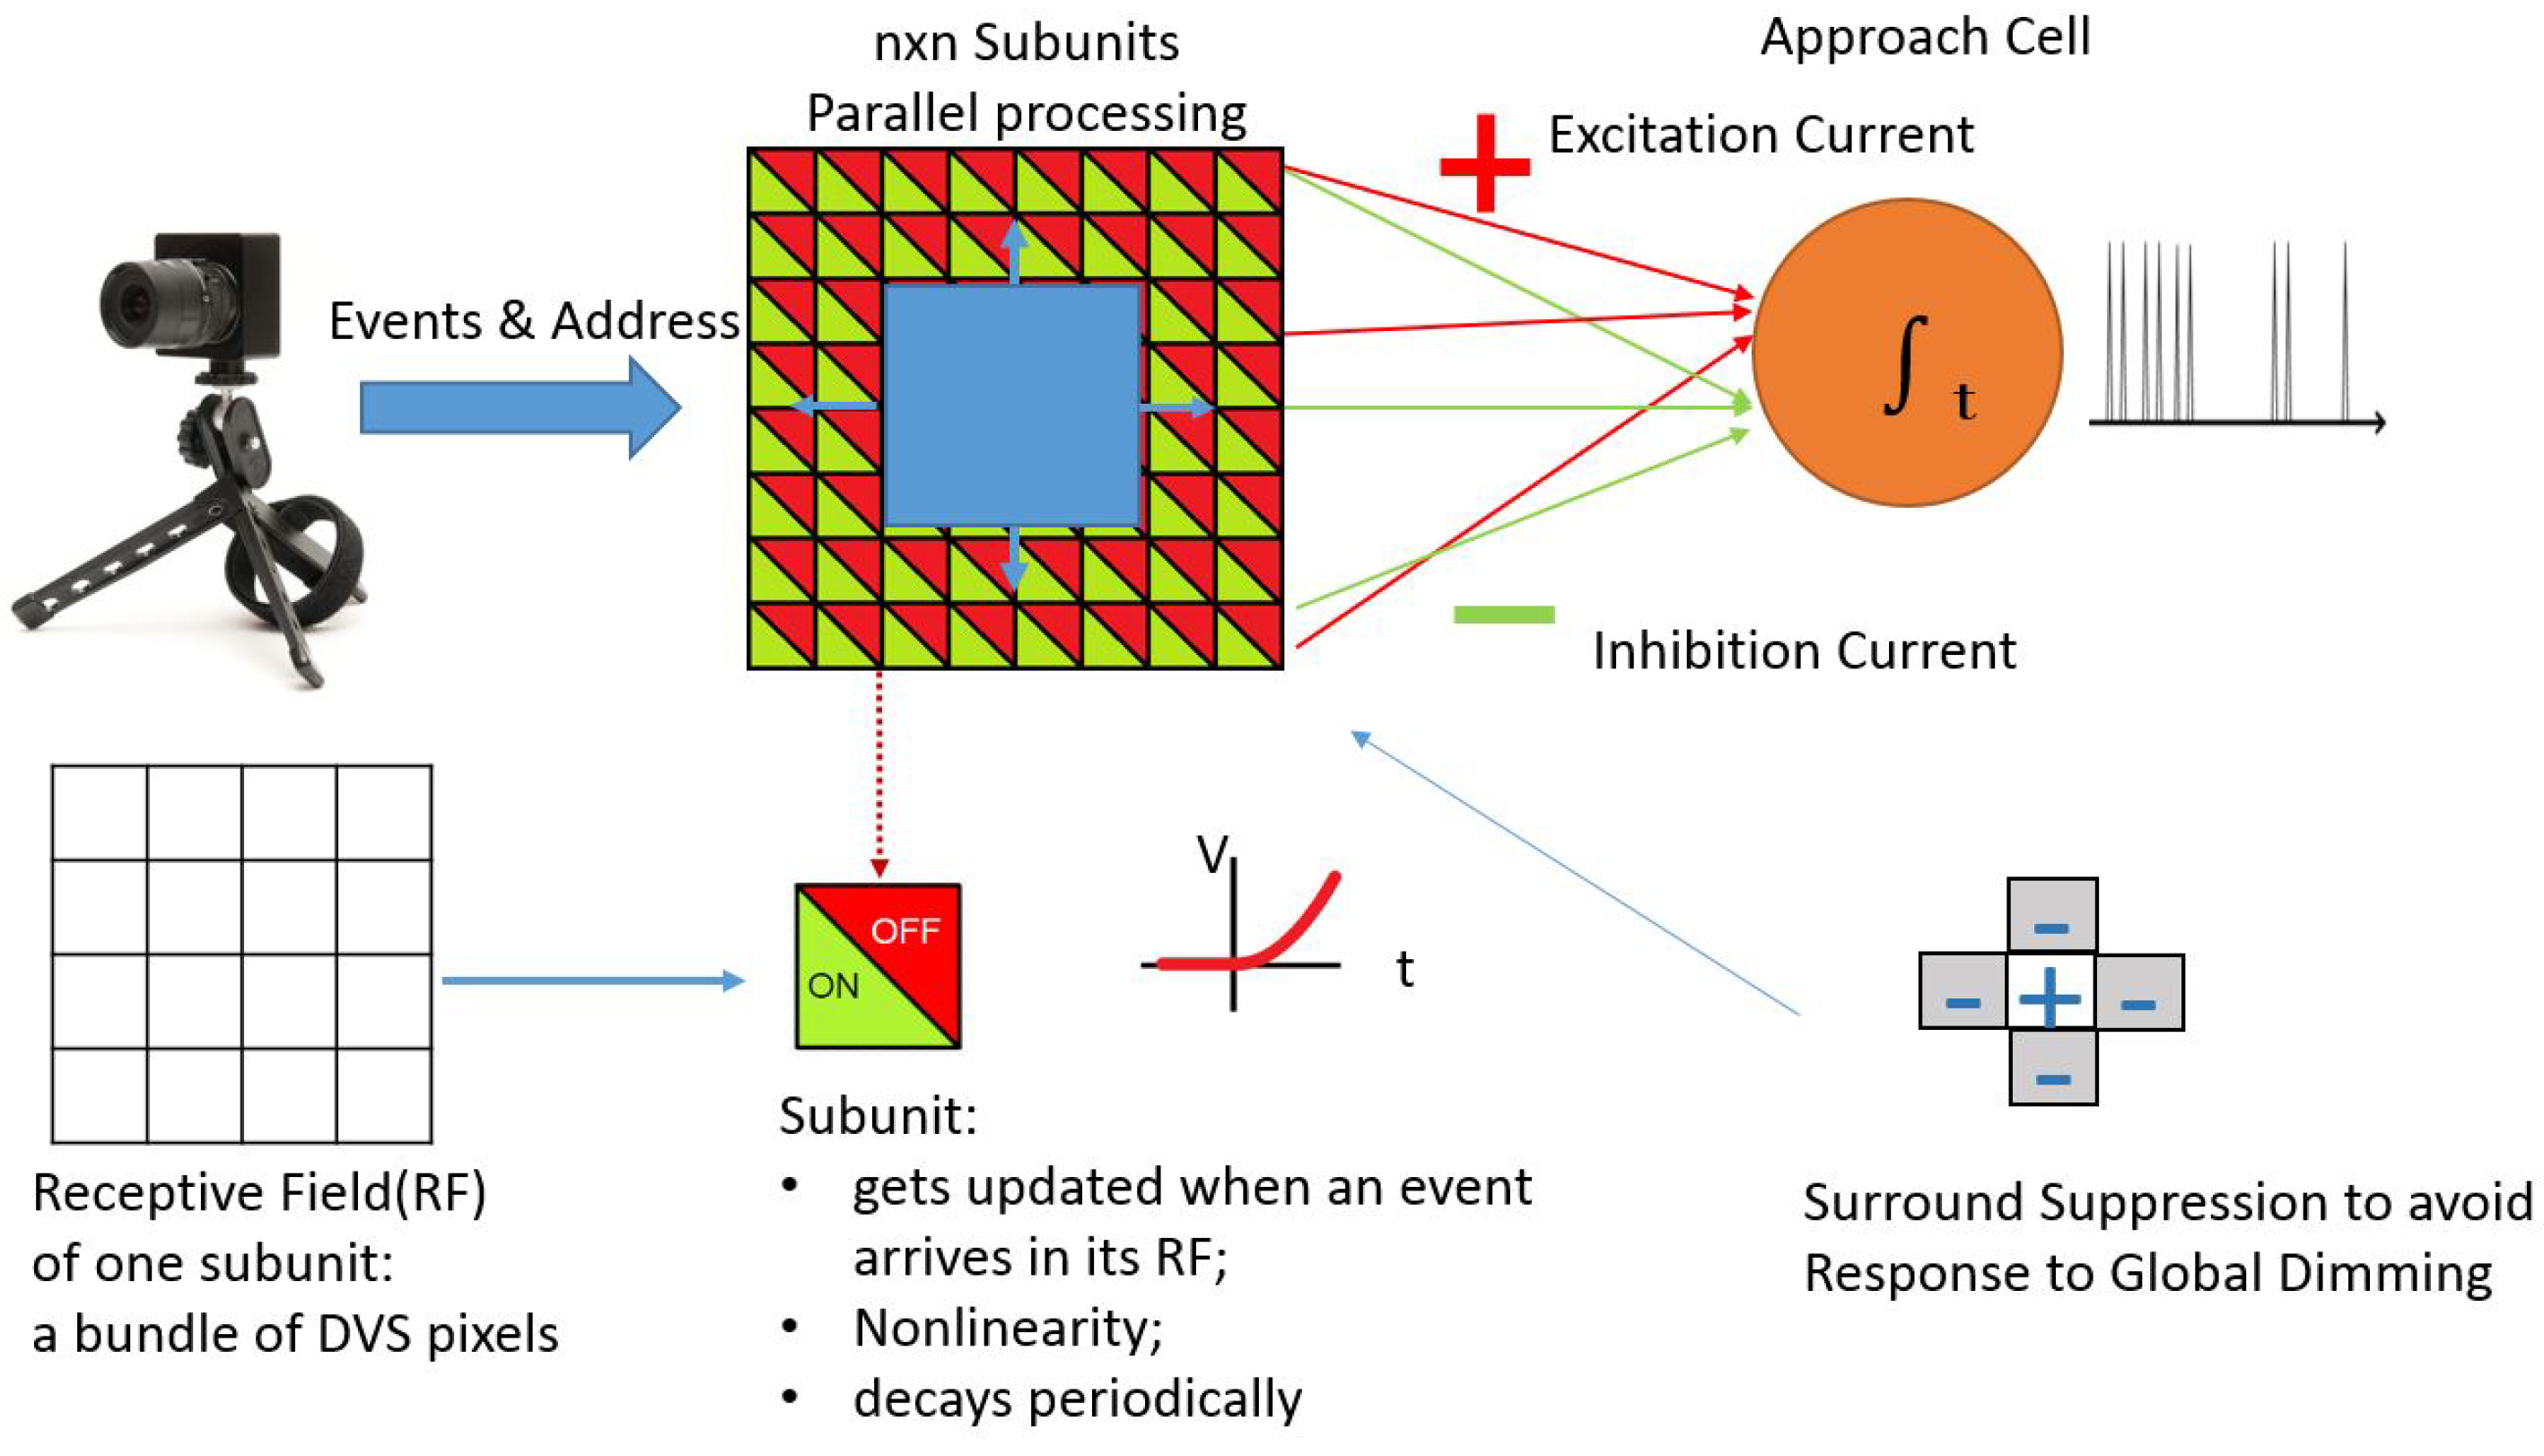
4.1. The Approach Sensitivity Cell Biological Model
4.2. AC Software Implementation
4.3. AC Hardware Implementation
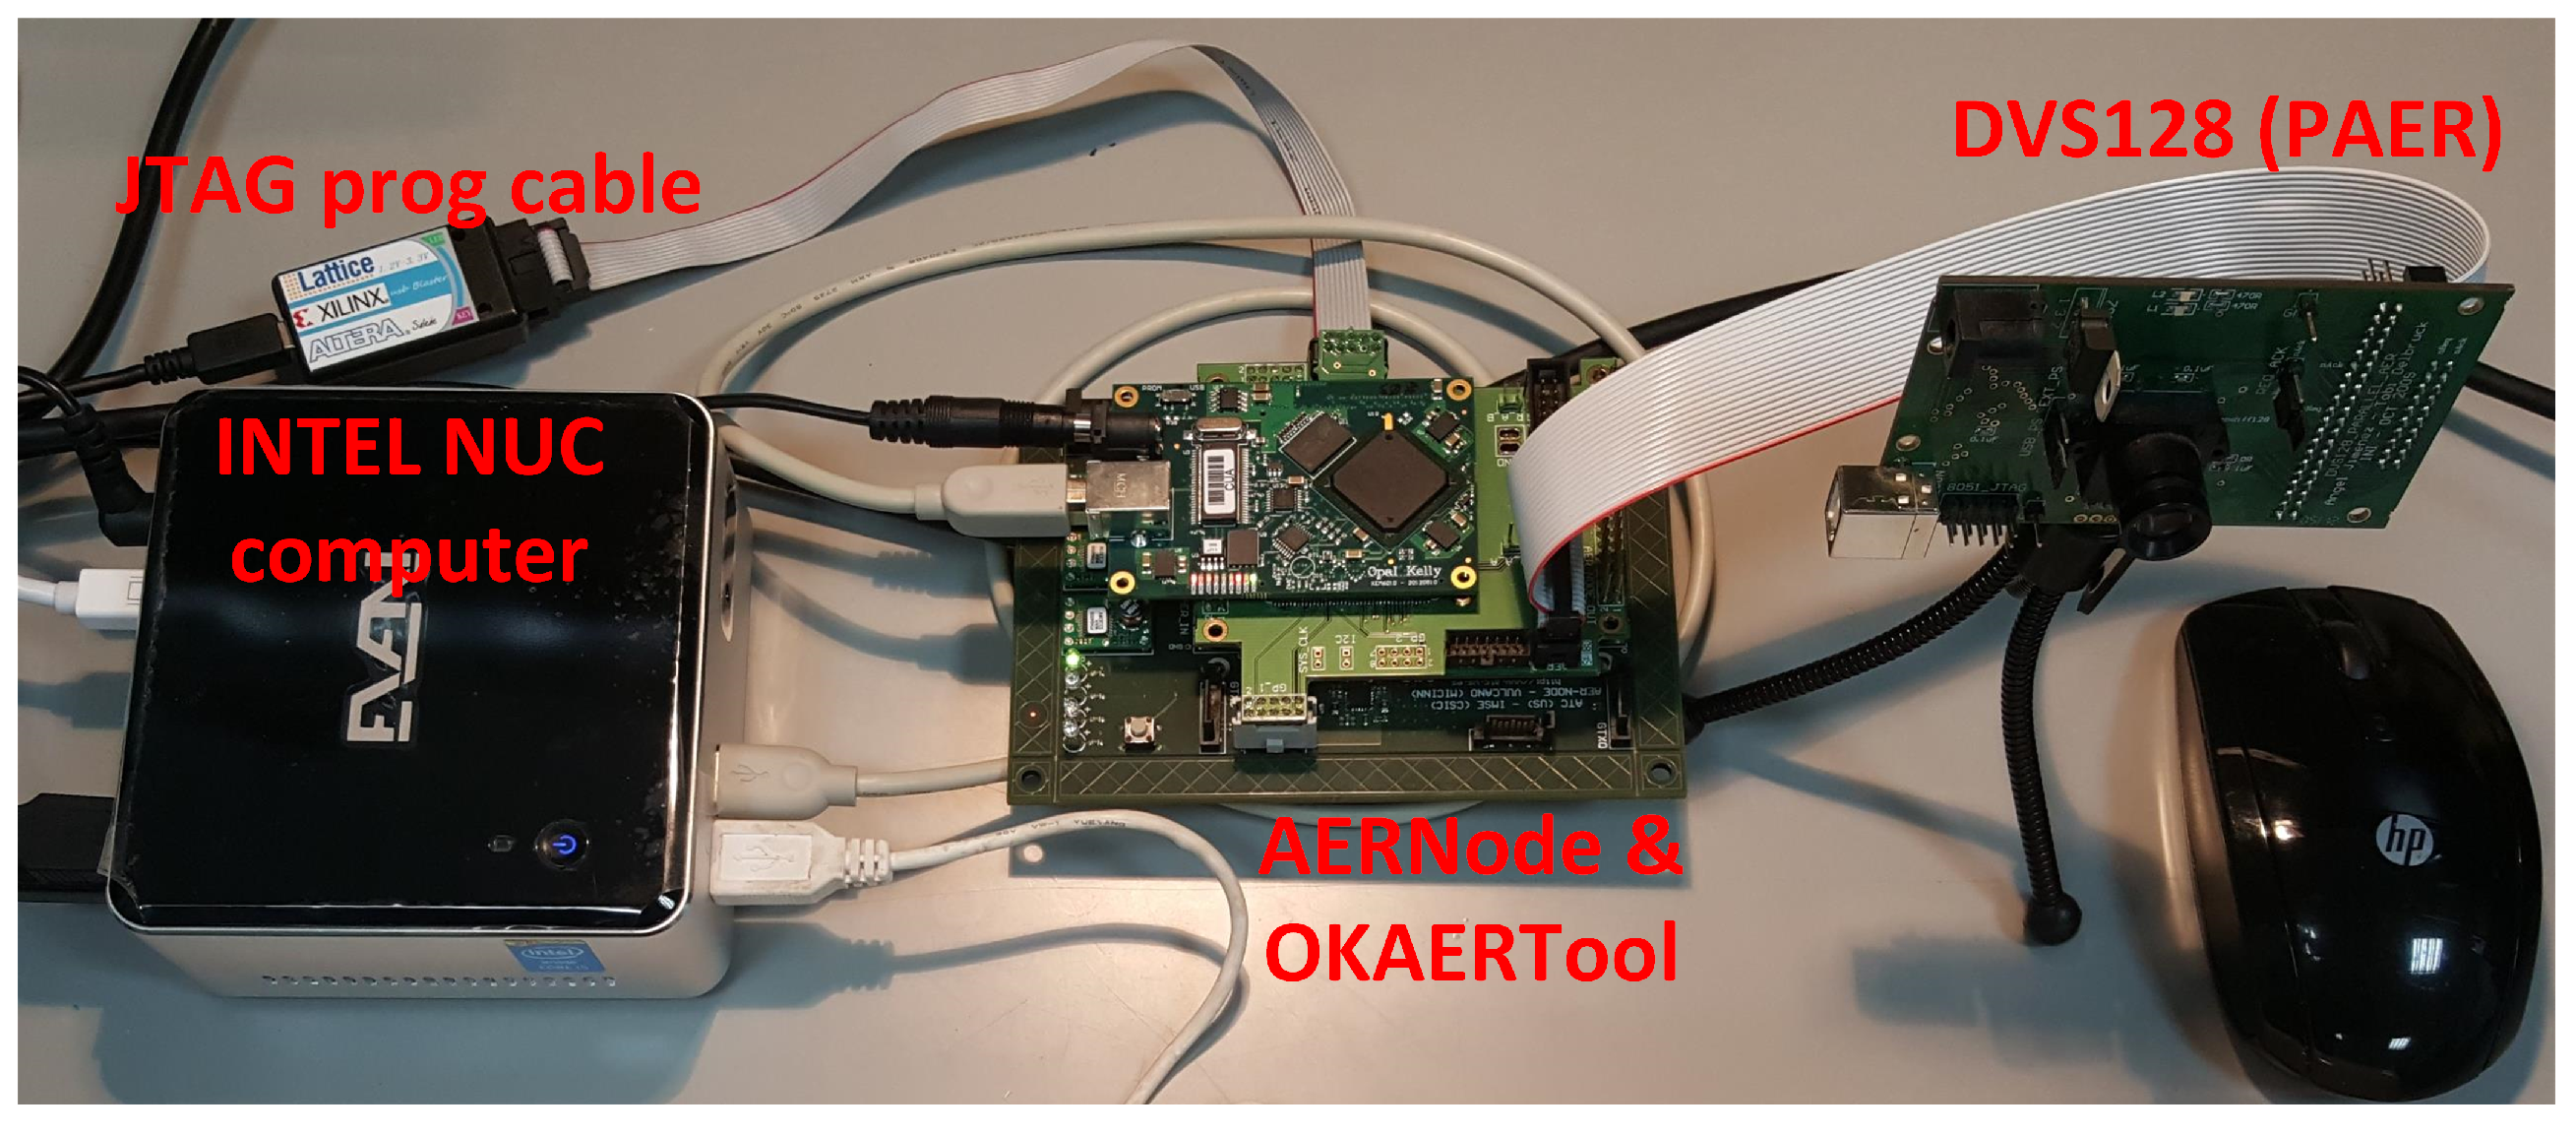
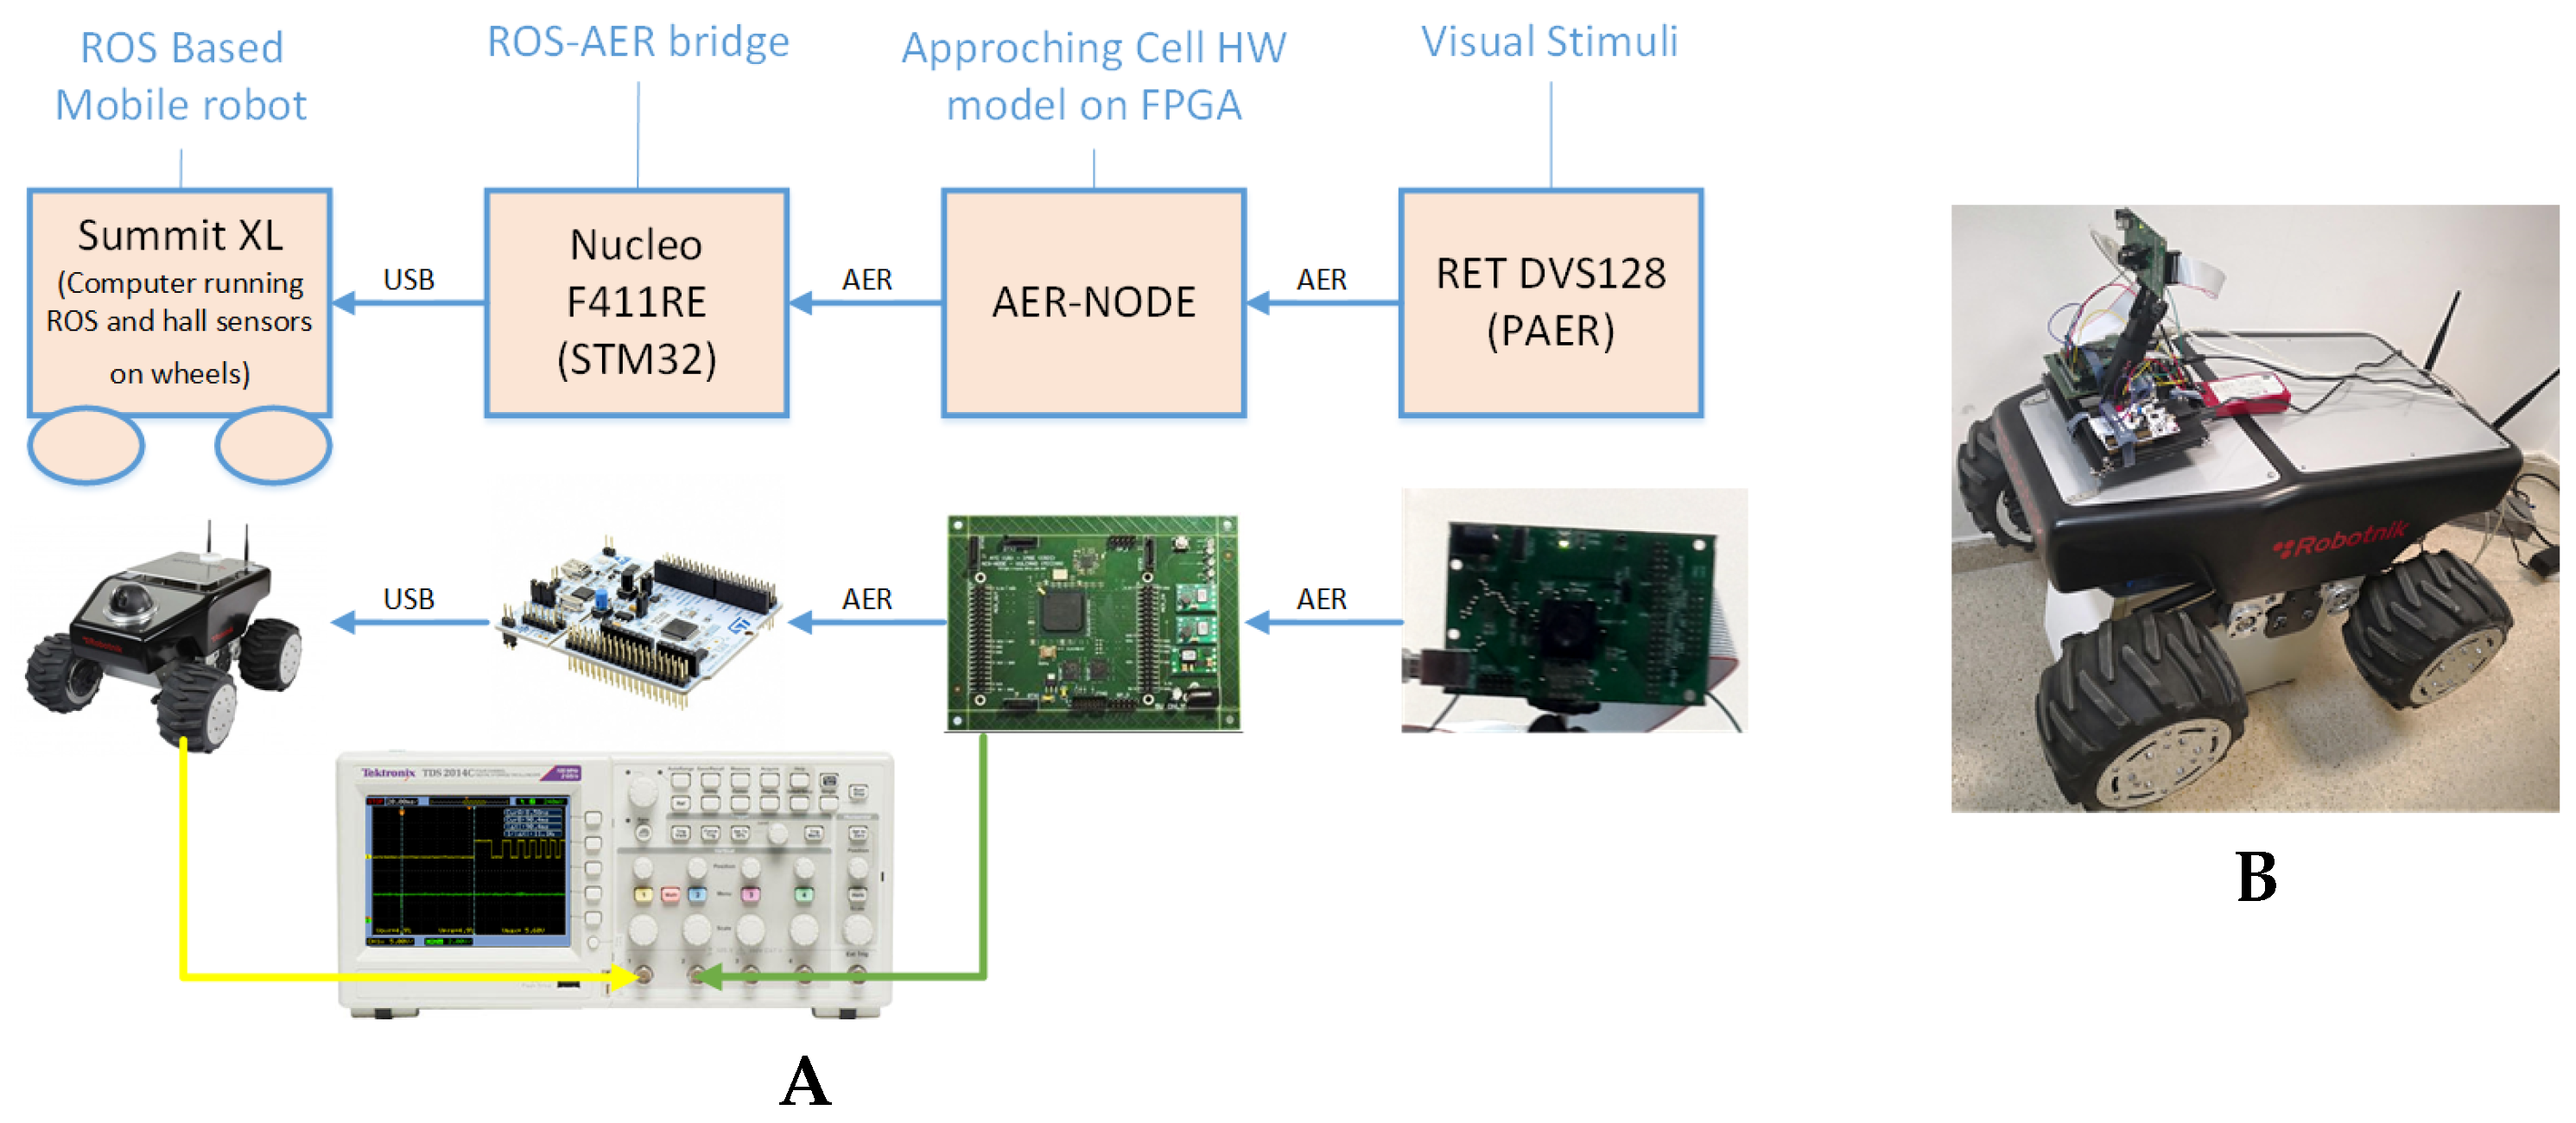
4.4. Mobile Robot System Integration
5. Conclusions
Author Contributions
Funding
Acknowledgments
Conflicts of Interest
References
- Münch, T.; da Silveira, R.; Siegert, S.; Viney, T.; Awatramani, G.; Roska, B. Approach sensitivity in the retina processed by a multifunctional neural circuit. Nat. Neurosci. 2009, 12, 1308–1316. [Google Scholar] [CrossRef] [PubMed]
- Nam, T.H.; Shim, J.H.; Cho, Y.I. A 2.5D Map-Based Mobile Robot Localization via Cooperation of Aerial and Ground Robots. Sensors 2017, 17, E2730. [Google Scholar] [CrossRef] [PubMed]
- Akolkar, H.; Meyer, C.; Clady, X.; Marre, O.; Bartolozzi, C.; Panzeri, S.; Benosman, R. What Can Neuromorphic Event-Driven Precise Timing Add to Spike-Based Pattern Recognition? Neural Comput. 2015, 27, 561–593. [Google Scholar] [CrossRef] [PubMed]
- Lichtsteiner, P.; Posch, C.; Delbruck, T. A 128 × 128 120 dB 15 μs Latency Asynchronous Temporal Contrast Vision Sensor. IEEE J. Solid-State Circuits 2008, 43, 566–576. [Google Scholar] [CrossRef] [Green Version]
- Wei, H.; Ren, Y. A Mathematical Model of Retinal Ganglion Cells and Its Applications in Image Representation. Neural Process. Lett. 2013, 38, 205–226. [Google Scholar] [CrossRef]
- Serrano-Gotarredona, R.; Oster, M.; Lichtsteiner, P.; Linares-Barranco, A.; Paz-Vicente, R.; Gomez-Rodriguez, F.; Camunas-Mesa, L.; Berner, R.; Rivas-Perez, M.; Delbruck, T.; et al. CAVIAR: A 45 k Neuron, 5 M Synapse, 12 G Connects/s AER Hardware Sensory Processing Learning Actuating System for High-Speed Visual Object Recognition and Tracking. IEEE Trans. Neural Netw. 2009, 20, 1417–1438. [Google Scholar] [CrossRef] [PubMed] [Green Version]
- Denk, C.; Llobet-Blandino, F.; Galluppi, F.; Plana, L.A.; Furber, S.; Conradt, J. Real-Time Interface Board for Closed-Loop Robotic Tasks on the SpiNNaker Neural Computing System. In Artificial Neural Networks and Machine Learning—ICANN 2013; Mladenov, V., Koprinkova-Hristova, P., Palm, G., Villa, A.E.P., Appollini, B., Kasabov, N., Eds.; Springer: Berlin/Heidelberg, Germany, 2013; pp. 467–474. [Google Scholar]
- Khan, M.M.; Lester, D.R.; Plana, L.A.; Rast, A.; Jin, X.; Painkras, E.; Furber, S.B. SpiNNaker: Mapping neural networks onto a massively-parallel chip multiprocessor. In Proceedings of the 2008 IEEE International Joint Conference on Neural Networks (IEEE World Congress on Computational Intelligence), Hong Kong, China, 1–8 June 2008; pp. 2849–2856. [Google Scholar]
- Perez-Peña, F.; Morgado-Estevez, A.; Linares-Barranco, A.; Jimenez-Fernandez, A.; Gomez-Rodriguez, F.; Jimenez-Moreno, G.; Lopez-Coronado, J. Neuro-Inspired Spike-Based Motion: From Dynamic Vision Sensor to Robot Motor Open-Loop Control through Spike-VITE. Sensors 2013, 13, 15805–15832. [Google Scholar] [CrossRef] [PubMed] [Green Version]
- Linares-Barranco, A.; Gómez-Rodríguez, F.; Villanueva, V.; Longinotti, L.; Delbrück, T. A USB3.0 FPGA event-based filtering and tracking framework for dynamic vision sensors. In Proceedings of the 2015 IEEE International Symposium on Circuits and Systems (ISCAS), Lisbon, Portugal, 24–27 May 2015; pp. 2417–2420. [Google Scholar]
- Pruszynski, J.A.; King, G.L.; Boisse, L.; Scott, S.H.; Flanagan, J.R.; Munoz, D.P. Stimulus-locked responses on human arm muscles reveal a rapid neural pathway linking visual input to arm motor output. Eur. J. Neurosci. 2010, 32, 1049–1057. [Google Scholar] [CrossRef] [PubMed]
- Clady, X.; Clercq, C.; Ieng, S.H.; Houseini, F.; Randazzo, M.; Natale, L.; Bartolozzi, C.; Benosman, R. Asynchronous visual event-based time-to-contact. Front. Neurosci. 2014, 8, 9. [Google Scholar] [CrossRef] [PubMed]
- Delbrück, T.; Linares-Barranco, B.; Culurciello, E.; Posch, C. Activity-driven, event-based vision sensors. In Proceedings of the 2010 IEEE International Symposium on Circuits and Systems, Paris, France, 30 May–2 June 2010; pp. 2426–2429. [Google Scholar]
- Rea, F.; Metta, G.; Bartolozzi, C. Event-driven visual attention for the humanoid robot iCub. Front. Neurosci. 2013, 7, 234. [Google Scholar] [CrossRef] [PubMed]
- Peng, X.; Zhao, B.; Yan, R.; Tang, H.; Yi, Z. Bag of Events: An Efficient Probability-Based Feature Extraction Method for AER Image Sensors. IEEE Trans. Neural Netw. Learn. Syst. 2017, 28, 791–803. [Google Scholar] [CrossRef] [PubMed]
- Belbachir, A.N.; Nowakowska, A.; Schraml, S.; Wiesmann, G.; Sablatnig, R. Event-driven feature analysis in a 4D spatiotemporal representation for ambient assisted living. In Proceedings of the 2011 IEEE International Conference on Computer Vision Workshops (ICCV Workshops), Barcelona, Spain, 6–13 November 2011; pp. 1570–1577. [Google Scholar]
- Mishra, A.; Ghosh, R.; Principe, J.C.; Thakor, N.V.; Kukreja, S.L. A Saccade Based Framework for Real-Time Motion Segmentation Using Event Based Vision Sensors. Front. Neurosci. 2017, 11, 83. [Google Scholar] [CrossRef] [PubMed]
- Liu, H.; Rios-Navarro, A.; Moeys, D.P.; Delbruck, T.; Linares-Barranco, A. Neuromorphic Approach Sensitivity Cell Modeling and FPGA Implementation. In Artificial Neural Networks and Machine Learning—ICANN 2017; Lintas, A., Rovetta, S., Verschure, P.F., Villa, A.E., Eds.; Springer: Cham, Switzerland, 2017; pp. 179–187. [Google Scholar]
- Moeys, D.P.; Delbrück, T.; Rios-Navarro, A.; Linares-Barranco, A. Retinal ganglion cell software and FPGA model implementation for object detection and tracking. In Proceedings of the 2016 IEEE International Symposium on Circuits and Systems (ISCAS), Montreal, QC, Canada, 22–25 May 2016; pp. 1434–1437. [Google Scholar]
- Iakymchuk, T.; Rosado, A.; Serrano-Gotarredona, T.; Linares-Barranco, B.; Jiménez-Fernández, A.; Linares-Barranco, A.; Jiménez-Moreno, G. An AER handshake-less modular infrastructure PCB with ×8 2.5Gbps LVDS serial links. In Proceedings of the 2014 IEEE International Symposium on Circuits and Systems (ISCAS), Melbourne, Australia, 1–5 June 2014; pp. 1556–1559. [Google Scholar]
- Rios-Navarro, A.; Dominguez-Morales, J.P.; Tapiador-Morales, R.; Gutierrez-Galan, D.; Jimenez-Fernandez, A.; Linares-Barranco, A. A 20Mevps/32Mev event-based USB framework for neuromorphic systems debugging. In Proceedings of the 2016 Second International Conference on Event-based Control, Communication, and Signal Processing (EBCCSP), Krakow, Poland, 13–15 June 2016; pp. 1–6. [Google Scholar]
- Milde, M.B.; Dietmüller, A.; Blum, H.; Indiveri, G.; Sandamirskaya, Y. Obstacle avoidance and target acquisition in mobile robots equipped with neuromorphic sensory-processing systems. In Proceedings of the 2017 IEEE International Symposium on Circuits and Systems (ISCAS), Baltimore, MD, USA, 28–31 May 2017; pp. 1–4. [Google Scholar]


| jAER (64-bit Intel NUC, 4 GB RAM, i5-4250U, 1.30 GHz) | jAER (64-bit PC, 16 GB RAM, i7-4770K, 3.50 GHz) | FPGA Xilinx Spartan6, 50 MHz | |
| Latency | 370 ns/ev at 0.2 Mev/s, at 5% CPU load | 55 ns/ev at 0.2 Mev/s, at 3% CPU load | 160 ns/ev at any event rate |
| Power | 6.2 W static, +2.5 W dynamic (running jAER) | 160 W | 0.775 W static, +0.05 W dynamic (processing events) |
© 2018 by the authors. Licensee MDPI, Basel, Switzerland. This article is an open access article distributed under the terms and conditions of the Creative Commons Attribution (CC BY) license (http://creativecommons.org/licenses/by/4.0/).
Share and Cite
Linares-Barranco, A.; Liu, H.; Rios-Navarro, A.; Gomez-Rodriguez, F.; Moeys, D.P.; Delbruck, T. Approaching Retinal Ganglion Cell Modeling and FPGA Implementation for Robotics. Entropy 2018, 20, 475. https://0-doi-org.brum.beds.ac.uk/10.3390/e20060475
Linares-Barranco A, Liu H, Rios-Navarro A, Gomez-Rodriguez F, Moeys DP, Delbruck T. Approaching Retinal Ganglion Cell Modeling and FPGA Implementation for Robotics. Entropy. 2018; 20(6):475. https://0-doi-org.brum.beds.ac.uk/10.3390/e20060475
Chicago/Turabian StyleLinares-Barranco, Alejandro, Hongjie Liu, Antonio Rios-Navarro, Francisco Gomez-Rodriguez, Diederik P. Moeys, and Tobi Delbruck. 2018. "Approaching Retinal Ganglion Cell Modeling and FPGA Implementation for Robotics" Entropy 20, no. 6: 475. https://0-doi-org.brum.beds.ac.uk/10.3390/e20060475