Combination of Global Features for the Automatic Quality Assessment of Retinal Images

 , , , and
Abstract
:1. Introduction
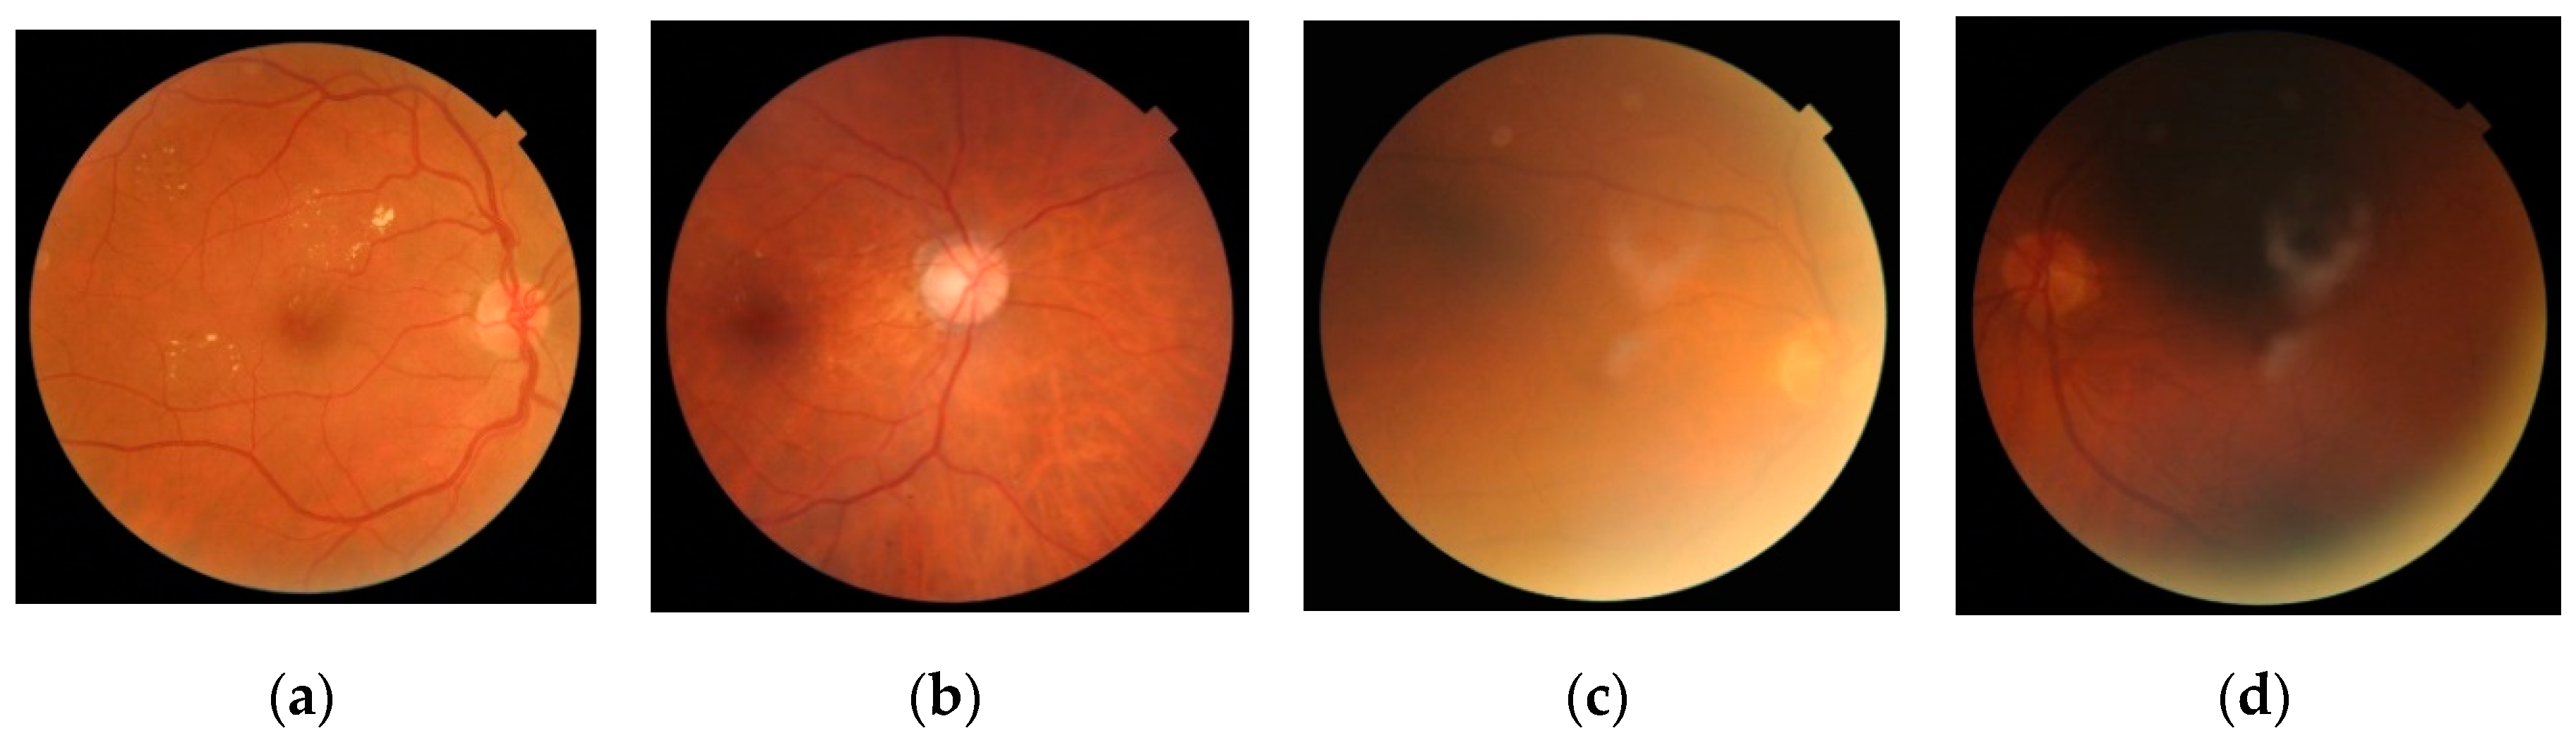
2. Retinal Image Database
3. Methods
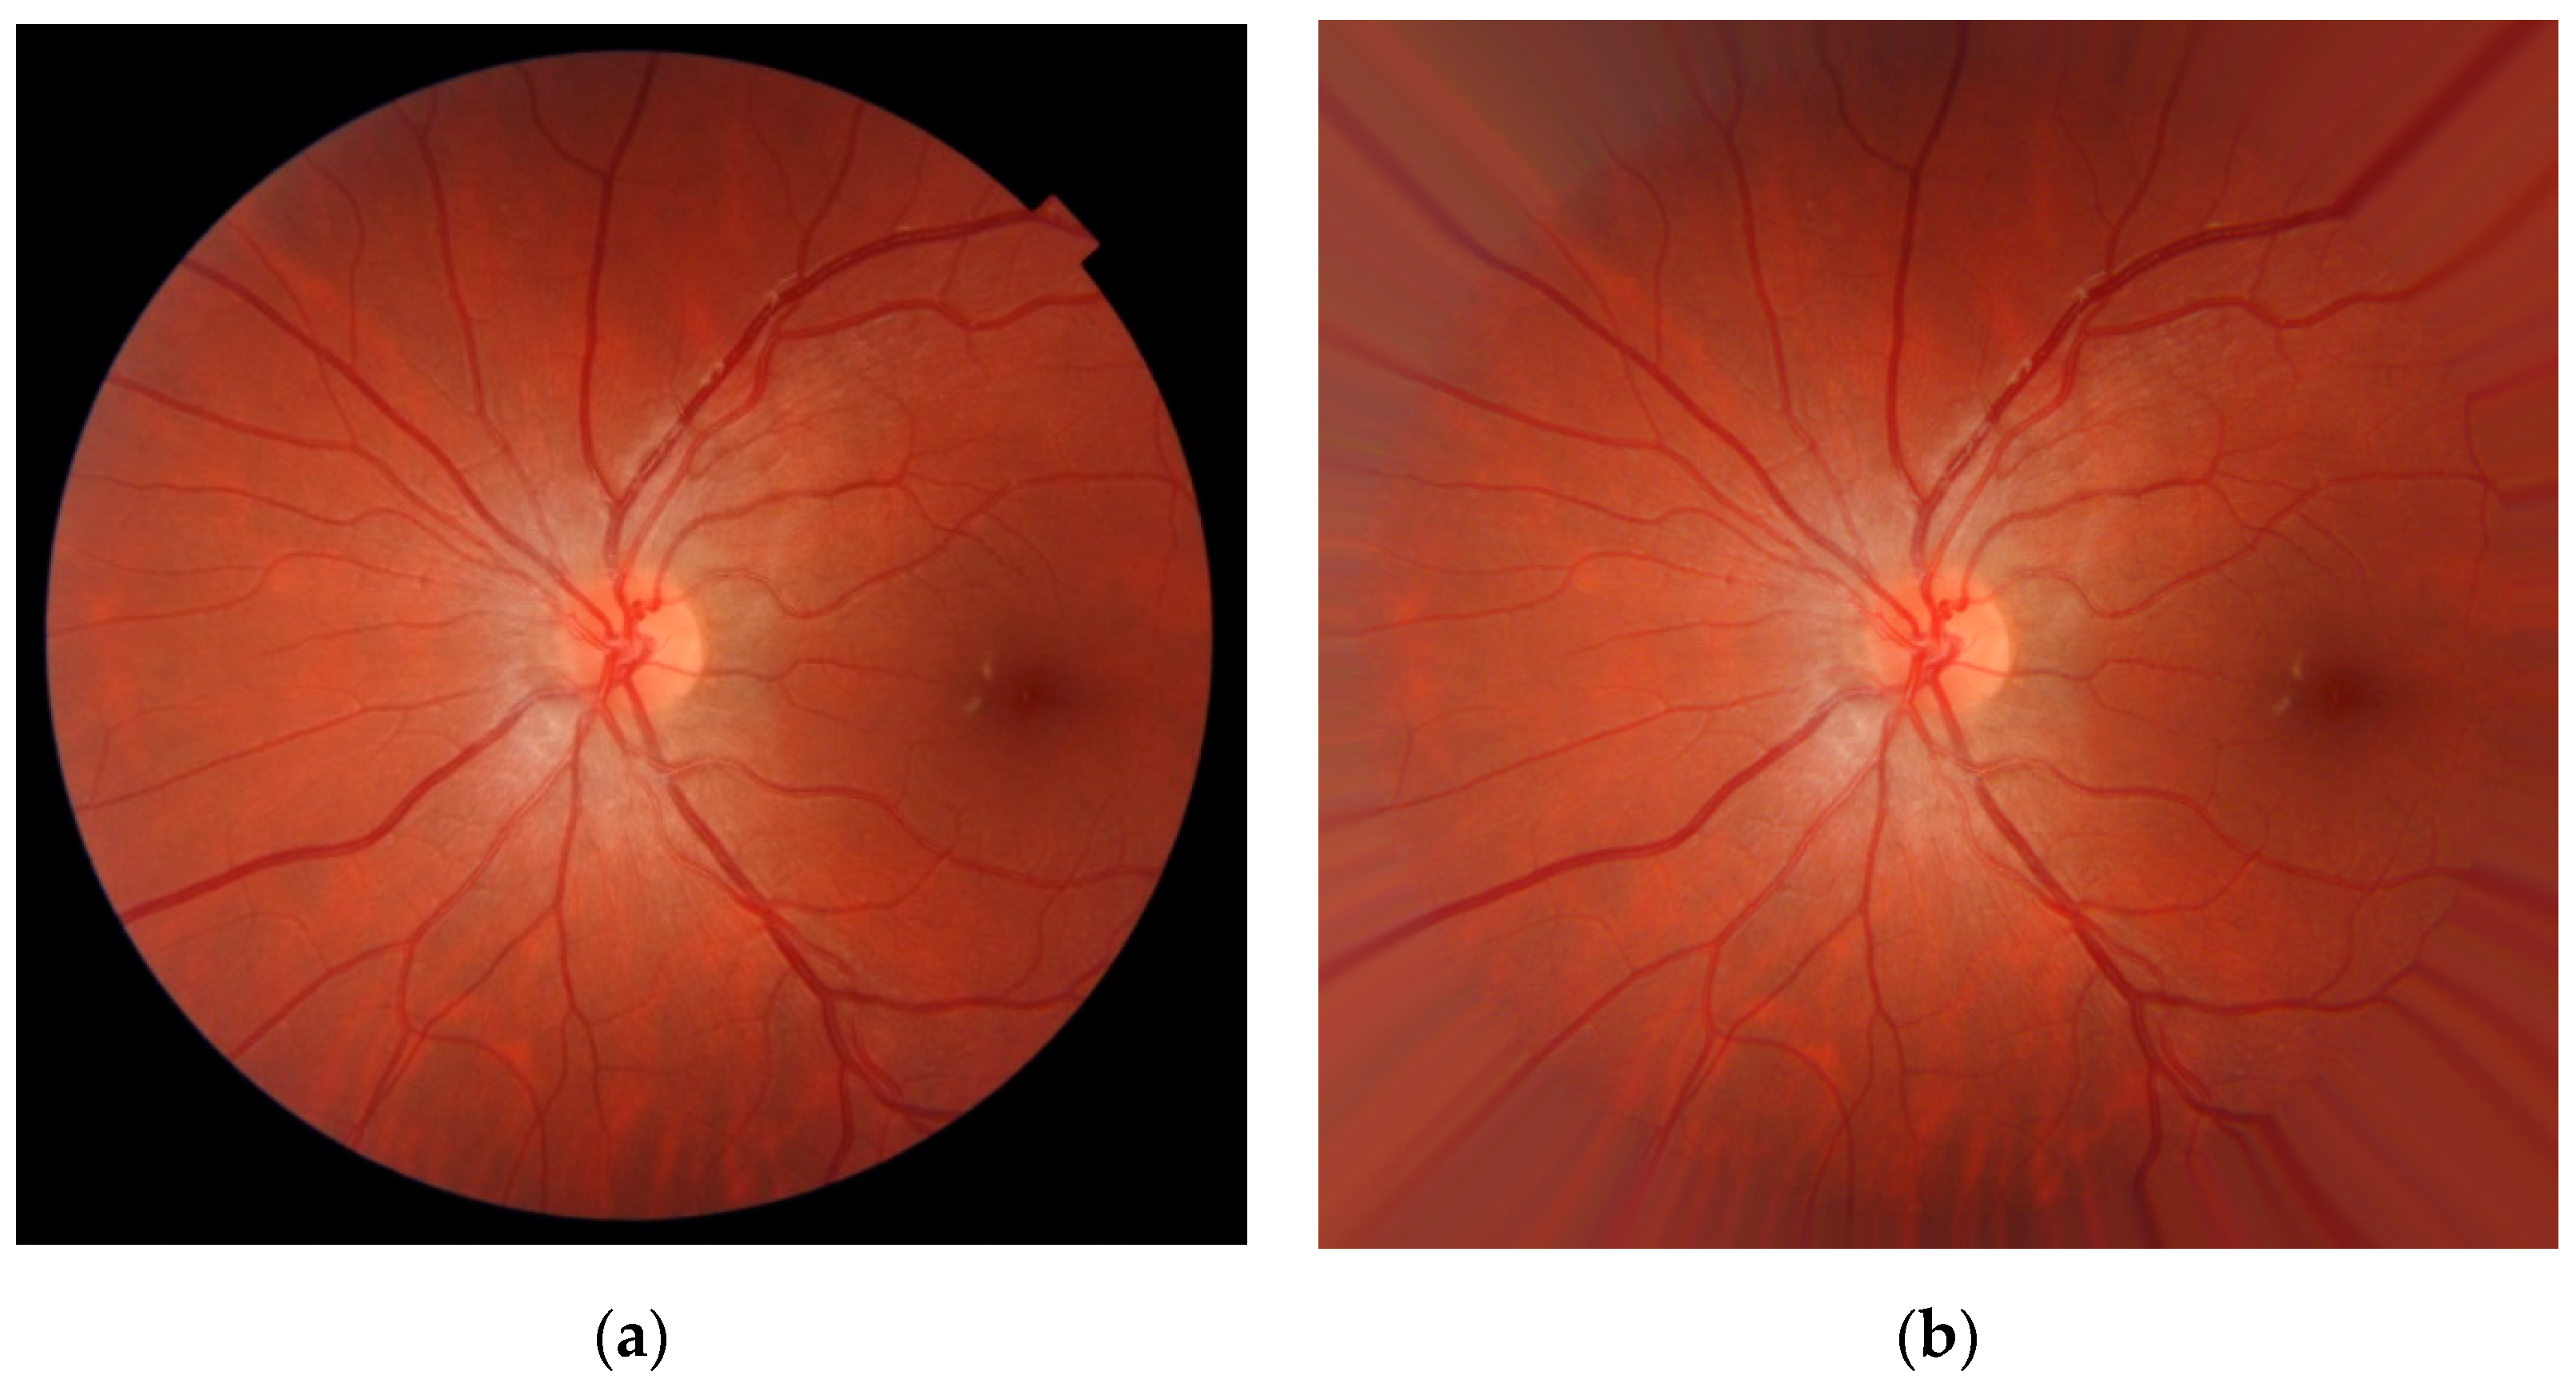
3.1. Preprocessing
- The FOV mask border was extended using a dilation operator over MEXT (a 4-neighborhood diamond-shaped structuring element was used). This way, the FOV was enlarged to include new pixels around its border.
- The values of IPREP corresponding to the new border pixels of MEXT(i) were substituted with the average value of the neighbor pixels in IPREP inside the mask MEXT(I − 1).
- The FOV mask MEXT was updated with MEXT(i).
3.2. Feature Extraction
3.2.1. Features Based on Spatial and Spectral Entropies
3.2.2. Features Based on Naturalness
- The image IPREP was normalized. The local mean μ(x, y) was subtracted for each pixel (x, y) and the result was divided by the local standard deviation σ(x, y) [34]:
- The image INORM was divided into blocks of size P × P pixels. Then, a subset of all the blocks in the image was selected based on the amount of local sharpness, δ(b), in each block b [34]. Blocks that exceeded a minimum amount of sharpness, δMIN, were retained [34]:where T is a threshold between 0 and 1.
- Each of the selected blocks was subsequently characterized by a zero-mean generalized Gaussian distribution (GGD). The parameters of shape (α) and spread (β) from the GGD were estimated for each block. Additionally, in each of the selected blocks, the products between adjacent pixels along 4 directions were calculated and characterized by four asymmetric generalized Gaussian distributions (AGGD). In this case, the estimated parameters from each of the AGGDs were the shape (γ), the left and right spreads (βl, βr), and the mean of the distribution (η). The process was repeated with a rescaled version of the same image in order to perform multi-scale analysis (978 × 967 pixels). A total of 36 parameters characterize each block—2 from the GGD (α, β) and 16 from 4 AGGDs (γ, βl, βr, and η in the 4 directions) using 2 scales.
- Steps 1–3 were repeated for each image used to build the reference model.
- The parameters from selected blocks in all the images were fitted to a 36-D multivariate Gaussian (MVG) model. The MVG probability distribution is defined as [34]:where the vector ν and the covariance matrix Σ define the MVG model [34]. In this work, the parameters of the reference NSS model were denoted by νM and ΣM.
3.2.3. Features Based on the Continuous Wavelet Transform
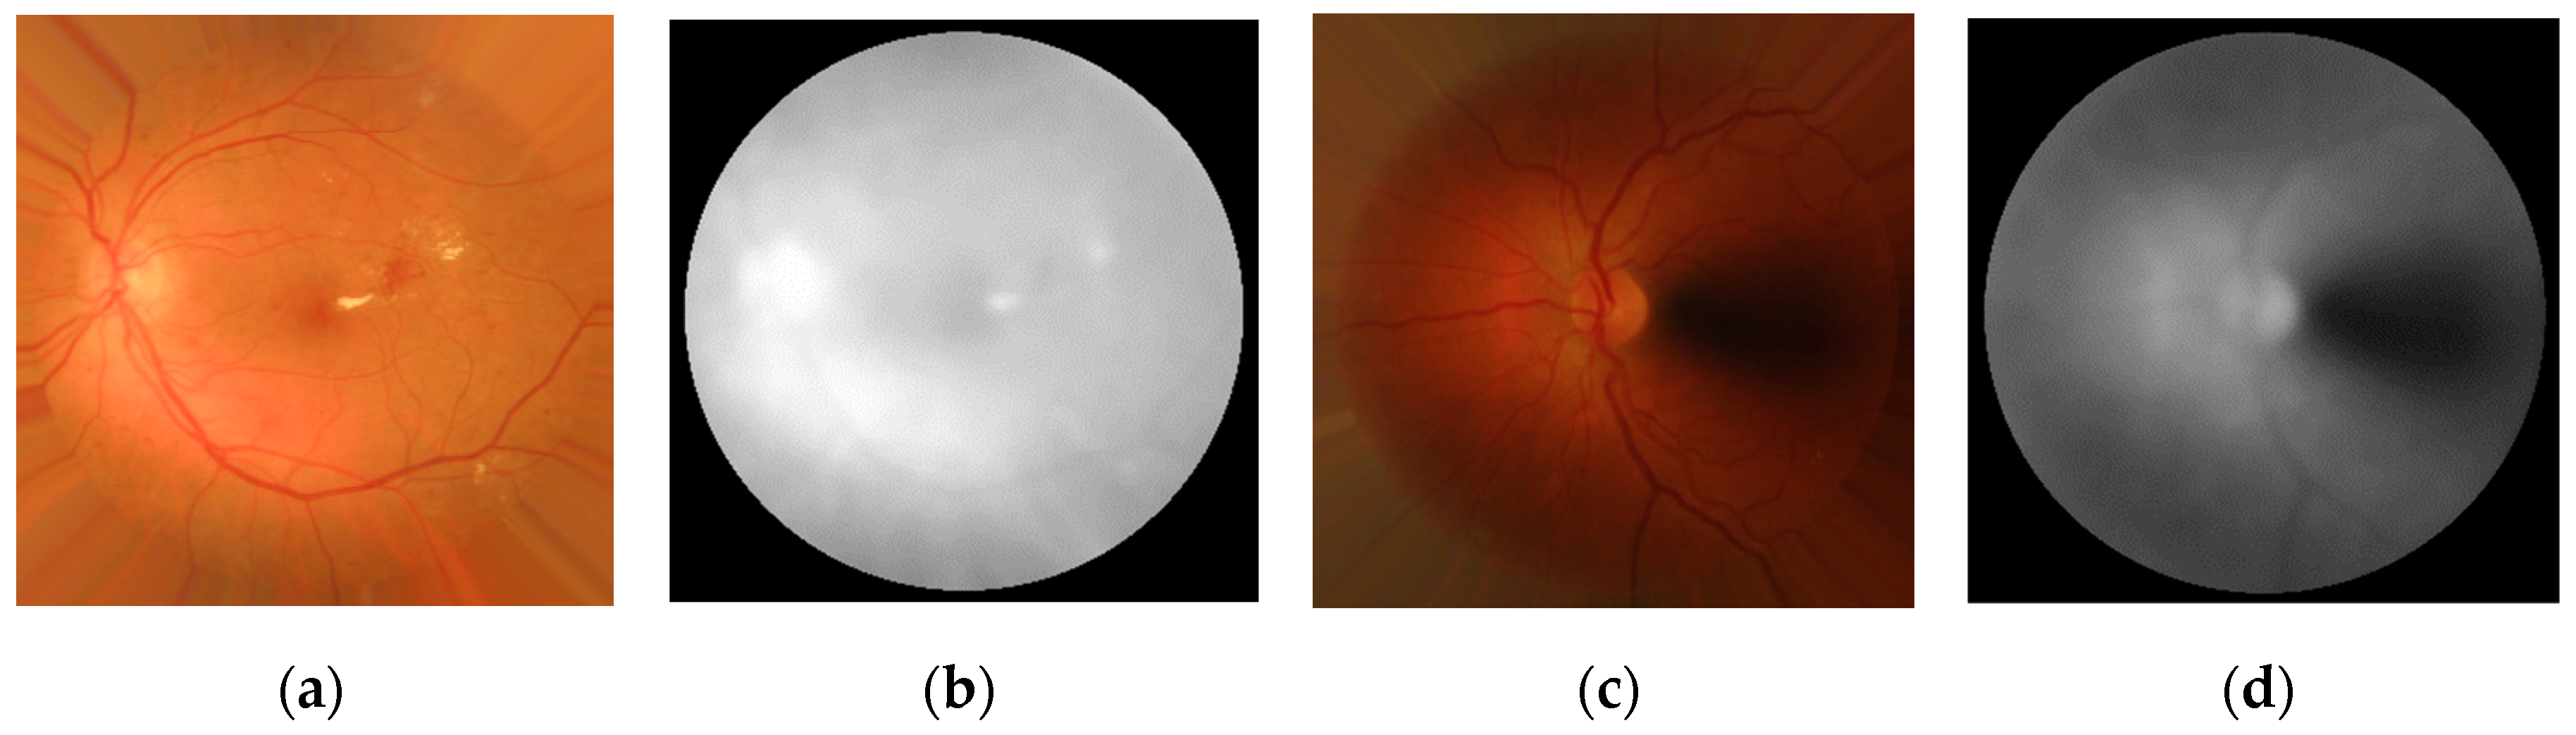
3.2.4. Luminosity Features
3.3. Feature Selection: Fast Correlation-Based Filter
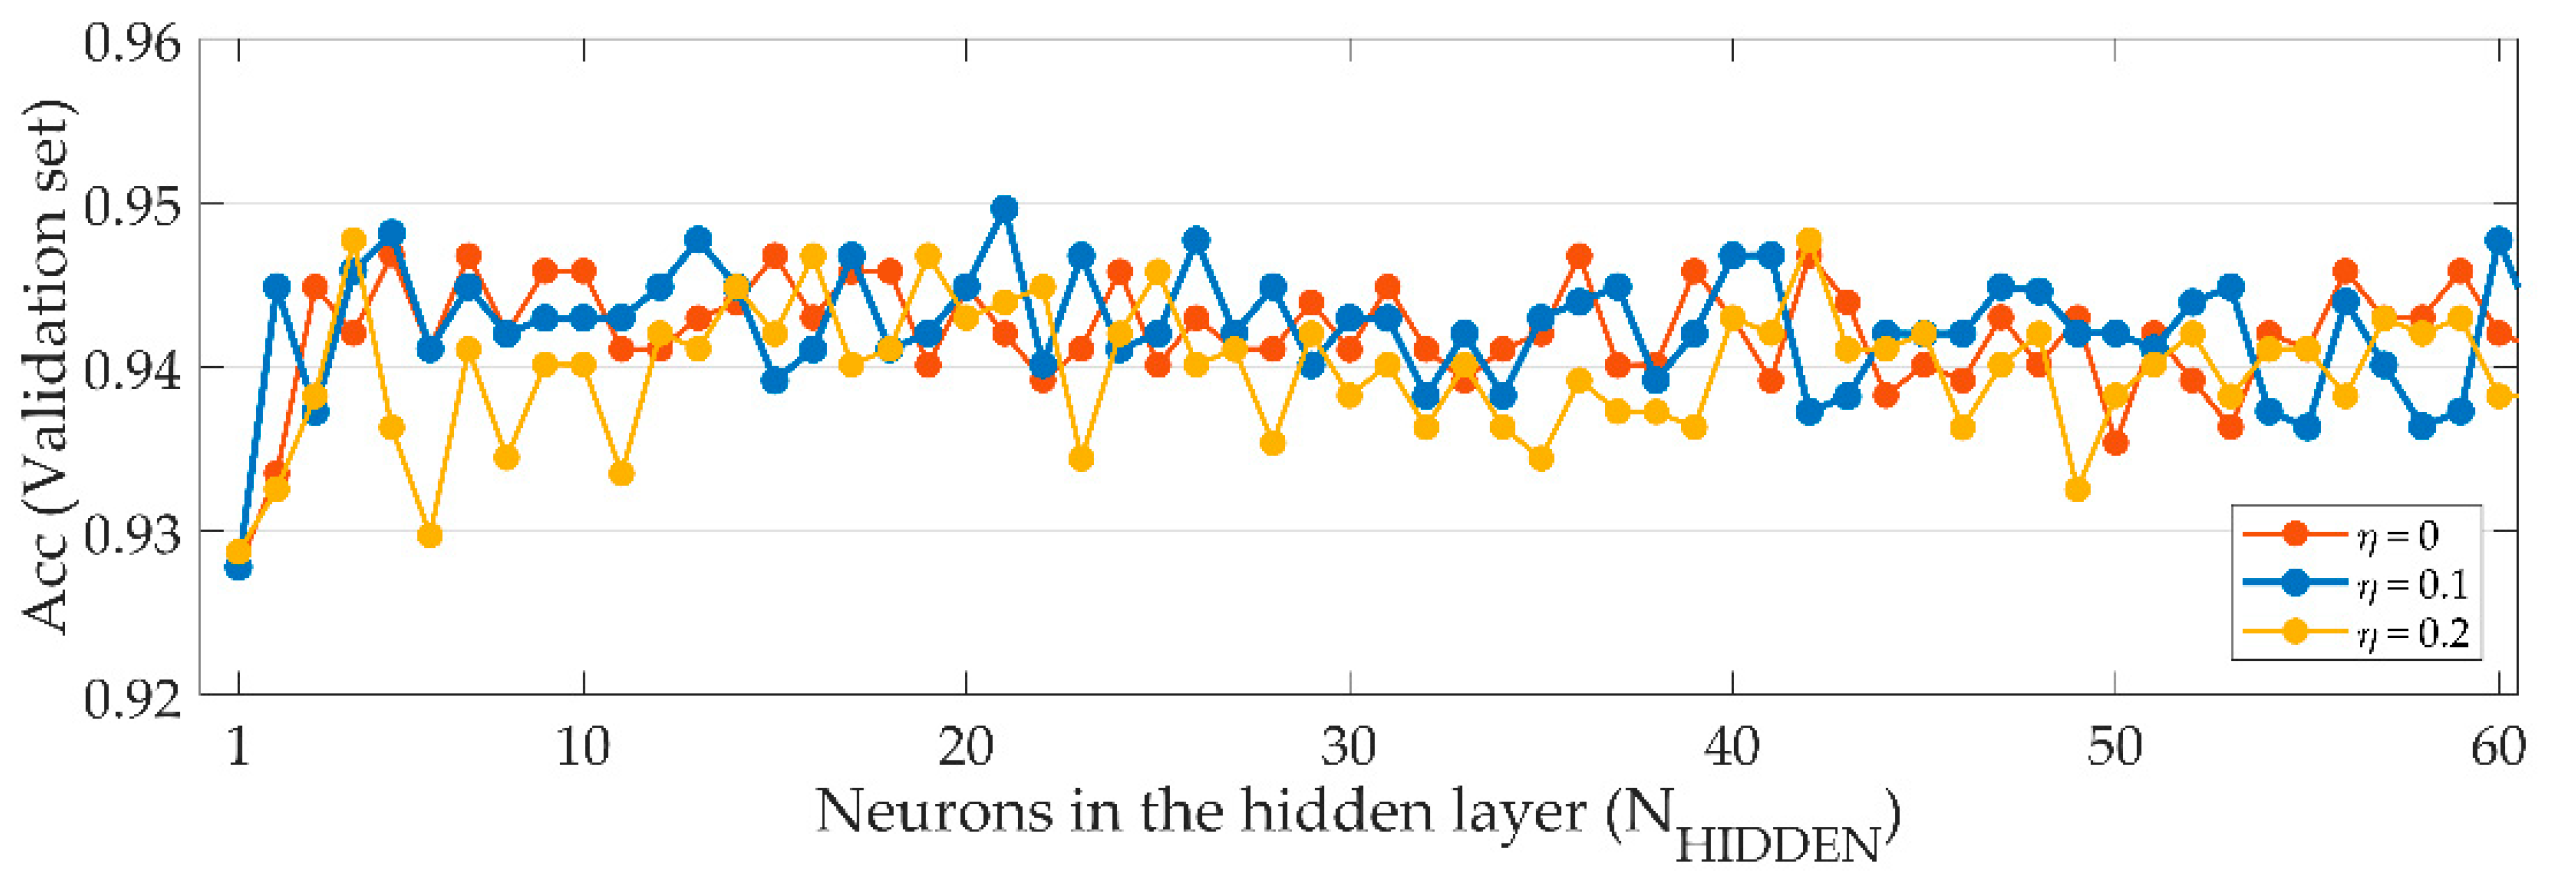
3.4. Classification: Multilayer Perceptron Neural Network
4. Results
4.1. Performance Evaluation
4.2. Feature Selection Results
4.3. Classification Results
5. Discussion
5.1. Preprocessing
5.2. Feature Extraction
5.3. Feature Selection and Classification
5.4. Results
5.5. Limitations and Future Work
6. Conclusions
Author Contributions
Funding
Conflicts of Interest
References
- Abràmoff, M.D.; Garvin, M.K.; Sonka, M. Retinal Imaging and Image Analysis. IEEE Rev. Biomed. Eng. 2010, 3, 169–208. [Google Scholar] [CrossRef] [Green Version]
- Mookiah, M.R.K.; Acharya, U.R.; Chua, C.K.; Lim, C.M.; Ng, E.Y.K.; Laude, A. Computer-aided diagnosis of diabetic retinopathy: A review. Comput. Biol. Med. 2013, 43, 2136–2155. [Google Scholar] [CrossRef]
- Besenczi, R.; Tóth, J.; Hajdu, A. A review on automatic analysis techniques for color fundus photographs. Comput. Struct. Biotechnol. J. 2016, 14, 371–384. [Google Scholar] [CrossRef] [Green Version]
- Bernardes, R.; Serranho, P.; Lobo, C. Digital ocular fundus imaging: A review. Ophthalmologica 2011, 226, 161–181. [Google Scholar] [CrossRef]
- Paulus, J.; Meier, J.; Bock, R.; Hornegger, J.; Michelson, G. Automated quality assessment of retinal fundus photos. Int. J. Comput. Assist. Radiol. Surg. 2010, 5, 557–564. [Google Scholar] [CrossRef] [PubMed] [Green Version]
- Bartling, H.; Wanger, P.; Martin, L. Automated quality evaluation of digital fundus photographs. Acta Ophthalmol. 2009, 87, 643–647. [Google Scholar] [CrossRef] [PubMed] [Green Version]
- Shao, F.; Yang, Y.; Jiang, Q.; Jiang, G.; Ho, Y.S. Automated quality assessment of fundus images via analysis of illumination, naturalness and structure. IEEE Access 2018, 6, 806–817. [Google Scholar] [CrossRef]
- Fleming, A.D.; Philip, S.; Goatman, K.A.; Sharp, P.F.; Olson, J.A. Automated clarity assessment of retinal images using regionally based structural and statistical measures. Med. Eng. Phys. 2012, 34, 849–859. [Google Scholar] [CrossRef] [PubMed]
- Scanlon, P.H.; Malhotra, R.; Greenwood, R.H.; Aldington, S.J.; Foy, C.; Flatman, M.; Downes, S. Comparison of two reference standards in validating two field mydriatic digital photography as a method of screening for diabetic retinopathy. Br. J. Ophthalmol. 2003, 87, 1258–1263. [Google Scholar] [CrossRef] [Green Version]
- Zimmer-Galler, I.; Zeimer, R. Results of implementation of the DigiScope for diabetic retinopathy assessment in the primary care environment. Telemed. J. e-Health 2006, 12, 89–98. [Google Scholar] [CrossRef]
- Welikala, R.A.; Fraz, M.M.; Foster, P.J.; Whincup, P.H.; Rudnicka, A.R.; Owen, C.G.; Strachan, D.P.; Barman, S.A.; Aslam, T.; Barman, S.; et al. Automated retinal image quality assessment on the UK Biobank dataset for epidemiological studies. Comput. Biol. Med. 2016, 71, 67–76. [Google Scholar] [CrossRef] [PubMed] [Green Version]
- Pires Dias, J.M.; Oliveira, C.M.; Da Silva Cruz, L.A. Retinal image quality assessment using generic image quality indicators. Inf. Fusion 2014, 19, 73–90. [Google Scholar] [CrossRef]
- Usher, D.B.; Himaga, M.; Dumskyj, M.J.; Boyce, J.F. Automated assessment of digital fundus image quality using detected vessel area. In Proceedings of the Medical Image Understanding and Analysis, Sheffield, UK, 10–11 July 2003; pp. 81–84. [Google Scholar]
- Fleming, A.D.; Philip, S.; Goatman, K.A.; Olson, J.A.; Sharp, P.F. Automated assessment of diabetic retinal image quality based on clarity and field definition. Investig. Ophthalmol. Vis. Sci. 2006, 47, 1120–1125. [Google Scholar] [CrossRef] [PubMed]
- Niemeijer, M.; Abràmoff, M.D.; van Ginneken, B. Image structure clustering for image quality verification of color retina images in diabetic retinopathy screening. Med. Image Anal. 2006, 10, 888–898. [Google Scholar] [CrossRef]
- Giancardo, L.; Meriaudeau, F.; Karnowski, T.P.; Chaum, E.; Tobin, K. Quality Assessment of Retinal Fundus Images using Elliptical Local Vessel Density. In New Developments in Biomedical Engineering; InTech: Rijeka, Croatia, 2010. [Google Scholar] [Green Version]
- Lee, S.C.; Wang, Y. Automatic retinal image quality assessment and enhancement. In Proceedings of the Medical Imaging 1999: Image Processing, San Diego, CA, USA, 21 May 1999; Hanson, K.M., Ed.; pp. 1581–1590. [Google Scholar]
- Lalonde, M.; Gagnon, L.; Boucher, M.-C. Automatic visual quality assessment in optical fundus images. In Proceedings of the Vision Interface, Ottawa, ON, Canada, 7–9 June 2001; Volume 32, pp. 259–264. [Google Scholar]
- Lin, J.-W.; Weng, Q.; Xue, L.-Y.; Cao, X.-R.; Yu, L. A retinal image sharpness metric based on histogram of edge width. J. Algorithms Comput. Technol. 2017, 11, 292–300. [Google Scholar] [CrossRef]
- Davis, H.; Russell, S.; Barriga, E.; Abramoff, M.; Soliz, P. Vision-based, real-time retinal image quality assessment. In Proceedings of the 2009 22nd IEEE International Symposium on Computer-Based Medical Systems, Albuquerque, NM, USA, 2–5 August 2009; pp. 1–6. [Google Scholar]
- Fasih, M.; Langlois, J.M.P.; Ben Tahar, H.; Cheriet, F. Retinal image quality assessment using generic features. In Proceedings of the SPIE Medical Imaging 2014: Computer-Aided Diagnosis, San Diego, CA, USA, 24 March 2014; Aylward, S., Hadjiiski, L.M., Eds.; p. 90352Z. [Google Scholar]
- Wang, S.; Jin, K.; Lu, H.; Cheng, C.; Ye, J.; Qian, D. Human Visual System-Based Fundus Image Quality Assessment of Portable Fundus Camera Photographs. IEEE Trans. Med. Imaging 2016, 35, 1046–1055. [Google Scholar] [CrossRef]
- Remeseiro, B.; Mendonca, A.M.; Campilho, A. Objective quality assessment of retinal images based on texture features. In Proceedings of the 2017 International Joint Conference on Neural Networks (IJCNN), Anchorage, Alaska, 14–19 May 2017; pp. 4520–4527. [Google Scholar]
- Marrugo, A.G.; Millán, M.S.; Cristóbal, G.; Gabarda, S.; Abril, H.C. No-reference Quality Metrics for Eye Fundus Imaging. In Lecture Notes in Computer Science (Including Subseries Lecture Notes in Artificial Intelligence and Lecture Notes in Bioinformatics); Springer: Berlin, Germany, 2011; Volume 6854, pp. 486–493. ISBN 9783642236716. [Google Scholar]
- Marrugo, A.G.; Millán, M.S.; Cristóbal, G.; Gabarda, S.; Abril, H.C. Anisotropy-based robust focus measure for non-mydriatic retinal imaging. J. Biomed. Opt. 2012, 17, 0760211. [Google Scholar] [CrossRef] [Green Version]
- Abdel-Hamid, L.; El-Rafei, A.; El-Ramly, S.; Michelson, G.; Hornegger, J. Retinal image quality assessment based on image clarity and content. J. Biomed. Opt. 2016, 21, 096007. [Google Scholar] [CrossRef]
- Abdel-Hamid, L.; El-Rafei, A.; Michelson, G. No-reference quality index for color retinal images. Comput. Biol. Med. 2017, 90, 68–75. [Google Scholar] [CrossRef]
- Veiga, D.; Pereira, C.; Ferreira, M.; Gonçalves, L.; Monteiro, J. Quality evaluation of digital fundus images through combined measures. J. Med. Imaging 2014, 1, 014001. [Google Scholar] [CrossRef] [Green Version]
- Sevik, U.; Köse, C.; Berber, T.; Erdöl, H. Identification of suitable fundus images using automated quality assessment methods. J. Biomed. Opt. 2014, 19, 046006. [Google Scholar] [CrossRef] [PubMed]
- Saha, S.K.; Fernando, B.; Cuadros, J.; Xiao, D.; Kanagasingam, Y. Automated Quality Assessment of Colour Fundus Images for Diabetic Retinopathy Screening in Telemedicine. J. Digit. Imaging 2018, 31, 869–878. [Google Scholar] [CrossRef]
- Zago, G.T.; Andreão, R.V.; Dorizzi, B.; Teatini Salles, E.O. Retinal image quality assessment using deep learning. Comput. Biol. Med. 2018, 103, 64–70. [Google Scholar] [CrossRef] [PubMed]
- Moorthy, A.K.; Bovik, A.C. A Two-Step Framework for Constructing Blind Image Quality Indices. IEEE Signal Process. Lett. 2010, 17, 513–516. [Google Scholar] [CrossRef]
- Mittal, A.; Moorthy, A.K.; Bovik, A.C. No-reference image quality assessment in the spatial domain. IEEE Trans. Image Process. 2012, 21, 4695–4708. [Google Scholar] [CrossRef] [PubMed]
- Mittal, A.; Soundararajan, R.; Bovik, A.C. Making a “Completely Blind” Image Quality Analyzer. IEEE Signal Process. Lett. 2013, 20, 209–212. [Google Scholar] [CrossRef]
- Liu, L.; Liu, B.; Huang, H.; Bovik, A.C. No-reference image quality assessment based on spatial and spectral entropies. Signal Process. Image Commun. 2014, 29, 856–863. [Google Scholar] [CrossRef]
- Li, L.; Xia, W.; Lin, W.; Fang, Y.; Wang, S. No-Reference and Robust Image Sharpness Evaluation Based on Multiscale Spatial and Spectral Features. IEEE Trans. Multimed. 2017, 19, 1030–1040. [Google Scholar] [CrossRef]
- Yang, X.; Li, F.; Zhang, W.; He, L. Blind Image Quality Assessment of Natural Scenes Based on Entropy Differences in the DCT domain. Entropy 2018, 20, 885. [Google Scholar] [CrossRef]
- Jiménez-García, J.; Romero-Oraá, R.; García, M.; López, M.I.; Hornero, R. Evaluación automática de la calidad en retinografías mediante clasificación de características globales de imágenes. In Proceedings of the XXXVI Congreso Anual de la Sociedad Española de Ingeniería Biomédica (CASEIB 2018), Ciudad Real, Spain, 21–23 November 2018; pp. 29–32. [Google Scholar]
- García, M.; López, M.I.; Álvarez, D.; Hornero, R. Assessment of four neural network based classifiers to automatically detect red lesions in retinal images. Med. Eng. Phys. 2010, 32, 1085–1093. [Google Scholar] [CrossRef] [PubMed]
- Soares, J.V.B.; Leandro, J.J.G.; Cesar, R.M., Jr.; Jelinek, H.F.; Cree, M.J. Retinal vessel segmentation using the 2-D Gabor wavelet and supervised classification. IEEE Trans. Med. Imaging 2006, 25, 1214–1222. [Google Scholar] [CrossRef] [PubMed] [Green Version]
- Poza, J.; Hornero, R.; Abásolo, D.; Fernández, A.; García, M. Extraction of spectral based measures from MEG background oscillations in Alzheimer’s disease. Med. Eng. Phys. 2007, 29, 1073–1083. [Google Scholar] [CrossRef] [PubMed]
- Bachiller, A.; Lubeiro, A.; Díez, Á.; Suazo, V.; Domínguez, C.; Blanco, J.A.; Ayuso, M.; Hornero, R.; Poza, J.; Molina, V. Decreased entropy modulation of EEG response to novelty and relevance in schizophrenia during a P300 task. Eur. Arch. Psychiatry Clin. Neurosci. 2015, 265, 525–535. [Google Scholar] [CrossRef]
- Rodger, J.A. QuantumIS: A Qualia Consciousness Awareness and Information Theory Quale Approach to Reducing Strategic Decision-Making Entropy. Entropy 2019, 21, 125. [Google Scholar] [CrossRef]
- Gabarda, S.; Cristóbal, G. Blind image quality assessment through anisotropy. J. Opt. Soc. Am. A Opt. Image Sci. Vis. 2007, 24, B42–B51. [Google Scholar] [CrossRef]
- Rangayyan, R.M. Biomedical Image Analysis; CRC Press: Boca Raton, FL, USA, 2005; ISBN 9780849396953. [Google Scholar]
- Koh, J.E.W.; Acharya, U.R.; Hagiwara, Y.; Raghavendra, U.; Tan, J.H.; Sree, S.V.; Bhandary, S.V.; Rao, A.K.; Sivaprasad, S.; Chua, K.C.; et al. Diagnosis of retinal health in digital fundus images using continuous wavelet transform (CWT) and entropies. Comput. Biol. Med. 2017, 84, 89–97. [Google Scholar] [CrossRef] [PubMed]
- Antoine, J.-P.; Carrette, P.; Murenzi, R.; Piette, B. Image analysis with two-dimensional continuous wavelet transform. Signal Process. 1993, 31, 241–272. [Google Scholar] [CrossRef]
- Antoine, J.-P.; Murenzi, R. Two-dimensional directional wavelets and the scale-angle representation. Signal Process. 1996, 52, 259–281. [Google Scholar] [CrossRef] [Green Version]
- Niemeijer, M.; Abràmoff, M.D.; Van Ginneken, B. Segmentation of the optic disc, macula and vascular arch in fundus photographs. IEEE Trans. Med. Imaging 2007, 26, 116–127. [Google Scholar] [CrossRef]
- Aja-Fernandez, S.; San José Estepar, R.; Alberola-Lopez, C.; Westin, C.F. Image quality assessment based on local variance. In Proceedings of the 2006 International Conference of the IEEE Engineering in Medicine and Biology Society, New York, NY, USA, 30 August–3 September 2006; pp. 4815–4818. [Google Scholar]
- Gonzalez, R.C.; Woods, R.E. Digital Image Processing, 3rd ed.; Prentice Hall: Upper Saddle River, NJ, USA, 2008; ISBN 9780135052679. [Google Scholar]
- Zhou, M.; Jin, K.; Wang, S.; Ye, J.; Qian, D. Color Retinal Image Enhancement Based on Luminosity and Contrast Adjustment. IEEE Trans. Biomed. Eng. 2017, 65, 521–527. [Google Scholar] [CrossRef] [PubMed]
- Marín, D.; Aquino, A.; Gegúndez-Arias, M.E.; Bravo, J.M. A new supervised method for blood vessel segmentation in retinal images by using gray-level and moment invariants-based features. IEEE Trans. Med. Imaging 2011, 30, 146–158. [Google Scholar] [CrossRef] [PubMed]
- Guyon, I.; Elisseeff, A. An introduction to variable and feature selection. J. Mach. Learn. Res. 2003, 3, 1157–1182. [Google Scholar]
- Saeys, Y.; Inza, I.; Larrañaga, P. A review of feature selection techniques in bioinformatics. Bioinformatics 2007, 23, 2507–2517. [Google Scholar] [CrossRef] [PubMed] [Green Version]
- Yu, L.; Liu, H. Efficient Feature Selection via Analysis of Relevance and Redundancy. J. Mach. Learn. Res. 2004, 5, 1205–1224. [Google Scholar]
- Witten, I.H.; Frank, E.; Hall, M.A. Data Mining: Practical Machine Learning Tools and Techniques, 3rd ed.; Morgan Kaufmann/Elsevier: Burlington, NJ, USA, 2011; ISBN 978-0-12-374856-0. [Google Scholar]
- Bishop, C.M. Neural Networks for Pattern Recognition; Oxford University Press, Inc.: New York, NY, USA, 1995; ISBN 0198538642. [Google Scholar]
- García, M.; Sánchez, C.I.; López, M.I.; Abásolo, D.; Hornero, R. Neural network based detection of hard exudates in retinal images. Comput. Methods Programs Biomed. 2009, 93, 9–19. [Google Scholar] [CrossRef] [Green Version]
- Bishop, C.M. Pattern Recognition and Machine Learning; Springer: Berlin/Heidelberg, Germany, 2006; ISBN 978-0387-31073-2. [Google Scholar]
- Chawla, N.V.; Bowyer, K.W.; Hall, L.O.; Kegelmeyer, W.P. SMOTE: Synthetic minority over-sampling technique. J. Artif. Intell. Res. 2002, 16, 321–357. [Google Scholar] [CrossRef]
- Fawcett, T. An introduction to ROC analysis. Pattern Recognit. Lett. 2006, 27, 861–874. [Google Scholar] [CrossRef]
- Fathi, A.; Naghsh-Nilchi, A.R. Automatic wavelet-based retinal blood vessels segmentation and vessel diameter estimation. Biomed. Signal Process. Control 2013, 8, 71–80. [Google Scholar] [CrossRef]


| Se (%) | Sp (%) | Acc (%) | PPV (%) | F1 |
|---|---|---|---|---|
| 92.04 | 87.92 | 91.46 | 97.88 | 0.9487 |
© 2019 by the authors. Licensee MDPI, Basel, Switzerland. This article is an open access article distributed under the terms and conditions of the Creative Commons Attribution (CC BY) license (http://creativecommons.org/licenses/by/4.0/).
Share and Cite
Jiménez-García, J.; Romero-Oraá, R.; García, M.; López-Gálvez, M.I.; Hornero, R. Combination of Global Features for the Automatic Quality Assessment of Retinal Images. Entropy 2019, 21, 311. https://0-doi-org.brum.beds.ac.uk/10.3390/e21030311
Jiménez-García J, Romero-Oraá R, García M, López-Gálvez MI, Hornero R. Combination of Global Features for the Automatic Quality Assessment of Retinal Images. Entropy. 2019; 21(3):311. https://0-doi-org.brum.beds.ac.uk/10.3390/e21030311
Chicago/Turabian StyleJiménez-García, Jorge, Roberto Romero-Oraá, María García, María I. López-Gálvez, and Roberto Hornero. 2019. "Combination of Global Features for the Automatic Quality Assessment of Retinal Images" Entropy 21, no. 3: 311. https://0-doi-org.brum.beds.ac.uk/10.3390/e21030311