Estimating Postural Stability Using Improved Permutation Entropy via TUG Accelerometer Data for Community-Dwelling Elderly People


Abstract
:1. Introduction
2. Materials and Methods
2.1. Subjects
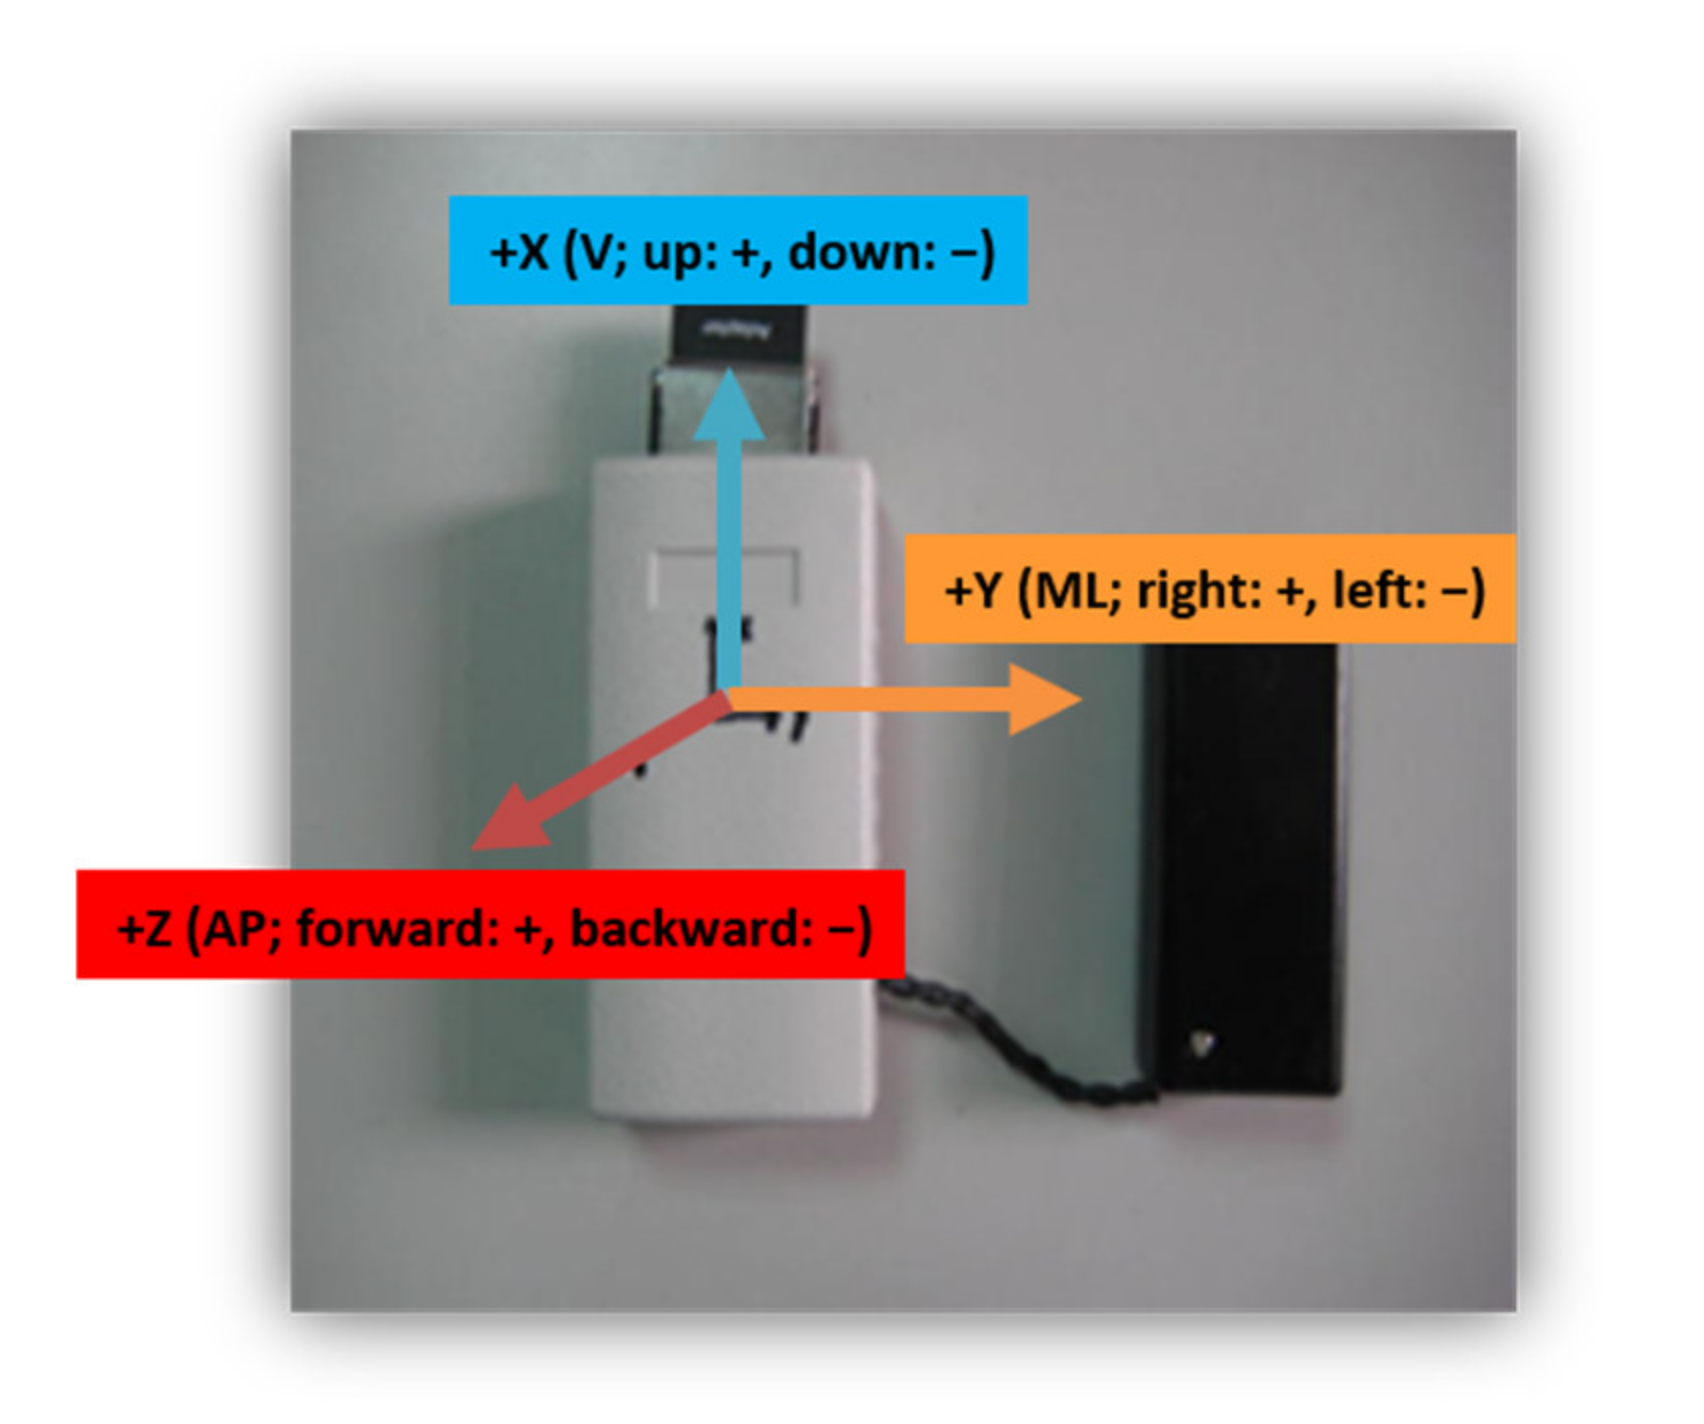
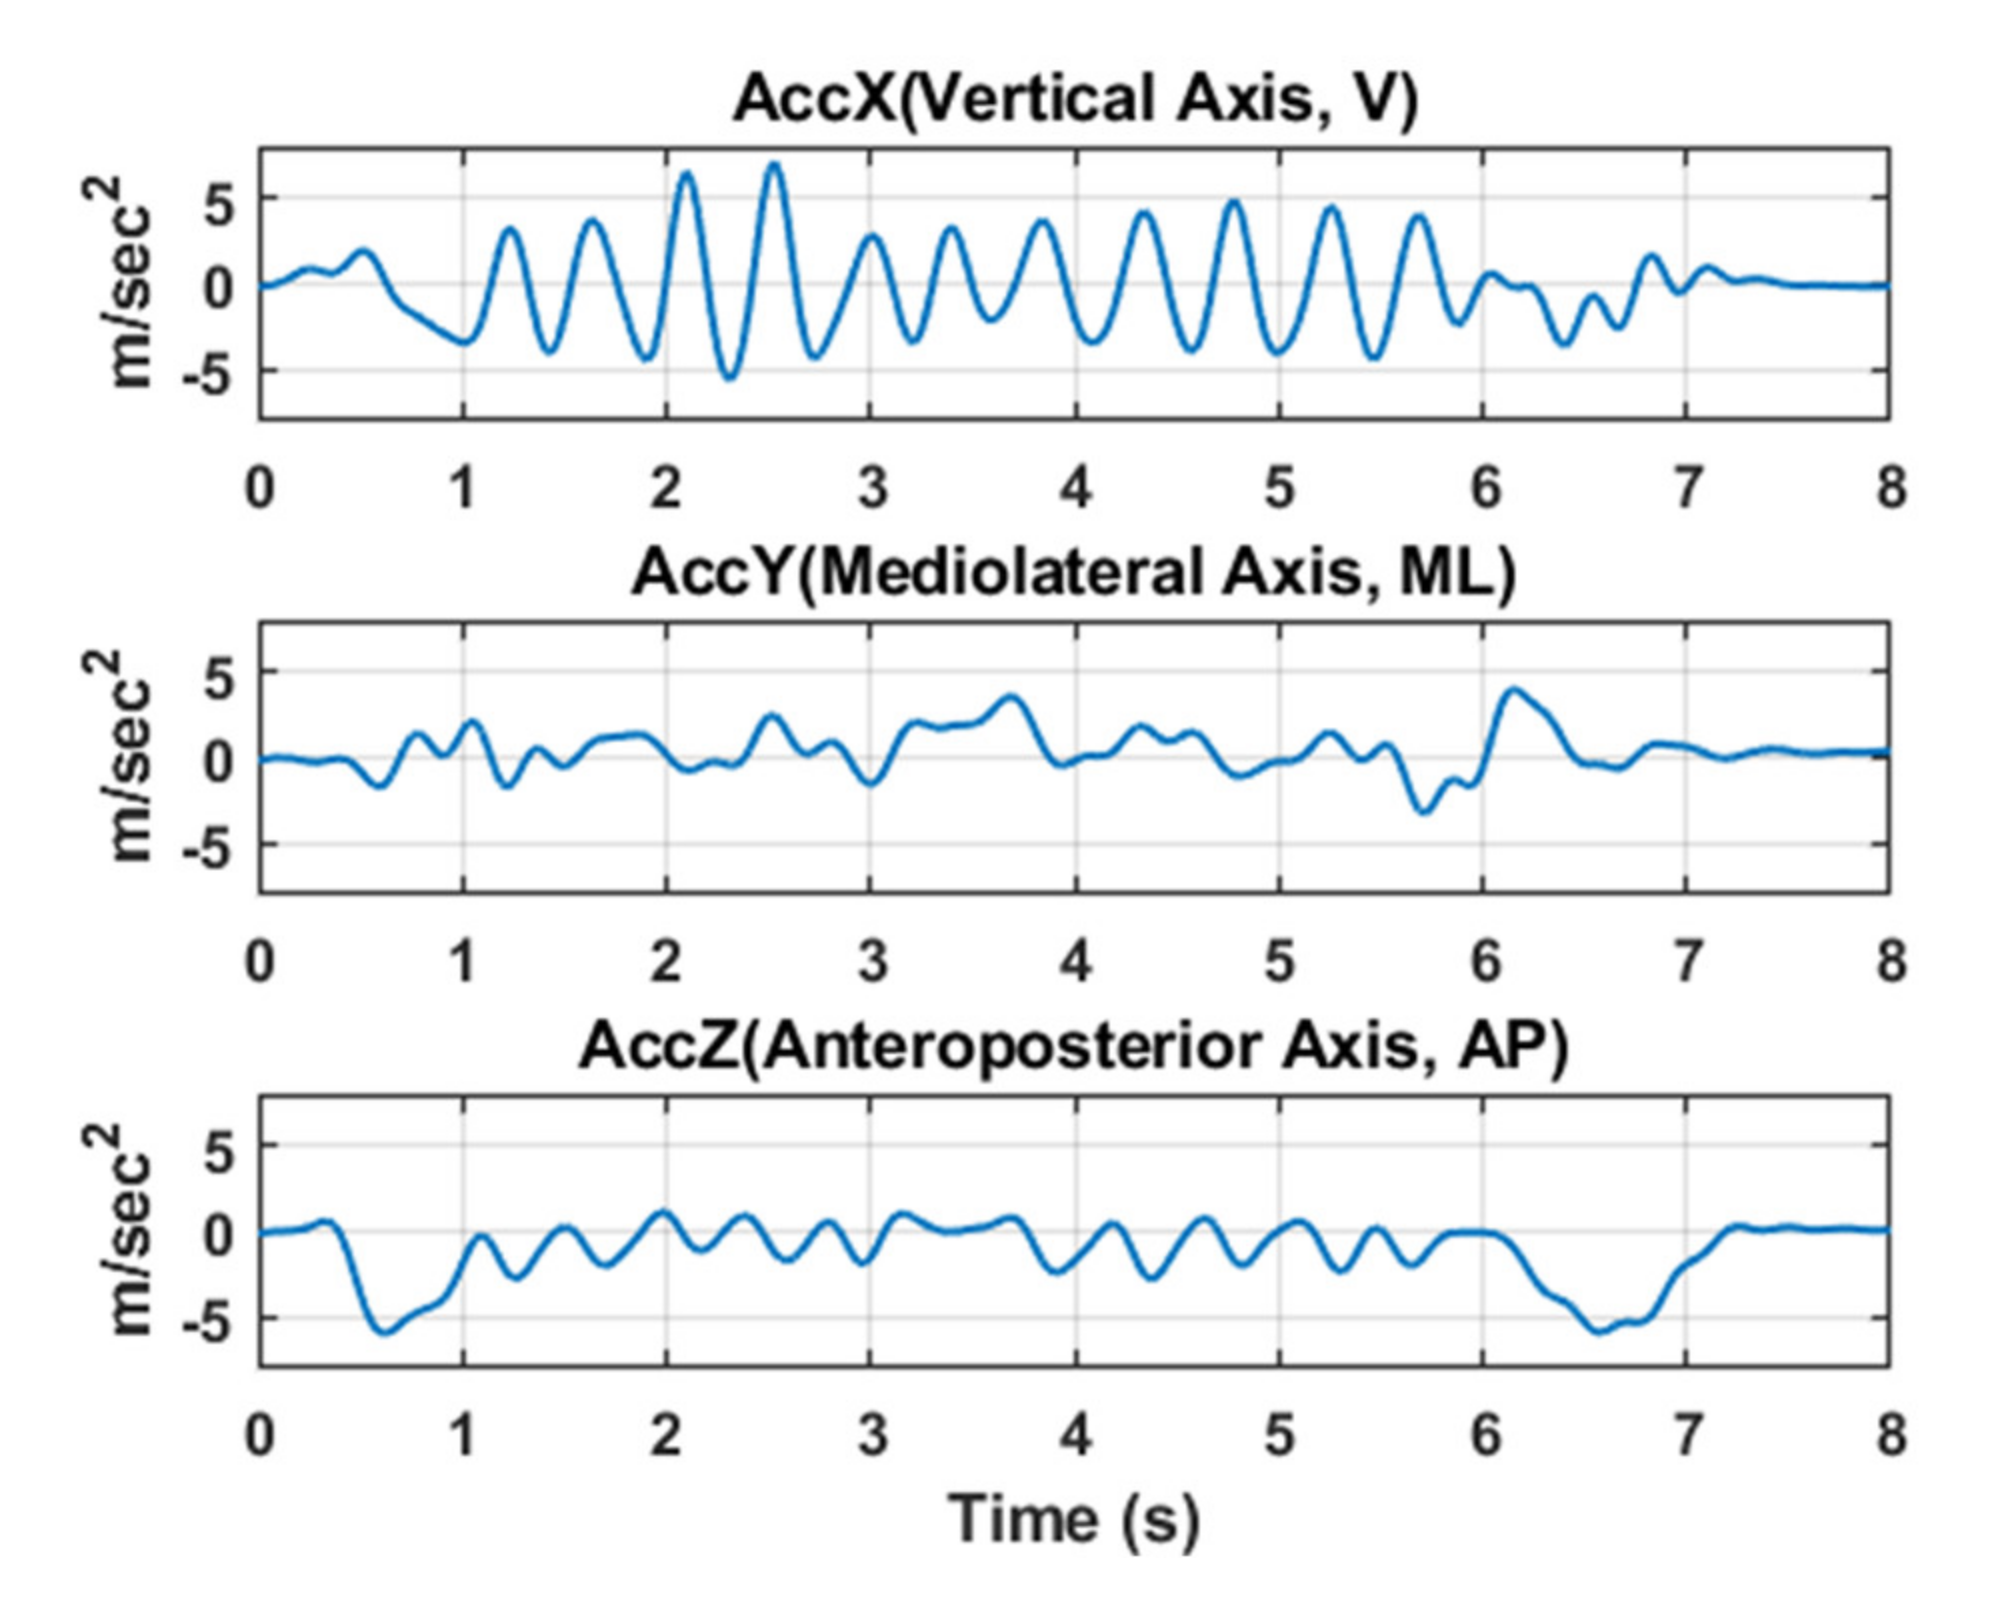
2.2. Sensors Used
2.3. Clinical Testing
2.4. Data Analysis
2.4.1. Entropy Analysis
PE
- (1)
- Partitioning the state space:
- (2)
- Finding the ordinal patterns:
- (3)
- Calculating the relative frequencies and entropy:
WPE
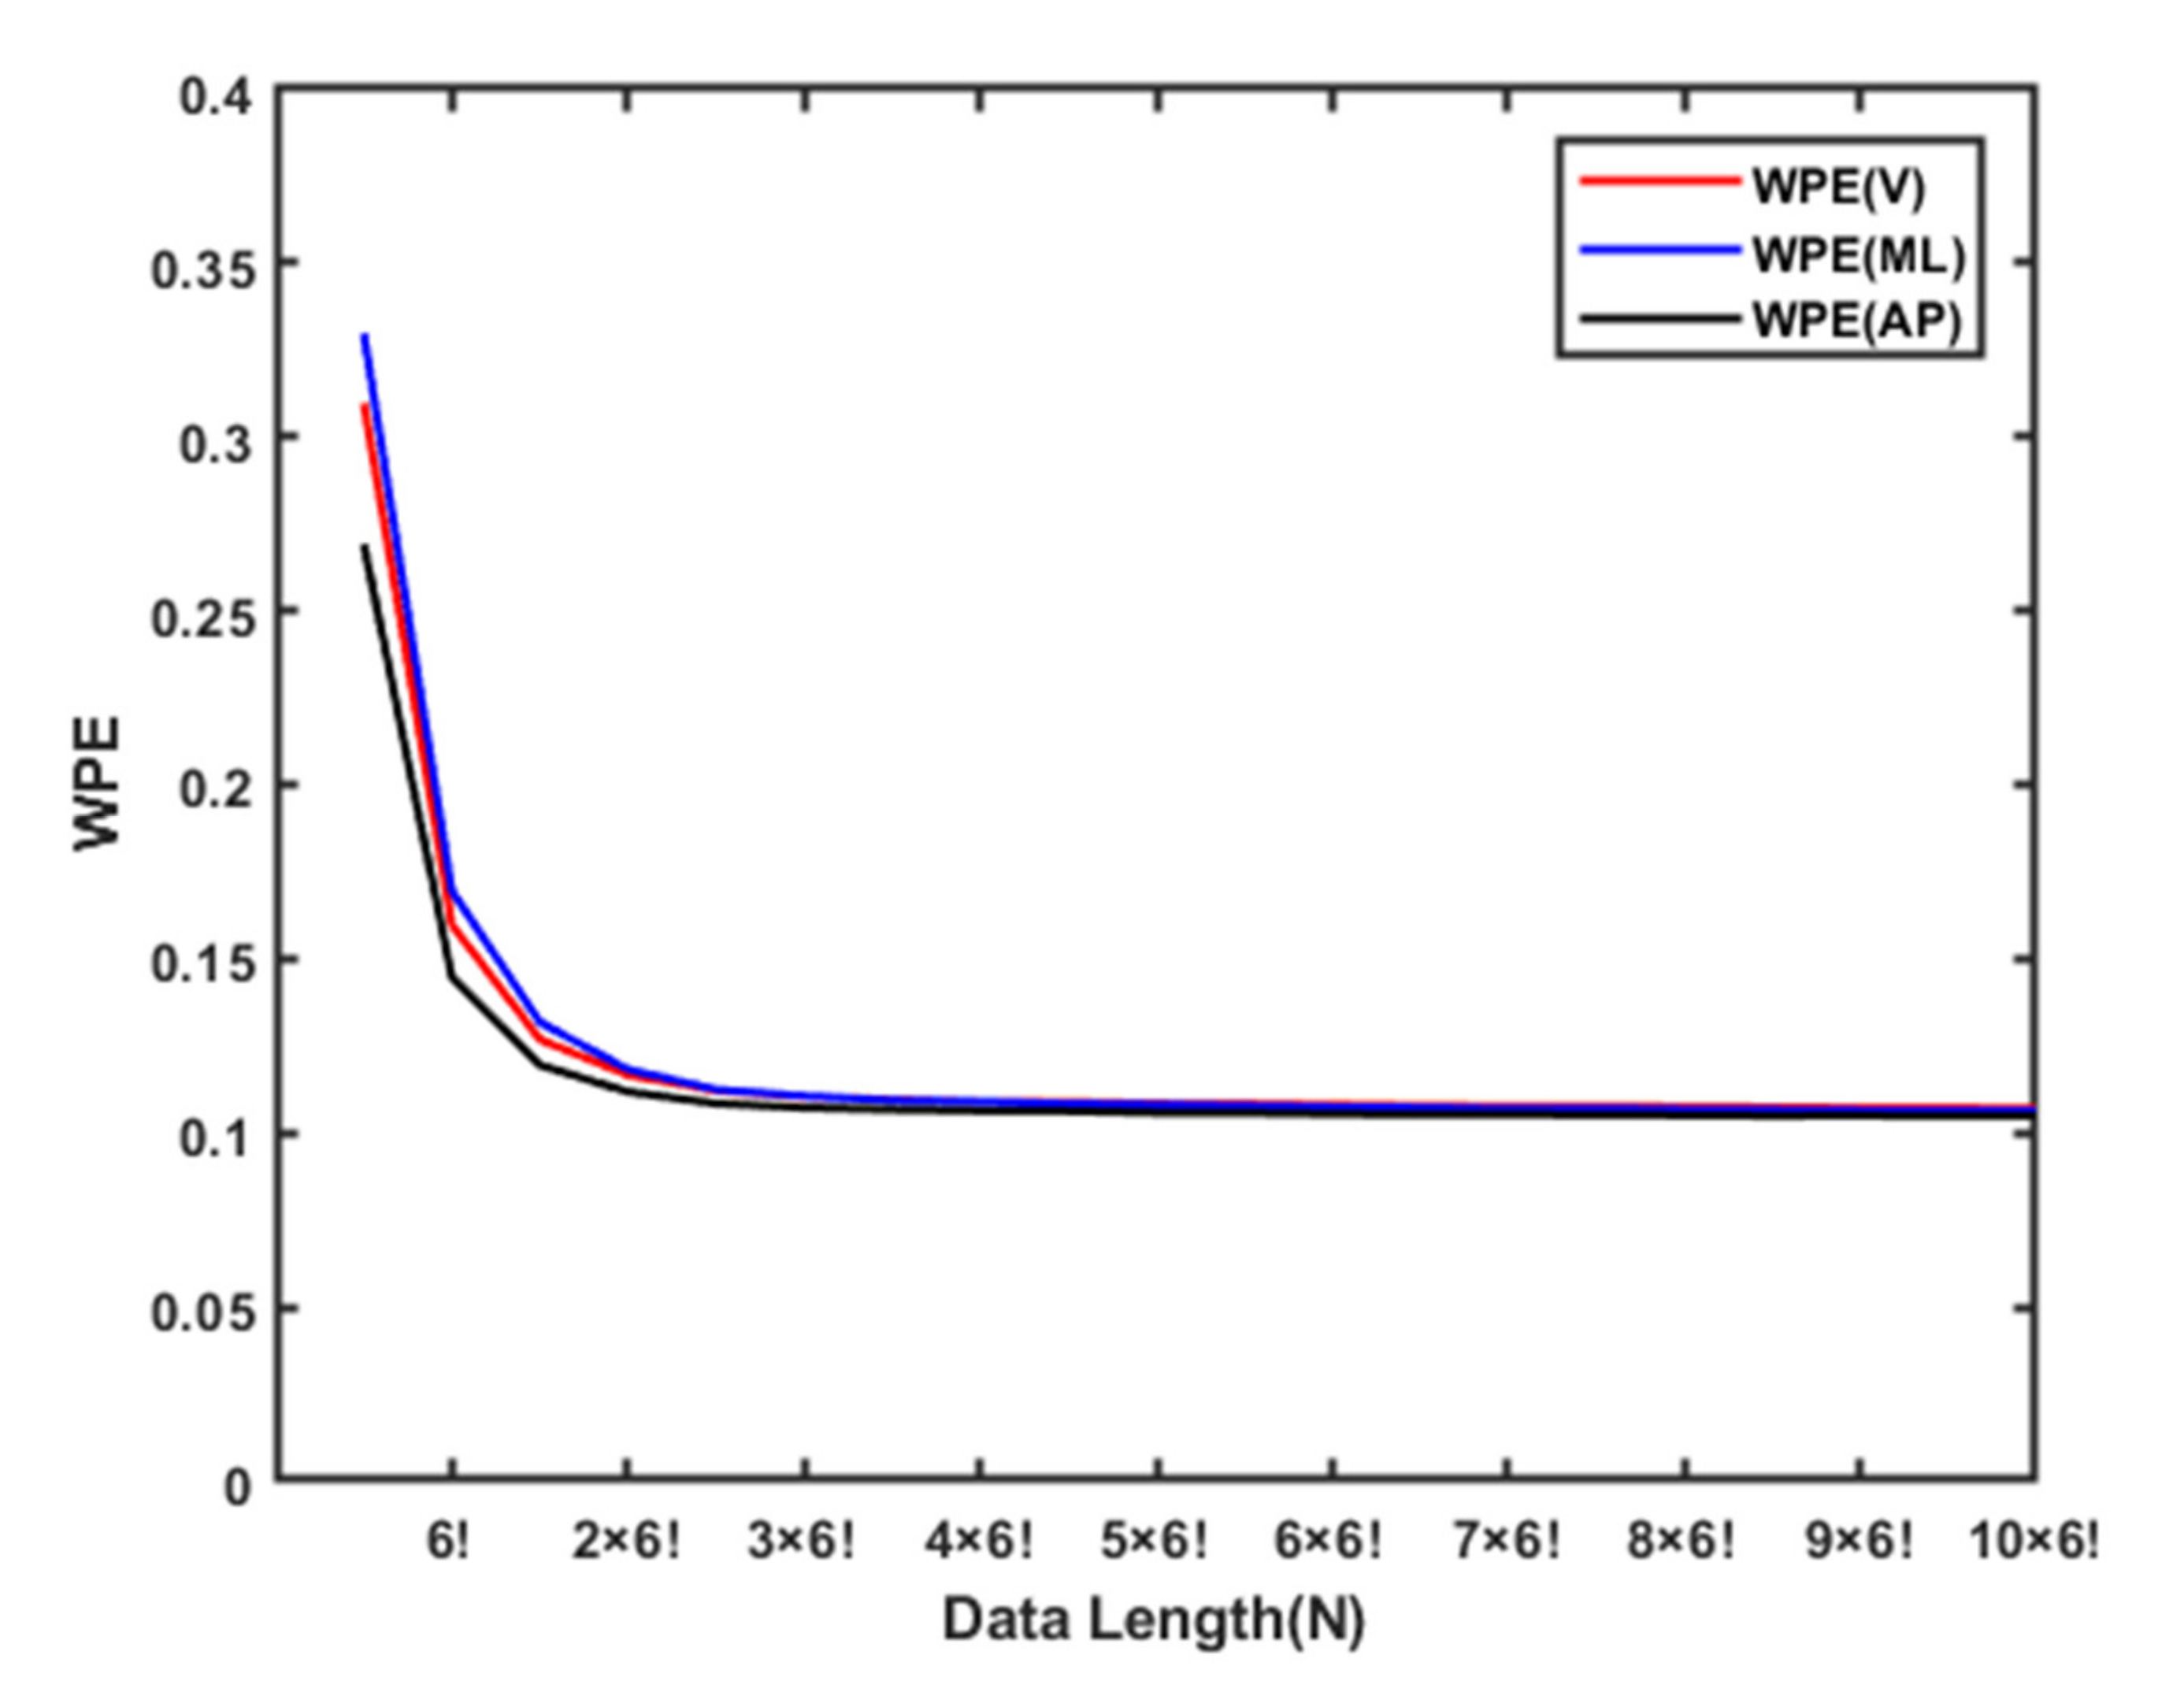
Adaptive Resampling Procedure in PE/WPE
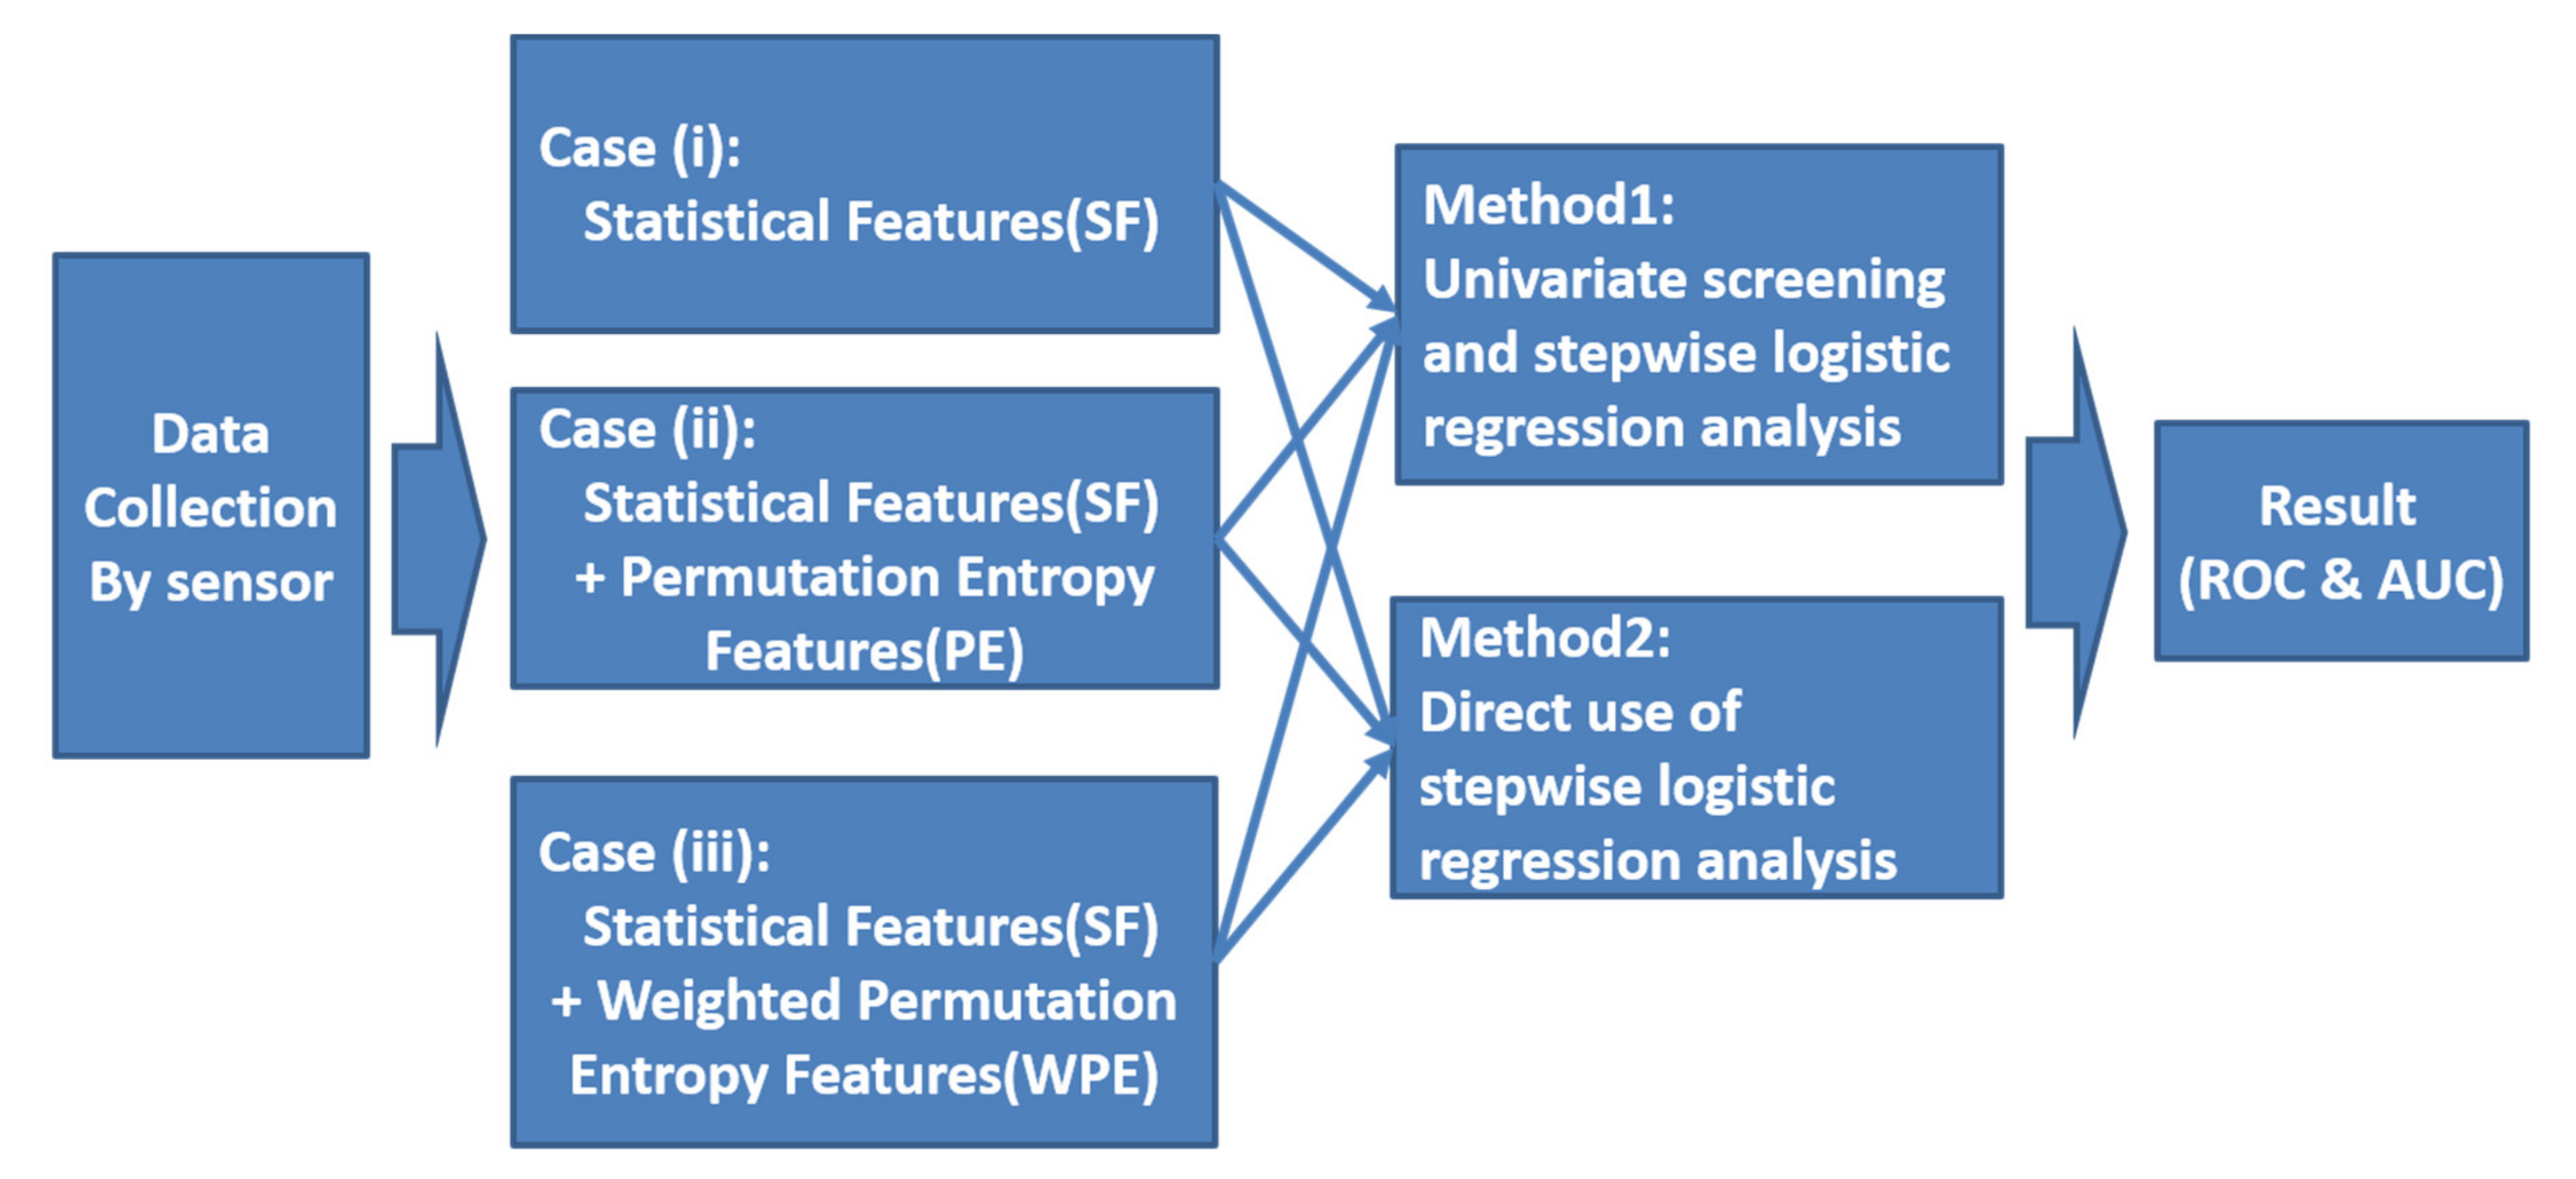
2.5. Statistical Analysis
3. Results
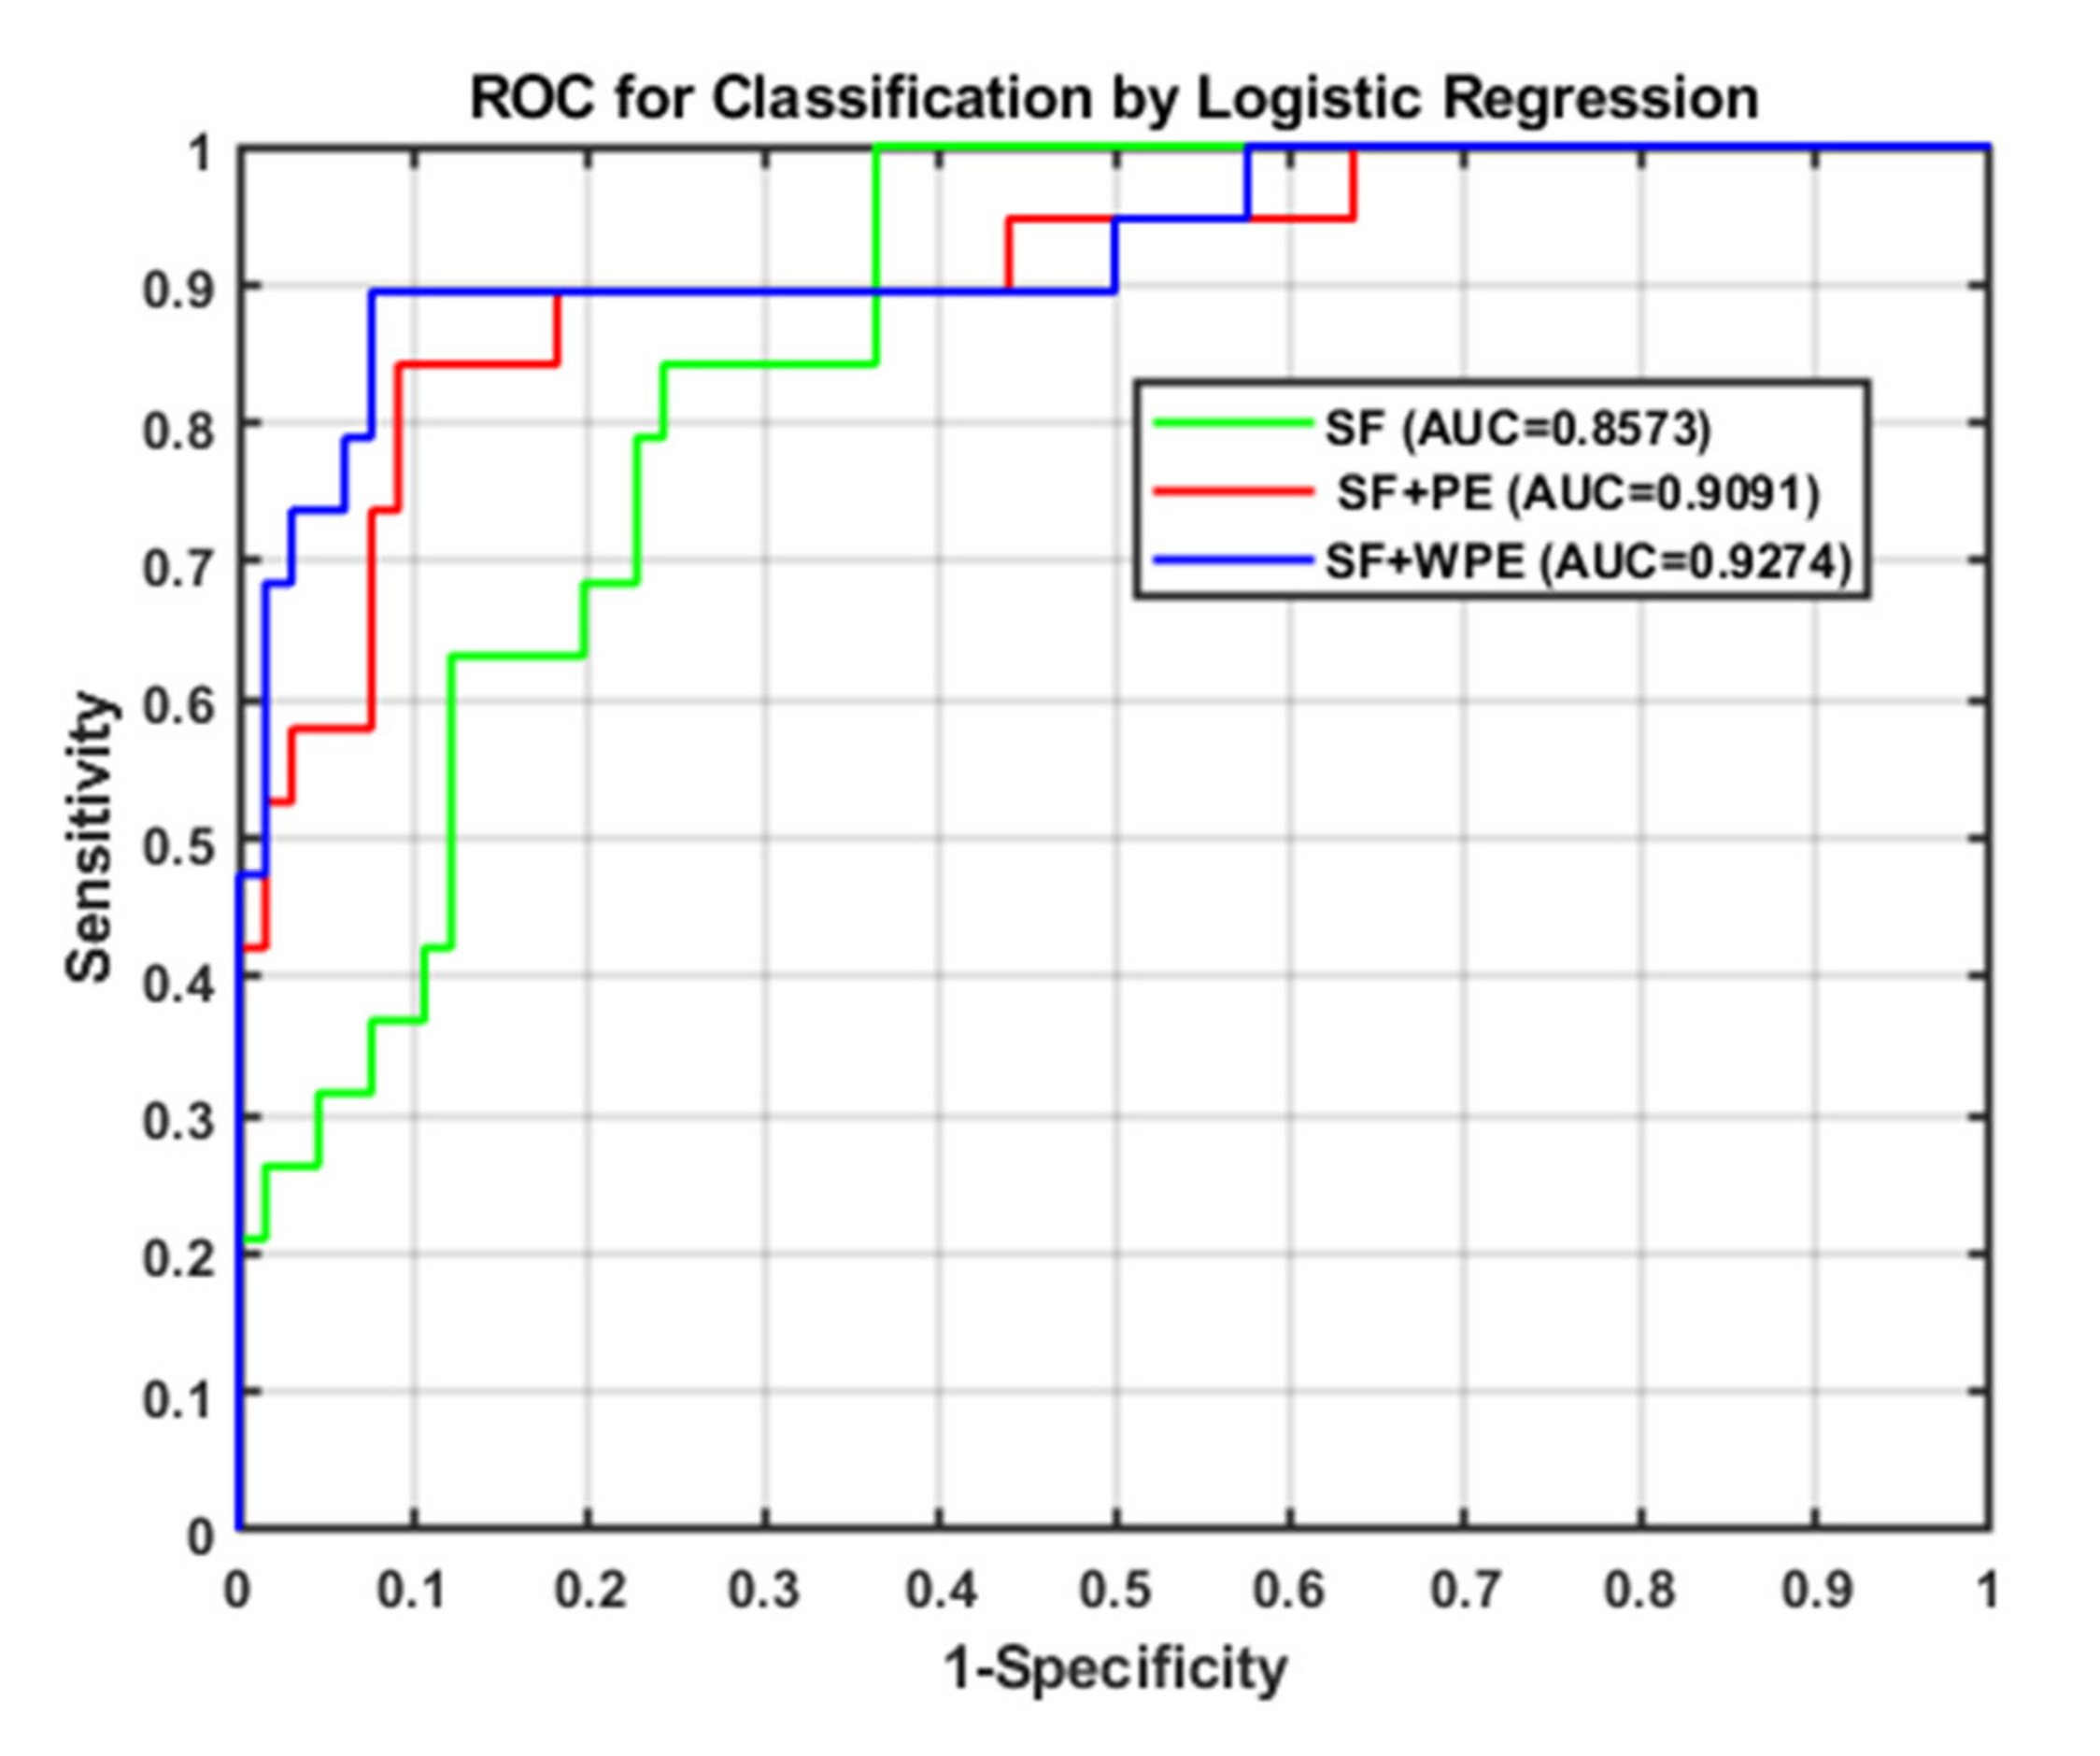
3.1. Univariate Screening and Stepwise Logistic Regression Analysis
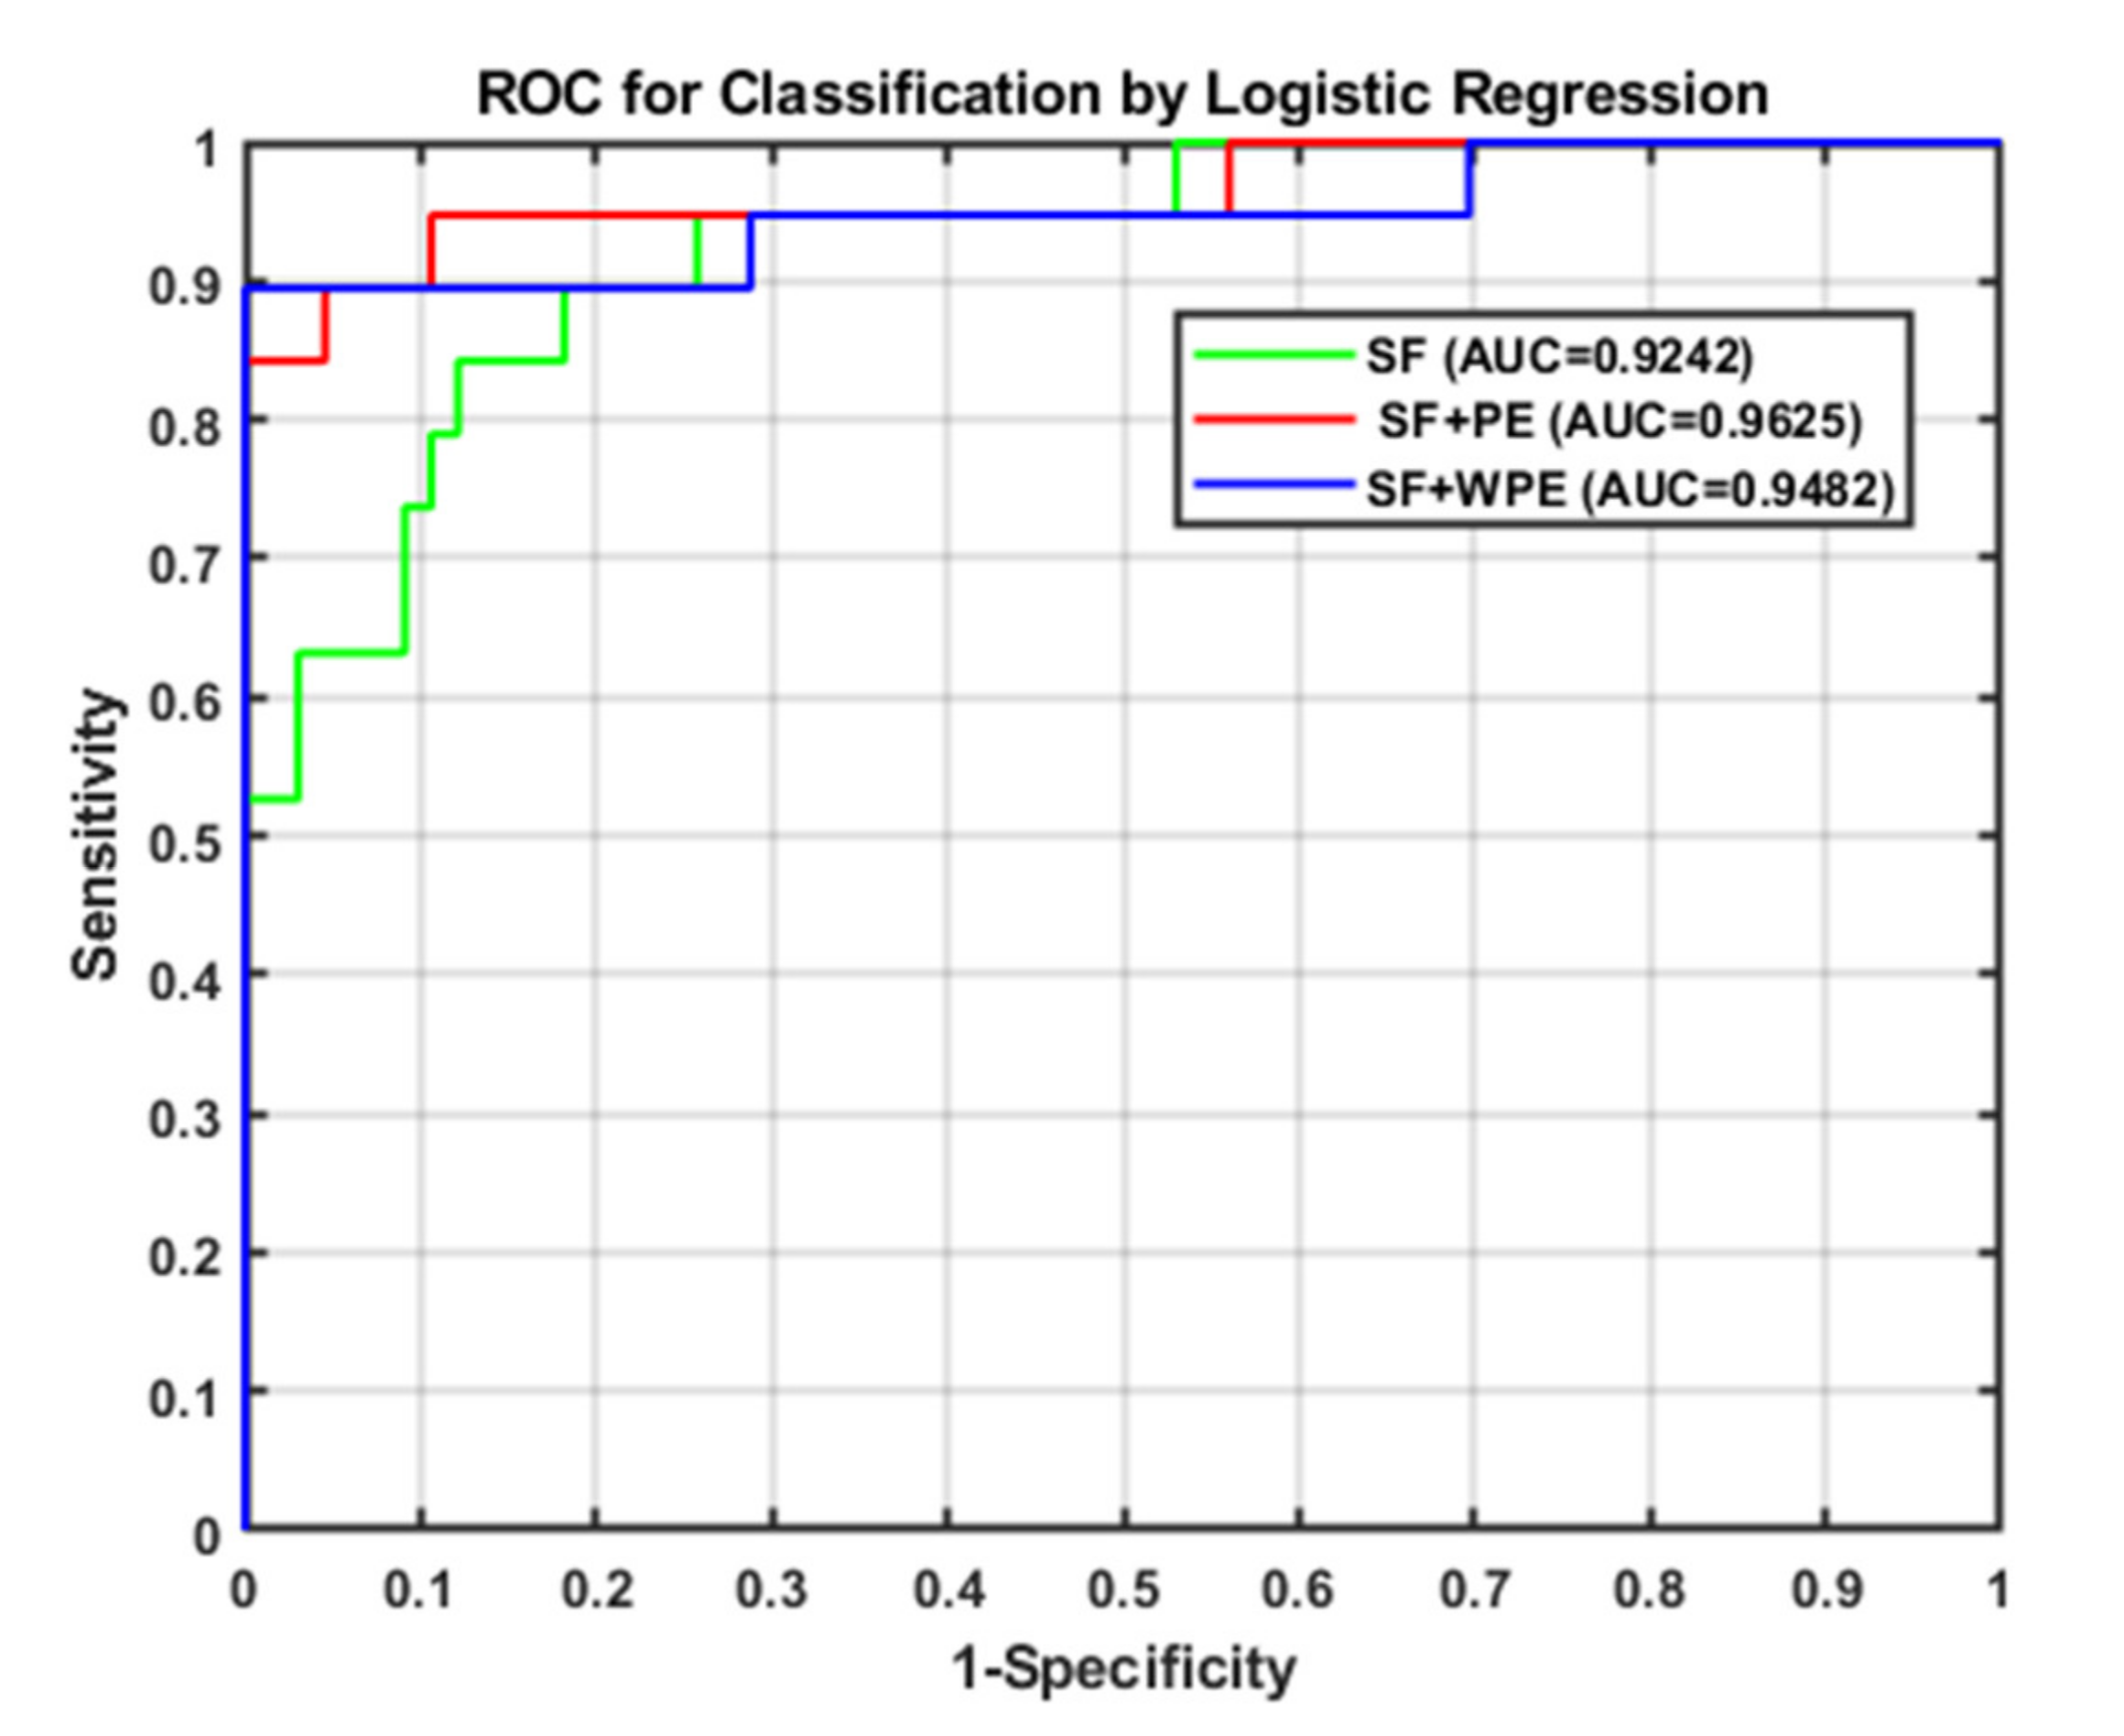
3.2. Direct Use of Stepwise Logistic Regression Analysis
3.3. Comparison between the Subsequent and Direct Logistic Regression Methods
4. Discussion
5. Conclusions
Author Contributions
Funding
Acknowledgments
Conflicts of Interest
References
- Kozak, J.; Kania, K.; Juszczuk, P. Permutation entropy as a measure of information gain/loss in the different symbolic descriptions of financial data. Entropy 2020, 22, 330. [Google Scholar] [CrossRef] [Green Version]
- Bergland, A. Fall risk factors in community-dwelling elderly people. Nor. Epidemiol. 2012, 22. [Google Scholar] [CrossRef] [Green Version]
- World Health Organization. Global Age-Friendly Cities: A Guide; World Health Organization: Geneva, Switzerland, 2007. [Google Scholar]
- Ganz, D.A.; Bao, Y.; Shekelle, P.G.; Rubenstein, L.Z. Will my patient fall? JAMA 2007, 297, 77–86. [Google Scholar] [CrossRef]
- Trisan, C.R. Balance problems and fall risks in the elderly. Phys. Med. Rehabil. Clin. N. Am. 2017, 28, 727–737. [Google Scholar] [CrossRef] [PubMed]
- Hamm, J.; Money, A.G.; Atwal, A.; Paraskevopoulos, I. Fall prevention intervention technologies: A conceptual framework and survey of the state of the art. J. Biomed. Inform. 2016, 59, 319–345. [Google Scholar] [CrossRef] [PubMed] [Green Version]
- Rubenstein, L.Z.; Vivrette, R.; Harker, J.O.; Stevens, J.A.; Kramer, B.J. Validating an evidence-based, self-rated fall risk questionnaire (FRQ) for older adults. J. Saf. Res. 2011, 42, 493–499. [Google Scholar] [CrossRef]
- Halvarsson, A.; Franzén, E.; Ståhle, A. Assessing the relative and absolute reliability of the Falls Efficacy Scale-International questionnaire in elderly individuals with increased fall risk and the questionnaire’s convergent validity in elderly women with osteoporosis. Osteoporos. Int. 2013, 24, 1853–1858. [Google Scholar] [CrossRef]
- Dohrn, I.M.; Hagströmer, M.; Hellenius, M.L.; Ståhle, A. Gait speed, quality of life, and sedentary time are associated with steps per day in community-dwelling older adults with osteoporosis. J. Aging Phys. Act. 2016, 24, 22–31. [Google Scholar] [CrossRef]
- Tzeng, H.M.; Yin, C.Y. Patient Engagement in Hospital Fall Prevention. Nurs. Econ. 2015, 33, 326–334. [Google Scholar]
- Howcroft, J.; Kofman, J.; Lemaire, E.D. Review of fall risk assessment in geriatric populations using inertial sensors. J. Neuroeng. Rehabil. 2013, 10, 91. [Google Scholar] [CrossRef] [Green Version]
- Hsu, Y.C.; Zhao, Y.; Huang, K.H.; Wu, Y.T.; Cabrera, J.; Sun, T.L.; Tsui, K.L. A novel approach for fall risk prediction using the inertial sensor data from the timed-up-and-go test in a community setting. IEEE Sens. J. 2020, 20, 9339–9350. [Google Scholar] [CrossRef]
- Sun, R.; Sosnoff, J.J. Novel sensing technology in fall risk assessment in older adults: A systematic review. BMC Geriatr. 2018, 18, 14. [Google Scholar] [CrossRef] [PubMed] [Green Version]
- Podsiadlo, D.; Richardson, S. The timed “Up & Go”: A test of basic functional mobility for frail elderly persons. J. Am. Geriatr. Soc. 1991, 39, 142–148. [Google Scholar] [PubMed]
- Zakaria, N.A.; Kuwae, Y.; Tamura, T.; Minato, K.; Kanaya, S. Quantitative analysis of fall risk using TUG test. Comput. Methods Biomech. Biomed. Eng. 2015, 18, 426–437. [Google Scholar] [CrossRef] [PubMed]
- Lee, C.H.; Sun, T.L.; Jiang, B.C.; Choi, V.H. Using wearable accelerometers in a community service context to categorize falling behavior. Entropy 2016, 18, 257. [Google Scholar] [CrossRef]
- Jian, M.A. Predicting TUG score from gait characteristics with video analysis and machine learning. bioRxiv 2020. [Google Scholar] [CrossRef] [Green Version]
- Shany, T.; Redmond, S.J.; Narayanan, M.R.; Lovell, N.H. Sensors-based wearable systems for monitoring of human movement and falls. IEEE Sens. J. 2012, 12, 658–670. [Google Scholar] [CrossRef]
- Hausdorff, J.M. Gait dynamics in Parkinson’s disease: Common and distinct behavior among stride length, gait variability, and fractal-like scaling. Chaos 2009, 19, 026113. [Google Scholar] [CrossRef] [Green Version]
- Weiss, A.; Herman, T.; Plotnik, M.; Brozgol, M.; Giladi, N.; Hausdorff, J.M. An instrumented timed up and go: The added value of an accelerometer for identifying fall risk in idiopathic fallers. Physiol. Meas. 2011, 32, 2003–2018. [Google Scholar] [CrossRef]
- Greene, B.R.; McManus, K.; Redmond, S.J.; Caulfield, B.; Quinn, C.C. Digital assessment of falls risk, frailty, and mobility impairment using wearable sensors. NPJ Digit. Med. 2019, 2, 125. [Google Scholar] [CrossRef] [Green Version]
- SEGAL, I. A Note on the Concept of Entropy. J. Math. Mech. 1960, 9, 623–629. Available online: www.jstor.org/stable/24900959 (accessed on 11 August 2020). [CrossRef]
- Pincus, S.M. Approximate entropy as a measure of system complexity. Proc. Natl. Acad. Sci. USA 1991, 88, 2297–2301. [Google Scholar] [CrossRef] [PubMed] [Green Version]
- Richman, J.S.; Lake, D.E.; Moorman, J.R. Sample Entropy, in Methods in Enzymology; Elsevier: Amsterdam, The Netherlands, 2004; pp. 172–184. [Google Scholar]
- Wu, C.H.; Lee, C.H.; Jiang, B.C.; Sun, T.L. Multiscale entropy analysis of postural stability for estimating fall risk via domain knowledge of Timed-Up-And-Go Accelerometer data for elderly people living in a community. Entropy 2019, 21, 1076. [Google Scholar] [CrossRef] [Green Version]
- Bandt, C.; Pompe, B. Permutation entropy: A natural complexity measure for time series. Phys. Rev. Lett. 2002, 88, 174102. [Google Scholar] [CrossRef] [PubMed]
- Gu, Y.; Liang, Z.; Hagihira, S. Use of multiple EEG features and artificial neural network to monitor the depth of anesthesia. Sensors 2019, 19, 2499. [Google Scholar] [CrossRef] [Green Version]
- Riedl, M.; Müller, A.; Wessel, N. Practical considerations of permutation entropy. Eur. Phys. J. Spec. Top. 2013, 222, 249–262. [Google Scholar] [CrossRef]
- Fadlallah, B.; Chen, B.; Keil, A.; Príncipe, J. Weighted-permutation entropy: A complexity measure for time series incorporating amplitude information. Phys. Rev. E 2013, 87, 022911. [Google Scholar] [CrossRef] [Green Version]
- Adkin, A.L.; James, S.F.; Mandar, S.J. Fear of falling and postural control in Parkinson’s disease. Mov. Disord. 2003, 18, 496–502. [Google Scholar] [CrossRef]
- Plotnik, M.; Giladi, N.; Dagan, Y.; Hausdorff, J.M. Postural instability and fall risk in Parkinson’s disease: Impaired dual tasking, pacing, and bilateral coordination of gait during the “ON” medication state. Exp. Brain Res. 2011, 210, 529–538. [Google Scholar] [CrossRef]
- Leverick, G.; Szturm, T.; Wu, C. Investigation of the suitability of utilizing permutation entropy to characterize gait dynamics. In Proceedings of the 2013 ASME Dynamics System and Control Conference, Stanford, CA, USA, 21–23 October 2013. [Google Scholar]
- Karthikeyan, G.; Sheikh, S.G.; Chippala, P. Test-retest reliability of short form of berg balance scale in elderly people. Glob. Adv. Res. J. Med. Med. Sci. 2012, 1, 139–144. [Google Scholar]
- Chou, C.-Y.; Chien, C.W.; Hsueh, I.P.; Sheu, C.F.; Wang, C.H.; Hsieh, C.L. Developing a short form of the Berg Balance Scale for people with stroke. Phys. Ther. 2006, 86, 195–204. [Google Scholar] [CrossRef] [PubMed] [Green Version]
- Shahzad, A.; Ko, S.; Lee, S.; Lee, J.A.; Kim, K. Quantitative assessment of balance impairment for fall-risk estimation using wearable triaxial accelerometer. IEEE Sens. J. 2017, 17, 6743–6751. [Google Scholar] [CrossRef]
- Winter, D. Biomechanics and Motor Control of Human Movement, 4th ed.; John Wiley & Sons: New York, NY, USA, 2009. [Google Scholar]
- Figo, D.; Diniz, P.C.; Ferreira, D.R.; Cardoso, J.M.P. Preprocessing techniques for context recognition from accelerometer data. Pers. Ubiquitous Comput. 2010, 14, 645–662. [Google Scholar] [CrossRef]
- Bao, L.; Intille, S.S. Activity recognition from user-annotated acceleration data. In Proceedings of the Second International Conference on Pervasive Computing, Linz/Vienna, Austria, 21–23 April 2004; pp. 1–17. [Google Scholar]
- Kern, N.; Schiele, B.; Schmidt, A. Multi-sensor activity context detection for wearable computing. In Proceedings of the First European Symposium on Ambient Intelligence (EUSAI), Veldhoven, The Netherlands, 3–4 November 2003; pp. 220–232. [Google Scholar]
- Ravi, N.; Mysore, P.; Littman, M.L. Activity recognition from accelerometer data. In Proceedings of the Seventeenth Conference on Innovative Applications of Artificial Intelligence, Pittsburgh, PA, USA, 9–13 July 2005; pp. 1541–1546. [Google Scholar]
- Kwapisz, J.R.; Weiss, G.M.; Moore, S.A. Activity recognition using cell phone accelerometers. In Proceedings of the 17th Conference on Knowledge Discovery and Data Mining, San Diego, CA, USA, 21–24 August 2011; pp. 74–82. [Google Scholar]
- Garland, J.; Jones, T.R.; Neuder, M.; Morris, V.; White, J.W.C.; Bradley, E. Anomaly detection in paleoclimate records using permutation entropy. Entropy 2019, 20, 931. [Google Scholar] [CrossRef] [Green Version]
- Yang, Q.; Wang, J.A. Wavelet Based Multiscale Weighted Permutation Entropy Method for Sensor Fault Feature Extraction and Identification. J. Sens. 2016. [Google Scholar] [CrossRef] [Green Version]
- Heinze, G.; Dunkler, D. Five myths about variable selection. Transpl. Int. 2017, 30, 6–10. [Google Scholar] [CrossRef]
- Ravelo-García, A.G.; Navarro-Mesa, J.L.; Casanova-Blancas, U.; Martin-Gonzalez, S.; Quintana-Morales, P.; Guerra-Moreno, I.; Canino-Rodríguez, J.M.; Hernández-Pérez, E. Application of the permutation entropy over the heart rate variability for the improvement of electrocardiogram-based sleep breathing pause detection. Entropy 2015, 17, 914–927. [Google Scholar] [CrossRef]
- Ratner, B. Variable selection methods in regression: Ignorable problem, outing notable solution. J. Target. Meas. Anal. Mark. 2010, 18, 65–75. [Google Scholar] [CrossRef]
- Weinstein, M.; Booth, J. Preventing falls in older Adults: A multifactorial approach. Home Health Care Manag. Pract. 2006, 19, 45–50. [Google Scholar] [CrossRef]
- Cho, C.Y.; Kamen, G. Detecting balance deficits in frequent fallers using clinical and quantitative evaluation tools. J. Am. Geriatr. Soc. 1998, 46, 426–430. [Google Scholar] [CrossRef]


| Fall Risk (n = 19) | Non-Fall Risk (n = 66) | p Value | ||
|---|---|---|---|---|
| Statistical Feature | Average ± Standard Deviations | |||
| F1 | Mean_V | 1.0378 ± 0.2909 | 1.4961 ± 0.4715 | 0.000 ** |
| F2 | Mean_ML | 1.0816 ± 0.2842 | 1.0539 ± 0.2332 | 0.701 |
| F3 | Mean_AP | 2.0050 ± 0.6843 | 1.6563 ± 0.5206 | 0.051 |
| F4 | Std_V | 1.3346 ± 0.3932 | 1.8947 ± 0.5791 | 0.000 ** |
| F5 | Std_ML | 1.2005 ± 0.3085 | 1.3152 ± 0.2835 | 0.158 |
| F6 | Std_AP | 1.7621 ± 0.3512 | 1.9474 ± 0.3279 | 0.049 * |
| F7 | Max_V | 4.4866 ± 1.6012 | 5.2472 ± 1.6480 | 0.080 |
| F8 | Max_ML | 3.1687 ± 1.0598 | 3.6300 ± 1.2326 | 0.117 |
| F9 | Max_AP | 1.3401 ± 0.8068 | 2.4738 ± 1.2365 | 0.000 ** |
| F10 | Min_V | −3.6991 ± 1.3737 | −4.4409 ± 1.3678 | 0.047 * |
| F11 | Min_ML | −3.0965 ± 1.0994 | −3.5054 ± 1.0356 | 0.159 |
| F12 | Min_AP | −7.5277 ± 1.1730 | −6.9939 ± 1.3935 | 0.104 |
| F13 | ZCR_V | 0.0984 ± 0.0169 | 0.0906 ± 0.0123 | 0.073 |
| F14 | ZCR_ML | 0.0659 ± 0.0148 | 0.0847 ± 0.0203 | 0.000 ** |
| F15 | ZCR_AP | 0.0528 ± 0.0158 | 0.0651 ± 0.0137 | 0.005 ** |
| PE Feature | Average ± Standard Deviations | |||
| F16 | PE_V | 0.1108 ± 0.0007 | 0.1103 ± 0.0006 | 0.028 * |
| F17 | PE_ML | 0.1105 ± 0.0006 | 0.1107 ± 0.0007 | 0.291 |
| F18 | PE_AP | 0.1105 ± 0.0016 | 0.1093 ± 0.0011 | 0.006 * |
| WPE Feature | Average ± Standard Deviations | |||
| F19 | WPE_V | 0.1048 ± 0.0007 | 0.1050 ± 0.0004 | 0.172 |
| F20 | WPE_ML | 0.1043 ± 0.0012 | 0.1049 ± 0.0008 | 0.043 * |
| F21 | WPE_AP | 0.1041 ± 0.0012 | 0.1029 ± 0.0019 | 0.002 ** |
| Method | Feature Group | Selected Features |
|---|---|---|
| Stepwise (used t-test (p ≤ 0.05) | SFs | F1, F9 |
| SFs and PE | F1, F4, F9, F14, F18 | |
| SFs and WPE | F1, F9, F15, F20, F21 |
| Omnibus Test | Δ Odds (EXP(B)) and Significance | |
|---|---|---|
| Case i |  |  |
| Case ii |  |  |
| Case iii |  |  |
| Method | Feature Group | Selected Features |
|---|---|---|
| direct stepwise logistic regression | SF | F2, F5, F6, F12, F15 |
| SF and PE | F1, F2, F3, F4, F6, F12, F14, F18 | |
| SF and WPE | F2, F5, F6, F12, F15, F20, F21 |
| Sensitivity | Specificity | Accuracy | |
|---|---|---|---|
| SF | 100% | 63.6% | 71.8% |
| SF and PE | 84.2% | 89.4% | 88.2% |
| SP and WPE | 89.5% | 92.4% | 91.8% |
© 2020 by the authors. Licensee MDPI, Basel, Switzerland. This article is an open access article distributed under the terms and conditions of the Creative Commons Attribution (CC BY) license (http://creativecommons.org/licenses/by/4.0/).
Share and Cite
Lee, C.-H.; Chen, S.-H.; Jiang, B.C.; Sun, T.-L. Estimating Postural Stability Using Improved Permutation Entropy via TUG Accelerometer Data for Community-Dwelling Elderly People. Entropy 2020, 22, 1097. https://0-doi-org.brum.beds.ac.uk/10.3390/e22101097
Lee C-H, Chen S-H, Jiang BC, Sun T-L. Estimating Postural Stability Using Improved Permutation Entropy via TUG Accelerometer Data for Community-Dwelling Elderly People. Entropy. 2020; 22(10):1097. https://0-doi-org.brum.beds.ac.uk/10.3390/e22101097
Chicago/Turabian StyleLee, Chia-Hsuan, Shih-Hai Chen, Bernard C. Jiang, and Tien-Lung Sun. 2020. "Estimating Postural Stability Using Improved Permutation Entropy via TUG Accelerometer Data for Community-Dwelling Elderly People" Entropy 22, no. 10: 1097. https://0-doi-org.brum.beds.ac.uk/10.3390/e22101097