Use of Entropy in Developing SDG-based Indices for Assessing Regional Sustainable Development: A Provincial Case Study of China


Abstract
:1. Introduction
2. Study Area and the Strategy
2.1. Study Area Selection: Fujian Province, China
2.2. Constructing SDGs Indicators-Based Indices: A Strategy
- (1)
- Selecting indicators, collecting data, and processing data.
- (2)
- Determining the weights of different indicators based on entropy.
- (3)
- Calculating two multivariate indices based on SDGs indicators.
3. Selecting Indicators, Collecting Data, and Processing Data
3.1. Selecting Indicators
3.2. Collecting Data
3.3. Processing Data
- First, we converted the ratio of the change to observed values, such as “GDP per capita growth rate” to “GDP per capita”, and “GDP growth rate” to “GDP”. The types of China SDGs indicators included observed values, ratios, and ratios of change. According to the theory of the entropy method, it will impact the weight of the indicator if the indicator is a ratio of change.
- Second, according to the data accessibility, we modified indicators based on China SDGs indicators. For example, “fertilizer consumption” replaced “ratio of fertilizer consumption” in Goal 2. “Death due to road traffic injuries” replaced “death ratio due to road traffic injuries” in Goal 3. The “Engel coefficient” and “urban-rural income distribution” replaced the “Gini coefficient” in Goal 10. The “contribution ratio of the tertiary industry to the GDP” replaced the “contribution ratio of tourism to the GDP” in Goal 12. “Civil litigation” and “Administrative litigation” replaced “Crime rate” in Goal 16.
- Third, the value of the “En7-1” indicator in 2017 was not consistent with those of other years. We adjusted it to be the same as in 2016. According to the concept of entropy method, the value of each indicator must be a positive number or negative number. If an indicator contains a positive number and a negative number, the weights of the indicator are invalid.
4. Determining the Weights of Different Indicators Based on Entropy
5. Calculating Two Multivariate Indices Based on SDGs Indicators
5.1. Development Index
5.2. Coordination Index
6. Results and Analysis
6.1. Results
6.2. Analysis
7. Conclusions
Author Contributions
Funding
Acknowledgments
Conflicts of Interest
References
- Yuan, J.; Zhang, L.; Tan, Y.; Skibniewski, M.J. Evaluating the regional social sustainability contribution of public-private partnerships in China: The development of an indicator system. Sustain. Dev. 2020, 28, 259–278. [Google Scholar] [CrossRef]
- Foley, J.A.; DeFries, R.; Asner, G.P.; Barford, C.; Bonan, G.; Carpenter, S.R.; Chapin, F.S.; Coe, M.T.; Daily, G.C.; Gibbs, H.K.; et al. Global consequences of land use. Science 2005, 309, 570–574. [Google Scholar] [CrossRef] [Green Version]
- Gao, P.C.; Cheng, C.X.; Song, C.Q. Satellite remote sensing for biodiversity conservation: Exemplary practices and lessons learned. Landsc. Ecol. 2019, 34, 2045–2047. [Google Scholar] [CrossRef]
- Gao, P.C.; Zhang, H.; Wu, Z.W.; Wang, J.C. Visualising the expansion and spread of coronavirus disease 2019 by cartograms. Environ. Plan. A Econ. Space 2020, 0. [Google Scholar] [CrossRef] [Green Version]
- Liu, Z.; Xie, M.H.; Tian, K.; Gao, P.C. GIS-based analysis of population exposure to PM2.5 air pollution—A case study of Beijing. J. Environ. Sci. 2017, 59, 48–53. [Google Scholar] [CrossRef] [PubMed]
- Mitcbam, C. The concept of SD its origins and ambivalence. Technol. Soci. 1995, 17, 311–326. [Google Scholar]
- Ciegis, R.; Ramanauskiene, J.; Martinkus, B. The concept of sustainable development and its use for sustainability scenarios. Eng. Econ. 2009, 2, 28–37. [Google Scholar]
- Li, Z.L.; Gong, X.Y.; Chen, J.; Mills, J.; Li, S.N.; Xu, Z.; Ti, P.; Wu, H. Functional requirements of systems for visualization of Sustainable Development Goal (SDG) indicators. J. Geovisualization Spat. Anal. 2020, 4, 1–10. [Google Scholar]
- Donohue, C.; Biggs, E. Monitoring socio-environmental change for sustainable development: Developing a Multidimensional Livelihoods Index (MLI). Appl. Geogr. 2015, 62, 391–403. [Google Scholar] [CrossRef] [Green Version]
- Wu, S.; Fu, Y.; Shen, H.; Liu, F. Using ranked weights and Shannon entropy to modify regional sustainable society index. Sustain. Cities Soc. 2018, 41, 443–448. [Google Scholar] [CrossRef]
- Nhemachena, C.; Matchaya, G.; Nhemachena, C.; Karuaihe, S.; Muchara, B.; Nhlengethwa, S. Measuring baseline agriculture-related Sustainable Development Goals index for Southern Africa. Sustainability 2018, 10, 849. [Google Scholar] [CrossRef] [Green Version]
- Costanza, R.; Daly, L.; Fioramonti, L.; Giovannini, E.; Kubiszewski, I.; Mortensen, L.F.; Pickett, K.E.; Ragnarsdottir, K.V.; De Vogli, R.; Kilkinson, R. Modelling and measuring sustainable wellbeing in connection with the UN Sustainable Development Goals. Ecol. Econ. 2016, 130, 350–355. [Google Scholar] [CrossRef]
- Pinar, M.; Cruciani, C.; Giove, S.; Sostero, M. Constructing the FEEM sustainability index: A Choquet integral application. Ecol. Ind. 2014, 39, 189–202. [Google Scholar] [CrossRef]
- Hogan, D.R.; Stevens, G.A.; Hosseinpoor, A.R.; Boerma, T. Monitoring universal health coverage within the Sustainable Development Goals: Development and baseline data for an index of essential health services. Lancet Glob. Health 2018, 6, e152–e168. [Google Scholar] [CrossRef] [Green Version]
- Janoušková, S.; Hák, T.; Moldan, B. Global SDGs assessments: Helping or confusing indicators? Sustainability 2018, 10, 1540. [Google Scholar] [CrossRef] [Green Version]
- Sridhar, D. Making the SDGs useful: A Herculean task. Lancet 2016, 388, 1453–1454. [Google Scholar] [CrossRef] [Green Version]
- Pradhan, P.; Costa, L.; Rybski, D.; Lucht, W.; Kropp, J.P. A systematic study of sustainable development goal (SDG) interactions. Earth’s Future 2017, 5, 1169–1179. [Google Scholar] [CrossRef] [Green Version]
- Sachs, J.; Schmidt-Traub, G.; Kroll, C.; Lafortune, G.; Fuller, G. SDG Index and Dashboards Report 2018; Bertelsmann Stiftung and Sustainable Development Solutions Network (SDSN): New York, NY, USA, 2018. [Google Scholar]
- Karoubi, E.d.l.M.; Dushime, O.; Fuller, G.; Twinoburyo, E.N.; Simkoko, A.; Verbrg, G. Africa SDG Index and Dashboards Report 2019; SDG Center for Africa and Sustainable Development Solutions Network: Kigali, Rwanda; New York, NY, USA, 2019. [Google Scholar]
- SDSN & IEEP. The 2019 Europe Sustainable Development Report; Sustainable Development Solutions Network and Institute for European Environmental Policy: Paris, France; Brussels, Belgium, 2019. [Google Scholar]
- Lafortune, G.; Zoeteman, K.; Fuller, G.; Mulder, R.; Dagevos, J.; Schmidt-Traub, G. The 2019 SDG Index and Dashboards Report for European Cities (Prototype Version); Sustainable Development Solutions Network (SDSN) and the Brabant Center for Sustainable Development (Telos): Tilburg, The Netherlands, 2019. [Google Scholar]
- Xu, Z.; Chau, S.N.; Chen, X.; Zhang, J.; Li, Y.; Dietz, T.; Wang, J.; Winkler, J.A.; Fan, F.; Huang, B.; et al. Assessing progress towards sustainable development over space and time. Nature 2020, 577, 74–78. [Google Scholar] [CrossRef]
- Sachs, J.; Lynch, A.; LoPresti, A.; Fox, C. Sustainable Development Report of the United States 2018; SDG USA and Sustainable Development Solutions Network (SDSN): New York, NY, USA, 2018. [Google Scholar]
- OECD. Measuring Distance to the SDG Targets 2017: An Assessment of Where OECD Countries Stand; OECD Pbulishing: Paris, France, 2017. [Google Scholar]
- OECD. Measuring Distance to the SDG Targets 2019: An Assessment of Where OECD Countries Stand; OECD Pbulishing: Paris, France, 2019. [Google Scholar]
- Gao, P.C.; Wang, X.Y.; Wang, H.Y.; Cheng, C.X. Viewpoint: A correction to the entropy weight coefficient method by Shen et al. for accessing urban sustainability [Cities 42 (2015) 186–194]. Cities 2020, in press. [Google Scholar]
- Shen, L.Y.; Zhou, J.Y.; Skitmore, M.; Xia, B. Application of a hybrid Entropy–McKinsey Matrix method in evaluating sustainable urbanization: A China case study. Cities 2015, 42, 186–194. [Google Scholar] [CrossRef] [Green Version]
- Gao, P.C.; Li, Z.L.; Qin, Z. Usability of value-by-alpha maps compared to area cartograms and proportional symbol maps. J. Spat. Sci. 2019, 64, 239–255. [Google Scholar] [CrossRef]
- Neumayer, E. The human development index and sustainability--a constructive proposal. Ecol. Econ. 2001, 39, 101–114. [Google Scholar] [CrossRef]
- Kaivo-oja, J.; Panula-Ontto, J.; Vehmas, J.; Luukkanen, J. Relationships of the dimensions of sustainability as measured by the sustainable society index framework. Int. J. Sustain. Dev. World Ecol. 2013, 21, 39–45. [Google Scholar] [CrossRef]
- Chen, M.; Ye, C.; Lu, D.; Sui, Y.; Guo, S. Cognition and construction of the theoretical connotations of new urbanization with Chinese characteristics. J. Geogr. Sci. 2019, 29, 1681–1698. [Google Scholar] [CrossRef] [Green Version]
- Shen, L.; Zhou, J. Examining the effectiveness of indicators for guiding sustainable urbanization in China. Habitat Int. 2014, 44, 111–120. [Google Scholar] [CrossRef]
- Zhou, J.; Shen, L.; Song, X.; Zhang, X. Selection and modeling sustainable urbanization indicators: A responsibility-based method. Ecol. Ind. 2015, 56, 87–95. [Google Scholar] [CrossRef]
- United Nations. Transforming Our World: The 2030 Agenda for Sustainable Development. Available online: https://sustainabledevelopment.un.org/post2015/transformingourworld (accessed on 22 June 2019).
- Fu, B.; Wang, S.; Zhang, J.; Li, J. Unravelling the complexity in achieving the 17 sustainable-development goals. Nat. Sci. Rev. 2019, 6, 386–388. [Google Scholar] [CrossRef] [Green Version]
- Rockström, J.; Sukhdev, P. How food connects all the SDGs. In Proceedings of the Opening Key Note Speech at the 2016 Stokholm EAT Food Forum, Stockholm, Sweden, 13 June 2016. [Google Scholar]
- Bravo, G. The Human Sustainable Development Index: New calculations and a first critical analysis. Ecol. Ind. 2014, 37, 145–150. [Google Scholar] [CrossRef]
- Ding, Y.; Fu, Y.; Lai, K.K.; Leung, W.J. Using ranked weights and acceptability analysis to construct composite indicators: A case study of regional sustainable society index. Soc. Ind. Res. 2018, 139, 871–885. [Google Scholar] [CrossRef]
- Bautista, S.; Enjolras, M.; Narvaez, P.; Camargo, M.; Morel, L. Biodiesel-triple bottom line (TBL): A new hierarchical sustainability assessment framework of principles criteria & indicators (PC&I) for biodiesel production. Part II-validation. Ecol. Ind. 2016, 69, 803–817. [Google Scholar]
- Dong, Z.; Li, N.; Li, H.; Zhou, Q.; Wu, Q.; Zhao, S.; Xue, Y.; Qu, A.; Hao, C.; Xu, X.; et al. China SDGs Indicators Construction and Progress Report 2018; Chinese Academy of Environmental Planning (CAEP) and World Wild Fund for Nature (WWF): Beijing, China, 2018. [Google Scholar]
- Van de Kerk, G.; Manuel, A.R. A comprehensive index for a sustainable society: The SSI—The Sustainable Society Index. Ecol. Econ. 2008, 66, 228–242. [Google Scholar] [CrossRef]
- Perez, V.; Guerrero, F.; Gonzalez, M.; Perez, F.; Caballero, R. Composite indicator for the assessment of sustainability: The case of Cuban nature-based tourism destinations. Ecol. Ind. 2013, 29, 316–324. [Google Scholar] [CrossRef]
- Deng, H.; Yeh, C.-H.; Willis, R.J. Inter-company comparison using modified TOPSIS with objective weights. Comput. Oper. Res. 2000, 27, 963–973. [Google Scholar] [CrossRef]
- Shemshadi, A.; Shirazi, H.; Toreihi, M.; Tarokh, M.J. A fuzzy VIKOR method for supplier selection based on entropy measure for objective weighting. Expert Syst. Appl. 2011, 38, 12160–12167. [Google Scholar] [CrossRef]
- Gao, P.C.; Cushman, S.A.; Liu, G.; Ye, S.J.; Shen, S.; Cheng, C.X. FracL: A tool for characterizing the fractality of landscape gradients from a new perspective. ISPRS Int. J. Geo Inf. 2019, 8, 466. [Google Scholar] [CrossRef] [Green Version]
- Wang, Q.S.; Yuan, X.L.; Zhang, J.; Gao, Y.; Hong, J.L.; Zuo, J.; Liu, W. Assessment of the sustainable development capacity with the entropy weight coefficient method. Sustainability 2015, 7, 13542–13563. [Google Scholar] [CrossRef] [Green Version]
- Ding, L.; Shao, Z.; Zhang, H.; Xu, C.; Wu, D. A comprehensive evaluation of urban sustainable development in China based on the TOPSIS-Entropy method. Sustainability 2016, 8, 746. [Google Scholar] [CrossRef] [Green Version]
- Shannon, C.E. A mathematical theory of communication. Bell Syst. Tech. J. 1948, 27, 379–423. [Google Scholar] [CrossRef] [Green Version]
- Li, Z.L.; Liu, Q.L.; Gao, P.C. Entropy-based cartographic communication models: Evolution from special to general cartographic information theory. Acta Geod. Cartogr. Sin. 2016, 45, 757–767. [Google Scholar] [CrossRef]
- Gao, P.C.; Li, Z.L.; Zhang, H. Thermodynamics-based evaluation of various improved Shannon entropies for configurational information of gray-level images. Entropy 2018, 20, 19. [Google Scholar] [CrossRef] [Green Version]
- Shannon, C.E.; Weaver, W. The Mathematical Theory of Communication; The University of Illinois Press: Urbana, IL, USA, 1949. [Google Scholar]
- Zou, Z.; Yun, Y.; Sun, J. Entropy method for determination of weight of evaluating indicators in fuzzy synthetic evaluation for water quality assessment. J. Environ. Sci. 2006, 18, 1020–1023. [Google Scholar] [CrossRef]
- Zheng, S.; Fu, Y.; Lai, K.; Liang, L. An Improvement to multiple criteria ABC Inventory classification using Shannon entropy. J. Syst. Sci. Complex. 2017, 30, 857–865. [Google Scholar] [CrossRef]
- Li, Y.; Zhang, K.; Song, N.; Chen, L. Comparison of two analytical approaches in the assessment of urban sustainable development. Environ. Sci. Technol. 2012, 35, 199–205. [Google Scholar]
- Decuseară, N.-R. Using the general electric Mckinsey Matrix in the process of selecting the central and east European markets. Manag. Strateg. J. 2013, 19, 59–66. [Google Scholar]
- Mokaya, S.O.; Wakhungu, B.; Gikunda, R.M. The application of McKinsey Matrix in determination of route attractiveness and resource allocation in Kenya Airways. Int. J. Hum. Soc. Sci. 2012, 2, 259–268. [Google Scholar]
- Amatulli, C.; Caputo, T.; Guido, G. Strategic analysis through the general electric/McKinsey Matrix: An application to the Italian fashion industry. Int. J. Bus. Manag. 2011, 6, 61–75. [Google Scholar] [CrossRef] [Green Version]
- Shi, Y.F.; Ge, X.H.; Yuan, X.L.; Wang, Q.S.; Kellett, J.; Li, F.Q.; Ba, K.M. An integrated indicator system and evaluation model for regional sustainable development. Sustainability 2019, 11, 2183. [Google Scholar] [CrossRef] [Green Version]
- Xu, J.Y.; Liang, X.Y.; Chen, H. Landscape sustainability evaluation of ecologically fragile areas based on Boltzmann entropy. ISPRS Int. J. Geo Inf. 2020, 9, 77. [Google Scholar] [CrossRef] [Green Version]
- Wu, W.J.; Zhao, H.R.; Tan, Q.F.; Gao, P.C. An urban scaling estimation method in a heterogeneity variance perspective. Entropy 2019, 21, 337. [Google Scholar] [CrossRef] [Green Version]
- Zhang, T.; Cheng, C.; Gao, P. Permutation entropy-based analysis of temperature complexity spatial-temporal variation and its driving factors in China. Entropy 2019, 21, 1001. [Google Scholar] [CrossRef] [Green Version]
- Cushman, S.A. Thermodynamics in landscape ecology: The importance of integrating measurement and modeling of landscape entropy. Landsc. Ecol. 2015, 30, 7–10. [Google Scholar] [CrossRef] [Green Version]
- Cushman, S.A. Calculating the configurational entropy of a landscape mosaic. Landsc. Ecol. 2016, 31, 481–489. [Google Scholar] [CrossRef]
- Cushman, S.A. Calculation of configurational entropy in complex landscapes. Entropy 2018, 20, 298. [Google Scholar] [CrossRef] [Green Version]
- Cushman, S.A. Editorial: Entropy in landscape ecology. Entropy 2018, 20, 314. [Google Scholar] [CrossRef] [Green Version]
- Zhang, H.; Wu, Z.; Lan, T.; Chen, Y.; Gao, P. Calculating the Wasserstein metric-based Boltzmann entropy of a landscape mosaic. Entropy 2020, 22, 381. [Google Scholar] [CrossRef] [Green Version]
- Gao, P.C.; Wang, J.C.; Zhang, H.; Li, Z.L. Boltzmann entropy-based unsupervised band selection for hyperspectral image classification. IEEE Geosci. Remote Sens. Lett. 2019, 16, 462–466. [Google Scholar] [CrossRef]
- Gao, P.C.; Li, Z.L. Aggregation-based method for computing absolute Boltzmann entropy of landscape gradient with full thermodynamic consistency. Landsc. Ecol. 2019, 34, 1837–1847. [Google Scholar] [CrossRef]
- Gao, P.C.; Li, Z.L. Computation of the Boltzmann entropy of a landscape: A review and a generalization. Landsc. Ecol. 2019, 34, 2183–2196. [Google Scholar] [CrossRef]
- Gao, P.C.; Zhang, H.; Li, Z.L. A hierarchy-based solution to calculate the configurational entropy of landscape gradients. Landsc. Ecol. 2017, 32, 1133–1146. [Google Scholar] [CrossRef]


| Dimension | Goal | Indicator | Attribution |
|---|---|---|---|
| Social | Goal 2 | S2-1 Prevalence of undernourishment | − |
| S2-2 Cereal yield per capita | + | ||
| S2-3 Per capita disposable income of rural residents | + | ||
| S2-4 Fertilizer consumption | − | ||
| S2-5 Arable land area per capita | + | ||
| S2-6 Agriculture, forestry and water expenditure (% finance expenditure) | + | ||
| S2-7 Price index of household consumption in food (last=100) | − | ||
| Goal 3 | S3-1 Death due to road traffic injuries | − | |
| S3-2 HIV prevalence | − | ||
| S3-3 Tuberculosis prevalence | − | ||
| S3-4 Malaria prevalence | − | ||
| S3-5 Number of traffic accidents (per 10,000) | − | ||
| S3-6 Health workers (per 10,000) | + | ||
| S3-7 Number of beds in medical institutions (per 10,000) | + | ||
| Goal 4 | S4-1 Early education (%) | + | |
| S4-2 Number of college students (per 10,000) | + | ||
| S4-3 Number of high school students (per 10,000) | + | ||
| S4-4 Number of high school teachers (per 10,000) | + | ||
| S4-5 Number of college teachers (per 10,000) | + | ||
| S4-6 Proportion of educational funds expenditure in GDP | + | ||
| Goal 11 | S11-1 Railway mileage per capita | + | |
| S11-2 Highway mileage per capita | + | ||
| S11-3 Urban-rural and community expenditure (% finance expenditure) | + | ||
| S11-4 Urban green areas per inhabitant | + | ||
| S11-5 Percentage of living waste processed | + | ||
| S11-6 Recycling rate of industrial solid waste | + | ||
| Goal 16 | S16-1 Civil litigation | − | |
| S16-2 Administrative litigation | − | ||
| Goal 17 | S17-1 Local finance revenue (% GDP) | + | |
| S17-2 Local tax revenue (% finance revenue) | + | ||
| S17-3 Energy conservation and environment protection expenditures (% finance expenditure) | + | ||
| Economic | Goal 1 | E1-1 Proportion of population living below the national poverty line | − |
| E1-2 Poverty rates | − | ||
| E1-3 Urban residents protected by the minimum standard of living (% urban population) | − | ||
| E1-4 Rural residents protected by the minimum standard of living (% rural population) | − | ||
| E1-5 Disabled people protected by the minimum standard of living (% total population) | − | ||
| E1-6 People affected by natural disasters | − | ||
| Goal 8 | E8-1 GDP per capita | + | |
| E8-2 GDP | + | ||
| E8-3 Labor productivity | + | ||
| E8-4 Urban unemployment rate | − | ||
| Goal 9 | E9-1 Volume in passenger transport | + | |
| E9-2 Volume in freight transport | + | ||
| E9-3 Proportion of R&D expenditure in the GDP | + | ||
| Goal 10 | E10-1 Urban Engel coefficient | − | |
| E10-2 Rural Engel coefficient | − | ||
| E10-3 Urban-rural income distribution | − | ||
| Goal 12 | E12-1 Contribution ratio of the tertiary industry to the GDP | + | |
| Environmental | Goal 6 | En6-1 Percentage of population with safe and adequate drinking water in urban areas | + |
| En6-2 Proportion of rural households with sanitary toilets | + | ||
| En6-3 Proportion of surface water quality reaching or better than Class III water | + | ||
| En6-4 Proportion of surface water quality worse Class V water | − | ||
| En6-5 Urban anthropogenic wastewater that receives treatment (%) | + | ||
| En6-6 Water resources per capita | + | ||
| Goal 7 | En7-1 Reduced energy consumption per unit of GDP | + | |
| Goal 13 | En13-1 Deaths due to natural disasters (per 100,000) | − | |
| En13-2 Total damages attributed to disasters as % of GDP | − | ||
| Goal 15 | En15-1 Forest area as a proportion of the total land area | + | |
| En15-2 Proportion of protected and conserved terrestrial areas | + |
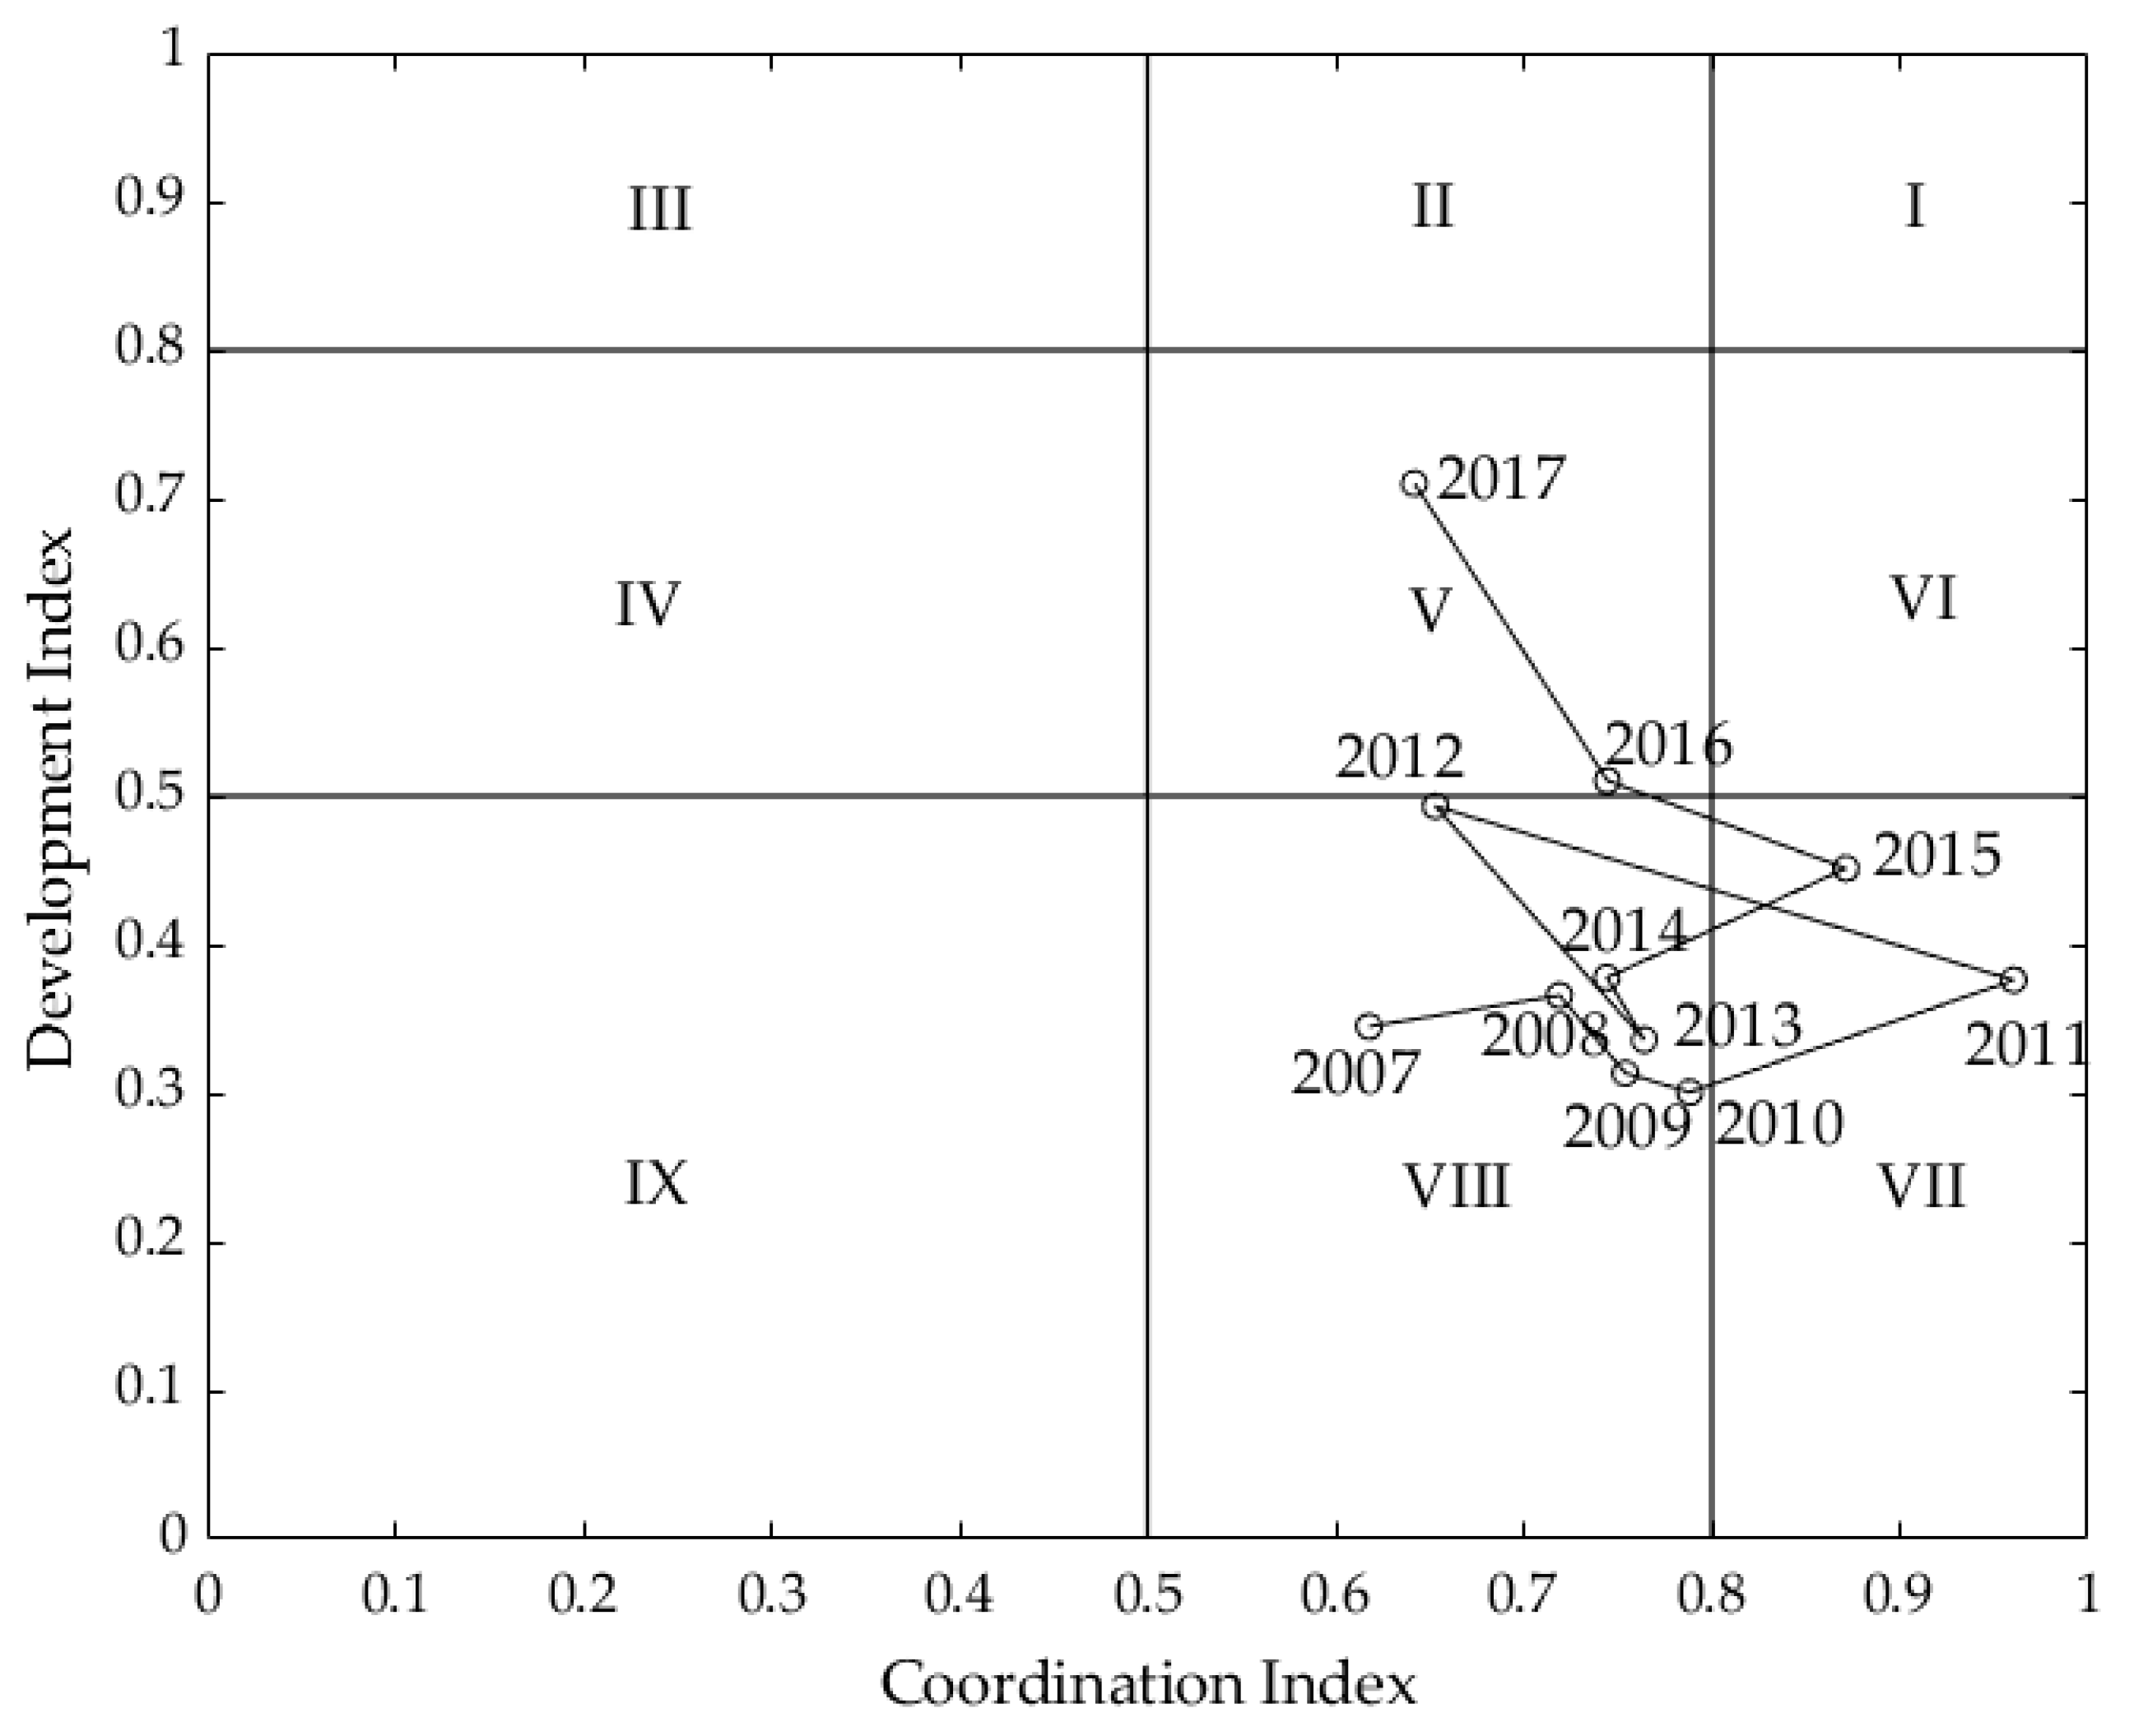
| Development Index | The Level of Development |
|---|---|
| 0.8 ≤ E ≤ 1 | Strong development |
| 0.5≤ E < 0.8 | Medium development |
| 0 ≤ E < 0.5 | Weak development |
| Coordination Index | The Level of Coordination |
| 0.8 ≤ G ≤ 1 | Strong coordination |
| 0.5 ≤ G < 0.8 | Medium coordination |
| 0 ≤ G < 0.5 | Weak coordination |
| Years | Social | Economic | Environmental | Ej | Sj | Gj | ||||
|---|---|---|---|---|---|---|---|---|---|---|
| Ej(s) | wi | Ej(e) | wi | Ej(en) | wi | |||||
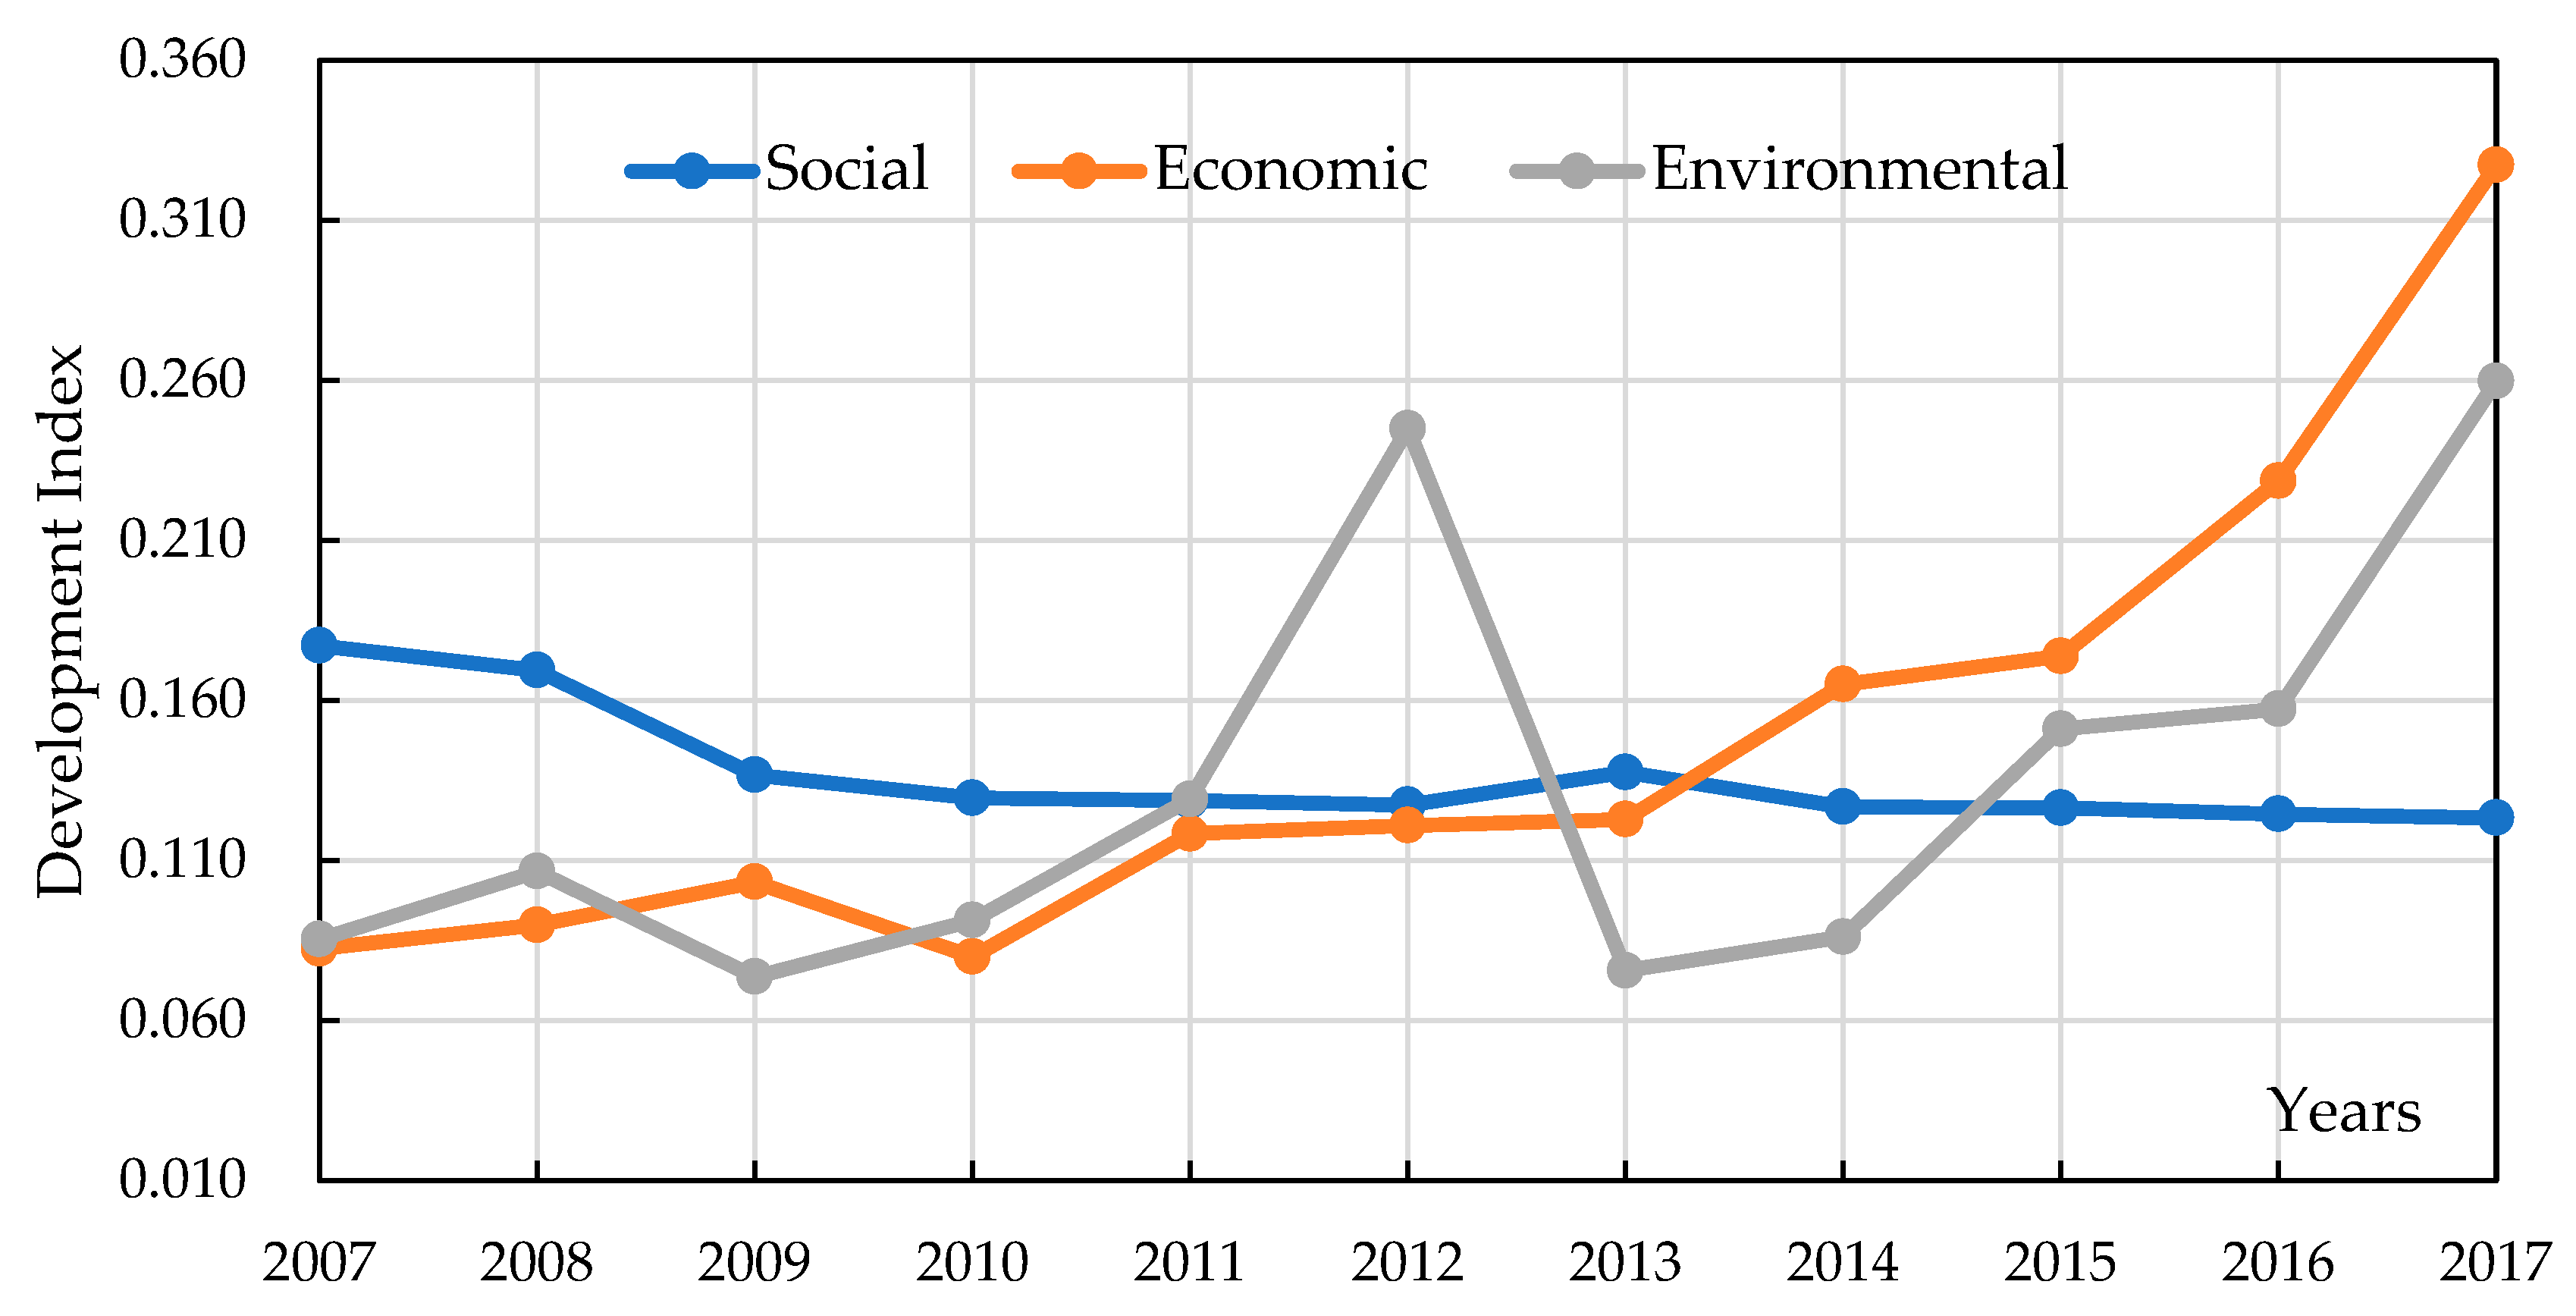
| 2007 | 0.177 | 0.241 | 0.082 | 0.329 | 0.085 | 0.430 | 0.345 | 0.044 | 0.115 | 0.618 |
| 2008 | 0.169 | 0.090 | 0.107 | 0.366 | 0.034 | 0.122 | 0.719 | |||
| 2009 | 0.137 | 0.103 | 0.074 | 0.314 | 0.026 | 0.105 | 0.754 | |||
| 2010 | 0.130 | 0.080 | 0.091 | 0.301 | 0.021 | 0.100 | 0.788 | |||
| 2011 | 0.129 | 0.118 | 0.129 | 0.376 | 0.005 | 0.125 | 0.960 | |||
| 2012 | 0.127 | 0.121 | 0.245 | 0.493 | 0.057 | 0.164 | 0.653 | |||
| 2013 | 0.138 | 0.123 | 0.076 | 0.336 | 0.026 | 0.112 | 0.764 | |||
| 2014 | 0.127 | 0.165 | 0.086 | 0.378 | 0.032 | 0.126 | 0.744 | |||
| 2015 | 0.126 | 0.174 | 0.151 | 0.451 | 0.019 | 0.150 | 0.871 | |||
| 2016 | 0.124 | 0.229 | 0.157 | 0.510 | 0.043 | 0.170 | 0.745 | |||
| 2017 | 0.123 | 0.327 | 0.260 | 0.710 | 0.085 | 0.237 | 0.642 | |||
| Years | Development Index | |||||
|---|---|---|---|---|---|---|
| Ej(s2) | Ej(s3) | Ej(s4) | Ej(s11) | Ej(s16) | Ej(s17) | |
| 2007 | 0.012 | 0.119 | 0.004 | 0.013 | 0.024 | 0.004 |
| 2008 | 0.014 | 0.109 | 0.004 | 0.013 | 0.023 | 0.005 |
| 2009 | 0.015 | 0.070 | 0.004 | 0.014 | 0.024 | 0.010 |
| 2010 | 0.017 | 0.063 | 0.004 | 0.014 | 0.022 | 0.009 |
| 2011 | 0.019 | 0.063 | 0.005 | 0.014 | 0.022 | 0.007 |
| 2012 | 0.020 | 0.057 | 0.005 | 0.015 | 0.023 | 0.008 |
| 2013 | 0.022 | 0.063 | 0.005 | 0.018 | 0.022 | 0.008 |
| 2014 | 0.024 | 0.056 | 0.005 | 0.018 | 0.017 | 0.008 |
| 2015 | 0.026 | 0.054 | 0.005 | 0.019 | 0.013 | 0.010 |
| 2016 | 0.027 | 0.048 | 0.005 | 0.023 | 0.010 | 0.012 |
| 2017 | 0.028 | 0.047 | 0.005 | 0.025 | 0.009 | 0.010 |
© 2020 by the authors. Licensee MDPI, Basel, Switzerland. This article is an open access article distributed under the terms and conditions of the Creative Commons Attribution (CC BY) license (http://creativecommons.org/licenses/by/4.0/).
Share and Cite
Wang, X.; Gao, P.; Song, C.; Cheng, C. Use of Entropy in Developing SDG-based Indices for Assessing Regional Sustainable Development: A Provincial Case Study of China. Entropy 2020, 22, 406. https://0-doi-org.brum.beds.ac.uk/10.3390/e22040406
Wang X, Gao P, Song C, Cheng C. Use of Entropy in Developing SDG-based Indices for Assessing Regional Sustainable Development: A Provincial Case Study of China. Entropy. 2020; 22(4):406. https://0-doi-org.brum.beds.ac.uk/10.3390/e22040406
Chicago/Turabian StyleWang, Xiangyu, Peichao Gao, Changqing Song, and Changxiu Cheng. 2020. "Use of Entropy in Developing SDG-based Indices for Assessing Regional Sustainable Development: A Provincial Case Study of China" Entropy 22, no. 4: 406. https://0-doi-org.brum.beds.ac.uk/10.3390/e22040406