Prognosis of Diabetic Peripheral Neuropathy via Decomposed Digital Volume Pulse from the Fingertip
by
 ,
,
Hai-Cheng Wei
1,2,3 ,
,
Wen-Rui Hu
3,
Na Ta
3,
Ming-Xia Xiao
2,3,
Xiao-Jing Tang
4 and
Hsien-Tsai Wu
5,* 1
Basic Experimental Teaching & Engineering Training Center, North Minzu University, No. 204 North Wenchang Street, Yinchuan, Ningxia 750021, China
2
Laboratory of Intelligent Information and Big Data Processing of NingXia Province, North Minzu University, No. 204 North Wenchang Street, Yinchuan, Ningxia 750021, China
3
School of Electrical and Information Engineering, North Minzu University, No. 204 North Wenchang Street, Yinchuan, Ningxia 750021, China
4
School of Science, Ningxia Medical University, No. 1160 Shengli Street, Ningxia 750004, China
5
Department of Electrical Engineering, Dong Hwa University, No. 1, Sec. 2, Da Hsueh Rd., Shoufeng, Hualien 97401, Taiwan
*
Author to whom correspondence should be addressed.
Entropy 2020, 22(7), 754; https://0-doi-org.brum.beds.ac.uk/10.3390/e22070754
Submission received: 5 June 2020
/
Revised: 3 July 2020
/
Accepted: 6 July 2020
/
Published: 9 July 2020
(This article belongs to the Special Issue Entropy: The Scientific Tool of the 21st Century)
Abstract
:Diabetic peripheral neuropathy (DPN) is a very common neurological disorder in diabetic patients. This study presents a new percussion-based index for predicting DPN by decomposing digital volume pulse (DVP) signals from the fingertip. In this study, 130 subjects (50 individuals 44 to 89 years of age without diabetes and 80 patients 37 to 86 years of age with type 2 diabetes) were enrolled. After baseline measurement and blood tests, 25 diabetic patients developed DPN within the following five years. After removing high-frequency noise in the original DVP signals, the decomposed DVP signals were used for percussion entropy index (PEIDVP) computation. Effects of risk factors on the incidence of DPN in diabetic patients within five years of follow-up were tested using binary logistic regression analysis, controlling for age, waist circumference, low-density lipoprotein cholesterol, and the new index. Multivariate analysis showed that patients who did not develop DPN in the five-year period had higher PEIDVP values than those with DPN, as determined by logistic regression model (PEIDVP: odds ratio 0.913, 95% CI 0.850 to 0.980). This study shows that PEIDVP can be a major protective factor in relation to the studied binary outcome (i.e., DPN or not in diabetic patients five years after baseline measurement).
1. Introduction
Recently, many studies have reported that patients with type 2 diabetes could be at highly increased risk of developing atherosclerosis and autonomic nervous dysfunction [1,2,3,4]. Microvascular diseases are widespread among patients with long-term type 2 diabetes mellitus [5,6]. Generally, diabetic microvascular diseases are characterized by nerve damage caused by chronically high blood sugar and diabetes (e.g., diabetic peripheral neuropathy (DPN)) [7], exudate leakage from retinal small vessels (i.e., diabetic retinopathy), or persistent proteinuria and progressive decline in kidney function (i.e., diabetic nephropathy). DPN is a very common neurological disorder in diabetic patients [8,9]. The goals of caring for patients with type 2 diabetes mellitus are to reduce symptoms and to prevent, or at least slow down, the development of complications [10]. Glucose control in these patients undoubtedly has benefits for major microvascular endpoints; good glucose control does improve microvascular disease and should be achieved early and maintained over as long a period of time as possible [11,12,13,14]. On the other hand, early prediction of the signs of DPN through signal-analysis methods is urgently needed by diabetic patients and clinic doctors.
In recent years, the small-scale multiscale entropy index (MEIRRI) and the first proposed percussion entropy index (PEI1st) were developed to reflect autonomic function based on a nonlinear method for studying heart-rate variability (HRV) using only RR interval (RRI) datasets [15,16]. PEI1st was also found to be suitable for analyzing diabetic patients [17]. In addition, percussion entropy–based indices are a generalized application of the method developed by Wei et al. (PEI1st) [18] and Xiao et al. (PEINEW) [19] for specific time series, using amplitudes of successive digital volume pulse signals versus changes in RR intervals [15]. Wei et al. showed that PEI1st can be used as a prognostic indicator with electrocardiography (ECG) and photoplethysmography (PPG) for future peripheral neuropathy in patients with type 2 diabetes [20]. However, using an ECG device is not convenient for many real-time applications. Considering surrogate data and cost reduction, a new percussion entropy index (PEIPPI) using only PPG (i.e., original amplitude series and peak-to-peak interval (PPI) series of the sixth decomposed intrinsic mode function (IMF6) from digital volume pulse (DVP)) was proposed to assess baroreflex sensitivity (BRS) complexity in elderly and diabetic patients with regard to type 2 diabetes associated autonomic dysfunction [21]. Moreover, PPG-derived DVP signals were further used for clinical applications in ubiquitous blood-pressure monitoring, congestive heart failure, and hypertension assessment [22,23,24]. However, it is not easy to filter out the high frequencies around peaks in the original DVP signals of diabetic patients, which can cause a big problem in error peak determination.
The investigation presented herein was conducted as follows: We hypothesized that the ensemble empirical mode decomposition (EEMD) method could be utilized for PPG-derived DVP signals to obtain two IMFs for decomposed DVP signals (IMF5 and IMF6) free of high-frequency noise [25]. Our second hypothesis was that a new lower value of percussion entropy index (PEIDVP) with the adoption of decomposed DVP-derived amplitude series and PPI series could estimate the prognosis of diabetic peripheral neuropathy for diabetic patients in the five years after baseline measurement.
This paper describes the use of decomposed DVP signals for percussion entropy analysis to assess the complexity of BRS for assessment of diabetic peripheral neuropathy prognosis. Descriptions of the study population, study procedure, PEIDVP using synchronized PPI and Amp signals derived from decomposed DVP signals, and statistical analysis are presented in Section 2. Baseline characteristics of healthy and diabetic subjects; the failure of original DVPs to detect correct amplitudes in diabetic subjects; an assessment of agreement between amplitudes from original and decomposed DVPs of a healthy subject; a comparison of performance and computation time among PEIDVP, PEIPPI, PEI1st, and MEIPPI to differentiate future peripheral neuropathy in type 2 diabetic patients; and the effects of risk factors associated with developing DPN using a logistic regression analysis method are presented in Section 3. All of our findings are discussed in Section 4. Finally, Section 5 concludes the paper.
2. Materials and Methods
2.1. Study Population
The study population consisted of 140 right-hand-dominant middle-aged subjects who underwent PPG and ECG examinations in the hospital from June 2009 to July 2011. Ten participants were excluded due to a history of atherosclerosis-associated complications, including permanent pacemaker implantation, coronary heart disease, heart failure, and ischemic stroke, leaving 130 subjects remaining in the study. In the study, diabetes mellitus was defined as a fasting glucose level higher than 126 mg/dL and/or a glycated hemoglobin (HbA1c) level greater than 6.5%. In total, 50 subjects were not diabetic patients (group 1, age range: 44–89 years), and 80 had type 2 diabetes. The diabetic patients were then divided into 2 groups: those who were diagnosed with type 2 diabetes without peripheral neuropathy within 5 years (group 2, age range: 44–86 years, n = 55), and those with peripheral neuropathy within 5 years (group 3, age range: 37–75 years, n = 25), all with HbA1c ≥ 6.5%.
In the present study, there were 11 diabetic patients in group 3 with good blood-glucose control (6.5% ≦ HbA1c < 8%), and 14 diabetic patients who originally had poor blood-glucose control (HbA1c ≧ 8%) [26]. During follow-up screening, DPN in type 2 diabetes patients was defined based on the presence of symptoms of numbness, tingling, or pain of distal extremities lasting for more than 3 months, along with a confirmed diagnosis by the clinic doctor in the same diabetes outpatient department through a neurophysiological study. For unbiased analysis, the subjects in the diabetic groups were age-controlled. This study was reviewed and approved by the Institutional Review Board of Hualien Hospital (Hualien City, Taiwan) and Ningxia Medical University Hospital (Yinchuan City, Ningxia, China).
2.2. Study Procedure
Anthropometric, demographic, and laboratory data for the analysis as well as medical history were obtained at the clinic visit. Each subject’s resting blood pressure was measured once from the left arm in a supine position using an oscillometric device (BP3AG1, Microlife, Taiwan). Total cholesterol, triglyceride, low-density and high-density lipoprotein cholesterol, fasting blood glucose, and glycosylated hemoglobin concentrations were obtained from blood samples after a 12 h fast. Caffeine-containing beverages and theophylline-containing drugs were forbidden for 12 h before each clinic visit. All measurements were taken in the morning (08:30–10:30). Moreover, to minimize latent erroneous readings from the PPG sensors arising from involuntary body vibrations of the test subjects and low environmental temperature, possibly resulting in constriction of the peripheral vessels, all subjects underwent blood sampling before data acquisition. All test subjects were allowed to relax in a supine position for 5 min in a quiet room with the temperature controlled at 26 ± 1 °C [26]. Data from the first 1000 cardiac cycles were used for analysis in this study.
2.3. Calculation of Percussion Entropy Index (PEIDVP) Using Synchronized {PPI} and {Amp} Signals
2.3.1. Signal Processing for Percussion Entropy Indices
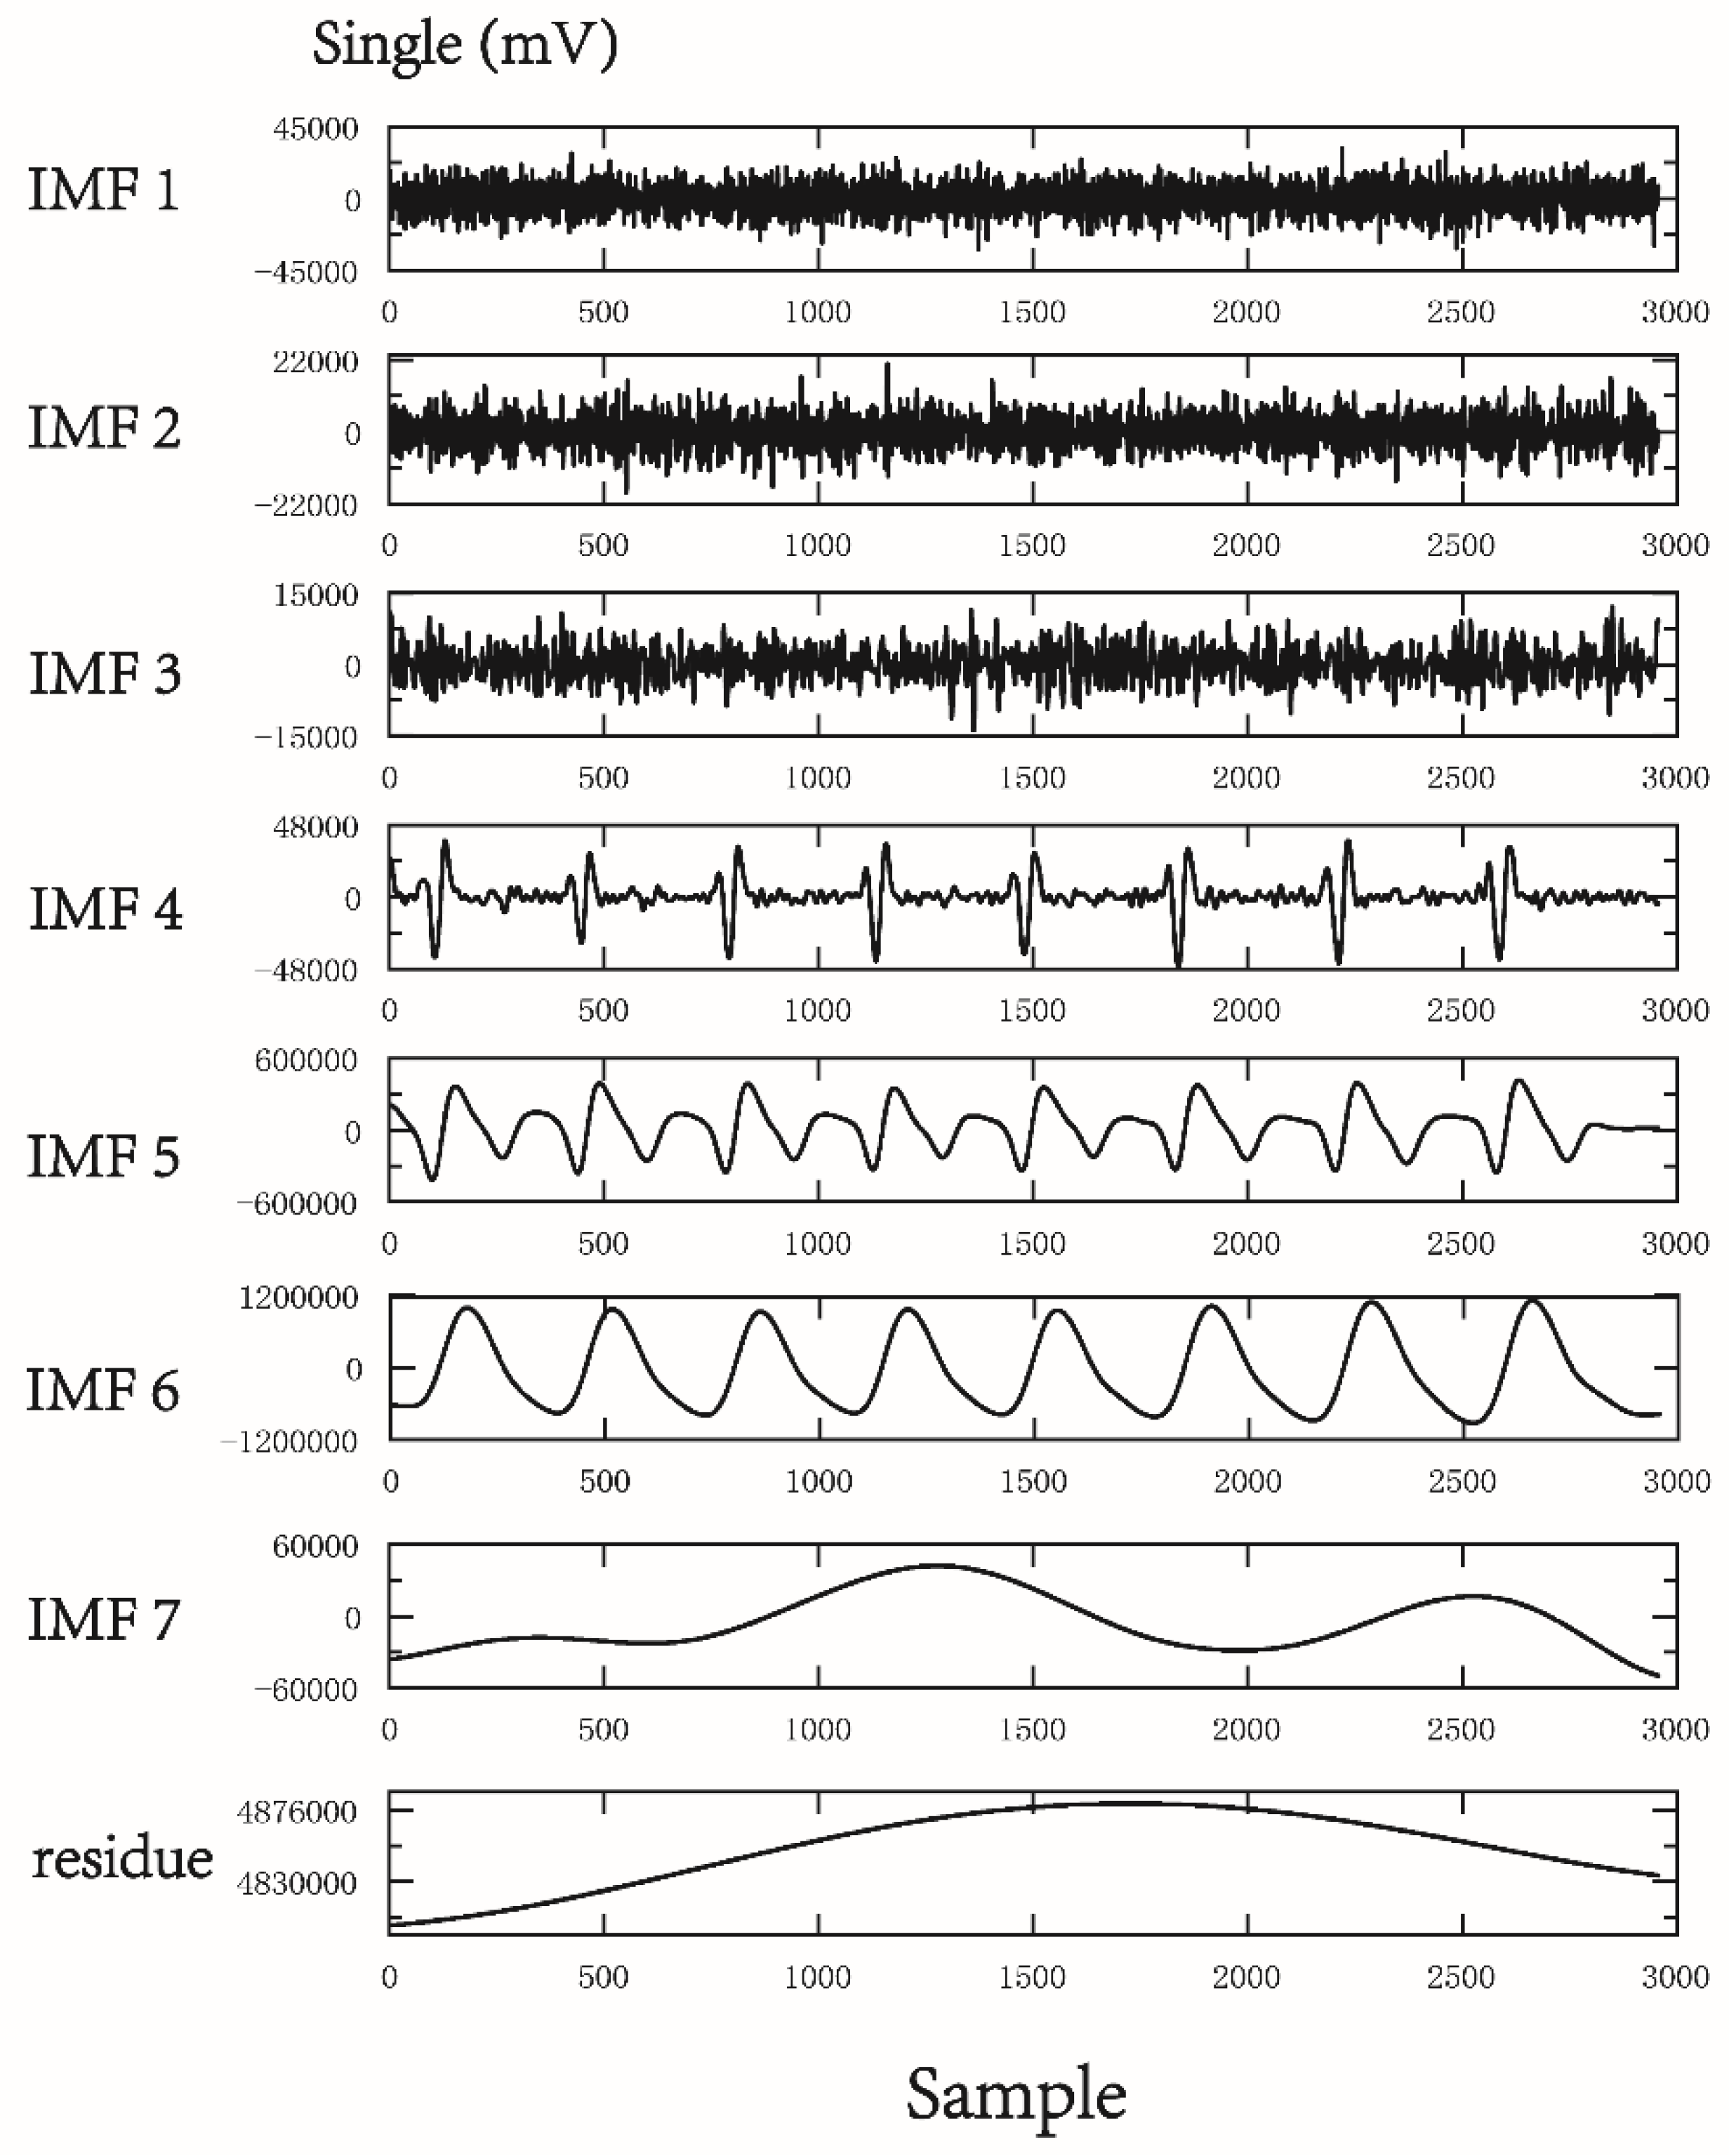
The PPG infrared sensor was placed on the tip of the index finger of the subject’s dominant hand for data acquisition. After being run through a USB-based analog-to-digital converter (USB-6009 DAQ, National Instruments, Austin, TX, USA) with a sampling frequency of 500 Hz, the digitized signals were subsequently stored on a personal computer (PC) and analyzed using the MATLAB 7.7 software package (MathWorks, Natick, MA, USA) [26]. In each pulse cycle, ensemble empirical mode decomposition (EEMD) [27] was used to decompose the original DVP signals to many IMFs (Figure 1). As we know, EEMD interpretation heavily depends on “empirical” knowledge of the signals. In order to appropriately exploit the IMFs from original DVP signals, one has to be certain whether an IMF carries information relevant to the human system [28,29], from which selection of IMFs for further analysis can be made without doubt. Moreover, fluctuations resembling systolic and diastolic peaks were also noted in IMF5. IMF6 is sine wave-like, caused by the impact of the heartbeat on the digital volume pulse (DVP) signal from the fingertip, and exhibited a frequency close to that of the heart rate (Figure 1). Since the peaks of IMF5 and IMF6 are in phase and with larger amplitudes in IMFs from decomposed DVP in Figure 1, intuitively, the decomposed DVP signals (i.e., IMF5 + IMF6) can be regarded as noise-free original DVP signals. As a result, decomposed DVP signals were chosen for percussion analysis using the conventional method after decomposition of the original signal by EEMD (Figure 1 and Figure 2). We combined the fifth and sixth decomposed intrinsic mode functions (IMF5, IMF6) as decomposed DVP signals with high-frequency noise removed. Subsequently, the potential differences between peaks and valleys (defined as the lowest point after a peak) were defined as the pulse amplitudes of the decomposed DVP signals ({Amp}). In addition, {PPI} series were calculated from IMF6 (sine wave-like), caused by the impact of the heartbeat on the DVP, as addressed in [21]. The decomposed DVP and IMF6 signals had to be synchronized in the same way. Moreover, we checked whether peaks calculated from decomposed DVP signals were in phase with those from IMF6 or not. Finally, PEIPPI [21], PEI1st [18], and MEIPPI [16] were computed and compared with the PEIDVP proposed in this study (Figure 3).
2.3.2. PEIDVP Calculation from Decomposed DVP Signals
We tried to generate a new index using only DVP signals considering surrogate data and cost reduction in this study. That is, two specific time series were adopted: amplitudes of successive digital volume pulse signals, and changes in RR intervals of successive cardiac cycles from decomposed DVP signals.
- Synchronized {PPI} and {Amp} signals after EEMD{Amp} = {Amp1, Amp2,…, Ampn} for time series of decomposed DVP amplitude signals and {PPI} = {PPI1, PPI2,…, PPIn} for the PPI of IMF6 after EEMD were simultaneously synchronized for each subject.{Amp} = {Amp1, Amp2, Amp3,…, Ampn}{PPI} = {PPI1, PPI2, PPI3,…, PPIn)}
- Synchronized {U} and {V} signals for fluctuation patterns were computed as follows:{U} = {U1 U2 U3 … Un}, Ui = 0, if Amp(i+1) ≦ Ampi, or Ui = 1, if Amp(i+1) > Ampi{V} = {V1 V2 V3 … Vn}, Vi = 0, if PPI(i+1) ≦ PPIi, or Vi = 1, if PPI(i+1) > PPIi
- The percussion rate for each scale factor τ was computed aswhere m is the embedded dimension vectors and count(i) represents the match number between {U(i)} and {V(i + τ)}. A summation of all the numbers of matches (i.e., percussion number in Equation (5)) is thus obtained and divided by the total number of vectors of pattern, giving the “percussion rate,” where m is the impact point (e.g., m is set to be 2).
- As previous study [19], PEIDVP calculation was as follows:where , and nτ is the shift in number of scales considered.
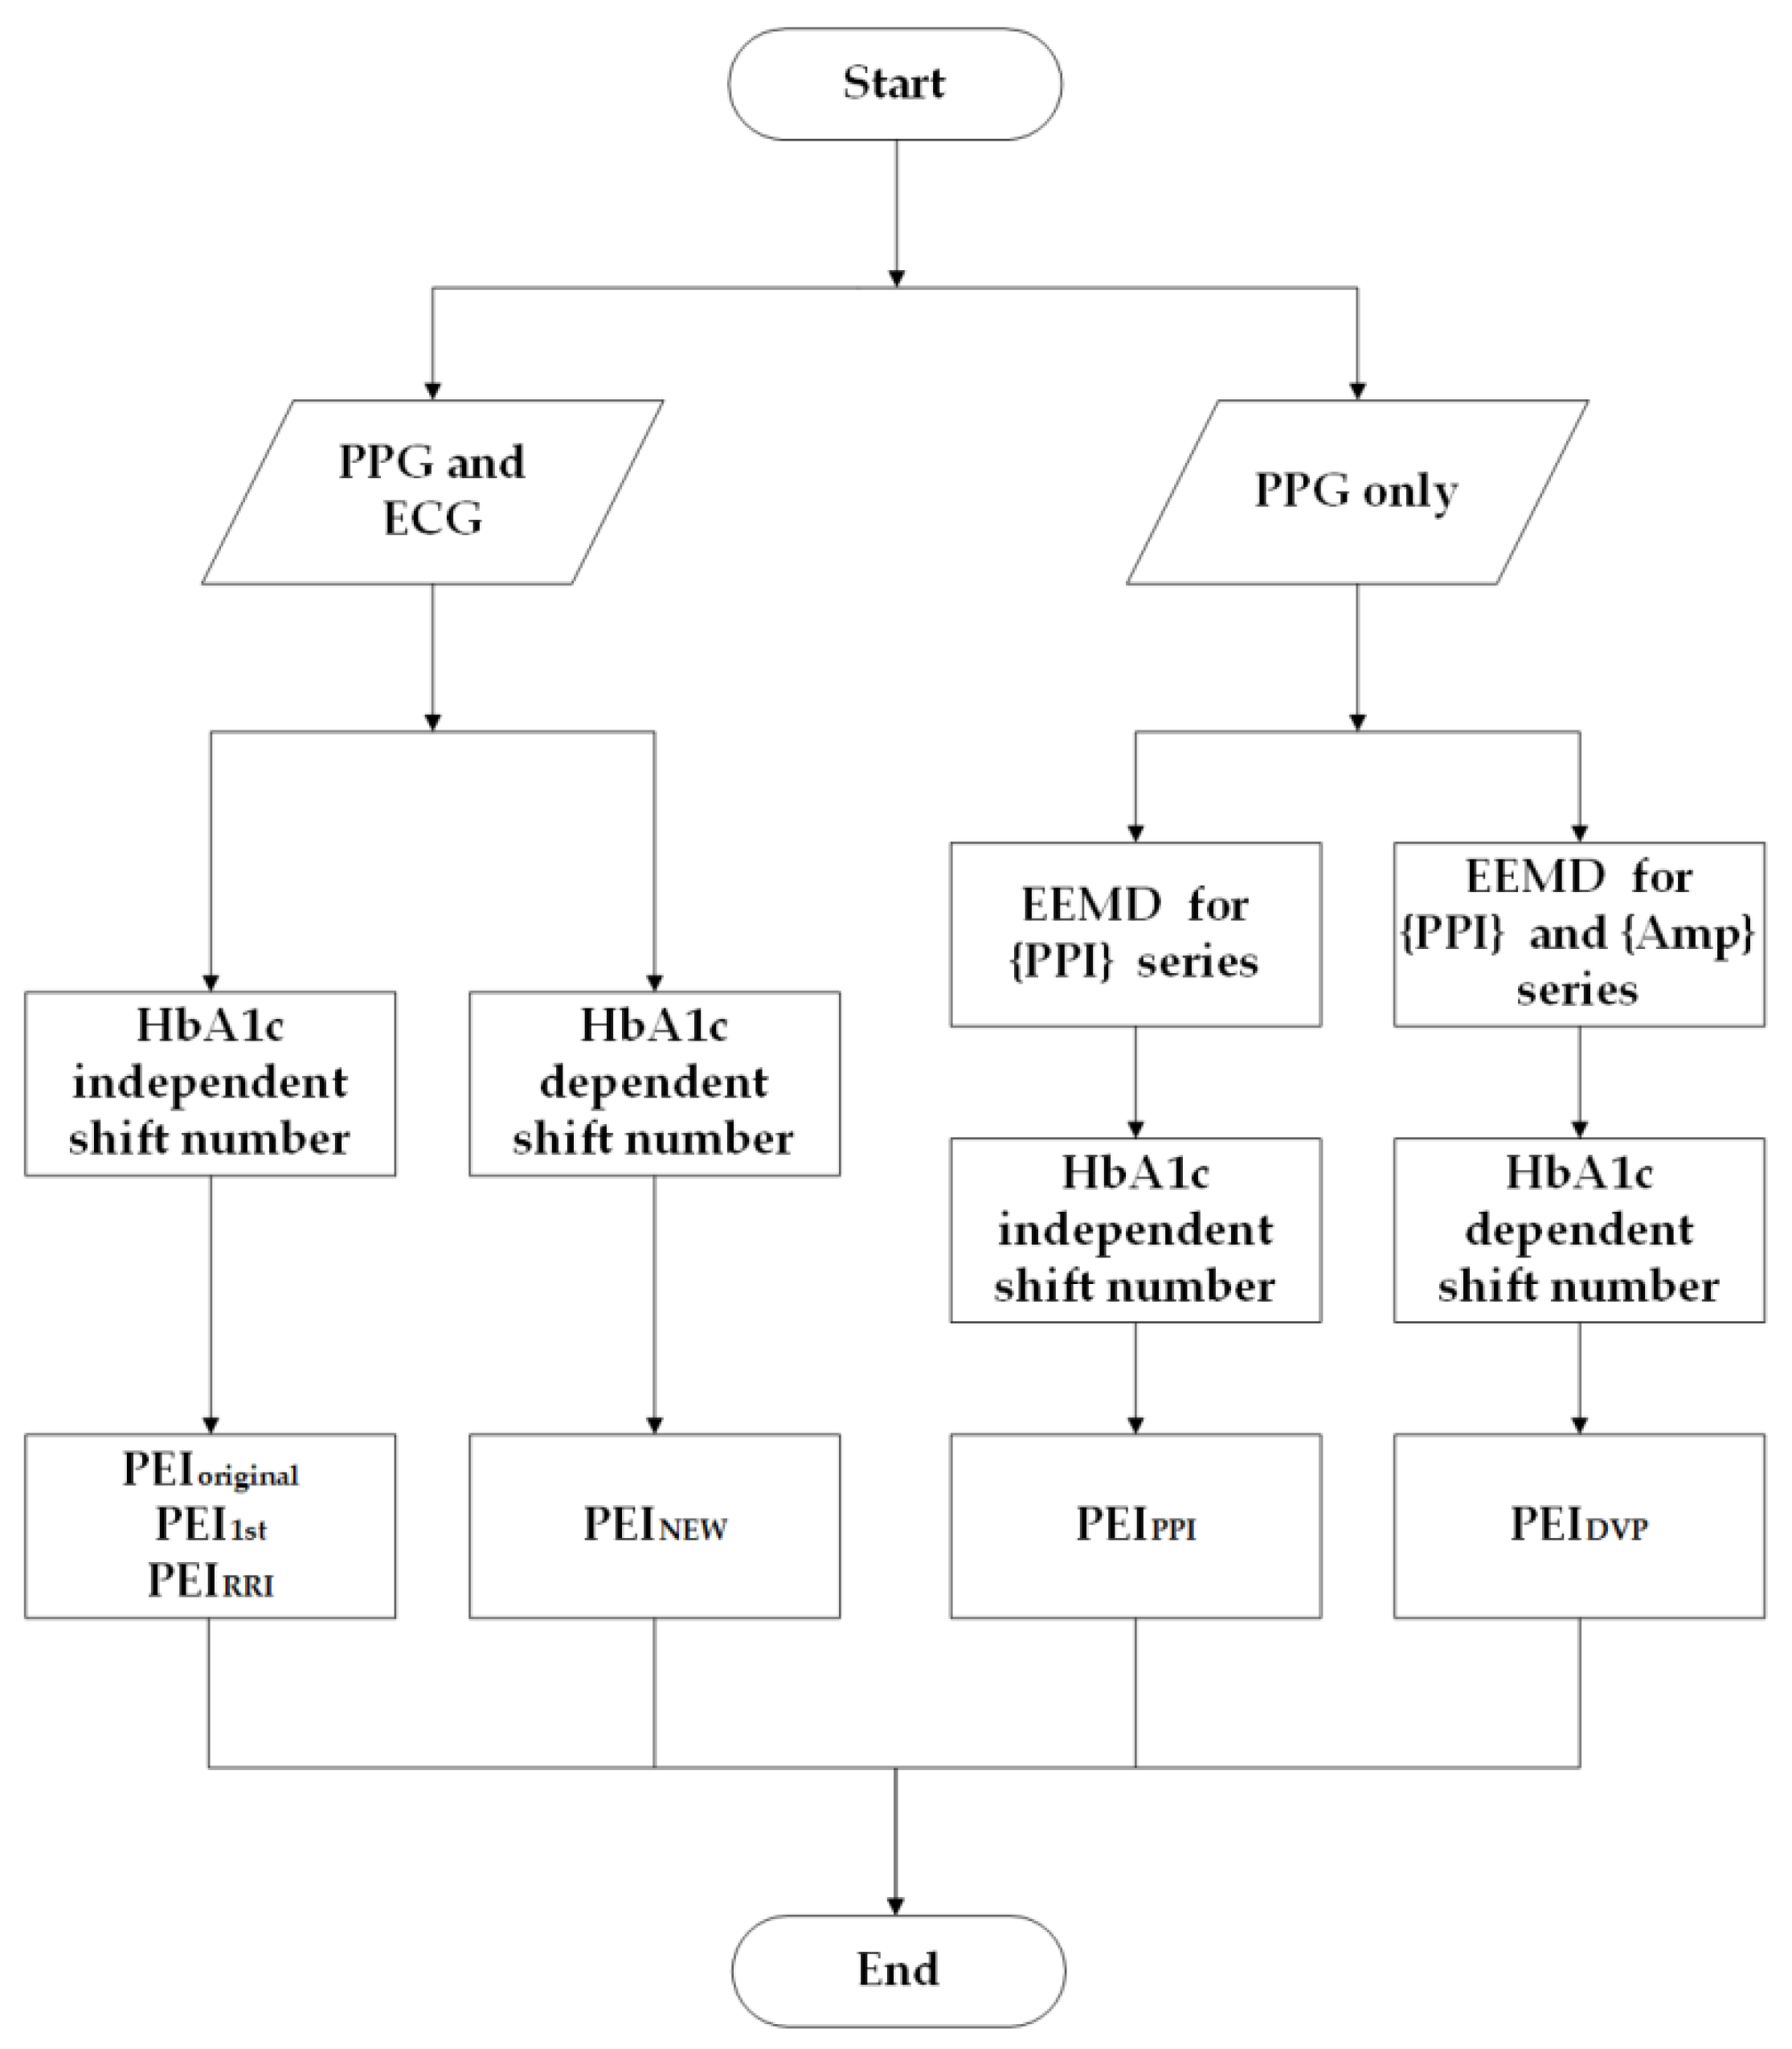
Wei et al. [18] chose nτ = 5 (i.e., HbA1c independent shift number) for PEI1st in accordance with MEISS. However, Xiao et al. proposed a speedy PEI index (PEINEW) [19] and chose nτ = 1 for age-controlled healthy older subjects, nτ = 3 for diabetic subjects with good blood-sugar control (HbA1c < 8), and nτ = 4 for diabetic subjects with poor blood-sugar control (HbA1c ≥ 8) (i.e., HbA1c dependent shift number). Considering surrogate data and cost reduction (ECG was not used), PEIPPI was addressed in [21] with an HbA1c independent shift number. In this study, we followed the latter study in our choice of nτ with an HbA1c dependent shift number after EEMD for {PPI} and {Amp} from decomposed DVP signals, and PEIDVP was subsequently presented (Figure 4).
2.4. Statistical Analysis
Data in Table 1 and Table 2 are expressed as mean ± standard deviation. All tests were performed with SPSS version 14.0 for Windows (SPSS Inc., Chicago, IL, USA). Normality was assessed both visually (e.g., symmetry (skewness) and pointiness (kurtosis)) and with the Shapiro–Wilk test, provided by the SPSS software. We tested whether the data had approximately normal distribution, and data homoscedasticity was then verified. The comparisons of demographic, hemodynamic, anthropometric, and serum biochemical information of the test subjects were analyzed using two independent-sample t-tests with Bonferroni correction, and the differences between categorical variables were assessed using a chi-square test. The significance of differences in anthropometric, hemodynamic, and parametric values (PEIPPI, PEI1st, MEIPPI, and PEIDVP) among the groups was illustrated using independent sample t-tests with Bonferroni correction. Pearson’s correlation test in SPSS was also used to verify correlations between risk factors and the compared indices. A corrected p-value for multiple comparisons with a test-specific significance level of 0.017 was regarded as statistically significant. The effects of risk factors on the incidence of DPN in diabetic patients within 5 years of follow-up were tested by binary logistic regression analysis [28] with the Hosmer–Lemeshow goodness-of-fit test, controlling for age, waist circumference, low-density lipoprotein cholesterol, and the two PEI indices (PEIPPI and PEIDVP).
3. Results
3.1. Testing of Healthy and Diabetic Subjects
Table 1 shows the baseline characteristics of the three groups. Compared with test subjects in healthy group 1, patients in group 2 were older and had higher body weight, waist circumference, body mass index, triglyceride (TG) levels, TG/HDL cholesterol ratio, fasting blood glucose, and glycosylated hemoglobin levels (all p < 0.001). It is worth mentioning that there were no notable differences between groups 2 and 3 in any demographic, anthropometric, hemodynamic, or serum biochemical information gathered from the test subjects (p > 0.017), as shown in Table 1.
3.2. Failure of Original DVPs to Detect Correct Amplitudes in Diabetic Patients
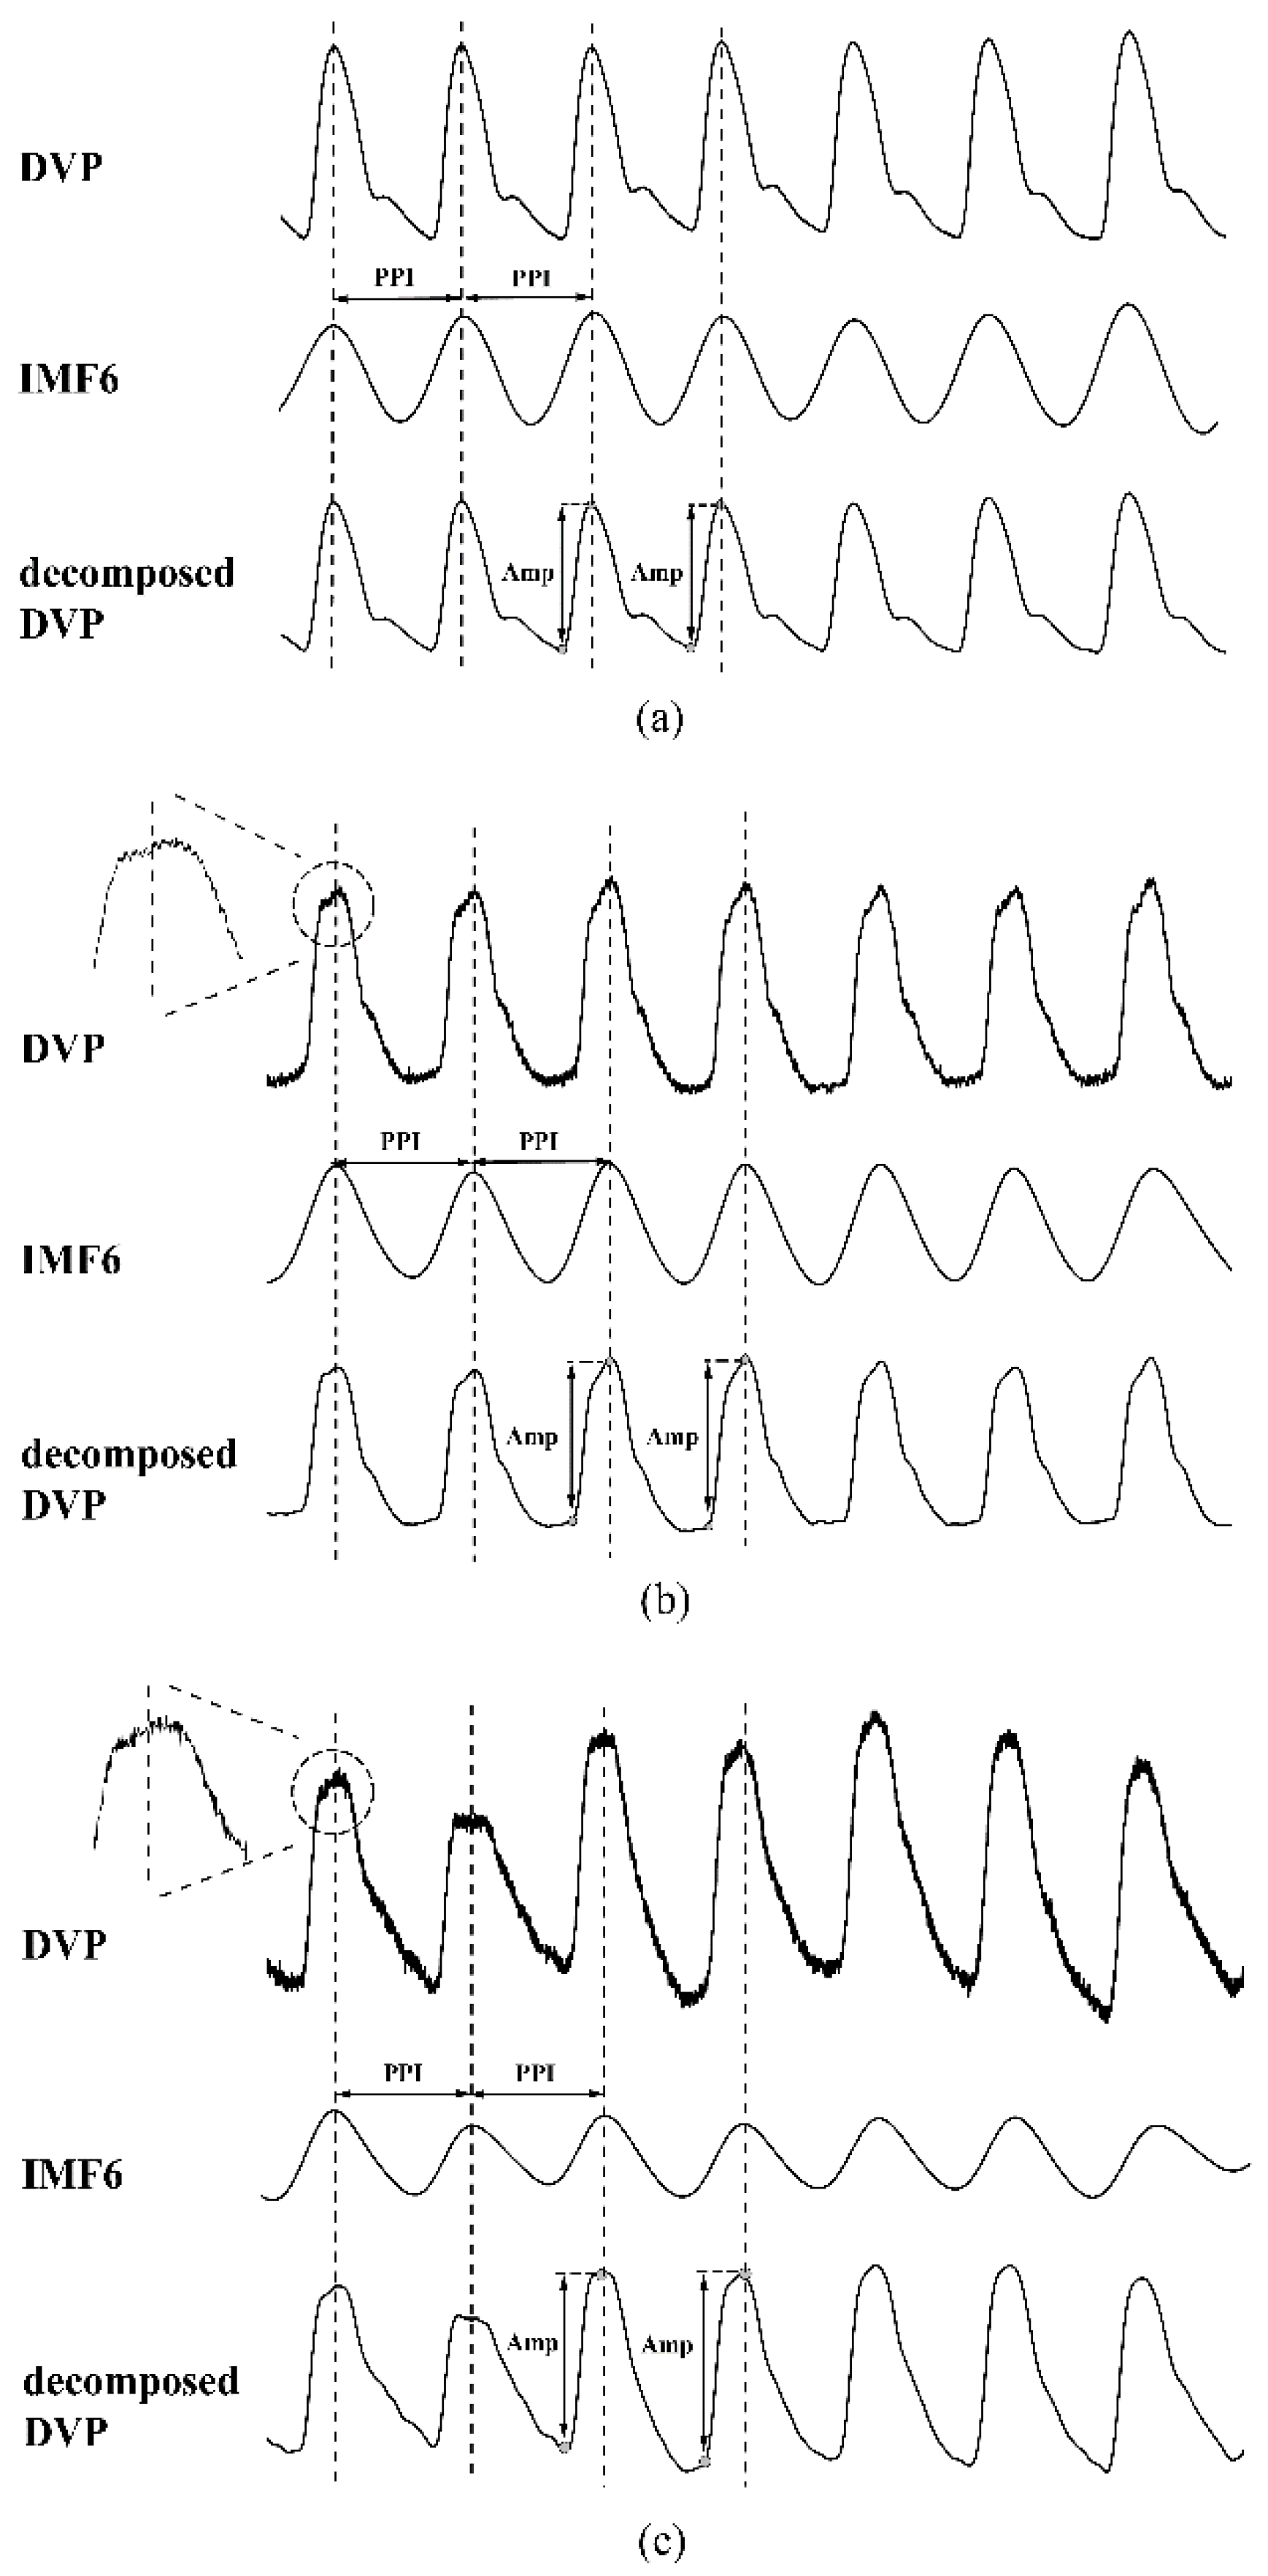
Figure 5 shows the failure of chaotic and subtle digital volume pulses measured at the fingertip of the dominant hand to detect the amplitudes for two diabetic subjects (Figure 5b,c), as compared with the stable peaks of a middle-aged nondiabetic subject (Figure 5a). The results can be attributed to interfering noise, such as that observed in patients with impaired peripheral circulation and respiration, and involuntary vibrations. By implementing EEMD, these noises were removed to obtain decomposed DVP signals (IMF5 and IMF6) for the calculation of exact amplitude series.
3.3. Assessment of Agreement between Amplitudes from Original and Decomposed DVPs
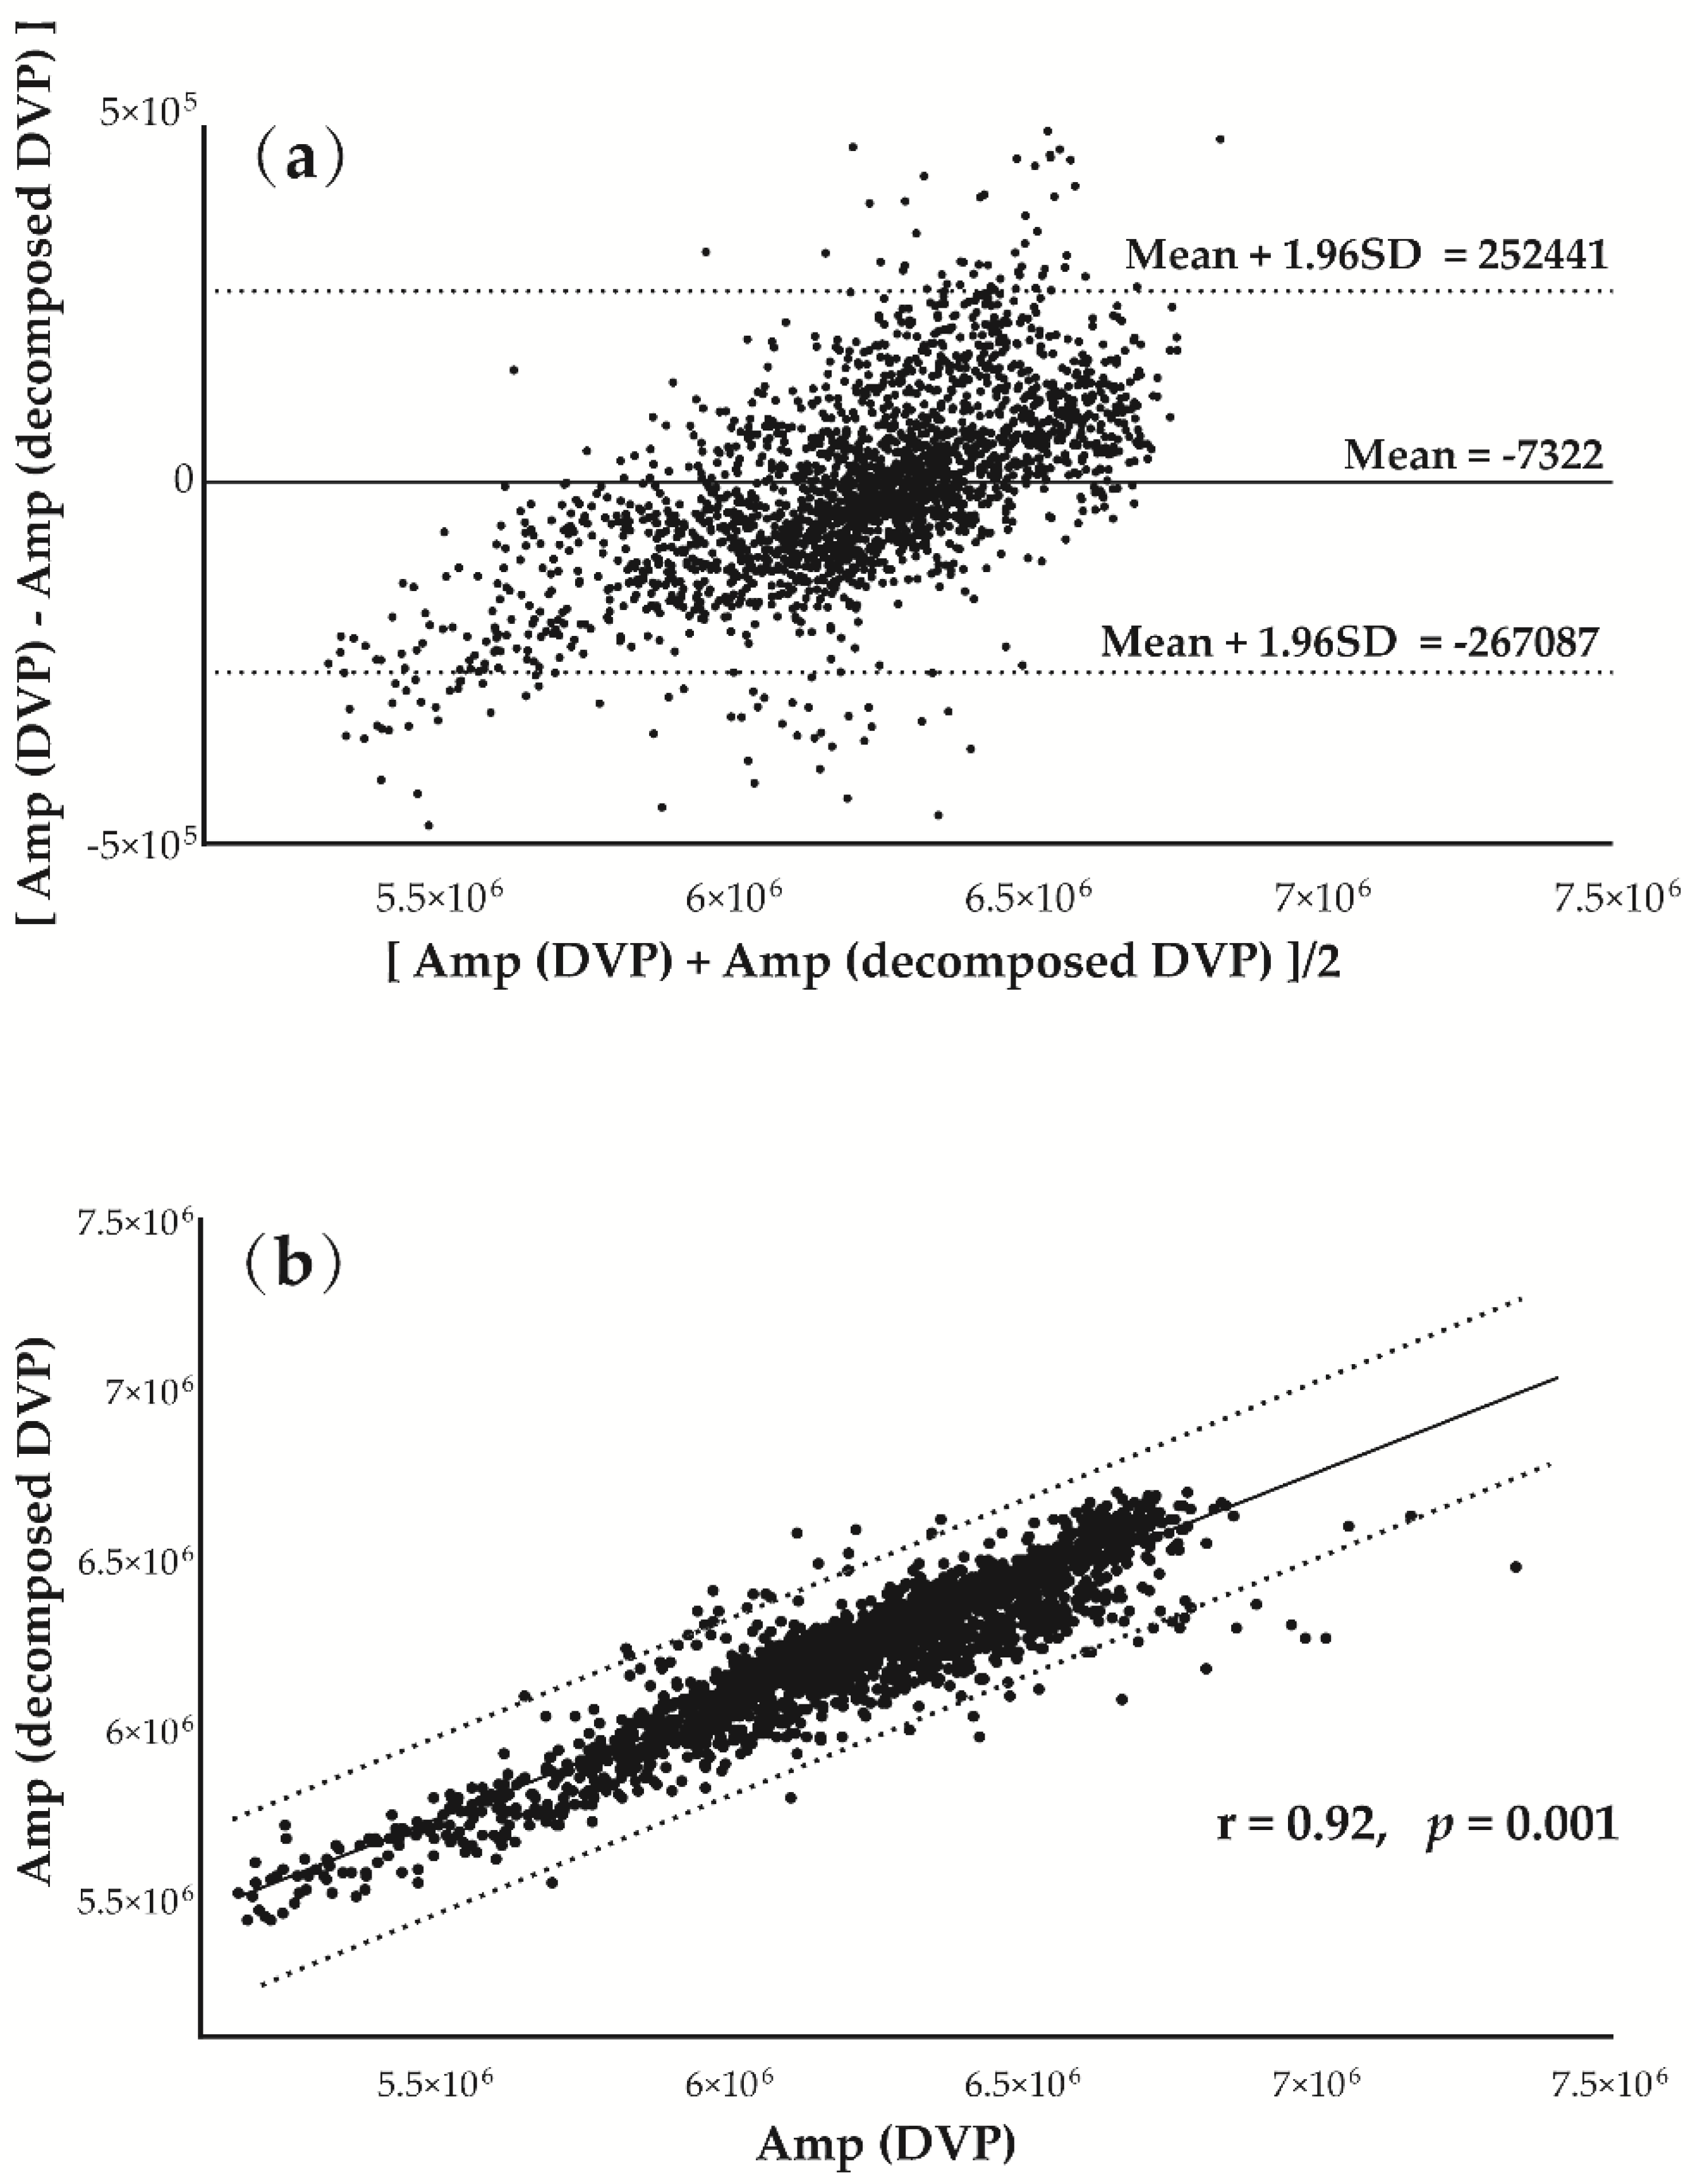
Figure 6 was prepared to verify the hypothesis that the decomposed DVP (IMF5 and IMF6) signals could replace the original DVP for amplitude series determination. Figure 6a shows Bland–Altman plots of these two measurements ({Amp} from decomposed and original DVP) for a subject from group 1. Good agreement was shown between the two measurements for the test subject. In addition, In Figure 6b, the strength of association between the variables is very high (r = 0.92), and the correlation coefficient is very highly significantly different from zero (p = 0.001).
3.4. Performance Comparison of PEIDVP, PEIPPI, PEI1st, and MEIPPI to Differentiate Future Peripheral Neuropathy Prognoses in Type 2 Diabetic Patients
The results of comparing the three previous indices (MEIPPI, PEI1st, and PEIPPI) with the proposed PEIDVP using Equation (6) in BRS evaluation of autonomic function assessment in the three groups are shown in Table 2.
MEIPPI and PEI1st were significantly higher in group 1 than group 2 (p < 0.001); however, there was not a statistically notable difference between groups 2 and 3. Relatively, PEIDVP and PEIPPI successfully discriminated between the test subjects in the three groups with statistically significant differences (all p < 0.017) (Table 2). Diabetic patients without DPN within five years (group 2) had significantly higher PEIDVP than those who had developed DPN within five years (group 3) (0.63 ± 0.08 vs. 0.57 ± 0.08, p = 0.007, 95% CI of difference 0.016 to 0.095) (Table 2).
3.5. Effects of Risk Factors
3.5.1. Correlation of Risk Factors with PEIDVP, PEIPPI, PEI1st, and MEIPPI
The associations of computational indices (MEIPPI, PEI1st, PEIPPI, and PEIDVP) with anthropometric (body weight and waist circumference) and serum biochemical (low-density and high-density lipoprotein cholesterol, triglycerides, triglyceride/HDL cholesterol ratio, fasting blood glucose, and glycated hemoglobin) factors of the three groups of test subjects were determined and analyzed using the Pearson correlation test in SPSS (Table 3). Compared to PEIPPI, PEIDVP was associated with more risk factors.
3.5.2. Effects of Risk Factors Associated with the Risk of Developing DPN
Multivariate analysis showed that subjects without DPN within five years (group 2) had higher PEIDVP and PEIPPI values than those with DPN within five years (group 3) (Table 2), as determined by logistic regression model [30] in SPSS (PEIDVP: odds ratio 0.913, 95% CI 0.850 to 0.980; PEIPPI: odds ratio 0.887, 95% CI 0.791 to 0.994).
Multivariate logistic regression analysis with a backward stepwise approach (likelihood ratio) in SPSS for incidence risk factors of DPN was conducted; the estimated model was with the Hosmer–Lemeshow test: χ2 = 10.03, degrees of freedom = 8, p = 0.263. R2 for logistic regression: Cox–Snell R2 = 0.243 and Nagelkerke R2 = 0.342. Overall percentage in classification table = 76%. There were four significant covariables in the fitted model: age (p = 0.011), waist circumference (p = 0.025), low-density lipoprotein (p = 0.031), and PEIDVP (p = 0.017).
3.6. Computation Time for PEIDVP, PEIPPI, and PEI1st in All Test Subjects
The computation times for the three indices for both nondiabetic and diabetic test subjects were obtained and compared. For this purpose, a personal computer (PC) was used, with specifications as follows: Hasee Notebook with Intel (R) Core (TM) i7-8750H [email protected] GHz 2.20 GHz, Windows 10 Home. The computation program MATLAB R2016b (MathWorks Inc., Natick, MA, USA) was adopted. Two “tic” and “toc” instructions from the MATLAB package were used for the computation of CPU time.
4. Discussion
To quantify the asynchronism between two time series, many entropy-based analysis indices have been used in different research fields, including medicine, mechanics, civil engineering, environment, and finance [15]. To validate whether the dissimilarity of constitutive patterns in synchronized signals (i.e., {Amp} and {PPI} derived from decomposed DVP) in these two states could predict the severity of peripheral neuropathy impairment in this retrospective study, we looked backwards to examine exposure to suspected risk or protection factors in relation to an outcome established at the start of the study (i.e., diabetic patients who developed DPN five years after baseline measurement). As a result, decomposed DVP signals were chosen for percussion analysis using the conventional method after decomposition of the original signal by EEMD (Figure 1 and Figure 2). The decomposed DVP signals can be regarded as noise-free original DVP signals in Figure 5.
There were no statistically notable differences between the diabetic patients in groups 2 and 3 in anthropometric, hemodynamic, demographic, or serum biochemical parameters (all p > 0.017) (Table 1). That is, using these parameters, it would be very difficult to predict how many and which patients would develop peripheral neuropathy within five years. Previous studies [18,20] in which ECG and PPG signals were used proposed PEI1st and presented its sensitivity in differentiating between diabetic subjects without DPN (e.g., with high PEI1st) and with DPN (e.g., with low PEI1st). However, an electrocardiogram (ECG) device is not convenient for some real-time applications. Considering cost reduction, PEIPPI was addressed in [21], in which EEMD was used to separate noises to acquire refined DVP signals (IMF6) for exact PPI calculation in clinical applications. Nevertheless, accurate amplitude calculation from unstable DVP signals is still a problem, as there is always high-frequency noise around the peaks. After EEMD was conducted as proposed in [27,31], the DVP signals measured from fingertips were decomposed as many IMFs (the same IMF6 as used in [21]). In this study, IMF6 and IMF5 (fluctuations resembling systolic and diastolic waveforms in [25]) were added as noise-free decomposed DVP signals. We successfully identified the systolic and diastolic peaks proposed in [32] from the IMF5 component through EEMD for the diabetic patients (Figure 2 and Figure 3). Hence, this study looked at the results from PEIDVP, which showed statistically notable differences between all pairs of groups (group 1 versus group 2 versus group 3: 0.83 ± 0.18 versus 0.63 ± 0.08 versus 0.57 ± 0.08, all p < 0.017) (Table 2), which was consistent with the same finding in [33].
Poor glycemic control is a well-known risk factor for DPN [34,35]. In this study, out of the 25 diabetic patients in group 3, 11 had good blood-glucose control (HbA1c < 8%), and the other 14 had poor blood-glucose control (HbA1c ≧ 8%). Thus, 44% of DPN patients (11 out of 25) had good blood-glucose control at baseline measurement, but unfortunately developed further peripheral neuropathy within the study period. These results were consistent, and the associations of PEIDVP with anthropometric (body weight and waist circumference) and serum biochemical (triglycerides, high-density lipoprotein cholesterol, fasting blood glucose, and glycated hemoglobin) parameters of all test subjects were statistically significant (Table 3). That is, another option (except for appropriate glucose control) exists for diabetic patients. Low PEIDVP in a diabetic patient is recognized as the primary factor in prognosis (i.e., whether the patient is going to develop DPN in the near future), and is still considered the key component in clinical practice [36]. Previous study [36] demonstrated that a useful diagnosis is defined by patient prognosis. In this study, low PEIDVP in a diabetic patient is recognized as the primary factor in prognosis (i.e., whether the patient is going to develop DPN in the near future). In addition, there is another important issue: we need to know the suspected risk or protective factors in relation to an outcome (e.g., diabetic patients developing DPN five years after baseline measurement) by using logistic regression analysis [30] in SPSS (PEIDVP: odds ratio 0.913, 95% CI 0.850 to 0.980; PEIPPI: odds ratio 0.887, 95% CI 0.791 to 0.994). The results confirmed again that both PEIDVP and PEIPPI were protective factors with regard to the binary outcome (i.e., whether diabetic patients developed DPN or not within five years after baseline measurement). Based on previous findings [19], the baroreflex sensitivity regulation capability could differ among different levels of HbA1c control. PEIDVP was calculated via decomposed digital volume pulses from the fingertip with HbA1c dependent shift number, whereas PEIPPI was calculated via original {Amp} series and IMF6 with HbA1c independent shift number (Figure 4). Accordingly, Figure 4 and Table 4 report percussion entropy based index computations. The computation times for PEI indices were determined by decomposing time for EEMD and CPU time for the index computations. The indices with HbA1c dependent shift number can save computation time (PEINEW and PEIDVP). The results in Table 4 show that CPU time for decomposed DVP signals by ensemble empirical mode decomposition would take longer. It goes without saying that the proposed method could be used in real time clinical applications in the near future.
This study still had some limitations. As a retrospective study, the number of test subjects enrolled was relatively small. Second, PEIDVP was more complex for IMF5 and IMF6 computation than PEI1st, but the number of scales was smaller (five for PEI1st, three or four for PEIDVP in Equation (6); Figure 4). Third, real-time processing was not possible for PEIDVP computation because EEMD requires many operations. PEIDVP information could not be provided immediately to the test subjects. In the future, using a real-time LabVIEW-based package could overcome this problem.
5. Conclusions
This study not only highlights that PPG-derived decomposed digital volume pulse signals can be freed of high-frequency noise by ensemble empirical mode decomposition and can be a major contributor to successfully determining amplitudes and stable peak-to-peak interval series (i.e., synchronized {Amp} and {PPI} signals), but also recommends the possible clinical application of a new percussion entropy index (PEIDVP) for use as a prognostic indicator of a protective factor for diabetic patients with peripheral neuropathy dysfunction.
Author Contributions
Conceptualization, H.-C.W., W.-R.H. and H.-T.W.; Data curation, W.-R.H.; Formal analysis, W.-R.H. and N.T.; Funding acquisition, H.-C.W.; Investigation, H.-C.W., M.-X.X., X.-J.T. and H.-T.W.; Methodology, W.-R.H. and H.-T.W.; Project administration, H.-C.W., M.-X.X. and H.-T.W.; Resources, H.-C.W. and X.-J.T.; Software, W.-R.H. and N.T.; Validation, N.T.; Visualization, W.-R.H.; Writing—original draft, H.-C.W. and H.-T.W.; Writing—review & editing, X.-J.T. All authors have read and agreed to the published version of the manuscript.
Funding
This research was funded by National Natural Science Foundation of China (No. 61861001) and North Minzu University Scientific Research Projects (Major projects No. 2019KJ37). The Young and Middle-aged Talents Program of National Ethnic Affairs Commission of China. Data processing was supported by Ningxia Technology Innovative Team of advanced intelligent perception & control and the Key Laboratory of Intelligent Perception Control at North Minzu University. This research was also funded by Natural Science Foundation of Ningxia (No. 2020AAC03220).
Acknowledgments
The authors would like to thank the Guest editor and Reviews for their insightful recommendations, which have contributed greatly to the improvement of this work. The authors are grateful for the support of Texas Instruments, Taiwan, in sponsoring the MSP tools and assisting in developing novel signal-processing techniques as a contribution to preventive medicine in this study.
Conflicts of Interest
The authors in this study declared no potential conflict of interests with regard to the research, authorship, and publication of this article.
References
- Bonetti, P.O.; Lerman, L.O.; Lerman, A. Endothelial dysfunction: A marker of atherosclerotic risk. Arterioscler. Thromb. Vasc. Biol. 2003, 23, 168–175. [Google Scholar] [CrossRef] [PubMed]
- Bonetti, P.O.; Pumper, G.M.; Higano, S.T.; Holmes, D.R., Jr.; Kuvin, J.T.; Lerman, A. Noninvasive identification of patients with early coronary atherosclerosis by assessment of digital reactive hyperemia. J. Am. Coll. Cardiol. 2004, 44, 2137–2141. [Google Scholar] [CrossRef] [PubMed] [Green Version]
- Quattrini, C.; Jeziorska, M.; Boulton, A.J.; Malik, R.A. Reduced vascular endothelial growth factor expression and intra-epidermal nerve fiber loss in human diabetic neuropathy. Diabetes Care 2008, 31, 140–145. [Google Scholar] [CrossRef] [PubMed] [Green Version]
- Grover-Paez, F.; Zavalza-Gomez, A.B. Endothelial dysfunction and cardiovascular risk factors. Diabetes Res. Clin. Pract. 2009, 84, 1–10. [Google Scholar] [CrossRef] [PubMed]
- Gubitosi-Klug, R.A.; DCCT/EDIC Research Group. The diabetes control and complications trial/epidemiology of diabetes interventions and complications study at 30 years: Summary and future directions. Diabetes Care 2014, 37, 44–49. [Google Scholar] [CrossRef] [Green Version]
- Valencia, W.M.; Florez, H. How to prevent the microvascular complications of type 2 diabetes beyond glucose control. BMJ 2017, 356, i6505. [Google Scholar] [CrossRef] [Green Version]
- Young, M.J.; Boulton, A.J.; MacLeod, A.F.; Williams, D.R.; Sonksen, P.H. A multicentre study of the prevalence of diabetic peripheral neuropathy in the United Kingdom hospital clinic population. Diabetologia 1993, 36, 150–154. [Google Scholar] [CrossRef] [Green Version]
- Juster-Switlyk, K.; Smith, A.G. Updates in diabetic peripheral neuropathy. F1000Research 2016, 5. F1000 Faculty Rev-738. [Google Scholar] [CrossRef]
- Iqbal, Z.; Azmi, S.; Yadav, R.; Ferdousi, M.; Kumar, M.; Cuthbertson, D.J.; Lim, J.; Malik, R.A.; Alam, U. Diabetic peripheral neuropathy: Epidemiology, diagnosis, and pharmacotherapy. Clin. Ther. 2018, 40, 828–849. [Google Scholar] [CrossRef] [Green Version]
- Vaidya, V.; Gangan, N.; Sheehan, J. Impact of cardiovascular complications among patients with Type 2 diabetes mellitus: A systematic review. Expert Rev. Pharmacoecon. Outcomes Res. 2015, 15, 487–497. [Google Scholar] [CrossRef]
- Elgendi, M. On the analysis of fingertip photoplethysmogram signals. Curr. Cardiol. Rev. 2012, 8, 14–25. [Google Scholar] [CrossRef] [PubMed]
- Chawla, A.; Chawla, R.; Jaggi, S. Microvasular and macrovascular complications in diabetes mellitus: Distinct or continuum? Indian J. Endocrinol. Metab. 2016, 20, 4–546. [Google Scholar] [CrossRef] [PubMed]
- Sohaila, C.; Patrick, M.; Zirie, M.; Jayyousi, A.; Alrouh, H.; Amit Abraham, A.; Al-Samraye, S.; Mahfoud, Z.; Al-Janahi, I.M.; Ibrahim, B.; et al. Risk factors for microvascular complications of diabetes in a high-risk middle east population. J. Diabetes Res. 2018, 2018, 8964027. [Google Scholar]
- Lin, I.W.; Chang, H.H.; Lee, Y.H.; Wu, Y.C.; Lu, C.W.; Huang, K.C. Blood sugar control among type 2 diabetic patients who travel abroad: A cross sectional study. Medicine (Baltimore) 2019, 98, e14946. [Google Scholar] [CrossRef] [PubMed]
- Jamin, A.; Humeau-Heurtier, A. (Multiscale) Cross-Entropy Methods: A Review. Entropy 2020, 22, 45. [Google Scholar] [CrossRef] [Green Version]
- Wu, H.T.; Lee, C.Y.; Liu, C.C.; Liu, A.B. Multiscale Cross-Approximate Entropy Analysis as a Measurement of Complexity between ECG R-R Interval and PPG Pulse Amplitude Series among the Normal and Diabetic Subjects. Comput. Math. Methods Med. 2013, 2013, 7. [Google Scholar] [CrossRef]
- Georgieva-Tsaneva, G.; Gospodinova, E.; Gospodinov, M.; Cheshmedzhiev, K. Cardio-Diagnostic Assisting Computer System. Diagnostics 2020, 10, 322. [Google Scholar] [CrossRef]
- Wei, H.C.; Xiao, M.X.; Ta, N.; Wu, H.T.; Sun, C.K. Assessment of diabetic autonomic nervous dysfunction with a novel percussion entropy approach. Complexity 2019, 2019, 6469853. [Google Scholar] [CrossRef] [Green Version]
- Xiao, M.X.; Lu, C.H.; Ta, N.; Jiang, W.W.; Tang, X.J.; Wu, H.T. Application of a Speedy Modified Entropy Method in Assessing the Complexity of Baroreflex Sensitivity for Age-Controlled Healthy and Diabetic Subjects. Entropy 2019, 21, 894. [Google Scholar] [CrossRef] [Green Version]
- Wei, H.-C.; Ta, N.; Hu, W.-R.; Wang, S.-Y.; Xiao, M.-X.; Tang, X.-J.; Chen, J.-J.; Wu, H.-T. Percussion Entropy Analysis of Synchronized ECG and PPG Signals as a Prognostic Indicator for Future Peripheral Neuropathy in Type 2 Diabetic Subjects. Diagnostics 2020, 10, 32. [Google Scholar] [CrossRef] [Green Version]
- Wei, H.C.; Ta, N.; Hu, W.R.; Xiao, M.X.; Tang, X.J.; Haryadi, B.; Liou, J.J.; Wu, H.T. Digital Volume Pulse Measured at the Fingertip as an Indicator of Diabetic Peripheral Neuropathy in the Aged and Diabetic. Entropy 2019, 21, 1229. [Google Scholar] [CrossRef] [Green Version]
- Lee, J.; Yang, S.; Lee, S.; Kim, H.C. Analysis of Pulse Arrival Time as an Indicator of Blood Pressure in a Large Surgical Biosignal Database: Recommendations for Developing Ubiquitous Blood Pressure Monitoring Methods. J. Clin. Med. 2019, 8, 1773. [Google Scholar] [CrossRef] [PubMed] [Green Version]
- Baldoumas, G.; Peschos, D.; Tatsis, G.; Chronopoulos, S.K.; Christofilakis, V.; Kostarakis, P.; Varotsos, P.; Sarlis, N.V.; Skordas, E.S.; Bechlioulis, A.; et al. A Prototype Photoplethysmography Electronic Device that Distinguishes Congestive Heart Failure from Healthy Individuals by Applying Natural Time Analysis. Electronics 2019, 8, 1288. [Google Scholar] [CrossRef] [Green Version]
- Liang, Y.; Chen, Z.; Ward, R.; Elgendi, M. Hypertension Assessment Using Photoplethysmography: A Risk Stratification Approach. J. Clin. Med. 2019, 8, 12. [Google Scholar] [CrossRef] [PubMed] [Green Version]
- Wu, H.T.; Lee, C.H.; Liu, A.B.; Chung, W.S.; Tang, C.J.; Sun, C.K.; Yip, H.K. Arterial stiffness using radial. arterial waveforms measured at the wrist as an indicator of diabetic control in the elderly. IEEE Trans. Biomed. Eng. 2011, 58, 243–252. [Google Scholar] [PubMed]
- Wu, H.T.; Hsu, P.C.; Lin, C.F.; Wang, H.J.; Sun, C.K.; Liu, A.B.; Lo, M.T.; Tang, C.J. Multiscale entropy analysis of pulse wave velocity for assessing atherosclerosis in the aged and diabetic. IEEE Trans. Biomed. Eng. 2011, 58, 2978–2981. [Google Scholar]
- Wu, Z.; Huang, N.E. Ensemble empirical mode decomposition: A noise-assisted data analysis method. Adv. Adapt. Data Anal. 2009, 1, 1–41. [Google Scholar] [CrossRef]
- Tseng, C.Y.; Lee, H.C. Entropic interpretation of empirical mode decomposition and its applications in signal processing. Adv. Adapt. Data Anal. 2010, 2, 429–449. [Google Scholar] [CrossRef]
- Huang, N.E.; Daubechies, I.; Hou, T.Y. Adaptive data analysis: Theory and applications. Phil. Trans. R. Soc. A 2016, 374, 20150207. [Google Scholar] [CrossRef] [PubMed]
- Sperandei, S. Understanding logistic regression analysis. Biochem. Med. (Zagreb.) 2014, 24, 12–18. [Google Scholar] [CrossRef] [PubMed]
- Huang, N.E.; Shen, Z.; Long, S.R.; Wu, M.C.; Shih, H.H.; Zheng, Q.; Yen, N.C.; Tung, C.C.; Liu, H.H. The empirical mode decomposition and the Hubert spectrum for nonlinear and non-stationary time series analysis. Proc. R. Soc. A 1998, 454, 903–995. [Google Scholar] [CrossRef]
- Millasseau, S.C.; Ritter, J.M.; Takazawa, K.; Chowienczyk, P.J. Contour analysis of the photoplethysmographic pulse measured at the finger. J. Hypertens. 2006, 24, 1449–1456. [Google Scholar] [CrossRef] [PubMed]
- Ruiz, J.; Monbaron, D.; Parati, G.; Perret, S.; Haesler, E.; Danzeisen, C.; Hayoz, D. Diabetic neuropathy is a more important determinant of baroreflex sensitivity than carotid elasticity in type 2 diabetes. Hypertension 2005, 46, 162–167. [Google Scholar] [CrossRef] [Green Version]
- Joseph, J.J.; Echou o-Tcheugui, J.B.; Golden, S.H.; Chen, H.; Jenny, N.S.; Carnethon, M.R.; Jacobs, D., Jr.; Burke, G.L.; Vaidya, D.; Ouyang, P.; et al. Physical activity, sedentary behaviors and the incidence of type 2 diabetes mellitus: The Multi-Ethnic Study of Atherosclerosis. BMJ Open Diabetes Res. Care 2016, 4, e000185. [Google Scholar] [CrossRef] [PubMed] [Green Version]
- Papanas, N.; Ziegler, D. Risk factors and comorbidities in diabetic neuropathy: An Update 2015. RDS 2015, 12, 48–62. [Google Scholar] [CrossRef] [PubMed] [Green Version]
- Croft, P.; Altman, D.G.; Deeks, J.J.; Dunn, K.M.; Hay, A.D.; Hemingway, H.; Timmis, A. The science of clinical practice: Disease diagnosis or patient prognosis? Evidence about “what is likely to happen” should shape clinical practice. BMC Med. 2015, 13, 20. [Google Scholar] [CrossRef] [PubMed] [Green Version]
Figure 1.
Representative illustration of original digital volume pulse (DVP) signals for group 1 subject; 7 intrinsic mode functions and residue were decomposed after ensemble empirical mode decomposition (EEMD). The amplitudes of intrinsic mode function (IMF) 5 and 6 were remarkably higher than those of IMF1–4. Moreover, fluctuations resembling systolic and diastolic peaks were noted in IMF5. IMF6 is sine wave-like, caused by the impact of the heartbeat on DVP signals from the fingertip, exhibiting a frequency close to that of the heart rate (i.e., 8 beats/6 (s) = 1.333 Hz).

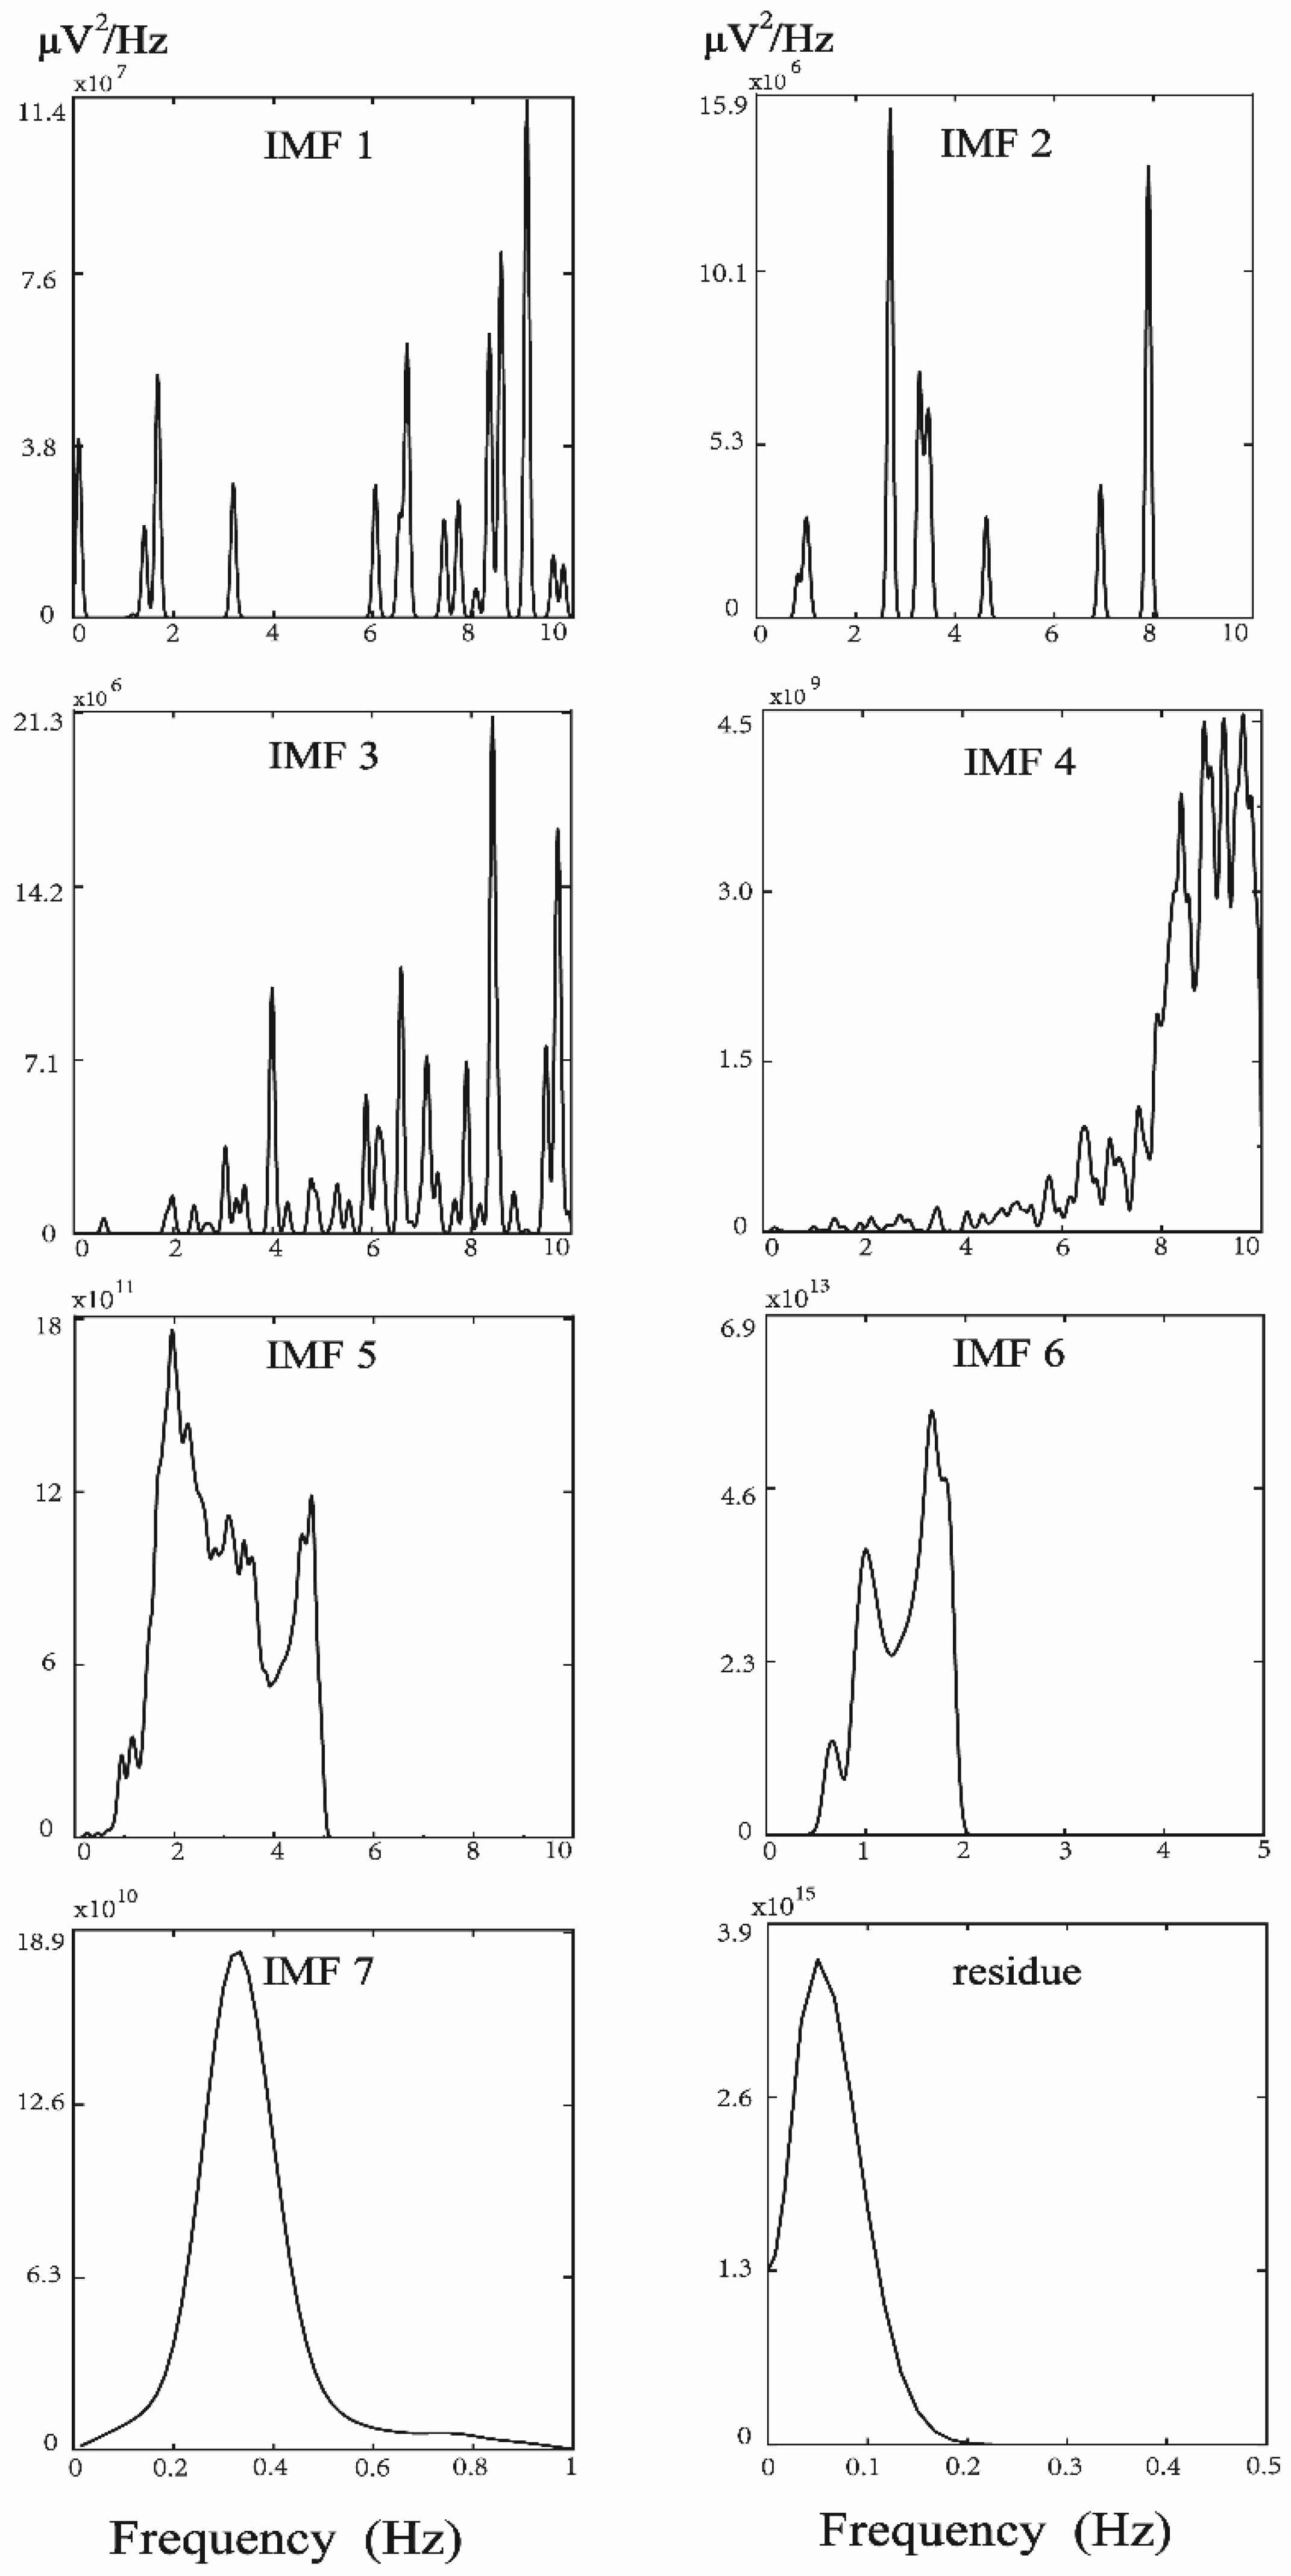
Figure 2.
Marginal spectral density of 7 intrinsic mode functions and residue from a healthy subject, presented in Figure 1. Energy distribution analysis for IMF5 and IMF6 showed that their frequency distributions were as between 1–5 Hz. Hence, IMF5 and IMF6 were the noise-free component required in this study.

Figure 3.
New percussion entropy index (PEIDVP) computation flowchart. Standard deviation of added noise was set as α = 0.2, and trial number was 200 for ensemble empirical mode decomposition (EEMD). As in [21], peak-to-peak interval of the sixth decomposed intrinsic mode function (IMF6) was used for multiscale entropy index (MEIPPI) calculation. After removing high-frequency noise in the original DVP signals, decomposed DVP signals (IMF5 and IMF6) were used for percussion entropy-based index computation.

Figure 4.
Flowchart of percussion entropy based index computations. Two synchronized photoplethysmography (PPG) pulse amplitude (Amp) and RR interval (RRI) series were acquired for PEI1st (i.e., the same as PEIoriginal and PEIRRI) and PEINEW. The difference between PEI1st and PEINEW is in the shift number. Based on the previous findings, the baroreflex sensitivity regulation capability could differ among different HbA1c controls. For HbA1c dependent shift number, the shift number is set as 1 for subjects with HbA1c < 6.5, as 3 for subjects with 6.5 ≦ HbA1c < 8, and as 4 for subjects with HbA1c ≥ 8. Relatively, HbA1c independent shift number is always set as 5. On the other hand, PEIDVP was calculated via decomposed digital volume pulses from the fingertip with HbA1c dependent shift number, whereas PEIPPI was calculated via original {Amp} series and IMF6 with HbA1c independent shift number.

Figure 5.
Digital volume pulse (DVP) signals, corresponding to decomposed sixth intrinsic mode function (IMF6), and decomposed DVP signals (IMF5 and IMF6) from one representative subject in each group: (a) subject A: healthy subject in group 1 (age: 49 years; WC: 88 cm; BMI: 23.8; HbA1c: 6.4%); (b) subject B: diabetic patient without peripheral neuropathy in group 2 (age: 57 years; WC: 90 cm; BMI: 25.2; HbA1c: 8.4%); (c) subject C: type 2 diabetic patient with peripheral neuropathy within 5 years in group 3 (age: 63 years; WC: 89 cm; BMI: 28.8; HbA1c: 10.1%). Peaks of DVP, IMF6, and decomposed DVP were in phase for subject A. It was difficult to calculate exact amplitudes from DVP for subjects B and C, due to high-frequency noise embedded in the original DVP signals. For all decomposed DVP signals, exact amplitudes could be calculated easily and accurately. Intuitively, the decomposed DVP signals can be regarded as noise-free original DVP signals for (a–c).

Figure 6.
(a) Bland–Altman plot showing good agreement between two {Amp} sequences from DVP and decomposed DVP signals. (b) Positive correlation between {Amp} sequences from DVP and decomposed DVP signals for subject A in Figure 3 (r = 0.92, p = 0.001). Regression line describes the 95% confidence interval.


Table 1.
Characteristics of the study population.
| Parameter | Group 1 | Group 2 | Group 3 |
|---|---|---|---|
| N = 50 | N = 55 | N = 25 | |
| Female/Male | Female/Male | Female/Male | |
| (27/23) | (18/37) | (10/15) | |
| Age (years) | 58.24 ± 9.38 | 67.20 ± 8.72 ** | 62.48 ± 8.45 |
| Body height (cm) | 160.74 ± 6.90 | 159.49 ± 6.88 | 163.72 ± 8.82 |
| Body weight (kg) | 61.71 ± 9.98 | 67.92 ± 9.73 ** | 71.76 ± 7.23 |
| WC (cm) | 83.72 ± 10.49 | 92.67 ± 8.43 ** | 95.48 ± 6.59 |
| BMI (kg/m2) | 23.85 ± 3.41 | 26.70 ± 3.59 ** | 26.94 ± 3.71 |
| SBP (mmHg) | 132.30 ± 36.37 | 126.45 ± 16.10 | 125.12 ± 30.33 |
| DBP (mmHg) | 81.22 ± 15.04 | 73.91 ± 9.89 * | 71.84 ± 17.23 |
| PP (mmHg) | 52.60 ± 14.75 | 52.55 ± 12.37 | 53.28 ± 18.03 |
| HDL (mg/dL) | 51.82 ± 14.79 | 46.60 ± 15.98 | 39.28 ± 5.80 |
| LDL (mg/dL) | 121.15 ± 23.13 | 118.41 ± 38.38 | 105.28 ± 22.52 |
| Cholesterol (mg/dL) | 195.74 ± 40.65 | 179.30 ± 44.63 | 178.19 ± 28.57 |
| Triglyceride (mg/dL) | 99.71 ± 32.65 | 139.89 ± 65.41 ** | 160.82 ± 62.74 |
| TG/HDL | 2.06 ± 0.97 | 3.54 ±2.31 ** | 4.18 ± 2.38 |
| FBS (mg/dL) | 99.15 ± 17.88 | 148.22 ± 39.33 ** | 158.24 ± 54.18 |
| HbA1c (%) | 6.03 ± 1.37 | 7.87 ± 1.32 ** | 8.30 ± 1.45 |
Data are expressed as mean ± standard deviation. Group 1: healthy subjects; group 2: diabetic patients without peripheral neuropathy within 5 years; group 3: diabetic patients with peripheral neuropathy within 5 years. WC, waist circumference; BMI, body mass index; SBP, systolic blood pressure; DBP, diastolic blood pressure; PP, pulse pressure; HDL, high-density lipoprotein; LDL, low-density lipoprotein; TG/HDL, triglyceride/HDL ratio; FBS, fasting blood sugar; HbA1c, glycosylated hemoglobin. * p < 0.017 group 1 versus group 2, ** p < 0.001 group 1 versus group 2.
Table 2.
Performance comparison among the three groups of test subjects for baroreflex sensitivity (BRS) and autonomic function assessment.
Table 2.
Performance comparison among the three groups of test subjects for baroreflex sensitivity (BRS) and autonomic function assessment.
| Parameters | Group 1 (N = 50) | Group 2 (N = 55) | Group 3 (N = 25) |
|---|---|---|---|
| MEIPPI | 0.52 ± 0.18 | 0.37 ± 0.20 ** | 0.36 ± 0.19 |
| PEI1st | 0.71 ± 0.05 | 0.59 ± 0.11 ** | 0.61 ± 0.11 |
| PEIPPI | 0.68 ± 0.03 | 0.66 ± 0.04 * | 0.63 ± 0.06 † |
| PEIDVP | 0.83 ± 0.18 | 0.63 ± 0.08 ** | 0.57 ± 0.08 † |
Data are expressed as mean ± standard deviation. Group 1: healthy subjects; group 2: diabetic patients without peripheral neuropathy within the study period; group 3: diabetic patients with peripheral neuropathy. MEIPPI: mean value of sample entropy on a scale from 1 to 5 using the {PPI} dataset only [16]. PEI1st: percussion entropy index using synchronized {RRI} and {Amp} from original DVPs [18]. PEIPPI: percussion entropy index using synchronized {PPI} and {Amp} from original DVPs [21]. PEIDVP: percussion entropy index using synchronized {PPI} and {Amp} from decomposed DVPs in this study. * p < 0.017 group 1 versus group 2, ** p < 0.001 group 1 versus group 2, † p < 0.017 group 2 versus group 3. p-value of unpaired student t-test less than 0.017 was noted as statistically significant in this study.
Table 3.
Associations of anthropometric and serum biochemical risk factors with parameters in all test subjects.
Table 3.
Associations of anthropometric and serum biochemical risk factors with parameters in all test subjects.
| Risk Factor | MEIPPI | PEI1st | PEIPPI | PEIDVP | ||||
|---|---|---|---|---|---|---|---|---|
| r | p | r | p | r | p | r | p | |
| Age (years) | −0.21 | 0.02 | −0.14 | 0.09 | −0.01 | 0.90 | −0.13 | 0.12 |
| BW (kg) | −0.05 | 0.52 | −0.26 | <0.001 | −0.02 | 0.80 | −0.30 | <0.001 |
| WC (cm) | −0.11 | 0.21 | −0.33 | <0.001 | −0.07 | 0.46 | −0.31 | <0.001 |
| LDL (mg/dL) | 0.04 | 0.64 | 0.12 | 0.15 | 0.13 | 0.13 | 0.05 | 0.56 |
| HDL (mg/dL) | 0.09 | 0.31 | 0.19 | 0.03 | 0.03 | 0.70 | 0.16 | 0.05 |
| TG (mg/dL) | −0.01 | 0.93 | −0.30 | <0.001 | −0.04 | 0.61 | −0.29 | <0.001 |
| TG/HDL | −0.02 | 0.76 | −0.30 | <0.001 | −0.01 | 0.91 | −0.28 | <0.001 |
| FBS (mg/dL) | −0.24 | <0.001 | −0.33 | <0.001 | −0.12 | 0.17 | −0.37 | <0.001 |
| HbA1c (%) | −0.21 | 0.01 | −0.38 | <0.001 | −0.19 | 0.02 | −0.34 | <0.001 |
MEIPPI: mean value of sample entropy on a scale from 1 to 5 using {PPI} dataset only [16]. PEI1st: percussion entropy index using synchronized {RRI} and {Amp} from original DVPs [18]. PEIPPI: percussion entropy index using synchronized {PPI} and {Amp} from original DVPs [21]. PEIDVP: percussion entropy index using synchronized {PPI} and {Amp} from decomposed DVPs. r: Pearson’s correlation coefficient is a measure of the linear correlation between index (e.g., MEIPPI, PEI1st, PEIPPI, and PEIDVP) and risk factor. It has a value between +1 and −1; 1 stands for total positive linear correlation, 0 means no linear correlation, and −1 signifies total negative linear correlation. p-values less than 0.05 were considered statistically significant.BW, body weight; WC, waist circumference; LDL, low-density lipoprotein; HDL, high-density lipoprotein; TG, triglyceride; TG/HDL, triglyceride/HDL cholesterol ratio; FBS, fasting blood sugar; HbA1c, glycosylated hemoglobin.
Table 4.
Computation times for PEIDVP, PEIPPI, and PEI1st in all test groups.
| Computation Time for Index | Group 1 | Group 2 | Group 3 | ||
|---|---|---|---|---|---|
| PEI1st |  | Average EEMD time (s) | 0 | 0 | 0 |
| CPU time for index (ms) | 21.29 ± 2.02 | 20.04 ± 1.61 | 20.39 ± 1.89 | ||
| PEIPPI | | Average EEMD time (s) | 7.06 ± 0.91 | 6.76 ± 0.75 | 6.67 ± 0.84 |
| CPU time for index (ms) | 6.09 ± 0.81 | 17.55 ± 1.71 ** | 18.25 ± 1.25 | ||
| PEIDVP | | Average EEMD time (s) | 7.06 ± 0.91 | 6.76 ± 0.75 | 6.67 ± 0.84 |
| CPU time for index (ms) | 6.16 ± 0.86 | 17.69 ± 1.54 ** | 17.88 ± 1.64 | ||
PEI1st: percussion entropy index using synchronized {RRI} and {Amp} from original DVPs [18]. PEIPPI: percussion entropy index using synchronized {PPI} and {Amp} from original DVPs [21]. PEIDVP: percussion entropy index using synchronized {PPI} and {Amp} from decomposed DVPs. Group 1: healthy subjects; group 2: diabetic patients without peripheral neuropathy in study period; group 3: diabetic patients with peripheral neuropathy. ** p < 0.001: group 1 vs. group 2. Average EEMD time: CPU time for 3000 point DVP signals by ensemble empirical mode decomposition.
© 2020 by the authors. Licensee MDPI, Basel, Switzerland. This article is an open access article distributed under the terms and conditions of the Creative Commons Attribution (CC BY) license (http://creativecommons.org/licenses/by/4.0/).
Share and Cite
MDPI and ACS Style
Wei, H.-C.; Hu, W.-R.; Ta, N.; Xiao, M.-X.; Tang, X.-J.; Wu, H.-T. Prognosis of Diabetic Peripheral Neuropathy via Decomposed Digital Volume Pulse from the Fingertip. Entropy 2020, 22, 754. https://0-doi-org.brum.beds.ac.uk/10.3390/e22070754
AMA Style
Wei H-C, Hu W-R, Ta N, Xiao M-X, Tang X-J, Wu H-T. Prognosis of Diabetic Peripheral Neuropathy via Decomposed Digital Volume Pulse from the Fingertip. Entropy. 2020; 22(7):754. https://0-doi-org.brum.beds.ac.uk/10.3390/e22070754
Chicago/Turabian StyleWei, Hai-Cheng, Wen-Rui Hu, Na Ta, Ming-Xia Xiao, Xiao-Jing Tang, and Hsien-Tsai Wu. 2020. "Prognosis of Diabetic Peripheral Neuropathy via Decomposed Digital Volume Pulse from the Fingertip" Entropy 22, no. 7: 754. https://0-doi-org.brum.beds.ac.uk/10.3390/e22070754
Note that from the first issue of 2016, this journal uses article numbers instead of page numbers. See further details here.