Multi-Label Feature Selection Based on High-Order Label Correlation Assumption

1
College of Computer Science and Technology, Jilin University, Changchun 130012, China
2
Key Laboratory of Symbolic Computation and Knowledge Engineering of Ministry of Education, Jilin University, Changchun 130012, China
3
College of Chemistry, Jilin University, Changchun 130012, China
*
Author to whom correspondence should be addressed.
Entropy 2020, 22(7), 797; https://0-doi-org.brum.beds.ac.uk/10.3390/e22070797
Submission received: 14 June 2020
/
Revised: 12 July 2020
/
Accepted: 20 July 2020
/
Published: 21 July 2020
(This article belongs to the Section Information Theory, Probability and Statistics)
Abstract
:Multi-label data often involve features with high dimensionality and complicated label correlations, resulting in a great challenge for multi-label learning. Feature selection plays an important role in multi-label learning to address multi-label data. Exploring label correlations is crucial for multi-label feature selection. Previous information-theoretical-based methods employ the strategy of cumulative summation approximation to evaluate candidate features, which merely considers low-order label correlations. In fact, there exist high-order label correlations in label set, labels naturally cluster into several groups, similar labels intend to cluster into the same group, different labels belong to different groups. However, the strategy of cumulative summation approximation tends to select the features related to the groups containing more labels while ignoring the classification information of groups containing less labels. Therefore, many features related to similar labels are selected, which leads to poor classification performance. To this end, Max-Correlation term considering high-order label correlations is proposed. Additionally, we combine the Max-Correlation term with feature redundancy term to ensure that selected features are relevant to different label groups. Finally, a new method named Multi-label Feature Selection considering Max-Correlation (MCMFS) is proposed. Experimental results demonstrate the classification superiority of MCMFS in comparison to eight state-of-the-art multi-label feature selection methods.
1. Introduction
1.1. The Background of Multi-Label Feature Selection
During the past decade, multi-label learning has gradually attracted significant attentions and has been widely utilized in diverse real-world applications, such as text categorization [1,2], information retrieval [3,4] and gene function classification [5,6]. In multi-label data sets, each instance is related to multiple class labels simultaneously. For example, in text categorization tasks, a news document may associate with several topics simultaneously, such as “society”, “economy” and “legality”. Let denote the d-dimensional instance space and denote the label space including q possible class labels. The task of multi-label learning is to obtain the set of labels related to the unseen instance by learning a classification model from the training data set , where is the set of labels associated with and is a d-dimensional vector [7,8,9]. The classification performance of multi-label learning is closely related to the quality of input features. Like traditional single-label learning algorithm, the multi-label learning often faces with the curse of dimensionality [10].
The high-dimensional multi-label data set often contains a large number of irrelevant and redundant features that bring many disadvantages to the multi-label learning such as the computational burden and over-fitting [10,11,12]. To address this problem, many multi-label feature selection techniques have been proposed to select the informative feature subset from the original feature set and to discard irrelevant and redundant features [13,14,15]. Feature selection techniques not only reduce the computing costs but also improve the classification performance effectively [16].
Multi-label feature selection methods are usually categorized into three groups: filter methods, wrapper methods and embedded methods [12,17,18,19,20]. Among them, filter methods are classifier-independent, that is, filter methods do not consider any learning algorithm; wrapper methods evaluate the importance of feature subsets based on the classification performance of a specific classifier; embedded methods embed the feature selection in the training process of the classifier. Filter methods have the advantage of low computational cost. In this paper, we focus on filter-based multi-label feature selection methods. In addition, filter methods rank features according to their relevance with the label set. Wrapper methods consider all possible subsets of feature combinations by using the prediction performance of a classifier to assess the quality of feature subsets. Then, the feature subset selected by wrapper methods is optimal for the learning algorithm. The disadvantage of filter methods is that its classification performance is not as good as the wrapper methods, especially in the multi-label feature selection. Therefore, we design a new method to consider the high-order label correlations and to select the most informative features for improving the prediction performance of filter methods.
1.2. Information-Theoretical-Based Multi-Label Feature Selection Methods
Different from single-label feature selection methods that evaluate the relevancy between features and only one class label (binary or multiclass), multi-label feature selection methods consider the correlations between features and a set of labels [21,22]. Moreover, the labels in multi-label data are usually not independent, where the internal correlations among labels are always very complicated [23,24]. Many filter-based feature selection methods have been proposed to take into account the label correlations on the evaluation of features, in which information-theoretical-based measures have shown to be adequate [25,26,27,28]. The purpose of the information-theoretical-based multi-label feature selection methods is to obtain an optimal feature subset by employing the information measures in information theory, where mutual information is widely utilized to evaluate the correlation between features and the label set. Suppose that is a feature subset and is the target label set, the mutual information can be denoted as:
The feature subset maximizing Equation (1) provides the maximal information for the label set, which can be considered as the optimal feature subset. However, according to (1), an inevitable problem is that the joint probability is difficult to estimate accurately. Therefore, many feature selection methods based on low-order label correlations have emerged to obtain the approximate optimal feature subset. Some multi-label feature selection methods [29,30,31] use the accumulated mutual information between candidate features and each label to evaluate the feature correlations, where these methods consider first-order label correlations, indicating that those labels are independent of each other. Additionally, some methods [32,33] employ the accumulated conditional mutual information or the interaction information to measure the impact of a candidate feature with each pair of labels, considering second-order label correlations. These methods have been proved to be effective in addressing the curse of dimensionality issues. In fact, there always exist high-order label correlations in the label set that can be abstracted into several semantic groups, in which the same semantic group consists of similar labels and different semantic groups have low dependency. Thus, the cumulative summation approximation based on the whole label set may lead to the following issues:
- Overestimating the significance of some features when these features have strong correlations with one semantic group containing many labels while being almost independent of the other labels, especially in data with a large collection of labels.
- Ignoring the key features that are highly correlated with the semantic groups containing less labels.
- Selecting more redundant features that are often associated with labels in the same semantic group.
In order to address the issues above, we propose a new feature selection method. The main contributions are as follows:
- A new term named Max-Correlation (MC) is designed based on the assumption that labels cluster into several groups, the labels in the same group possess the similar semantic meaning. The MC term employs the maximum operation to select the most informative feature. Additionally, the MC term is not limited to the number of labels in the semantic group, which can effectively address the above issues numbered as 1 and 2.
- We propose a novel feature selection method for multi-label learning based on the Max-Correlation named Multi-label Feature Selection considering the Max-Correlation (MCMFS), which not only maximizes the feature correlation between candidate features and the label set, but also minimizes the feature redundancy in the already-selected feature subset. As a result, our method intends to select the features that are from different semantic groups.
- The effectiveness of the proposed MCMFS method is validated on one artificial data set and twelve real-world multi-label data sets. The experimental results demonstrate that the proposed method can select compact feature subsets and to achieve better classification performance in terms of multiple evaluation criteria.
The remainder of this paper is organized as follows. Section 2 introduces some basic concepts of information theory and four evaluation criteria for multi-label classification performance. Section 3 briefly reviews the related work. In Section 4, we propose the new multi-label feature selection method MCMFS. Section 5 presents the experimental results to verify the effectiveness of the proposed method. In Section 6, we draw conclusions and give the directions of our future research.
2. Preliminaries
2.1. The Basic Concepts of Information Theory
In this subsection, we introduce some basic concepts of information theory which are used to measure the correlations among random variables [34,35]. Let and be two discrete random variables. The mutual information measures the amount of information shared by two variables. It is defined as follows:
where is the joint probability of , is the probability of , is the probability of and the base of log is 2. is the entropy of the variable X, which measures the uncertainty of X. is the conditional entropy of X given Y, which measures the uncertainty left of X under the condition of Y. Mutual information can be expressed as the uncertainty reduction about variable X, given Y. and are defined as:
where is the conditional probability of given .
Conditional mutual information measures the mutual information between two random variables under the condition of another random variable, which is defined as:
where Z is a discrete random variable and and are two conditional entropies. The joint mutual information can be defined as:
Interaction information measures the amount of information shared by three variables, which is defined as:
2.2. Multi-Label Evaluation Metrics
To evaluate the classification performance of different multi-label feature selection methods, four evaluation metrics are widely used in multi-label learning in this paper, which are Hamming Loss, Zero-One Loss, Macro-average and Micro-average [36].
Let be a multi-label test set and be the label set, where n is the number of instances and is the label set corresponding to the instance . Suppose that is the predicted label set corresponding to the instance obtained by multi-label classifier.
Hamming Loss (HL) calculates the average fraction of misclassified labels. HL is defined as:
where ⊕ denotes the symmetric difference between the label sets and . For example, let . Suppose that and . corresponds to vector where or 0 means that is included or not included in . corresponds to vector . Then, , where ⊕ is true if .
Zero-One Loss (ZOL) calculates the average fraction of instances whose most confident label is not in the relevant label set. The definition for ZOL is:
where if and 0 otherwise. is the real-valued function based on the multi-label classifier, which returns the confidence of label l being proper label of . corresponds to the most confident label for .
Macro-average (Macro-F1) and Micro-average (Micro-F1) based on the F1 score are two widely adopted evaluation criteria for multi-label learning. Macro-F1 is an arithmetic average of the F1 score of all q labels. Macro-F1 can be obtained as follows:
where , and denote the number of true positives, false positives and false negatives in the i-th label, respectively. Micro-F1 can be considered as a weighted average of the F1 over all q labels:
The multi-label classification performance can be measured using the mentioned above evaluation criteria. For the four evaluation criteria, a lower value of HL and ZOL indicates a better classification performance. On the other hand, the higher the Macro-F1 and Micro-F1 values are, the better the classification performance is.
3. Related Work
Conventional multi-label feature selection methods can be divided into two groups to deal with the multi-label data sets: problem transformation and algorithm adaptation [37,38]. The problem transformation methods include two steps: (1) transform the multi-label data set to numerous single-label data sets; (2) select the relevant features from the transformed data sets. Binary Relevance (BR) [39], Label Power set (LP) [40] and Pruned Problem Transformation (PPT) [41] are common problem transformation methods. BR decomposes the multi-label data set into several independent binary classification data sets. LP assigns each instance’s label set to a single new class. N. Spolaôr et al. [42] propose four multi-label feature selection methods based on BR and LP which employ ReliefF (RF) [43] and Information Gain (IG) [44] as the feature evaluation criteria to measure the transformed data (RF-BR, RF-LP, IG-BR and IG-LP). However, BR ignores the label correlations and LP may create too many classes causing over-fitting and imbalance problems. PPT removes the instances with rarely occurring labels by a predefined minimal number of occurrences of the label set to improve the effectiveness of LP. Doquire and Verleysen [45] propose a multi-label feature selection method based on mutual information using PPT (PPT + MI). In addition, statistics are used to select the effective features (PPT + CHI) [41]. However, the problem transformation-based multi-label feature selection methods usually ignore the correlations among labels or lose the label information.
In recent years, many algorithm adaptation-based multi-label feature selection methods that directly select features from the multi-label data set have been proposed. S Kashef and H Nezamabadi-pour [15] propose a multi-label feature selection algorithm based on the Pareto dominance concept that intends to select the label-specific features in multi-objective optimization problem. Sun et al. [26] propose a novel Mutual-Information-based feature selection method via constrained Convex Optimization (MICO), which obtains the discriminative features considering the label correlation. Multi-label Informed Feature Selection (MIFS) [46] is an embedded-based feature selection method that decomposes the multi-label information into a low-dimensional label space using Latent Semantic Indexing (LSI) and then employs the reduced label space to steer the feature selection process via a regression model. Lee and Kim [32] propose a multi-label feature selection method based on information theory named Pairwise Multi-label Utility (PMU). Its evaluation function is defined as follows:
where is a candidate feature, S is an already-selected feature subset and is a member of S, and are two members of the label set L. The PMU method selects the feature with the largest value of . Multi-label feature selection method using interaction information (D2F) [29] is proposed to measure the feature correlation between features and each label in the label set. The criterion of D2F is defined as follows:
In addition, Scalable Criterion for a Large Label Set (SCLS) [30] is proposed to design a new multi-label feature selection method based on scalable relevance evaluation. It is denoted as follows:
Lin et al. [31] propose a multi-label feature selection method based on Max-Dependency and Min-Redundancy (MDMR) that maximizes the feature dependency between candidate features and each label using mutual information and minimizes the feature redundancy between candidate feature and each already-selected feature. The criterion of MDMR is denoted as follows:
where is the number of features in the already-selected feature subset S. In addition, multi-label Feature Selection based on Label Redundancy (LRFS) [33] is proposed, and LRFS employs the conditional mutual information between candidate features and each label given other labels to consider the measurement of feature relevancy. It is defined as follows:
Through the above introduction, we can find that previous information-theoretical-based multi-label feature selection methods employ the cumulative summation approximation to take first-order and second-order label correlations into account. In fact, there exist high-order label correlations in the real-world multi-label data sets, naturally, labels cluster into several groups. The common limitation of these methods is that the cumulative summation may overestimate the significance of some candidate features that are related to the groups containing more labels while ignoring the classification information of groups containing few labels. To explore and exploit accurately high-order correlations among labels, we first design a Max-Correlation (MC) term based on the assumption that similar labels cluster into the same groups and dissimilar labels belong to different groups. Then, we propose a novel method named Multi-label Feature Selection considering the Max-Correlation (MCMFS).
4. MCMFS: Multi-Label Feature Selection Considering the Max-Correlation
4.1. Proposed Method
Many information-theoretical-based multi-label feature selection methods apply various low-order approximations to evaluate the candidate features. D2F, SCLS and MDMR methods [29,30,31] employ the accumulated mutual information to quantify the contribution of features to the label set. The specific equation is as follows:
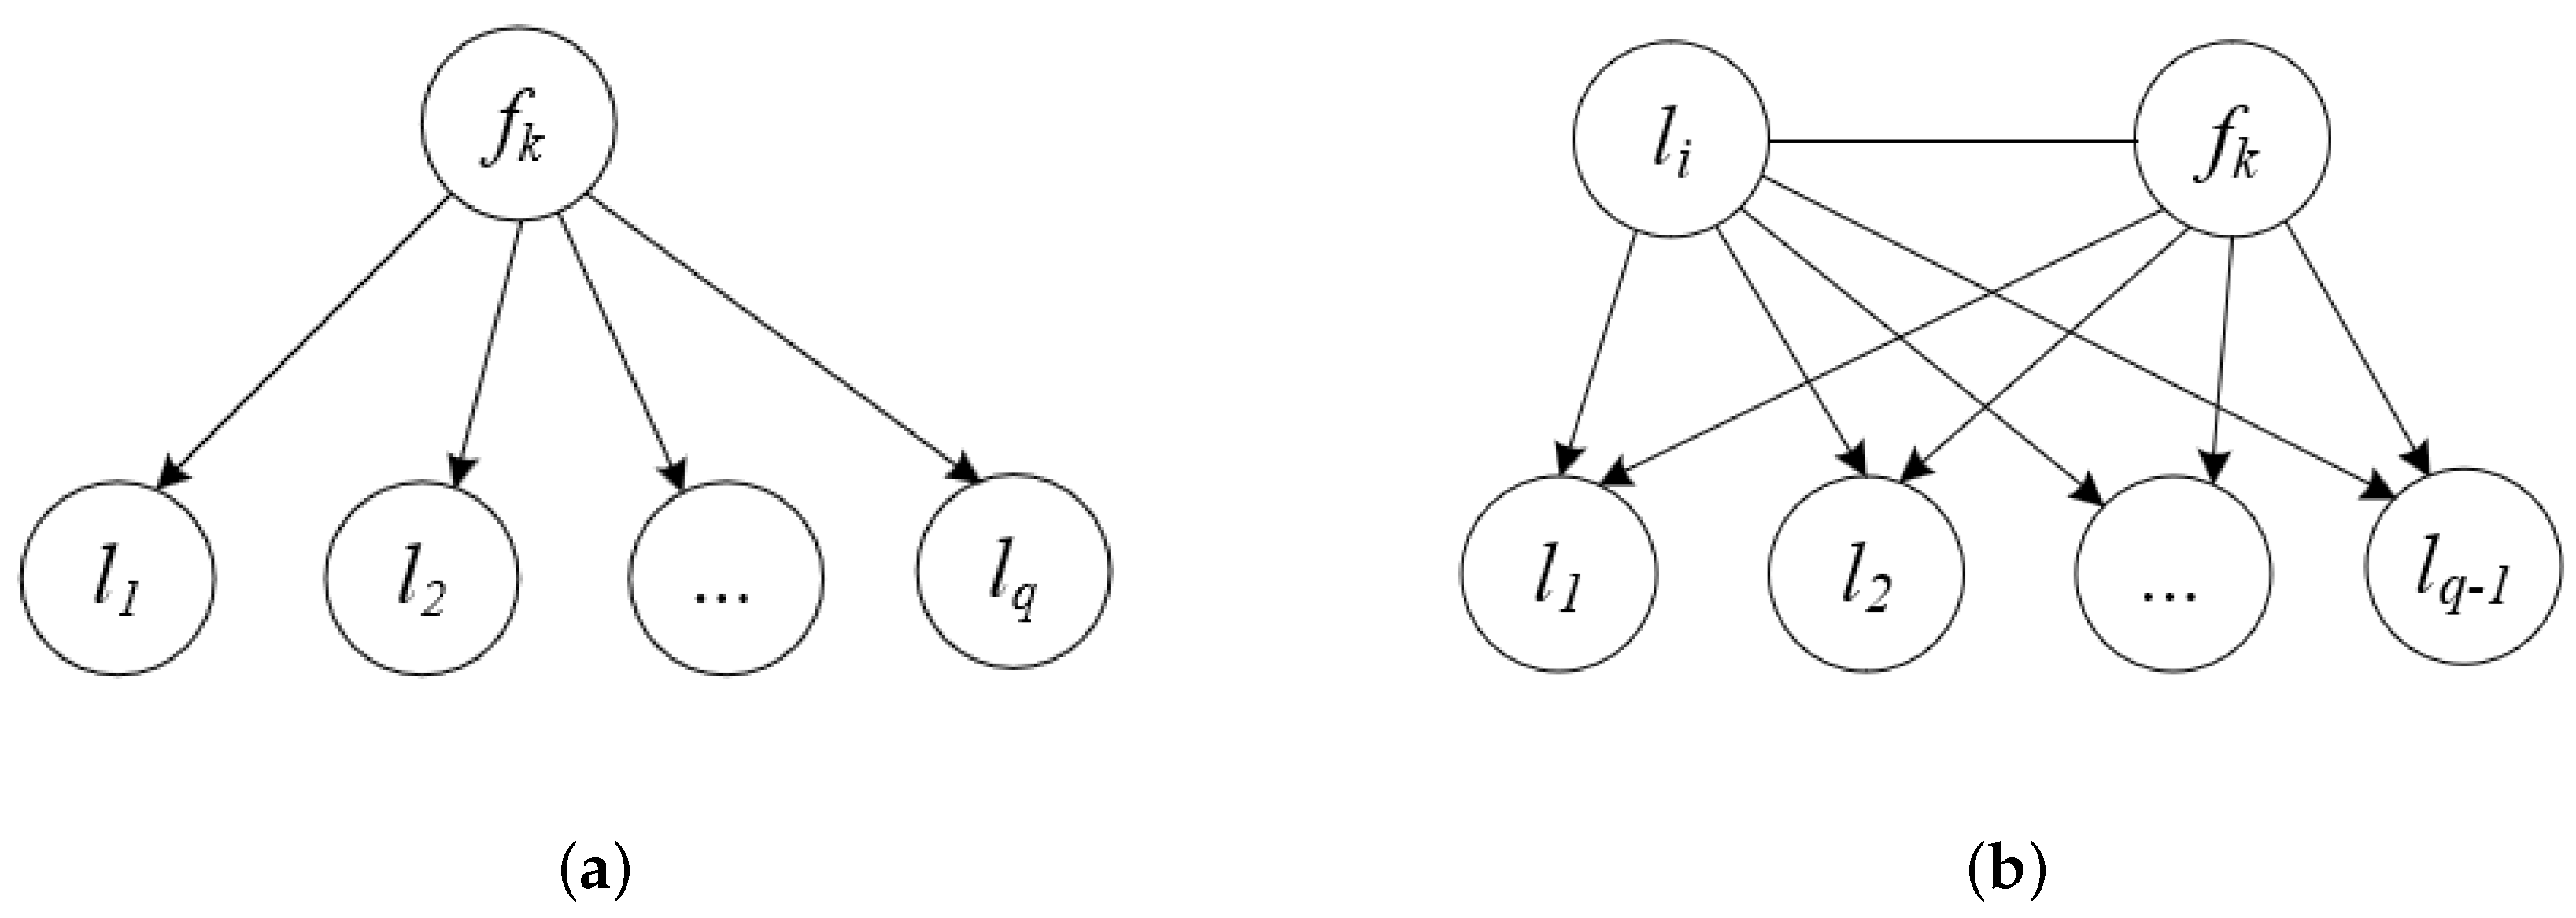
Equation (17) assumes that labels are independent of each other in the design of the feature relevancy term, which can be described as shown in Figure 1a, where is a candidate feature and is one label. In addition, conditional mutual information and interaction information are also used to consider the impact of candidate features with each pair of labels , such as PMU [32] and LRFS [33], which can be described as shown in Figure 1b.
Figure 1 displays the first-order correlations and the second-order correlations among labels. However, label correlations are complicated and of high-order nature in real-world data sets. The labels can naturally cluster into several abstracted semantic meanings. For example, in text categorization, the topics “Athletics”, “Gymnastics” and “Swimming” can be extracted as the semantic meaning “Sports”, and the topics “Beach”, “Sea” and “Mountain” can be extracted as the semantic meaning “Nature”. The labels in the same semantic group have larger dependency, while labels in different semantic meanings are more distinctive. In the literature [25], the 45 labels in the medical data set, which has been used in Computational Medicine Centers 2007 Medical Natural Language Processing Challenge, are divided into 4 main groups according to the statistical information about the labels. Different groups are almost independent of each other and the number of labels in different groups is not equal. Actually, we expect to select the features that are highly discriminating to each semantic group, thereby obtaining the representative features for different semantic meaning.
Like the Equations (17)–(19), the cumulative summation of information terms tends to select features that are related to one semantic group, which leads to overestimating some feature significance especially when the number of labels in the same semantic group is large. As a result, many redundant features are selected. For example, suppose that the total number of labels is 100 and there are two main semantic groups in the label set, that are and . If the number of labels in is 90 and the number of labels in is 10, then the cumulative summation criterion prefers to select the features that are associated with the labels in the semantic group , while reducing the selection possibility of features that are from . In such a situation, the critical features are neglected that are highly related to the semantic groups containing few labels because the value of the cumulative summation will be small when these features are independent of most other labels. Additionally, the selection possibility of redundant features will increase due to the overestimation of the features significance when these features are associated with the same semantic group that contains many labels. However, an effective and compact feature subset should choose features that are from different semantic groups, which is proved to be effective [47].
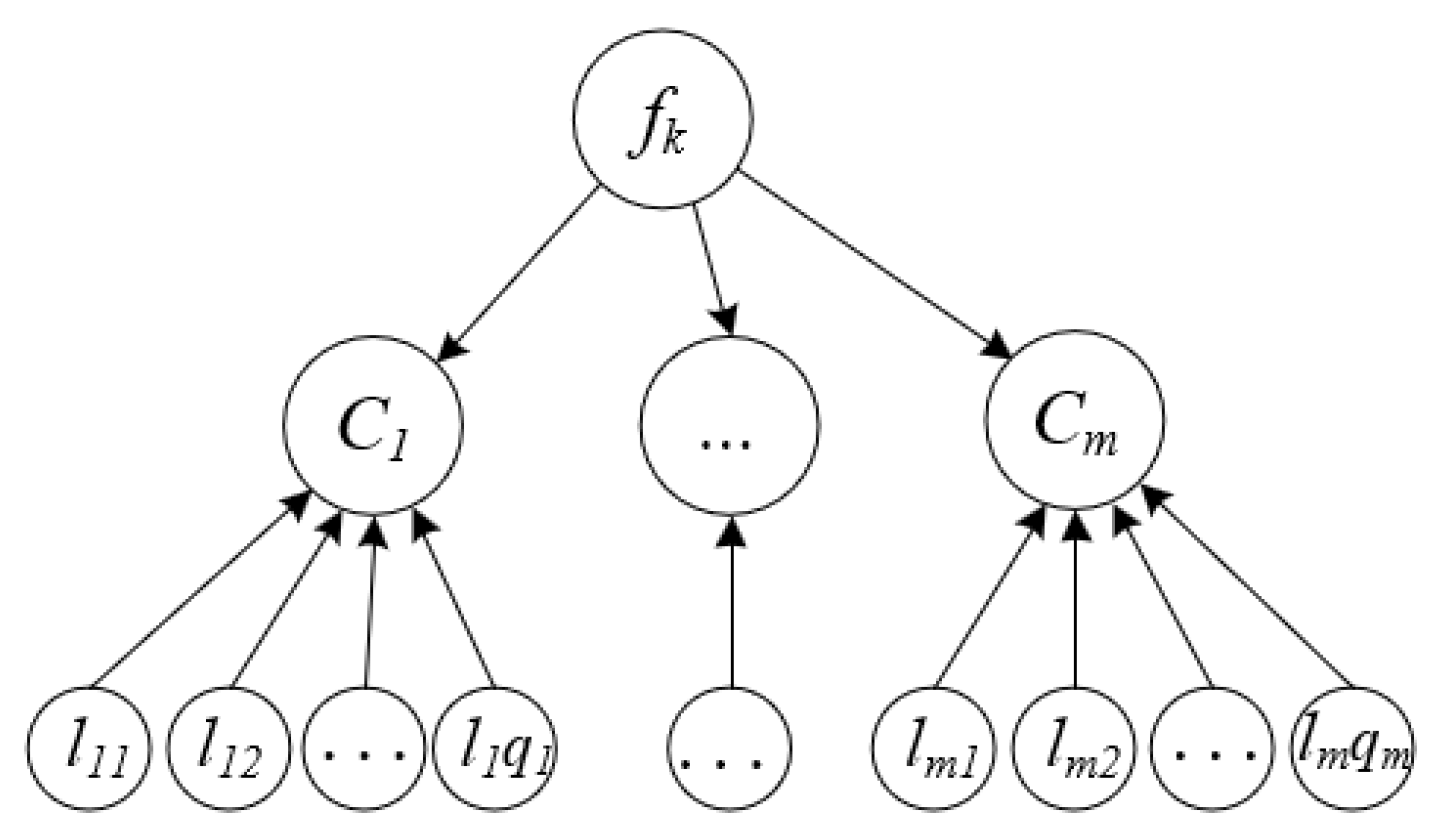
To address the issue, we propose a new multi-label feature selection method to select features that are from different semantic groups. Suppose that the label set can be divided into m semantic groups, that is, , where each semantic group and it satisfies and . Our aim is to select the critical features that are from each semantic group, which is described as shown in Figure 2.
In order to avoid the overestimation problem caused by the number of labels in the different semantic groups, we employ the maximum operation to measure the mutual information between the candidate feature and each semantic group . The specific equation is as follows:
Equation (20) measures the relevancy between the candidate feature and labels in the same semantic group. The larger the value of Equation (20), the more important the candidate feature is in the semantic group. Equation (20) is the upper bound of the maximal relevancy between one candidate feature and the labels in the semantic group. Furthermore, a small value of Equation (20) means that the relevancy between the candidate feature and the labels in the semantic group is weak. Finally, Equation (20) can effectively avoid the overestimation caused by accumulation, even if many labels are in the same semantic group.
Thereafter, according to Equation (20), an m-dimensional vector of feature and the label set is obtained, that is . We select the maximum value of as the feature relevancy between candidate features and the entire label set L, which is named Max-Correlation (MC). It is defined as:
can effectively capture the maximum amount of contribution of the feature regarding the label set. Meanwhile, can accurately select the critical features whatever how many labels in the semantic groups. Based on the definition of Max-Correlation, we propose a novel multi-label feature selection method named Multi-label Feature Selection considering the Max-Correlation (MCMFS). The evaluation function is as follows:
measures the feature redundancy between the candidate feature and each already-selected feature . is employed to balance the magnitude between the Max-Correlation term and the feature redundancy term. Therefore, Equation (22) uses to maximize the feature relevancy between candidate features and the label set, while using the mutual information to minimize the feature redundancy in the already-selected feature subset to choose the feature that are from different semantic groups. The sequential forward search strategy is used in the process of feature selection. We select the feature that achieves the maximum value of as the next already-selected feature. The pseudo code of MCMFS is presented in Algorithm 1.
| Algorithm 1 MCMFS |
| Input: A training sample D with a full feature set and the label set ; The number of selected features b. Output: The already-selected feature subset S.
|
There are three stages in the MCMFS method. In the first stage (lines 1–5), it initializes the parameters, which includes the already-selected feature subset S and the number of already-selected features a in lines 1–2, and calculates the Max-Correlation for each feature in lines 3–5. The second stage (lines 7–12) selects the maximum value of Max-Correlation as the first already-selected feature. The third stage (lines 13–20) calculates the Equation (22) and selects the next feature.
The minimal-redundancy-maximum-relevance (mRMR) [48] is a well-known single-label feature selection method, which uses mutual information between candidate features and class labels to evaluate feature relevance and adopts the same feature redundancy term with our method. The resemblance between mRMR method and MCMCFS method is that both methods consider the relationship between candidate features and already-selected features to minimize feature redundancy. The difference is that mRMR method does not consider the effects of label correlations. In multi-label feature selection, the proposed MCMCFS method employs the Max-Correlation term to consider the high-order label correlations.
4.2. Complexity Analysis
We provide the complexity analysis for the MCMFS method and other five information-theoretical-based feature selection methods (D2F, PMU, SCLS, MDMR and LRFS). Suppose that the number of instances is n, the number of features is d and the number of labels is q. The mutual information, conditional mutual information and interaction information need the time complexity of since all the instances need to be visited for probability estimation. Suppose that the number of selected features is b, then the time complexity of MCMFS and SCLS is . The time complexity of D2F and MDMR is . PMU and LRFS design the evaluation criteria to consider the second-order label correlations. The time complexity of PMU is and the time complexity of LRFS is . Table 1 lists the time complexity of these methods. As shown in Table 1, MCMFS achieves the same time complexity with SCLS method. In addition, the time complexity of MCMFS method is lower than that of the D2F, MDMR, PMU and LRFS methods. Therefore, the proposed method is more computationally efficient than these four methods.
5. Experimental Results and Analysis
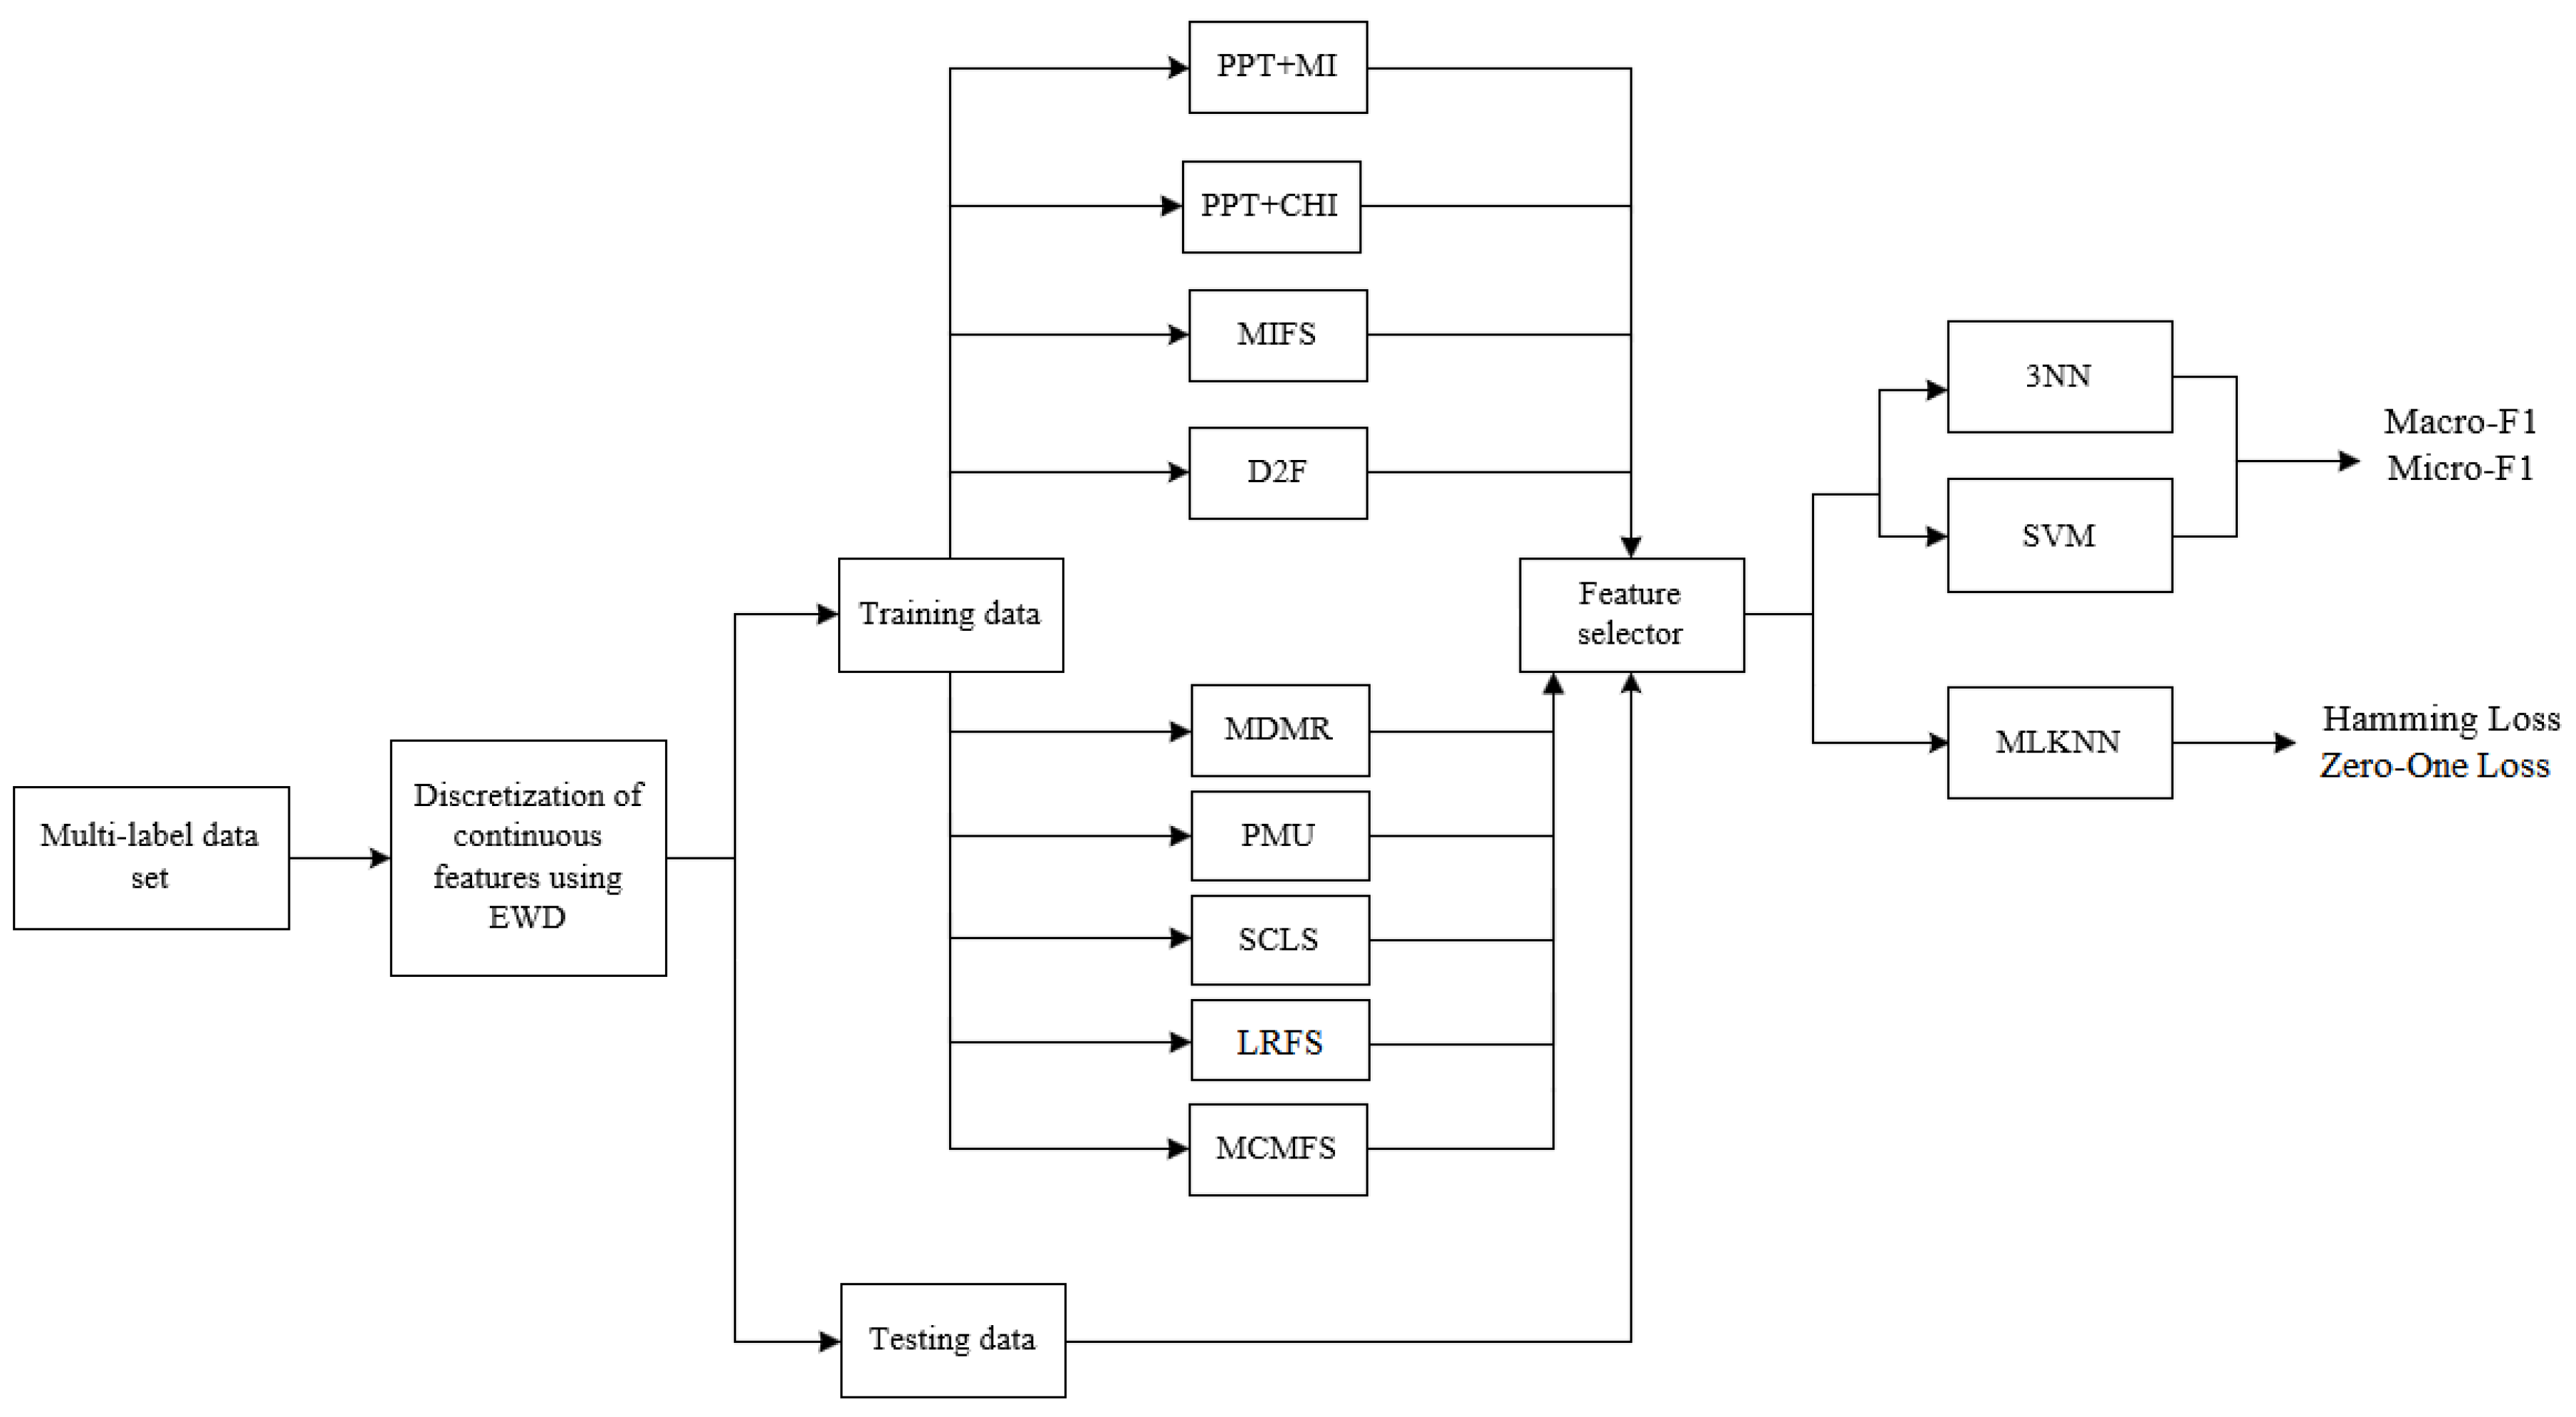
In this section, we evaluate the classification performance of the proposed MCMFS method and present the experimental results. MCMFS is compared to one embedded-based method (MIFS [46]) and two problem transformation-based methods (PPT + MI [45] and PPT + CHI [41]) and five information-theoretical-based methods (D2F [29], MDMR [31], PMU [32], SCLS [30] and LRFS [33]). First, we introduce the experimental settings and describe the evaluation framework in Figure 3. Second, MCMFS is compared to five information-theoretical-based methods that employ the cumulative summation approximation to evaluate the candidate features on an artificial data set. Finally, the MCMFS method is compared to the eight representative methods on 12 real-word multi-label data sets in terms of four evaluation metrics to verify the effectiveness of MCMFS method. All the experiments are executed on an Intel Core (TM) i7-6700 with 3.4 GHz processing speed.
5.1. Experimental Setting
The experimental setting is as follows: First, the continuous features are discretized using an equal-width strategy into three bins, as recommend in the literature [14,29]. Second, the number of already-selected features b varies from 1 to M with a step size of 1, where M is 20% of the total number of features (M = 17% in medical data set used in experiments). Third, we employ the MLKNN [47] as the multi-label classifier to evaluate the classification performance of the MCMFS method and other eight compared feature selection methods in terms of Hamming Loss and Zero-One Loss. Additionally, the number of nearest neighbors K is set to 10. Finally, k-Nearest Neighbors (kNN) and Liblinear-based Support Vector Machine (SVM) are implemented to evaluate the classification performance in terms of Macro-F1 and Micro-F1. The kNN is a non-linear neighborhood-based classifier, while the SVM is a linear classifier. We adopt two different classifiers to display the different classification performance of these methods. In addition, kNN and SVM are two popular classifiers in the feature selection methods based on information theory, they are widely applied in various literature [49,50,51,52,53]. Different k values of kNN classifier appear to have less effect on the classification performance for the filter methods [53]. In these references, k is set to 3, indicating that this is an empirical setting. Therefore, we set k to 3 in this paper. We use the package scikit-learn and in Python 2.7 to implement the classifiers. The multi-label data sets used in the experiment are from Mulan Library [46] where the training set and test set have been already separated in the data source. Therefore, as shown in Figure 3, we use the result of feature selection on the training set to implement on test set directly.
5.2. Experiment and Analysis on an Artificial Data Set
We apply an artificial data to visually compare MCMFS to five information-theoretical-based methods (D2F, LRFS, MDMR, PMU and SCLS) that employ the cumulative summation approximation to evaluate the importance of candidate features. Table 2 displays the artificial data , where , and .
The matrix of mutual information between labels is listed. It can be observed that , and have close correlations, and they have weak correlation with and . In addition, and are also weakly correlated with each other. For example, for the label , the values of and are significantly greater than the values of and . For the label , all the values of , , and are very small. Intuitively, the label set can cluster into three semantic groups, that are , and .
We present the feature ranking results and the classification performance obtained by the six feature selection methods in Table 3. Five-fold cross-validation is employed to evaluate the classification performance on the artificial data. The values in bold font represent the best classification performance in Table 3. It can be seen that MCMFS obtains better experimental results in terms of HL, ZOL, Macro-F1 and Micro-F1. According to the results of feature ranking, the five compared methods give lesser importance rankings for certain features. For example, compared to D2F, LRFS, MDMR and SCLS, the rank of is higher in MCMFS. In fact, is the most relevant feature to the label (). Compared to D2F, LRFS and PMU, the rank of is higher in MCMFS, where is the most relevant feature to the label (). In other words, and are critical features of the semantic groups and , respectively. is the key feature of the semantic group that is selected by most methods. The proposed method finds accurately the key features that belong to different semantic groups.
5.3. Experimental Results on the Real-Word Data Sets
The experiments are conducted on 12 real-world multi-label data sets that are from Mulan Library [54]. The description of the data sets is presented in Table 4. These data sets contain different number of instances, features and labels. In addition, these data sets cover two different application areas. The data set scene is collected for semantic image categorization and the remaining data sets are widely applied to text categorization.
Table 5 and Table 6 record the average classification results and standard deviations of the proposed method and other eight compared methods on the 12 data sets in terms of Hamming Loss and Zero-One Loss, respectively. The values in bold font represent the best classification performance achieved by the corresponding method.
In Table 5, MCMFS obtains the best Hamming Loss performance on 11 data sets. MIFS method provides better results for the Business data set, which means that the decomposition process of the label set of the MIFS method is helpful for the feature selection on the Business data set. As shown in Table 6, PPT + CHI obtains better performance than the proposed MCMFS method and other compared methods on Reference data set in terms of Zero-One Loss performance. MCMFS obtains the best Zero-One Loss performance on 11 data sets. On the whole, MCMFS provides better classification performance compared to other competitive feature selection methods in terms of Hamming Loss and Zero-One Loss on MLKNN classifier.
Table 7, Table 8, Table 9 and Table 10 record the classification performance of the proposed method and other eight compared methods in terms of Macro-F1 and Micro-F1, respectively. Table 7 and Table 8 present the Macro-F1 metric on the SVM classifier and 3NN classifier, respectively. As the results indicate, we can observe that D2F obtains the best Macro-F1 performance on the enron data set using the SVM classifier in Table 7. Our method outperforms the compared methods in terms of the Macro-F1 performance on 11 data sets using the SVM classifier and on 12 data sets using the 3NN classifier. Table 9 and Table 10 show the Micro-F1 performance on the SVM classifier and 3NN classifier, respectively. Compared to the eight methods, MCMFS obtains the best Micro-F1 performance on 11 data sets using the SVM classifier. In Table 10, MCMFS obtains the best Micro-F1 performance on 9 data sets using the 3NN classifier. Overall, our method achieves the best classification performance in terms of Macro-F1 and Micro-F1 on these data sets using the SVM classifier and 3NN classifier.
Observing these results, PPT+CHI provides better classification performance on Reference data set in terms of ZOL, Macro-F1 on SVM classifier and 3NN classifier, Micro-F1 on SVM classifier. is effective in evaluating the features of Reference data set by transforming the label set to single label using PPT. Compared with the information-theoretical-based methods, the classification performance of MCMFS is is the best among all methods, followed by LRFS, MDMR, D2F, PMU and SCLS, which verifies the effectiveness of using the maximum operation instead of the cumulative summation approximation to take into account the higher-order label relationship.
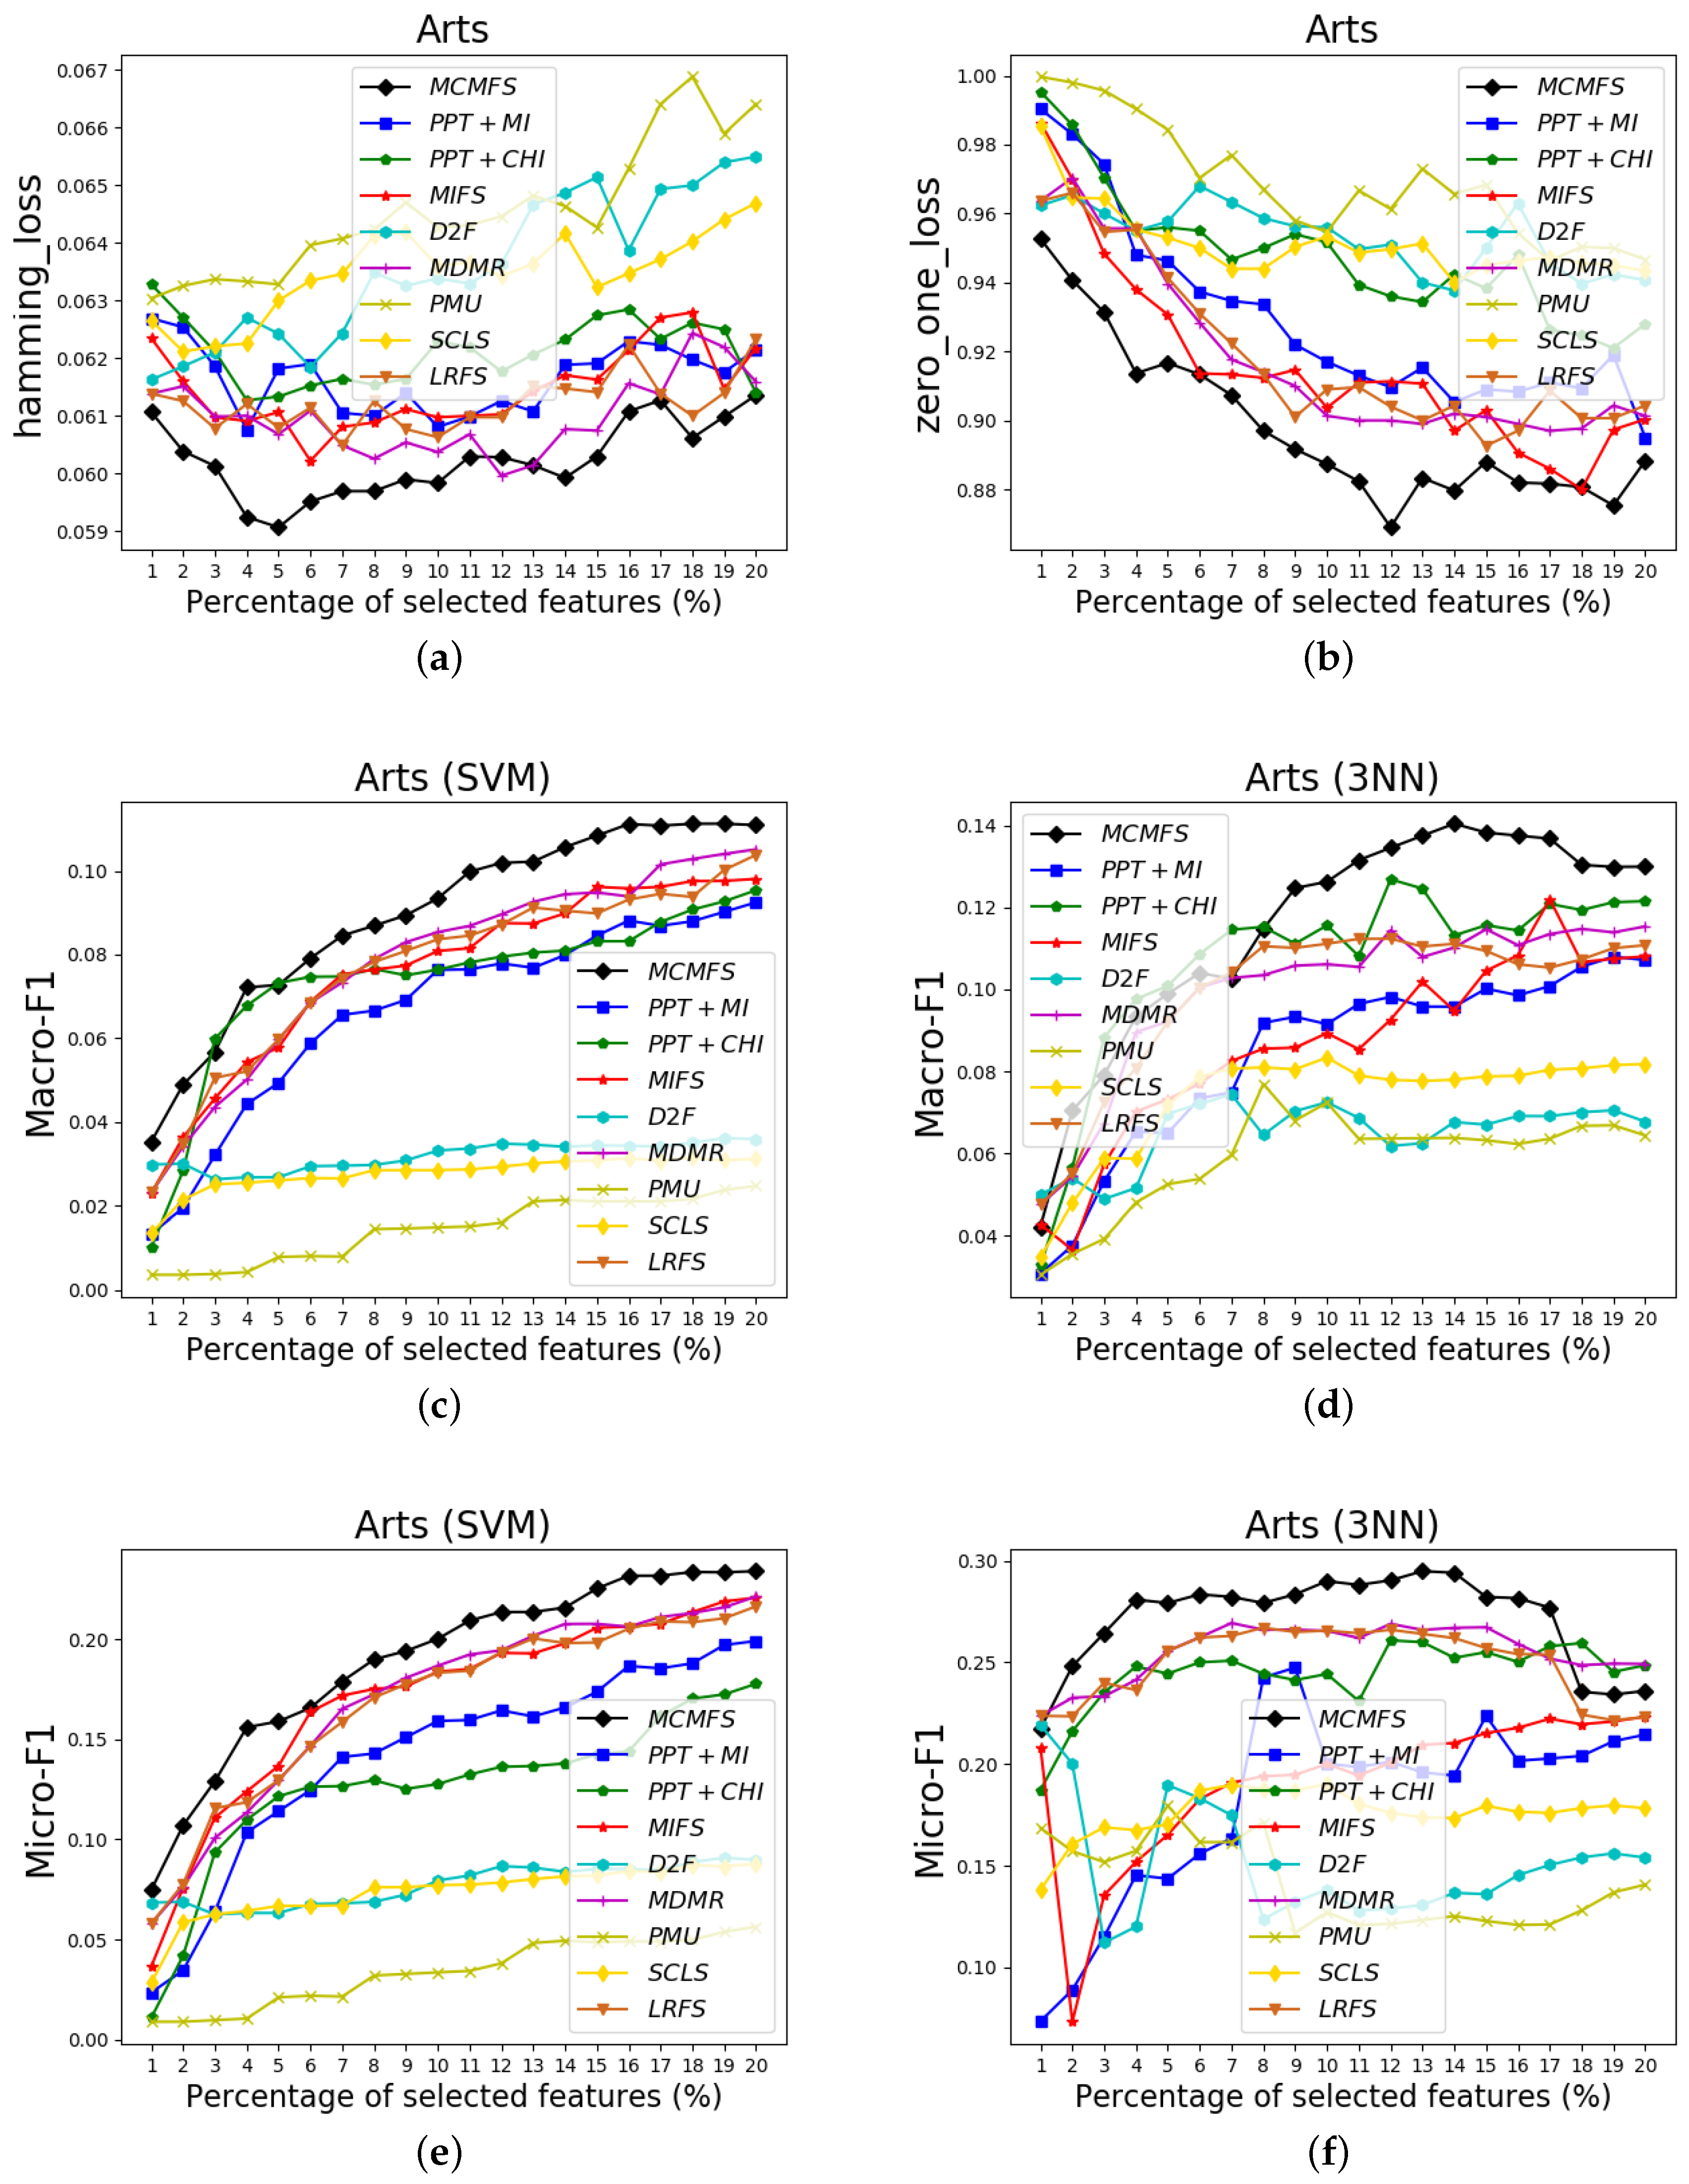
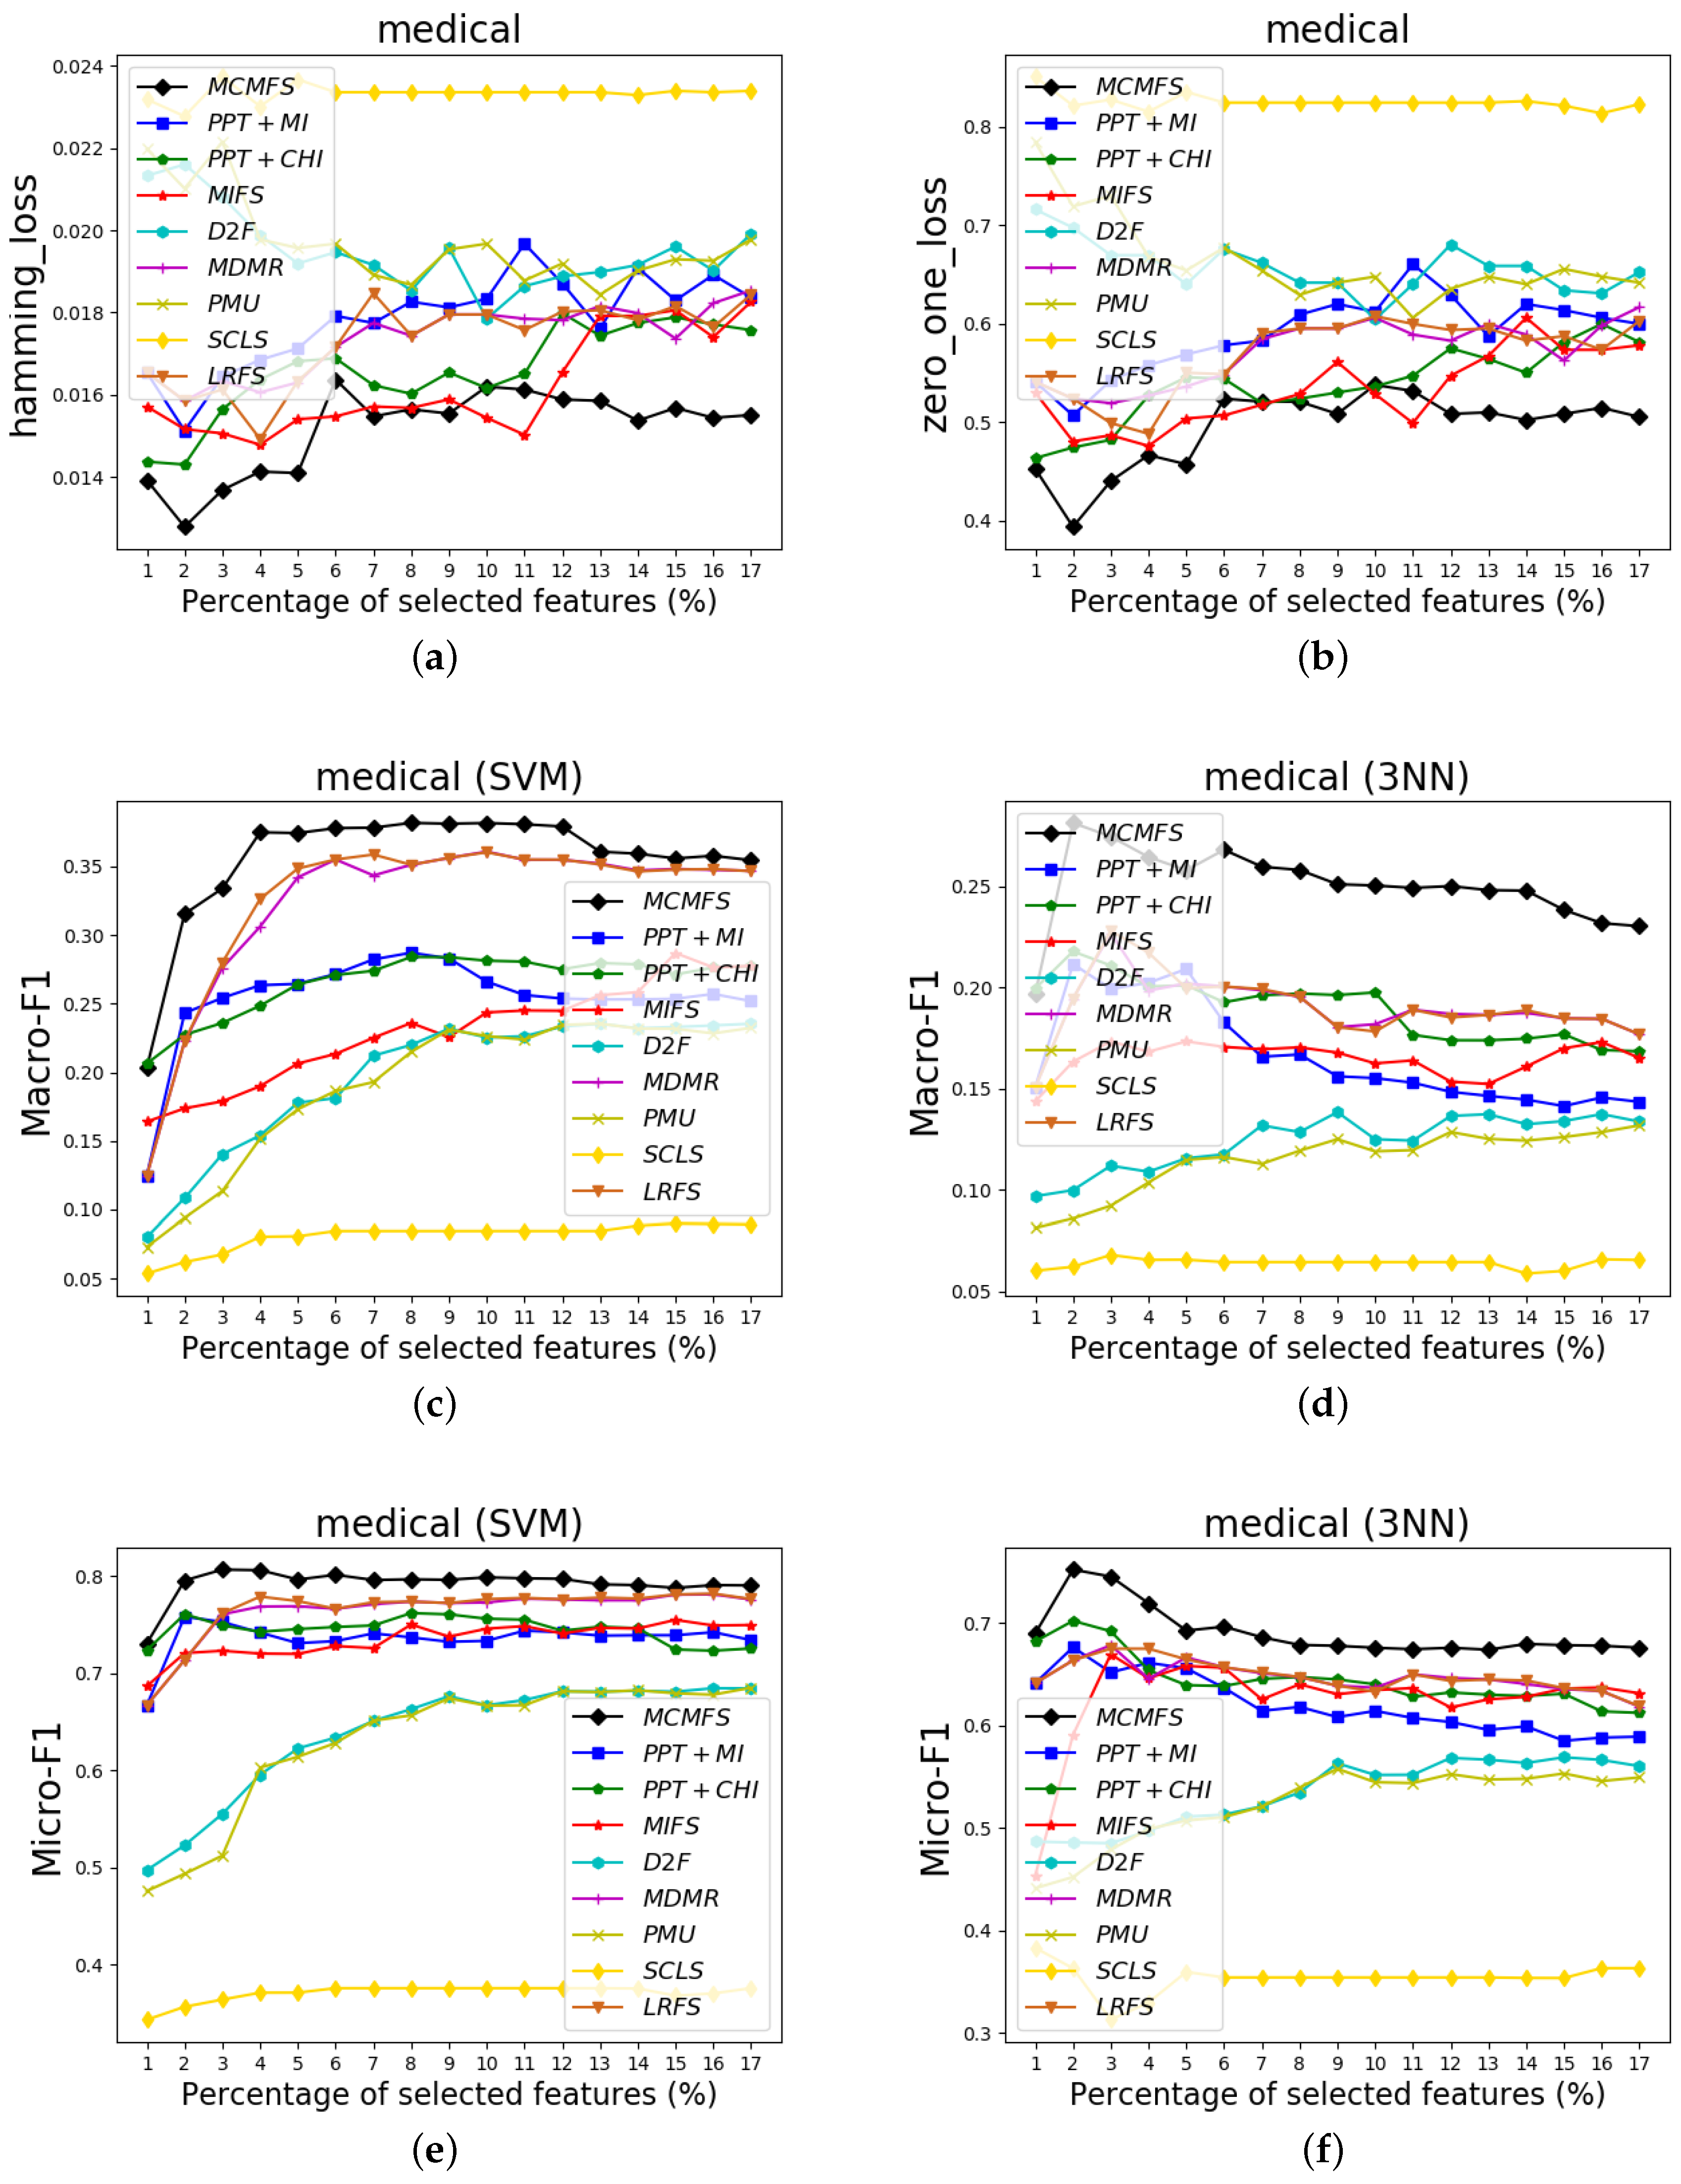
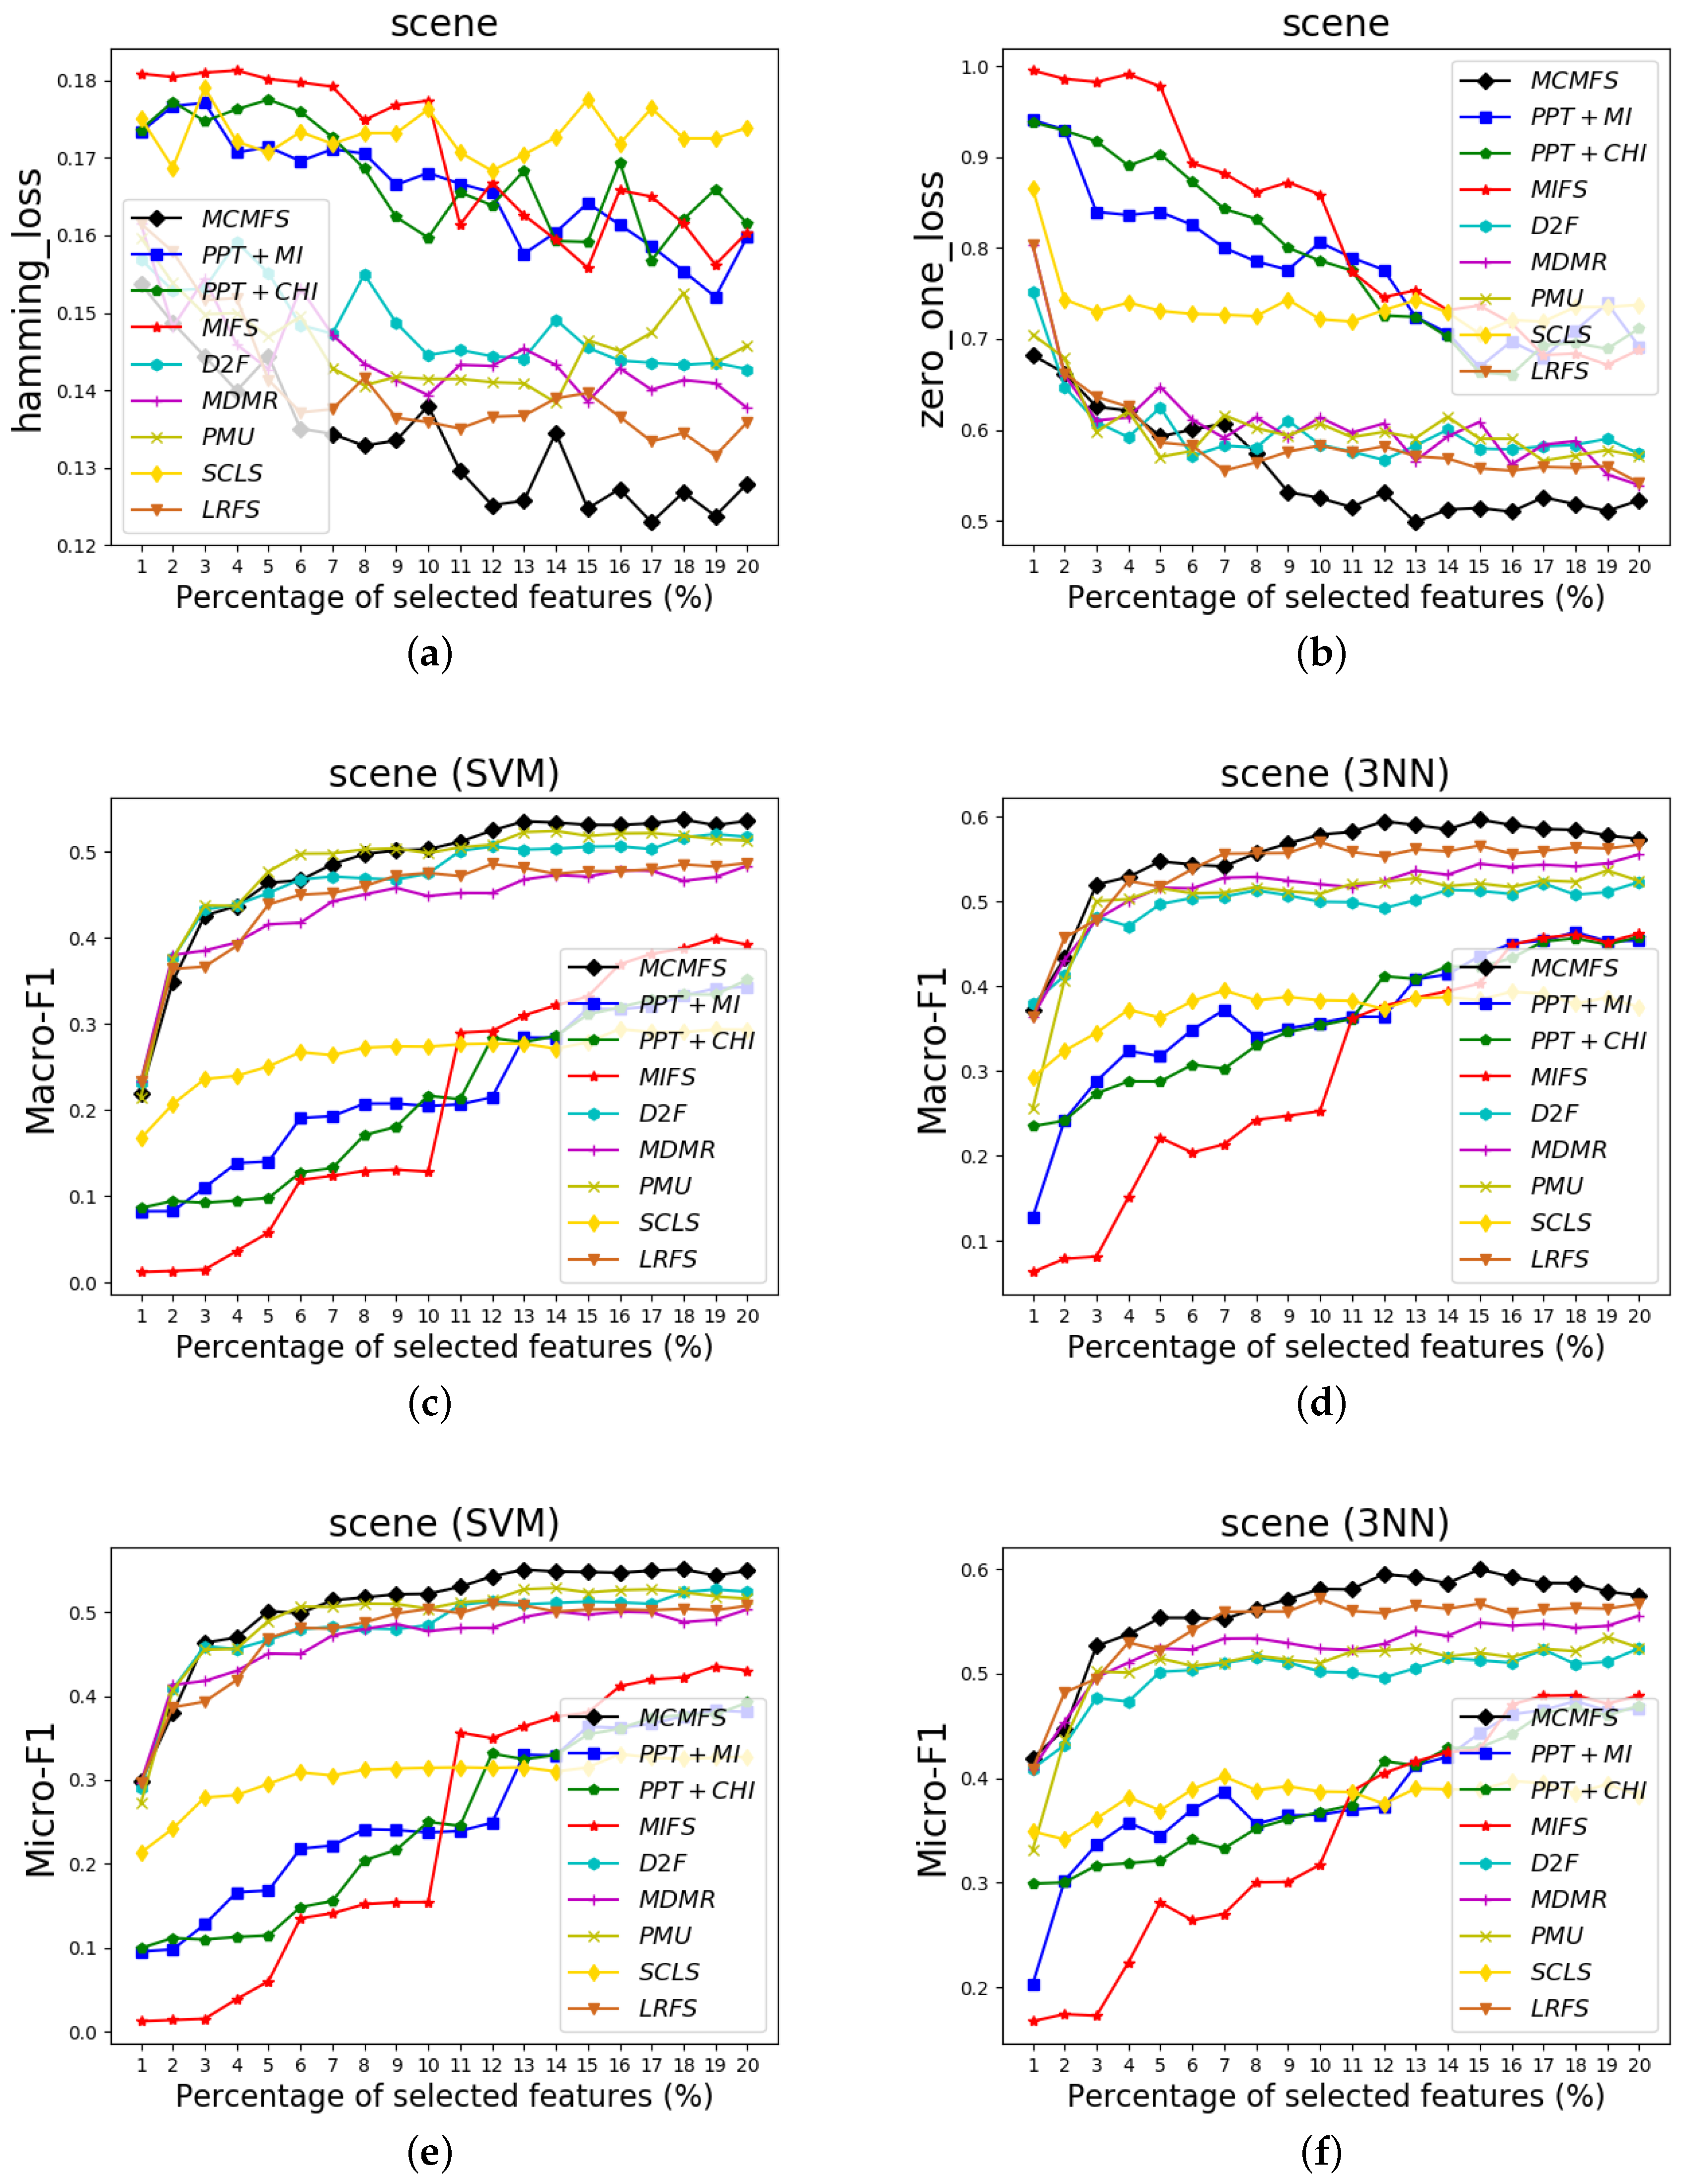
To clearly show the classification performances of different feature selection methods, Figure 4, Figure 5 and Figure 6 show the experimental results on three data sets (Arts, medical and scene). In these figures, the X-axis represents the number of already-selected features, which is varied as {1%, 2%, …, 20%} or {1%, 2%, …, 17%} (medical data set) of the total number of features. The Y-axis represents the experimental results of the different evaluation criteria. Different colors and shapes indicate different multi-label feature selection methods.
According to the classification performance on the Figure 4, Figure 5 and Figure 6, we can observe that MCMFS obtains better classification performance than other compared feature selection methods. Compared to five information-theoretical-based methods D2F, MDMR, PMU, SCLS and LRFS, the experimental results demonstrate that the maximum operation is more effective than the cumulative summation approximation operation. In addition, MCMFS outperforms the other three multi-label feature selection methods PPT + MI, PPT + CHI and MIFS on these data sets.
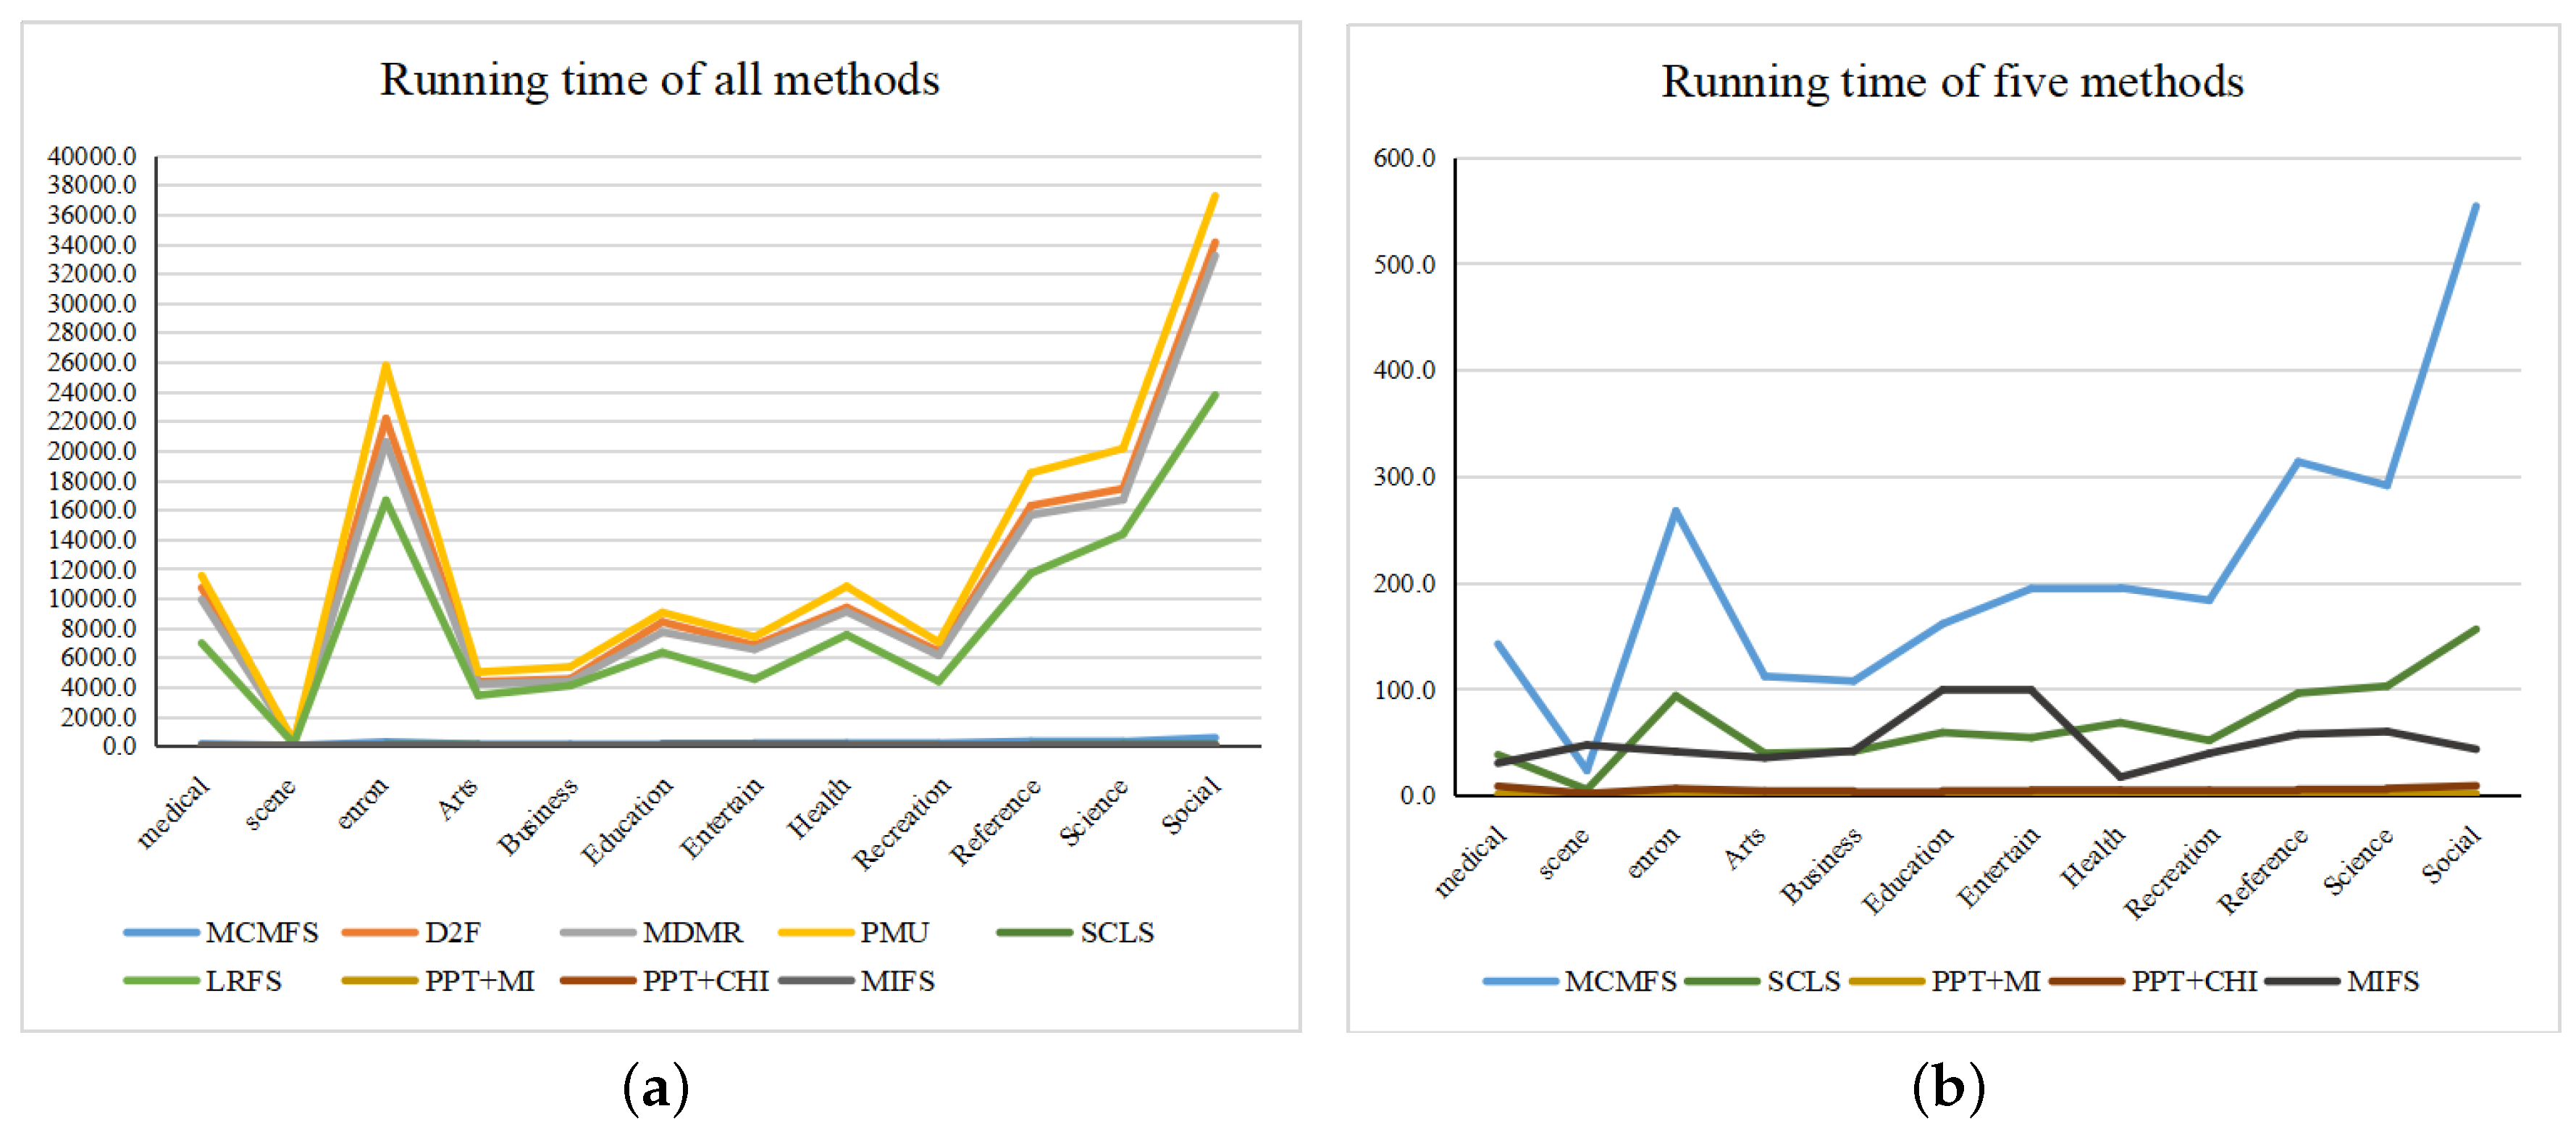
Finally, we show the running time of MCMFS and other eight compared methods in Table 11. The running time of PPT + MI and PPT + CHI methods is the minimum, because they only need one iteration on the transformed single label to complete the feature selection. Although SCLS and MIFS methods have lower running time than our method, the proposed method outperforms these two methods in terms of multiple evaluation criteria for the classification performance. As compared to D2F, MDMR, PMU and LRFS, our method is more computationally efficient. Therefore, the running time of MCMFS method is generally acceptable. Additionally, we use Figure 7 to present the minimum and maximum values of each method on different data sets. In Figure 7, the X-axis represents data sets while the Y-axis represents the running time of each method. To clearly show the running time of different methods, we use Figure 7b to display the running time of MCMFS, PPT + MI, PPT + CHI, MIFS and SCLS methods. As shown in Figure 7, we can find that PMU obtains the most running time among all methods. PPT + MI has the least running time. The running time of our method MCMFS is acceptable. In addition, the running time of all methods increases as the size of the data sets increases.
6. Conclusions
In this paper, a novel multi-label feature selection method is proposed named Multi-label Feature Selection considering the Max-Correlation (MCMFS). The Max-Correlation (MC) term is designed based on the high-order label correlations and the assumption that labels naturally cluster into several groups. The combination of maximum operation and the feature redundancy term contributes to selecting the features that are from different label groups.
To demonstrate the effectiveness of our method, MCMFS is compared to five information-theoretical-based multi-label feature selection methods (D2F, MDMR, PMU, SCLS and LRFS) that employ the cumulative summation approximation operation to select features on an artificial data set. Furthermore, MCMFS is compared to eight state-of-the art multi-label feature selection methods (PPT + MI, PPT + CHI, MIFS, D2F, MDMR, PMU, SCLS and LRFS) using MLKNN on 12 real-world multi-label data sets in terms of Hamming Loss and Zero One Loss. Additionally, the 3NN classifier and SVM classifier are used to evaluate the classification performance among the nine feature selection methods in terms of Macro-F1 and Micro-F1. The experimental results demonstrate that MCMFS obtains better classification results than the compared methods and can effectively select a compact feature subset for the classification.
Finally, in our future work, we intend to explore high-order label correlations and sparse learning for multi-label feature selection. Additionally, we intend to propose a method that can automatically assign the appropriate number of feature subsets to each data set.
Author Contributions
Conceptualization, P.Z. and W.G.; methodology, P.Z.; software, P.Z.; validation, J.H., Y.L.; formal analysis, P.Z.; investigation, P.Z.; resources, J.H.; data curation, Y.L.; writing—original draft preparation, P.Z.; writing—review and editing, W.G.; visualization, P.Z.; supervision, P.Z.; project administration, W.G.; funding acquisition, W.G. All authors have read and approved the final manuscript.
Funding
This research was funded by Postdoctoral Innovative Talents Support Program under Grant No. BX20190137, and China Postdoctoral Science Foundation funded project under Grant No. 2020M670839, and National Key R&D Plan of China under Grant No. 2017YFA0604500, and by National Sci-Tech Support Plan of China under Grant No. 2014BAH02F00, and by National Natural Science Foundation of China under Grant No. 61701190, and by Youth Science Foundation of Jilin Province of China under Grant No. 20160520011JH & 20180520021JH, and by Youth Sci-Tech Innovation Leader and Team Project of Jilin Province of China under Grant No. 20170519017JH, and by Key Technology Innovation Cooperation Project of Government and University for the whole Industry Demonstration under Grant No. SXGJSF2017-4, and by Key scientific and technological R&D Plan of Jilin Province of China under Grant No. 20180201103GX, Project of Jilin Province Development and Reform Commission No. 2019FGWTZC001.
Conflicts of Interest
The authors declare no conflict of interest.
References
- Ueda, N.; Saito, K. Parametric Mixture Models for Multi-Labeled Text. In Proceedings of the International Conference on Neural Information Processing Systems, Vancouver, CO, Canada, 9–14 December 2002. [Google Scholar]
- Kazawa, H.; Izumitani, T.; Taira, H.; Maeda, E. Maximal margin labeling for multi-topic text categorization. In Proceedings of the Advances in Neural Information Processing Systems, Vancouver, BC, Canada, 13–18 December 2004; pp. 649–656. [Google Scholar]
- Gopal, S.; Yang, Y. Multilabel classification with meta-level features. In Proceedings of the 33rd International ACM SIGIR Conference on Research and Development in Information Retrieval, Geneva, Switzerland, 19 July 2010; pp. 315–322. [Google Scholar]
- Huang, S.J.; Zhou, Z.H. Multi-label learning by exploiting label correlations locally. In Proceedings of the Twenty-Sixth AAAI Conference on Artificial Intelligence, Toronto, ON, Canada, 22–26 July 2012. [Google Scholar]
- Zhang, M.L.; Zhou, Z.H. Multilabel neural networks with applications to functional genomics and text categorization. IEEE Trans. Knowl. Data Eng. 2006, 18, 1338–1351. [Google Scholar] [CrossRef] [Green Version]
- Elisseeff, A.; Weston, J. A kernel method for multi-labelled classification. In Proceedings of the International Conference on Neural Information Processing Systems: Natural and Synthetic, Cambridge, MA, USA, 3–8 December 2001; pp. 681–687. [Google Scholar]
- Zhang, M.L.; Zhou, Z.H. A Review on Multi-Label Learning Algorithms. IEEE Trans. Knowl. Data Eng. 2014, 26, 1819–1837. [Google Scholar] [CrossRef]
- Huang, J.; Li, G.; Huang, Q.; Wu, X. Learning label specific features for multi-label classification. In Proceedings of the 2015 IEEE International Conference on Data Mining, Atlantic City, NJ, USA, 14–17 November 2015; pp. 181–190. [Google Scholar]
- Huang, J.; Li, G.; Huang, Q.; Wu, X. Learning label-specific features and class-dependent labels for multi-label classification. IEEE Trans. Knowl. Data Eng. 2016, 28, 3309–3323. [Google Scholar] [CrossRef]
- Monard, M.C.; Tsoumakas, G.; Lee, H.D. A systematic review of multi-label feature selection and a new method based on label construction. Neurocomputing 2016, 180, 3–15. [Google Scholar]
- Gao, W.; Hu, L.; Zhang, P. Class-specific mutual information variation for feature selection. Pattern Recognit. 2018, 79, 328–339. [Google Scholar] [CrossRef]
- Lin, Y.; Hu, Q.; Liu, J.; Chen, J.; Duan, J. Multi-label feature selection based on neighborhood mutual information. Appl. Soft Comput. 2016, 38, 244–256. [Google Scholar] [CrossRef]
- Wang, J.J.Y.; Bensmail, H.; Gao, X. Feature selection and multi-kernel learning for sparse representation on a manifold. Neural Netw. 2014, 51, 9–16. [Google Scholar] [CrossRef]
- Lee, J.; Kim, D.W. Memetic feature selection algorithm for multi-label classification. Inf. Sci. 2015, 293, 80–96. [Google Scholar] [CrossRef]
- Kashef, S.; Nezamabadi-pour, H. A label-specific multi-label feature selection algorithm based on the Pareto dominance concept. Pattern Recognit. 2019, 88, 654–667. [Google Scholar] [CrossRef]
- Lin, Y.; Hu, Q.; Zhang, J.; Wu, X. Multi-label feature selection with streaming labels. Inf. Sci. 2016, 372, 256–275. [Google Scholar] [CrossRef]
- Lee, J.; Kim, D.W. Fast multi-label feature selection based on information-theoretic feature ranking. Pattern Recognit. 2015, 48, 2761–2771. [Google Scholar] [CrossRef]
- Yu, K.; Yu, S.; Tresp, V. Multi-label informed latent semantic indexing. In Proceedings of the 28th Annual International ACM SIGIR Conference on Research and Development in Information Retrieval, Salvador, Brazil, 15–19 August 2005; pp. 258–265. [Google Scholar]
- Zhu, R.; Dornaika, F.; Ruichek, Y. Learning a discriminant graph-based embedding with feature selection for image categorization. Neural Netw. 2019, 111, 35–46. [Google Scholar] [CrossRef] [PubMed]
- Zhang, M.L.; Peña, J.M.; Robles, V. Feature selection for multi-label naive Bayes classification. Inf. Sci. 2009, 179, 3218–3229. [Google Scholar] [CrossRef]
- Kong, X.; Yu, P.S. gMLC: A multi-label feature selection framework for graph classification. Knowl. Inf. Syst. 2012, 31, 281–305. [Google Scholar] [CrossRef]
- Zhang, Y.; Zhou, Z.H. Multilabel dimensionality reduction via dependence maximization. In Proceedings of the National Conference on Artificial Intelligence, Chicago, IL, USA, 13–17 July 2008. [Google Scholar]
- Gu, Q.; Li, Z.; Han, J. Correlated multi-label feature selection. In Proceedings of the 20th ACM International Conference on Information and Knowledge Management, Glasgow, Scotland, UK, 24–28 October 2011; pp. 1087–1096. [Google Scholar]
- Suping, X.U.; Yang, X.; Yunsong, Q.I. Multi-label learning with label-specific feature reduction. J. Comput. Appl. 2016, 104, 52–61. [Google Scholar]
- Li, F.; Miao, D.; Pedrycz, W. Granular multi-label feature selection based on mutual information. Pattern Recognit. 2017, 67, 410–423. [Google Scholar] [CrossRef]
- Sun, Z.; Zhang, J.; Dai, L.; Li, C.; Zhou, C.; Xin, J.; Li, S. Mutual information based multi-label feature selection via constrained convex optimization. Neurocomputing 2019, 329, 447–456. [Google Scholar] [CrossRef]
- Li, L.; Liu, H.; Ma, Z.; Mo, Y.; Duan, Z.; Zhou, J.; Zhao, J. Multi-label feature selection via information gain. In Proceedings of the International Conference on Advanced Data Mining and Applications, Guilin, China, 19–21 December 2014; pp. 345–355. [Google Scholar]
- Sechidis, K.; Spyromitros-Xioufis, E.; Vlahavas, I. Information Theoretic Multi-Target Feature Selection via Output Space Quantization. Entropy 2019, 21, 855. [Google Scholar] [CrossRef] [Green Version]
- Lee, J.; Kim, D.W. Mutual Information-based multi-label feature selection using interaction information. Expert Syst. Appl. 2015, 42, 2013–2025. [Google Scholar] [CrossRef]
- Lee, J.; Kim, D.W. SCLS: Multi-label feature selection based on scalable criterion for large label set. Pattern Recognit. 2017, 66, 342–352. [Google Scholar] [CrossRef]
- Lin, Y.; Hu, Q.; Liu, J.; Duan, J. Multi-label feature selection based on max-dependency and min-redundancy. Neurocomputing 2015, 168, 92–103. [Google Scholar] [CrossRef]
- Lee, J.; Kim, D.W. Feature selection for multi-label classification using multivariate mutual information. Pattern Recognit. Lett. 2013, 34, 349–357. [Google Scholar] [CrossRef]
- Zhang, P.; Liu, G.; Gao, W. Distinguishing two types of labels for multi-label feature selection. Pattern Recognit. 2019, 95, 72–82. [Google Scholar] [CrossRef]
- Shannon, C.E. A mathematical theory of communication. Bell Syst. Tech. J. 1948, 27, 379–423. [Google Scholar] [CrossRef] [Green Version]
- Cover, T.M.; Thomas, J.A. Elements of Information Theory; Tsinghua University Press: Beijing, China, 2003; pp. 13–55. [Google Scholar]
- Wu, X.Z.; Zhou, Z.H. A unified view of multi-label performance measures. In Proceedings of the 34th International Conference on Machine Learning-Volume 70, Sydney, Australia, 6–11 August 2017; pp. 3780–3788. [Google Scholar]
- Lee, J.; Kim, D.W. Efficient multi-label feature selection using entropy-based label selection. Entropy 2016, 18, 405. [Google Scholar] [CrossRef] [Green Version]
- Lim, H.; Lee, J.; Kim, D.W. Optimization approach for feature selection in multi-label classification. Pattern Recognit. Lett. 2017, 89, 25–30. [Google Scholar] [CrossRef]
- Boutell, M.R.; Luo, J.; Shen, X.; Brown, C.M. Learning multi-label scene classification. Pattern Recognit. 2004, 37, 1757–1771. [Google Scholar] [CrossRef] [Green Version]
- Trohidis, K.; Tsoumakas, G.; Kalliris, G.; Vlahavas, I. Multilabel classification of music into emotions. Blood 2008, 90, 3438–3443. [Google Scholar]
- Read, J. A pruned problem transformation method for multi-label classification. In Proceedings of the 2008 New Zealand Computer Science Research Student Conference, Christchurch, New Zealand, 14–18 April 2008; pp. 143–150. [Google Scholar]
- SpolaôR, N.; Cherman, E.A.; Monard, M.C.; Lee, H.D. A comparison of multi-label feature selection methods using the problem transformation approach. Electron. Notes Theor. Comput. Sci. 2013, 292, 135–151. [Google Scholar] [CrossRef] [Green Version]
- Robnik-Ikonja, M.; Kononenko, I. Theoretical and Empirical Analysis of ReliefF and RReliefF. Mach. Learn. 2003, 53, 23–69. [Google Scholar] [CrossRef] [Green Version]
- Lewis, D.D. Feature Selection and Feature Extraction for Text Categorization. In Proceedings of the Speech and Natural Language: Proceedings of a Workshop Held at Harriman, New York, NY, USA, 23–26 February 1992; pp. 212–217. [Google Scholar]
- Doquire, G.; Verleysen, M. Mutual information-based feature selection for multilabel classification. Neurocomputing 2013, 122, 148–155. [Google Scholar] [CrossRef]
- Jian, L.; Li, J.; Shu, K.; Liu, H. Multi-Label Informed Feature Selection. In Proceedings of the Twenty-Fifth International Joint Conference on Artificial Intelligence, New York, NY, USA, 9–15 July 2016; pp. 1627–1633. [Google Scholar]
- Kong, D.; Fujimaki, R.; Liu, J.; Nie, F.; Ding, C. Exclusive Feature Learning on Arbitrary Structures via ℓ1,2-norm. In Proceedings of the Advances in Neural Information Processing Systems, Montreal, QC, Canada, 8–13 December 2014; pp. 1655–1663. [Google Scholar]
- Peng, H.; Long, F.; Ding, C. Feature selection based on mutual information criteria of max-dependency, max-relevance, and min-redundancy. IEEE Trans. Pattern Anal. Mach. Intell. 2005, 27, 1226–1238. [Google Scholar] [CrossRef] [PubMed]
- Vinh, N.X.; Zhou, S.; Chan, J.; Bailey, J. Can high-order dependencies improve mutual information based feature selection? Pattern Recognit. 2016, 53, 46–58. [Google Scholar] [CrossRef] [Green Version]
- Bennasar, M.; Hicks, Y.; Setchi, R. Feature selection using Joint Mutual Information Maximisation. Expert Syst. Appl. 2015, 42, 8520–8532. [Google Scholar] [CrossRef] [Green Version]
- Hoque, N.; Bhattacharyya, D.K.; Kalita, J. MIFS-ND: A mutual information-based feature selection method. Expert Syst. Appl. 2014, 41, 6371–6385. [Google Scholar] [CrossRef]
- Che, J.; Yang, Y.; Li, L.; Bai, X.; Zhang, S.; Deng, C. Maximum relevance minimum common redundancy feature selection for nonlinear data. Inf. Sci. 2017, 409, 68–86. [Google Scholar] [CrossRef]
- Freeman, C.; Kulic, D.; Basir, O. An evaluation of classifier-specific filter measure performance for feature selection. Pattern Recognit. 2015, 48, 1812–1826. [Google Scholar] [CrossRef]
- Tsoumakas, G.; Spyromitros-Xioufis, E.; Vilcek, J.; Vlahavas, I. MULAN: A Java library for multi-label learning. J. Mach. Learn. Res. 2011, 12, 2411–2414. [Google Scholar]
Figure 1.
The correlation between feature and the label set for the first-order and second-order label correlations.
Figure 1.
The correlation between feature and the label set for the first-order and second-order label correlations.

Figure 2.
The correlation between feature and the label set for the high-order label correlations.

Figure 3.
Experimental framework.

Figure 4.
Classification performance on Arts data set: (a) Hamming Loss, (b) Zero-One Loss, (c) Macro-F1 on SVM classifier, (d) Macro-F1 on 3NN classifier, (e) Micro-F1 on SVM classifier, (f) Micro-F1 on 3NN classifier.
Figure 4.
Classification performance on Arts data set: (a) Hamming Loss, (b) Zero-One Loss, (c) Macro-F1 on SVM classifier, (d) Macro-F1 on 3NN classifier, (e) Micro-F1 on SVM classifier, (f) Micro-F1 on 3NN classifier.

Figure 5.
Classification performance on medical data set: (a) Hamming Loss, (b) Zero-One Loss, (c) Macro-F1 on SVM classifier, (d) Macro-F1 on 3NN classifier, (e) Micro-F1 on SVM classifier, (f) Micro-F1 on 3NN classifier.
Figure 5.
Classification performance on medical data set: (a) Hamming Loss, (b) Zero-One Loss, (c) Macro-F1 on SVM classifier, (d) Macro-F1 on 3NN classifier, (e) Micro-F1 on SVM classifier, (f) Micro-F1 on 3NN classifier.

Figure 6.
Classification performance on scene data set: (a) Hamming Loss, (b) Zero-One Loss, (c) Macro-F1 on SVM classifier, (d) Macro-F1 on 3NN classifier, (e) Micro-F1 on SVM classifier, (f) Micro-F1 on 3NN classifier.
Figure 6.
Classification performance on scene data set: (a) Hamming Loss, (b) Zero-One Loss, (c) Macro-F1 on SVM classifier, (d) Macro-F1 on 3NN classifier, (e) Micro-F1 on SVM classifier, (f) Micro-F1 on 3NN classifier.

Figure 7.
The running time of nine methods: (a) all methods, (b) Multi-label Feature Selection considering the Max-Correlation (MCMFS), Pruned Problem Transformation (PPT) + mutual information (MI), PPT + CHI, Multi-label Informed Feature Selection (MIFS) and Scalable Criterion for a Large Label Set (SCLS).


Table 1.
The time complexity of six methods.
| Methods | Time Complexity |
|---|---|
| MCMFS | |
| SCLS | |
| D2F | |
| MDMR | |
| PMU | |
| LRFS |
Table 2.
An artificial data.
| O | |||||||||||||
|---|---|---|---|---|---|---|---|---|---|---|---|---|---|
| 0 | 1 | 0 | 0 | 0 | 1 | 0 | 0 | 1 | 1 | 1 | 0 | 0 | |
| 1 | 0 | 0 | 0 | 0 | 1 | 1 | 1 | 0 | 0 | 0 | 0 | 1 | |
| 1 | 0 | 1 | 1 | 0 | 1 | 1 | 0 | 0 | 0 | 0 | 1 | 0 | |
| 1 | 1 | 0 | 0 | 0 | 0 | 1 | 1 | 1 | 1 | 1 | 1 | 1 | |
| 0 | 0 | 1 | 0 | 1 | 0 | 1 | 0 | 0 | 0 | 0 | 1 | 0 | |
| 0 | 1 | 0 | 0 | 0 | 0 | 0 | 0 | 1 | 1 | 1 | 0 | 0 | |
| 0 | 0 | 0 | 0 | 0 | 0 | 1 | 0 | 0 | 0 | 0 | 0 | 1 | |
| 0 | 0 | 0 | 1 | 0 | 0 | 0 | 0 | 1 | 0 | 0 | 0 | 0 | |
| 1 | 0 | 0 | 0 | 0 | 1 | 0 | 0 | 0 | 1 | 0 | 0 | 0 | |
| 0 | 0 | 0 | 0 | 1 | 0 | 1 | 0 | 0 | 0 | 1 | 0 | 0 |
Table 3.
Experimental results on the artificial data set.
| Methods | Feature Ranking | HL↓ | ZOL↓ | Macro-F1 (SVM) ↑ | Micro-F1 (SVM) ↑ | Macro-F1 (3NN) ↑ | Micro-F1 (3NN) ↑ |
|---|---|---|---|---|---|---|---|
| MCMFS | 0.3075 | 0.8875 | 0.4017 | 0.4651 | 0.3783 | 0.4694 | |
| D2F | 0.3433 | 0.9583 | 0.3342 | 0.3985 | 0.2350 | 0.3148 | |
| LRFS | 0.3625 | 0.9292 | 0.3550 | 0.4191 | 0.2883 | 0.3829 | |
| MDMR | 0.3342 | 0.9333 | 0.3533 | 0.4261 | 0.3617 | 0.4646 | |
| PMU | 0.3758 | 0.9875 | 0.2733 | 0.3395 | 0.1917 | 0.2823 | |
| SCLS | 0.3408 | 0.9583 | 0.3517 | 0.4321 | 0.3375 | 0.4220 |
Table 4.
Description of data sets.
| No. | Data Set | #Instances | #Features | #Labels | #Training | #Test |
|---|---|---|---|---|---|---|
| 1 | medical | 978 | 1449 | 45 | 333 | 645 |
| 2 | scene | 2407 | 294 | 6 | 1211 | 1196 |
| 3 | Enron | 1702 | 1001 | 53 | 1123 | 579 |
| 4 | Arts | 5000 | 462 | 26 | 2000 | 3000 |
| 5 | Business | 5000 | 438 | 30 | 2000 | 3000 |
| 6 | Education | 5000 | 550 | 33 | 2000 | 3000 |
| 7 | Entertain | 5000 | 640 | 21 | 2000 | 3000 |
| 8 | Health | 5000 | 612 | 32 | 2000 | 3000 |
| 9 | Recreation | 5000 | 606 | 22 | 2000 | 3000 |
| 10 | Reference | 5000 | 793 | 33 | 2000 | 3000 |
| 11 | Science | 5000 | 743 | 40 | 2000 | 3000 |
| 12 | Social | 5000 | 1047 | 39 | 2000 | 3000 |
Table 5.
Experimental results of multi-label feature selection methods in terms of Hamming Loss (HL) (mean ± std).
Table 5.
Experimental results of multi-label feature selection methods in terms of Hamming Loss (HL) (mean ± std).
| Data set | MCMFS | PPT + MI | PPT + CHI | MIFS | D2F | MDMR | PMU | SCLS | LRFS |
|---|---|---|---|---|---|---|---|---|---|
| medical | 0.015 ± 0.001 | 0.018 ± 0.001 | 0.017 ± 0.002 | 0.017 ± 0.002 | 0.02 ± 0.001 | 0.018 ± 0.001 | 0.02 ± 0.001 | 0.023 ± 0 | 0.018 ± 0.001 |
| scene | 0.135 ± 0.011 | 0.167 ± 0.006 | 0.167 ± 0.007 | 0.17 ± 0.01 | 0.149 ± 0.006 | 0.145 ± 0.007 | 0.147 ± 0.007 | 0.173 ± 0.003 | 0.142 ± 0.01 |
| enron | 0.051 ± 0.002 | 0.053 ± 0.002 | 0.059 ± 0.001 | 0.057 ± 0.001 | 0.052 ± 0.001 | 0.053 ± 0.003 | 0.052 ± 0.001 | 0.053 ± 0.001 | 0.055 ± 0.003 |
| Arts | 0.060 ± 0.001 | 0.062 ± 0.001 | 0.062 ± 0.001 | 0.061 ± 0.001 | 0.064 ± 0.001 | 0.061 ± 0.001 | 0.064 ± 0.001 | 0.063 ± 0.001 | 0.061 ± 0.001 |
| Business | 0.029 ± 0.000 | 0.029 ± 0.001 | 0.029 ± 0.000 | 0.028 ± 0.000 | 0.029 ± 0.001 | 0.029 ± 0.001 | 0.029 ± 0.000 | 0.029 ± 0 | 0.029 ± 0.001 |
| Education | 0.042 ± 0.001 | 0.043 ± 0.001 | 0.043 ± 0.001 | 0.044 ± 0.001 | 0.044 ± 0.001 | 0.043 ± 0.001 | 0.045 ± 0.001 | 0.044 ± 0.001 | 0.043 ± 0.001 |
| Entertain | 0.061 ± 0.001 | 0.064 ± 0.001 | 0.065 ± 0.001 | 0.066 ± 0.001 | 0.066 ± 0.001 | 0.063 ± 0.002 | 0.067 ± 0.001 | 0.066 ± 0.001 | 0.063 ± 0.001 |
| Health | 0.044 ± 0.001 | 0.046 ± 0.001 | 0.045 ± 0.002 | 0.05 ± 0.001 | 0.048 ± 0.001 | 0.045 ± 0.001 | 0.049 ± 0.001 | 0.049 ± 0.001 | 0.045 ± 0.001 |
| Recreation | 0.061 ± 0.001 | 0.062 ± 0.001 | 0.062 ± 0.001 | 0.062 ± 0.001 | 0.062 ± 0.001 | 0.062 ± 0.001 | 0.065 ± 0.001 | 0.064 ± 0.001 | 0.061 ± 0.001 |
| Reference | 0.031 ± 0.001 | 0.032 ± 0.001 | 0.032 ± 0.001 | 0.031 ± 0.001 | 0.032 ± 0.001 | 0.031 ± 0.001 | 0.034 ± 0.001 | 0.033 ± 0 | 0.031 ± 0.001 |
| Science | 0.035 ± 0.001 | 0.036 ± 0.001 | 0.036 ± 0.000 | 0.036 ± 0.000 | 0.036 ± 0.000 | 0.035 ± 0.000 | 0.036 ± 0.000 | 0.036 ± 0.000 | 0.035 ± 0.001 |
| Social | 0.026 ± 0.001 | 0.028 ± 0.001 | 0.03 ± 0.001 | 0.032 ± 0.001 | 0.03 ± 0.001 | 0.028 ± 0.001 | 0.031 ± 0 | 0.029 ± 0.001 | 0.027 ± 0.001 |
| Average | 0.049 | 0.053 | 0.054 | 0.055 | 0.053 | 0.051 | 0.053 | 0.055 | 0.051 |
Table 6.
Experimental results of multi-label feature selection methods in terms of Zero-One Loss (ZOL) (mean ± std).
Table 6.
Experimental results of multi-label feature selection methods in terms of Zero-One Loss (ZOL) (mean ± std).
| Data set | MCMFS | PPT + MI | PPT + CHI | MIFS | D2F | MDMR | PMU | SCLS | LRFS |
|---|---|---|---|---|---|---|---|---|---|
| medical | 0.50 ± 0.05 | 0.59 ± 0.05 | 0.55 ± 0.06 | 0.55 ± 0.08 | 0.66 ± 0.04 | 0.58 ± 0.04 | 0.66 ± 0.04 | 0.83 ± 0.01 | 0.58 ± 0.04 |
| scene | 0.57 ± 0.08 | 0.78 ± 0.08 | 0.8 ± 0.09 | 0.83 ± 0.12 | 0.61 ± 0.06 | 0.61 ± 0.07 | 0.61 ± 0.07 | 0.74 ± 0.04 | 0.6 ± 0.08 |
| enron | 0.89 ± 0.02 | 0.9 ± 0.03 | 0.98 ± 0 | 0.98 ± 0.01 | 0.9 ± 0.02 | 0.91 ± 0.03 | 0.9 ± 0.03 | 0.94 ± 0.03 | 0.93 ± 0.04 |
| Arts | 0.90 ± 0.03 | 0.93 ± 0.03 | 0.95 ± 0.02 | 0.92 ± 0.03 | 0.95 ± 0.01 | 0.92 ± 0.03 | 0.97 ± 0.02 | 0.95 ± 0.01 | 0.92 ± 0.03 |
| Business | 0.47 ± 0.01 | 0.48 ± 0.01 | 0.47 ± 0.01 | 0.47 ± 0.01 | 0.48 ± 0.01 | 0.47 ± 0.01 | 0.48 ± 0.01 | 0.48 ± 0.01 | 0.47 ± 0.01 |
| Education | 0.88 ± 0.03 | 0.91 ± 0.02 | 0.94 ± 0.02 | 0.95 ± 0.03 | 0.95 ± 0.01 | 0.9 ± 0.02 | 0.95 ± 0.01 | 0.93 ± 0.01 | 0.9 ± 0.02 |
| Entertain | 0.82 ± 0.04 | 0.87 ± 0.04 | 0.9 ± 0.03 | 0.93 ± 0.03 | 0.91 ± 0.01 | 0.85 ± 0.03 | 0.94 ± 0.01 | 0.9 ± 0.01 | 0.86 ± 0.03 |
| Health | 0.66 ± 0.04 | 0.73 ± 0.06 | 0.67 ± 0.01 | 0.8 ± 0.09 | 0.77 ± 0.05 | 0.71 ± 0.05 | 0.77 ± 0.05 | 0.74 ± 0.04 | 0.71 ± 0.05 |
| Recreation | 0.86 ± 0.02 | 0.89 ± 0.02 | 0.89 ± 0.02 | 0.88 ± 0.03 | 0.92 ± 0.01 | 0.87 ± 0.02 | 0.97 ± 0.01 | 0.95 ± 0.01 | 0.88 ± 0.02 |
| Reference | 0.74 ± 0.08 | 0.74 ± 0.08 | 0.71 ± 0.13 | 0.78 ± 0.07 | 0.8 ± 0.04 | 0.76 ± 0.06 | 0.81 ± 0.05 | 0.83 ± 0.04 | 0.76 ± 0.06 |
| Science | 0.91 ± 0.02 | 0.94 ± 0.01 | 0.96 ± 0.01 | 0.93 ± 0.03 | 0.97 ± 0.01 | 0.94 ± 0.01 | 0.98 ± 0.01 | 0.95 ± 0.01 | 0.94 ± 0.01 |
| Social | 0.70 ± 0.05 | 0.72 ± 0.05 | 0.76 ± 0.13 | 0.88 ± 0.09 | 0.73 ± 0.09 | 0.72 ± 0.05 | 0.78 ± 0.07 | 0.74 ± 0.04 | 0.72 ± 0.05 |
| Average | 0.74 | 0.79 | 0.80 | 0.82 | 0.80 | 0.77 | 0.82 | 0.83 | 0.77 |
Table 7.
Experimental results of multi-label feature selection methods in terms of Macro-F1 (mean ± std) using the Support Vector Machine (SVM) classifier.
Table 7.
Experimental results of multi-label feature selection methods in terms of Macro-F1 (mean ± std) using the Support Vector Machine (SVM) classifier.
| Data set | MCMFS | PPT + MI | PPT + CHI | MIFS | D2F | MDMR | PMU | SCLS | LRFS |
|---|---|---|---|---|---|---|---|---|---|
| medical | 0.35 ± 0.06 | 0.25 ± 0.05 | 0.26 ± 0.04 | 0.22 ± 0.05 | 0.19 ± 0.05 | 0.32 ± 0.07 | 0.19 ± 0.06 | 0.08 ± 0.01 | 0.32 ± 0.07 |
| scene | 0.48 ± 0.09 | 0.22 ± 0.09 | 0.21 ± 0.1 | 0.21 ± 0.15 | 0.46 ± 0.08 | 0.43 ± 0.07 | 0.47 ± 0.09 | 0.26 ± 0.05 | 0.44 ± 0.08 |
| enron | 0.12 ± 0.03 | 0.1 ± 0.03 | 0.07 ± 0.02 | 0.07 ± 0.02 | 0.13 ± 0.04 | 0.11 ± 0.03 | 0.13 ± 0.05 | 0.12 ± 0.03 | 0.1 ± 0.03 |
| Arts | 0.09 ± 0.03 | 0.06 ± 0.02 | 0.07 ± 0.02 | 0.07 ± 0.02 | 0.03 ± 0.00 | 0.08 ± 0.03 | 0.01 ± 0.01 | 0.03 ± 0.00 | 0.07 ± 0.02 |
| Business | 0.05 ± 0.00 | 0.05 ± 0.00 | 0.05 ± 0.00 | 0.04 ± 0.00 | 0.05 ± 0.00 | 0.05 ± 0.00 | 0.03 ± 0.00 | 0.04 ± 0.00 | 0.05 ± 0.00 |
| Education | 0.07 ± 0.01 | 0.06 ± 0.01 | 0.05 ± 0.01 | 0.03 ± 0.02 | 0.05 ± 0.01 | 0.06 ± 0.01 | 0.03 ± 0.01 | 0.04 ± 0.01 | 0.06 ± 0.01 |
| Entertain | 0.13 ± 0.03 | 0.11 ± 0.03 | 0.09 ± 0.02 | 0.06 ± 0.02 | 0.08 ± 0.01 | 0.12 ± 0.02 | 0.05 ± 0.00 | 0.07 ± 0.01 | 0.12 ± 0.02 |
| Health | 0.15 ± 0.03 | 0.13 ± 0.03 | 0.14 ± 0.03 | 0.06 ± 0.03 | 0.09 ± 0.01 | 0.14 ± 0.03 | 0.08 ± 0.01 | 0.09 ± 0.01 | 0.14 ± 0.03 |
| Recreation | 0.11 ± 0.02 | 0.1 ± 0.02 | 0.1 ± 0.02 | 0.09 ± 0.03 | 0.08 ± 0.01 | 0.11 ± 0.02 | 0.03 ± 0.00 | 0.04 ± 0.00 | 0.11 ± 0.02 |
| Reference | 0.07 ± 0.01 | 0.07 ± 0.01 | 0.07 ± 0.02 | 0.06 ± 0.02 | 0.04 ± 0.00 | 0.07 ± 0.01 | 0.03 ± 0.01 | 0.02 ± 0.00 | 0.07 ± 0.01 |
| Science | 0.07 ± 0.02 | 0.05 ± 0.02 | 0.05 ± 0.01 | 0.04 ± 0.02 | 0.02 ± 0.00 | 0.05 ± 0.02 | 0.01 ± 0.01 | 0.02 ± 0.00 | 0.05 ± 0.02 |
| Social | 0.11 ± 0.03 | 0.09 ± 0.02 | 0.09 ± 0.02 | 0.05 ± 0.03 | 0.07 ± 0.01 | 0.1 ± 0.03 | 0.05 ± 0.01 | 0.05 ± 0.01 | 0.1 ± 0.03 |
| Average | 0.15 | 0.11 | 0.10 | 0.09 | 0.11 | 0.14 | 0.09 | 0.07 | 0.14 |
Table 8.
Experimental results of multi-label feature selection methods in terms of Macro-F1 (mean ± std) using the 3-Nearest Neighbors (3NN) classifier.
Table 8.
Experimental results of multi-label feature selection methods in terms of Macro-F1 (mean ± std) using the 3-Nearest Neighbors (3NN) classifier.
| Data set | MCMFS | PPT + MI | PPT + CHI | MIFS | D2F | MDMR | PMU | SCLS | LRFS |
|---|---|---|---|---|---|---|---|---|---|
| medical | 0.25 ± 0.04 | 0.16 ± 0.03 | 0.19 ± 0.02 | 0.16 ± 0.02 | 0.12 ± 0.02 | 0.19 ± 0.03 | 0.11 ± 0.02 | 0.06 ± 0.01 | 0.19 ± 0.03 |
| scene | 0.54 ± 0.07 | 0.37 ± 0.08 | 0.36 ± 0.08 | 0.29 ± 0.14 | 0.49 ± 0.05 | 0.51 ± 0.06 | 0.49 ± 0.07 | 0.37 ± 0.03 | 0.53 ± 0.07 |
| enron | 0.13 ± 0.02 | 0.12 ± 0.02 | 0.07 ± 0.01 | 0.09 ± 0.01 | 0.12 ± 0.01 | 0.12 ± 0.02 | 0.12 ± 0.02 | 0.11 ± 0.01 | 0.11 ± 0.02 |
| Arts | 0.11 ± 0.03 | 0.08 ± 0.02 | 0.1 ± 0.03 | 0.08 ± 0.03 | 0.06 ± 0.01 | 0.1 ± 0.02 | 0.06 ± 0.01 | 0.07 ± 0.02 | 0.1 ± 0.02 |
| Business | 0.1 ± 0.01 | 0.08 ± 0.01 | 0.09 ± 0.01 | 0.09 ± 0.02 | 0.07 ± 0.01 | 0.09 ± 0.01 | 0.05 ± 0.01 | 0.07 ± 0.01 | 0.08 ± 0.01 |
| Education | 0.09 ± 0.02 | 0.08 ± 0.02 | 0.08 ± 0.02 | 0.04 ± 0.02 | 0.06 ± 0.01 | 0.07 ± 0.01 | 0.06 ± 0.01 | 0.06 ± 0.01 | 0.07 ± 0.01 |
| Entertain | 0.14 ± 0.03 | 0.13 ± 0.02 | 0.11 ± 0.02 | 0.08 ± 0.02 | 0.11 ± 0.01 | 0.13 ± 0.02 | 0.08 ± 0.01 | 0.09 ± 0.01 | 0.14 ± 0.02 |
| Health | 0.14 ± 0.03 | 0.11 ± 0.02 | 0.12 ± 0.03 | 0.05 ± 0.03 | 0.09 ± 0.01 | 0.12 ± 0.02 | 0.09 ± 0.01 | 0.09 ± 0.01 | 0.12 ± 0.02 |
| Recreation | 0.13 ± 0.02 | 0.1 ± 0.01 | 0.11 ± 0.02 | 0.12 ± 0.03 | 0.08 ± 0.01 | 0.12 ± 0.02 | 0.05 ± 0.01 | 0.07 ± 0.01 | 0.12 ± 0.02 |
| Reference | 0.08 ± 0.01 | 0.07 ± 0.01 | 0.08 ± 0.02 | 0.07 ± 0.01 | 0.04 ± 0 | 0.07 ± 0.01 | 0.03 ± 0.01 | 0.04 ± 0.01 | 0.07 ± 0.01 |
| Science | 0.08 ± 0.02 | 0.05 ± 0.01 | 0.07 ± 0.01 | 0.06 ± 0.02 | 0.04 ± 0.01 | 0.07 ± 0.02 | 0.03 ± 0.01 | 0.03 ± 0 | 0.06 ± 0.01 |
| Social | 0.12 ± 0.02 | 0.08 ± 0.01 | 0.1 ± 0.01 | 0.07 ± 0.03 | 0.06 ± 0.01 | 0.09 ± 0.01 | 0.05 ± 0.01 | 0.05 ± 0 | 0.09 ± 0.01 |
| Average | 0.16 | 0.12 | 0.12 | 0.10 | 0.11 | 0.14 | 0.10 | 0.09 | 0.14 |
Table 9.
Experimental results of multi-label feature selection methods in terms of Micro-F1 (mean ± std) using the SVM classifier.
Table 9.
Experimental results of multi-label feature selection methods in terms of Micro-F1 (mean ± std) using the SVM classifier.
| Data set | MCMFS | PPT + MI | PPT + CHI | MIFS | D2F | MDMR | PMU | SCLS | LRFS |
|---|---|---|---|---|---|---|---|---|---|
| medical | 0.79 ± 0.05 | 0.73 ± 0.05 | 0.74 ± 0.07 | 0.71 ± 0.11 | 0.63 ± 0.07 | 0.76 ± 0.05 | 0.63 ± 0.08 | 0.37 ± 0.01 | 0.76 ± 0.05 |
| scene | 0.50 ± 0.08 | 0.25 ± 0.1 | 0.24 ± 0.11 | 0.24 ± 0.16 | 0.48 ± 0.07 | 0.46 ± 0.07 | 0.49 ± 0.08 | 0.3 ± 0.05 | 0.47 ± 0.07 |
| enron | 0.51 ± 0.03 | 0.47 ± 0.04 | 0.35 ± 0.02 | 0.37 ± 0.03 | 0.51 ± 0.03 | 0.47 ± 0.05 | 0.5 ± 0.04 | 0.49 ± 0.03 | 0.45 ± 0.06 |
| Arts | 0.18 ± 0.05 | 0.14 ± 0.05 | 0.12 ± 0.04 | 0.17 ± 0.05 | 0.08 ± 0.01 | 0.17 ± 0.05 | 0.03 ± 0.02 | 0.07 ± 0.02 | 0.16 ± 0.05 |
| Business | 0.68 ± 0.00 | 0.68 ± 0.00 | 0.68 ± 0.00 | 0.67 ± 0.00 | 0.67 ± 0.00 | 0.68 ± 0.00 | 0.67 ± 0.00 | 0.67 ± 0 | 0.68 ± 0.00 |
| Education | 0.23 ± 0.05 | 0.2 ± 0.04 | 0.13 ± 0.04 | 0.12 ± 0.06 | 0.12 ± 0.02 | 0.21 ± 0.05 | 0.08 ± 0.01 | 0.14 ± 0.02 | 0.21 ± 0.04 |
| Entertain | 0.27 ± 0.06 | 0.23 ± 0.06 | 0.17 ± 0.05 | 0.11 ± 0.05 | 0.16 ± 0.01 | 0.26 ± 0.06 | 0.1 ± 0.01 | 0.15 ± 0.02 | 0.25 ± 0.06 |
| Health | 0.50 ± 0.02 | 0.45 ± 0.07 | 0.47 ± 0.03 | 0.39 ± 0.05 | 0.42 ± 0.01 | 0.47 ± 0.04 | 0.39 ± 0.03 | 0.41 ± 0 | 0.48 ± 0.03 |
| Recreation | 0.20 ± 0.04 | 0.19 ± 0.03 | 0.17 ± 0.04 | 0.18 ± 0.05 | 0.14 ± 0.02 | 0.2 ± 0.04 | 0.04 ± 0 | 0.07 ± 0.01 | 0.2 ± 0.04 |
| Reference | 0.32 ± 0.04 | 0.35 ± 0.07 | 0.35 ± 0.14 | 0.33 ± 0.1 | 0.31 ± 0.04 | 0.34 ± 0.06 | 0.27 ± 0.05 | 0.26 ± 0.04 | 0.34 ± 0.06 |
| Science | 0.15 ± 0.04 | 0.12 ± 0.03 | 0.09 ± 0.03 | 0.11 ± 0.05 | 0.05 ± 0.01 | 0.13 ± 0.03 | 0.02 ± 0.02 | 0.06 ± 0.01 | 0.13 ± 0.03 |
| Social | 0.45 ± 0.08 | 0.42 ± 0.07 | 0.38 ± 0.14 | 0.2 ± 0.12 | 0.4 ± 0.07 | 0.43 ± 0.07 | 0.31 ± 0.07 | 0.38 ± 0.05 | 0.43 ± 0.07 |
| Average | 0.40 | 0.35 | 0.33 | 0.30 | 0.33 | 0.38 | 0.29 | 0.28 | 0.38 |
Table 10.
Experimental results of multi-label feature selection methods in terms of Micro-F1 (mean ± std) using the 3NN classifier.
Table 10.
Experimental results of multi-label feature selection methods in terms of Micro-F1 (mean ± std) using the 3NN classifier.
| Data set | MCMFS | PPT + MI | PPT + CHI | MIFS | D2F | MDMR | PMU | SCLS | LRFS |
|---|---|---|---|---|---|---|---|---|---|
| medical | 0.69 ± 0.04 | 0.62 ± 0.04 | 0.64 ± 0.06 | 0.61 ± 0.1 | 0.53 ± 0.04 | 0.64 ± 0.03 | 0.52 ± 0.04 | 0.35 ± 0.01 | 0.64 ± 0.03 |
| scene | 0.55 ± 0.06 | 0.39 ± 0.06 | 0.38 ± 0.06 | 0.34 ± 0.11 | 0.49 ± 0.04 | 0.52 ± 0.05 | 0.5 ± 0.05 | 0.38 ± 0.02 | 0.54 ± 0.05 |
| enron | 0.49 ± 0.02 | 0.45 ± 0.01 | 0.34 ± 0.03 | 0.41 ± 0.02 | 0.47 ± 0.03 | 0.44 ± 0.04 | 0.47 ± 0.02 | 0.44 ± 0.03 | 0.42 ± 0.05 |
| Arts | 0.26 ± 0.05 | 0.17 ± 0.05 | 0.24 ± 0.04 | 0.18 ± 0.05 | 0.15 ± 0.03 | 0.25 ± 0.04 | 0.14 ± 0.03 | 0.17 ± 0.03 | 0.25 ± 0.04 |
| Business | 0.67 ± 0.01 | 0.67 ± 0.00 | 0.66 ± 0.01 | 0.65 ± 0.08 | 0.66 ± 0.00 | 0.67 ± 0.01 | 0.65 ± 0.04 | 0.60 ± 0.12 | 0.67 ± 0.01 |
| Education | 0.26 ± 0.03 | 0.24 ± 0.04 | 0.28 ± 0.04 | 0.16 ± 0.06 | 0.19 ± 0.03 | 0.23 ± 0.03 | 0.18 ± 0.04 | 0.19 ± 0.03 | 0.23 ± 0.03 |
| Entertain | 0.27 ± 0.05 | 0.28 ± 0.05 | 0.21 ± 0.05 | 0.22 ± 0.08 | 0.24 ± 0.03 | 0.26 ± 0.04 | 0.22 ± 0.05 | 0.22 ± 0.03 | 0.27 ± 0.03 |
| Health | 0.37 ± 0.09 | 0.38 ± 0.07 | 0.37 ± 0.14 | 0.2 ± 0.07 | 0.37 ± 0.05 | 0.38 ± 0.06 | 0.36 ± 0.04 | 0.37 ± 0.06 | 0.38 ± 0.05 |
| Recreation | 0.25 ± 0.03 | 0.19 ± 0.02 | 0.21 ± 0.04 | 0.23 ± 0.05 | 0.16 ± 0.02 | 0.23 ± 0.04 | 0.09 ± 0.02 | 0.12 ± 0.02 | 0.23 ± 0.03 |
| Reference | 0.46 ± 0.04 | 0.41 ± 0.05 | 0.39 ± 0.13 | 0.35 ± 0.09 | 0.36 ± 0.05 | 0.43 ± 0.05 | 0.35 ± 0.04 | 0.29 ± 0.05 | 0.43 ± 0.04 |
| Science | 0.18 ± 0.04 | 0.17 ± 0.03 | 0.12 ± 0.03 | 0.17 ± 0.02 | 0.12 ± 0.02 | 0.16 ± 0.03 | 0.1 ± 0.02 | 0.15 ± 0.03 | 0.16 ± 0.03 |
| Social | 0.46 ± 0.05 | 0.4 ± 0.06 | 0.44 ± 0.1 | 0.39 ± 0.05 | 0.39 ± 0.05 | 0.42 ± 0.06 | 0.36 ± 0.05 | 0.37 ± 0.04 | 0.41 ± 0.05 |
| Average | 0.41 | 0.36 | 0.36 | 0.33 | 0.34 | 0.38 | 0.33 | 0.30 | 0.38 |
Table 11.
Running time (seconds).
| Data Set | MCMFS | D2F | MDMR | PMU | SCLS | LRFS | PPT + MI | PPT + CHI | MIFS |
|---|---|---|---|---|---|---|---|---|---|
| medical | 142.2 | 10,698.5 | 9910.0 | 11521.6 | 38.2 | 6961.9 | 1.2 | 8.6 | 30.3 |
| scene | 23.5 | 244.1 | 246.1 | 257.0 | 5.5 | 147.0 | 0.4 | 1.8 | 47.4 |
| enron | 267.3 | 22,164.0 | 20,583.0 | 25749.6 | 93.6 | 16,631.9 | 0.8 | 6.4 | 41.2 |
| Arts | 111.9 | 4355.8 | 4185.4 | 5002.2 | 39.6 | 3421.2 | 1.0 | 4.1 | 35.5 |
| Business | 107.4 | 4536.1 | 4361.8 | 5354.0 | 41.5 | 4079.8 | 1.0 | 3.1 | 41.9 |
| Education | 161.2 | 8397.3 | 7700.0 | 9037.2 | 59.1 | 6323.1 | 1.2 | 4.3 | 99.3 |
| Entertain | 194.4 | 6809.9 | 6539.2 | 7386.6 | 54.3 | 4519.1 | 1.4 | 5.0 | 98.7 |
| Health | 195.1 | 9376.0 | 9086.8 | 10,797.1 | 68.4 | 7523.4 | 1.3 | 4.8 | 17.2 |
| Recreation | 183.4 | 6394.2 | 6127.6 | 7016.8 | 51.7 | 4369.0 | 1.3 | 4.6 | 39.5 |
| Reference | 313.5 | 16,269.8 | 15,637.3 | 18,483.6 | 96.2 | 11,685.1 | 1.8 | 5.7 | 57.5 |
| Science | 291.4 | 17,419.9 | 16,665.2 | 20,137.1 | 102.7 | 14,344.9 | 1.6 | 6.6 | 60.0 |
| Social | 553.8 | 34,108.8 | 33,195.6 | 37,246.0 | 156.1 | 23,754.5 | 2.8 | 9.0 | 43.4 |
© 2020 by the authors. Licensee MDPI, Basel, Switzerland. This article is an open access article distributed under the terms and conditions of the Creative Commons Attribution (CC BY) license (http://creativecommons.org/licenses/by/4.0/).
Share and Cite
MDPI and ACS Style
Zhang, P.; Gao, W.; Hu, J.; Li, Y. Multi-Label Feature Selection Based on High-Order Label Correlation Assumption. Entropy 2020, 22, 797. https://0-doi-org.brum.beds.ac.uk/10.3390/e22070797
AMA Style
Zhang P, Gao W, Hu J, Li Y. Multi-Label Feature Selection Based on High-Order Label Correlation Assumption. Entropy. 2020; 22(7):797. https://0-doi-org.brum.beds.ac.uk/10.3390/e22070797
Chicago/Turabian StyleZhang, Ping, Wanfu Gao, Juncheng Hu, and Yonghao Li. 2020. "Multi-Label Feature Selection Based on High-Order Label Correlation Assumption" Entropy 22, no. 7: 797. https://0-doi-org.brum.beds.ac.uk/10.3390/e22070797
Note that from the first issue of 2016, this journal uses article numbers instead of page numbers. See further details here.