
Organisational Structure and Created Values. Review of Methods of Studying Collective Intelligence in Policymaking


Abstract
:1. Introduction
2. Materials and Methods
- Task 1.1. Selection of a database of scientific articles to be searched;
- Task 1.2. Search for the studies on collective intelligence in policymaking in the last 10 years, based on selected keywords;
- Task 1.3. Verification of the trend in the number of articles published per year;
- Task 1.4. Search for the most common concepts and terms that appear in the articles;
- Task 1.5. Identification of the methods and strategies of studying CI in policymaking.
- Task 2.1. Checking what number of research methods were used on average per article;
- Task 2.2. Analyzing the changes in the popularity of the use of particular methods in the analyzed period;
- Task 2.3. Finding statistical dependencies between research methods;
- Task 2.4. Finding dependencies between research methods and other features of the analyzed studies (number of citations, usage, number of pages, publication year).
- Task 3.1. Identification of the research areas of the studies;
- Task 3.2. Grouping the related research areas, taking into account the specificity of the researched issue;
- Task 3.3. Analysis of the number of studies published yearly within the research area groups;
- Task 3.4. Identification of which methods and strategies of studying CI in policymaking were used more frequently and which were used less frequently within the research area groups.
- Task 4.1 Ranking of the top 10 articles based on usage and citation criteria to identify the most influential works;
- Task 4.2. Identification of which methods and strategies were used more frequently and which were used less frequently in the “top 10” groups;
- Task 4.3. Ranking the topics of special importance for the study of CI in policymaking;
- Task 4.4. Identification of which methods and strategies were used more frequently and which were used less frequently in the “topics of special importance” groups;
3. Results
3.1. Methods and Strategies of Studying CI in Policymaking
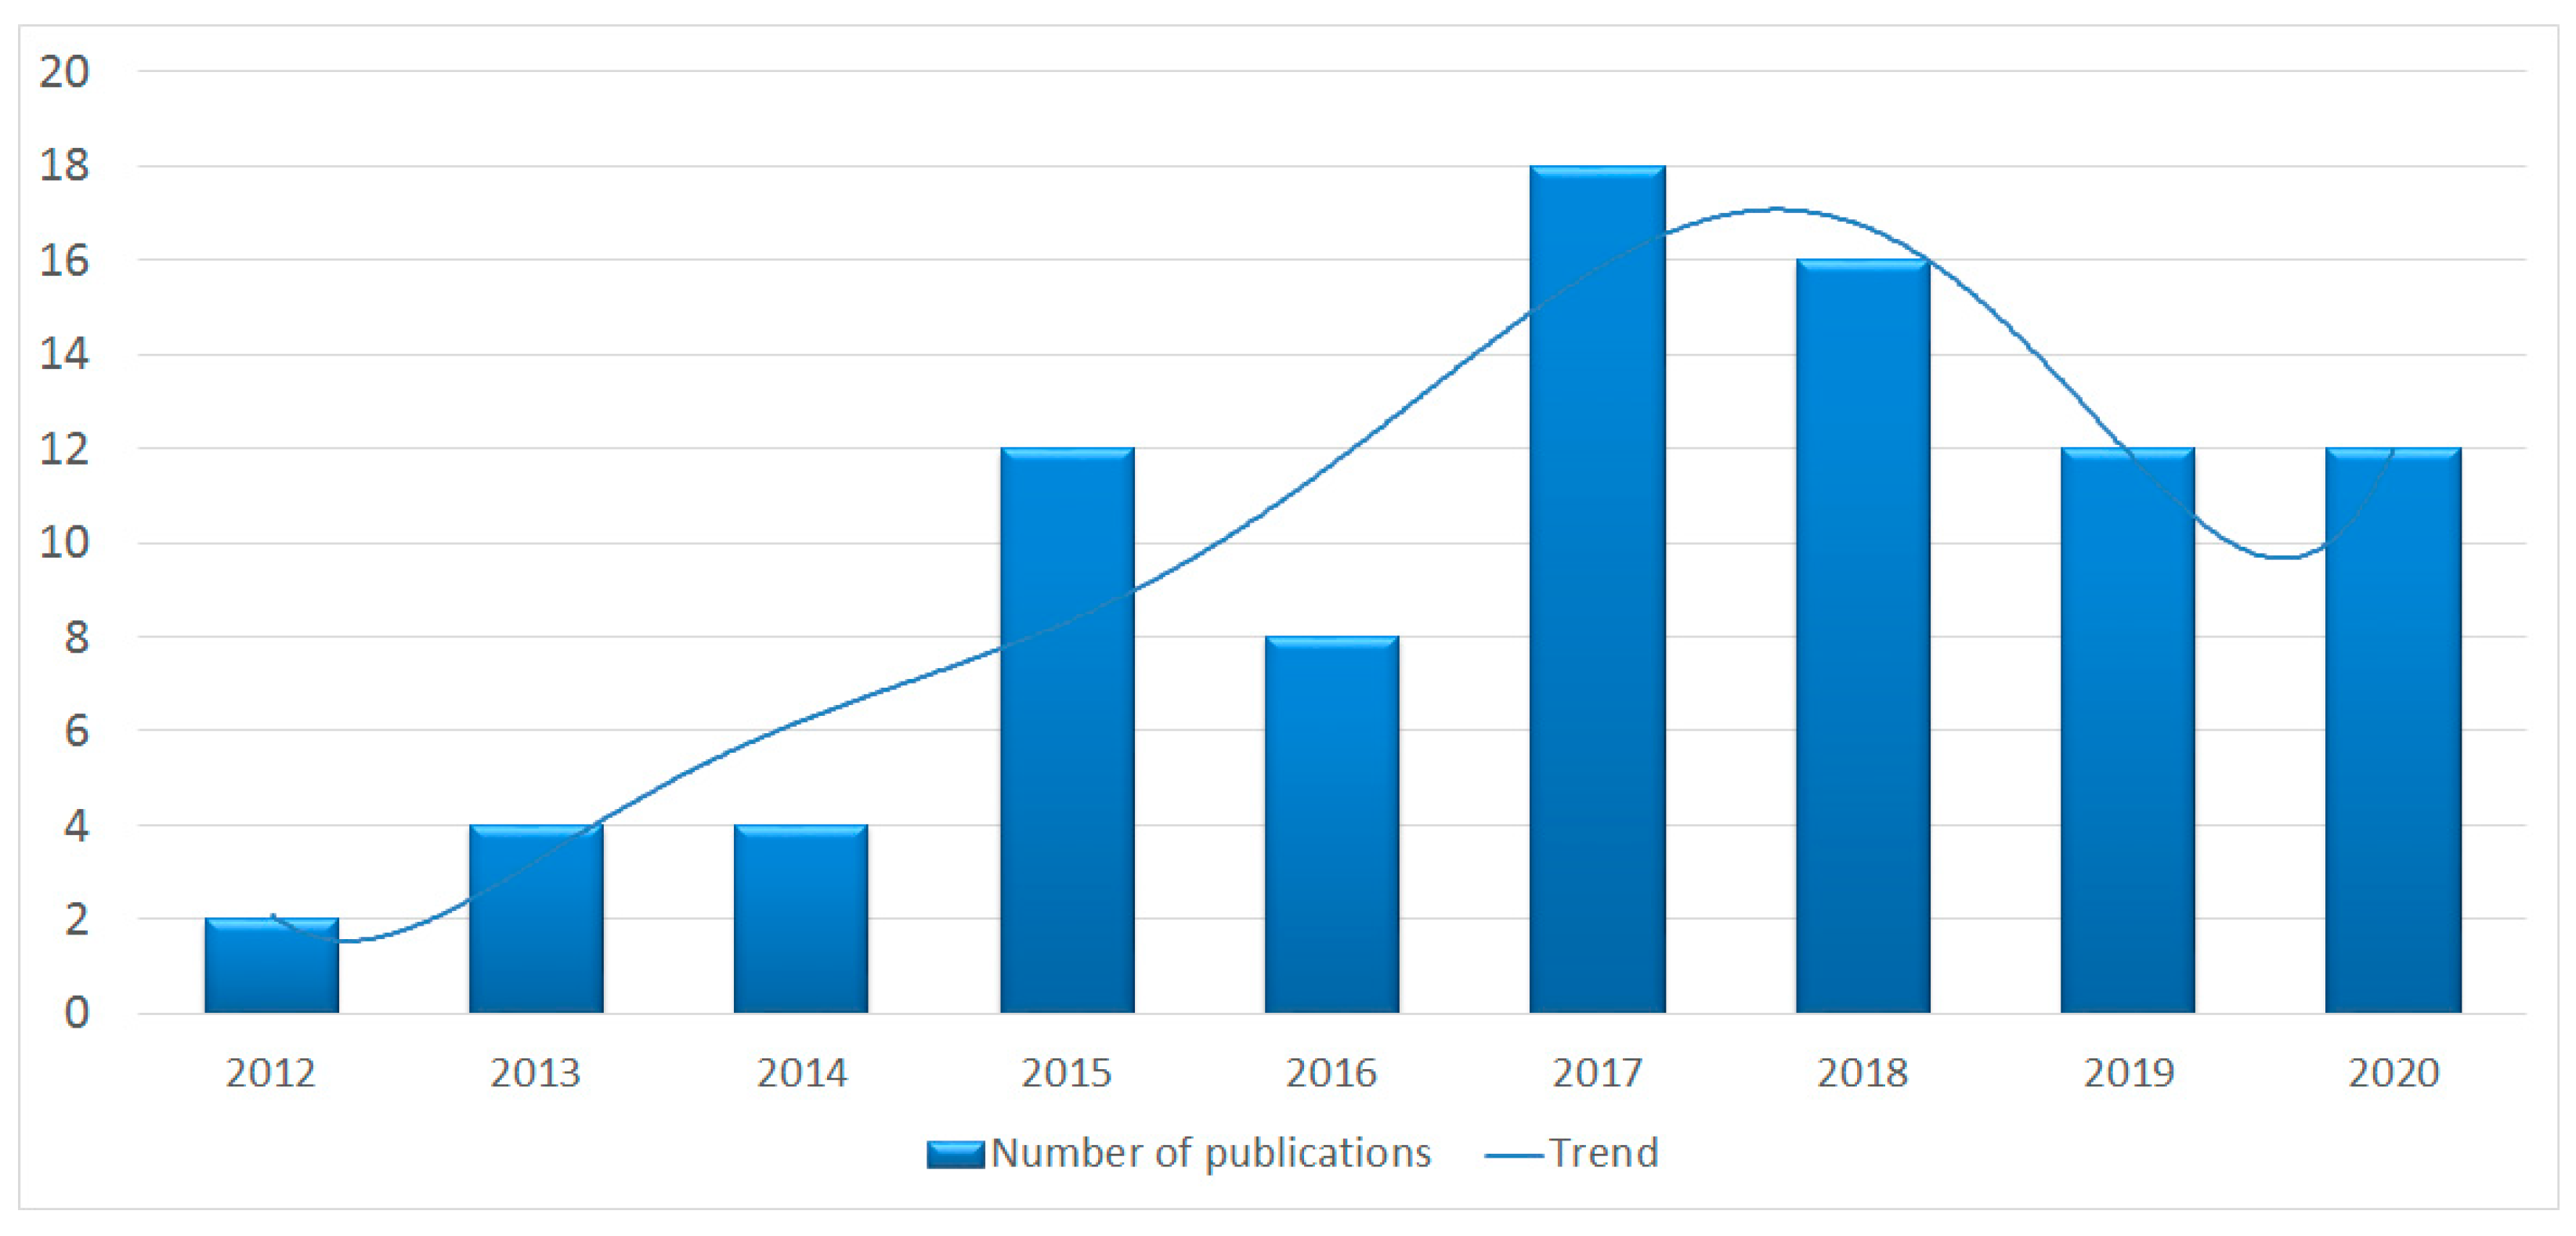
3.1.1. Number of Articles in the Selected Database and the Growth Trend
3.1.2. Concepts and Terms That Appeared in the Articles
3.1.3. Identifying Methods and Strategies of Studying CI in Policymaking
3.2. Statistical Analysis
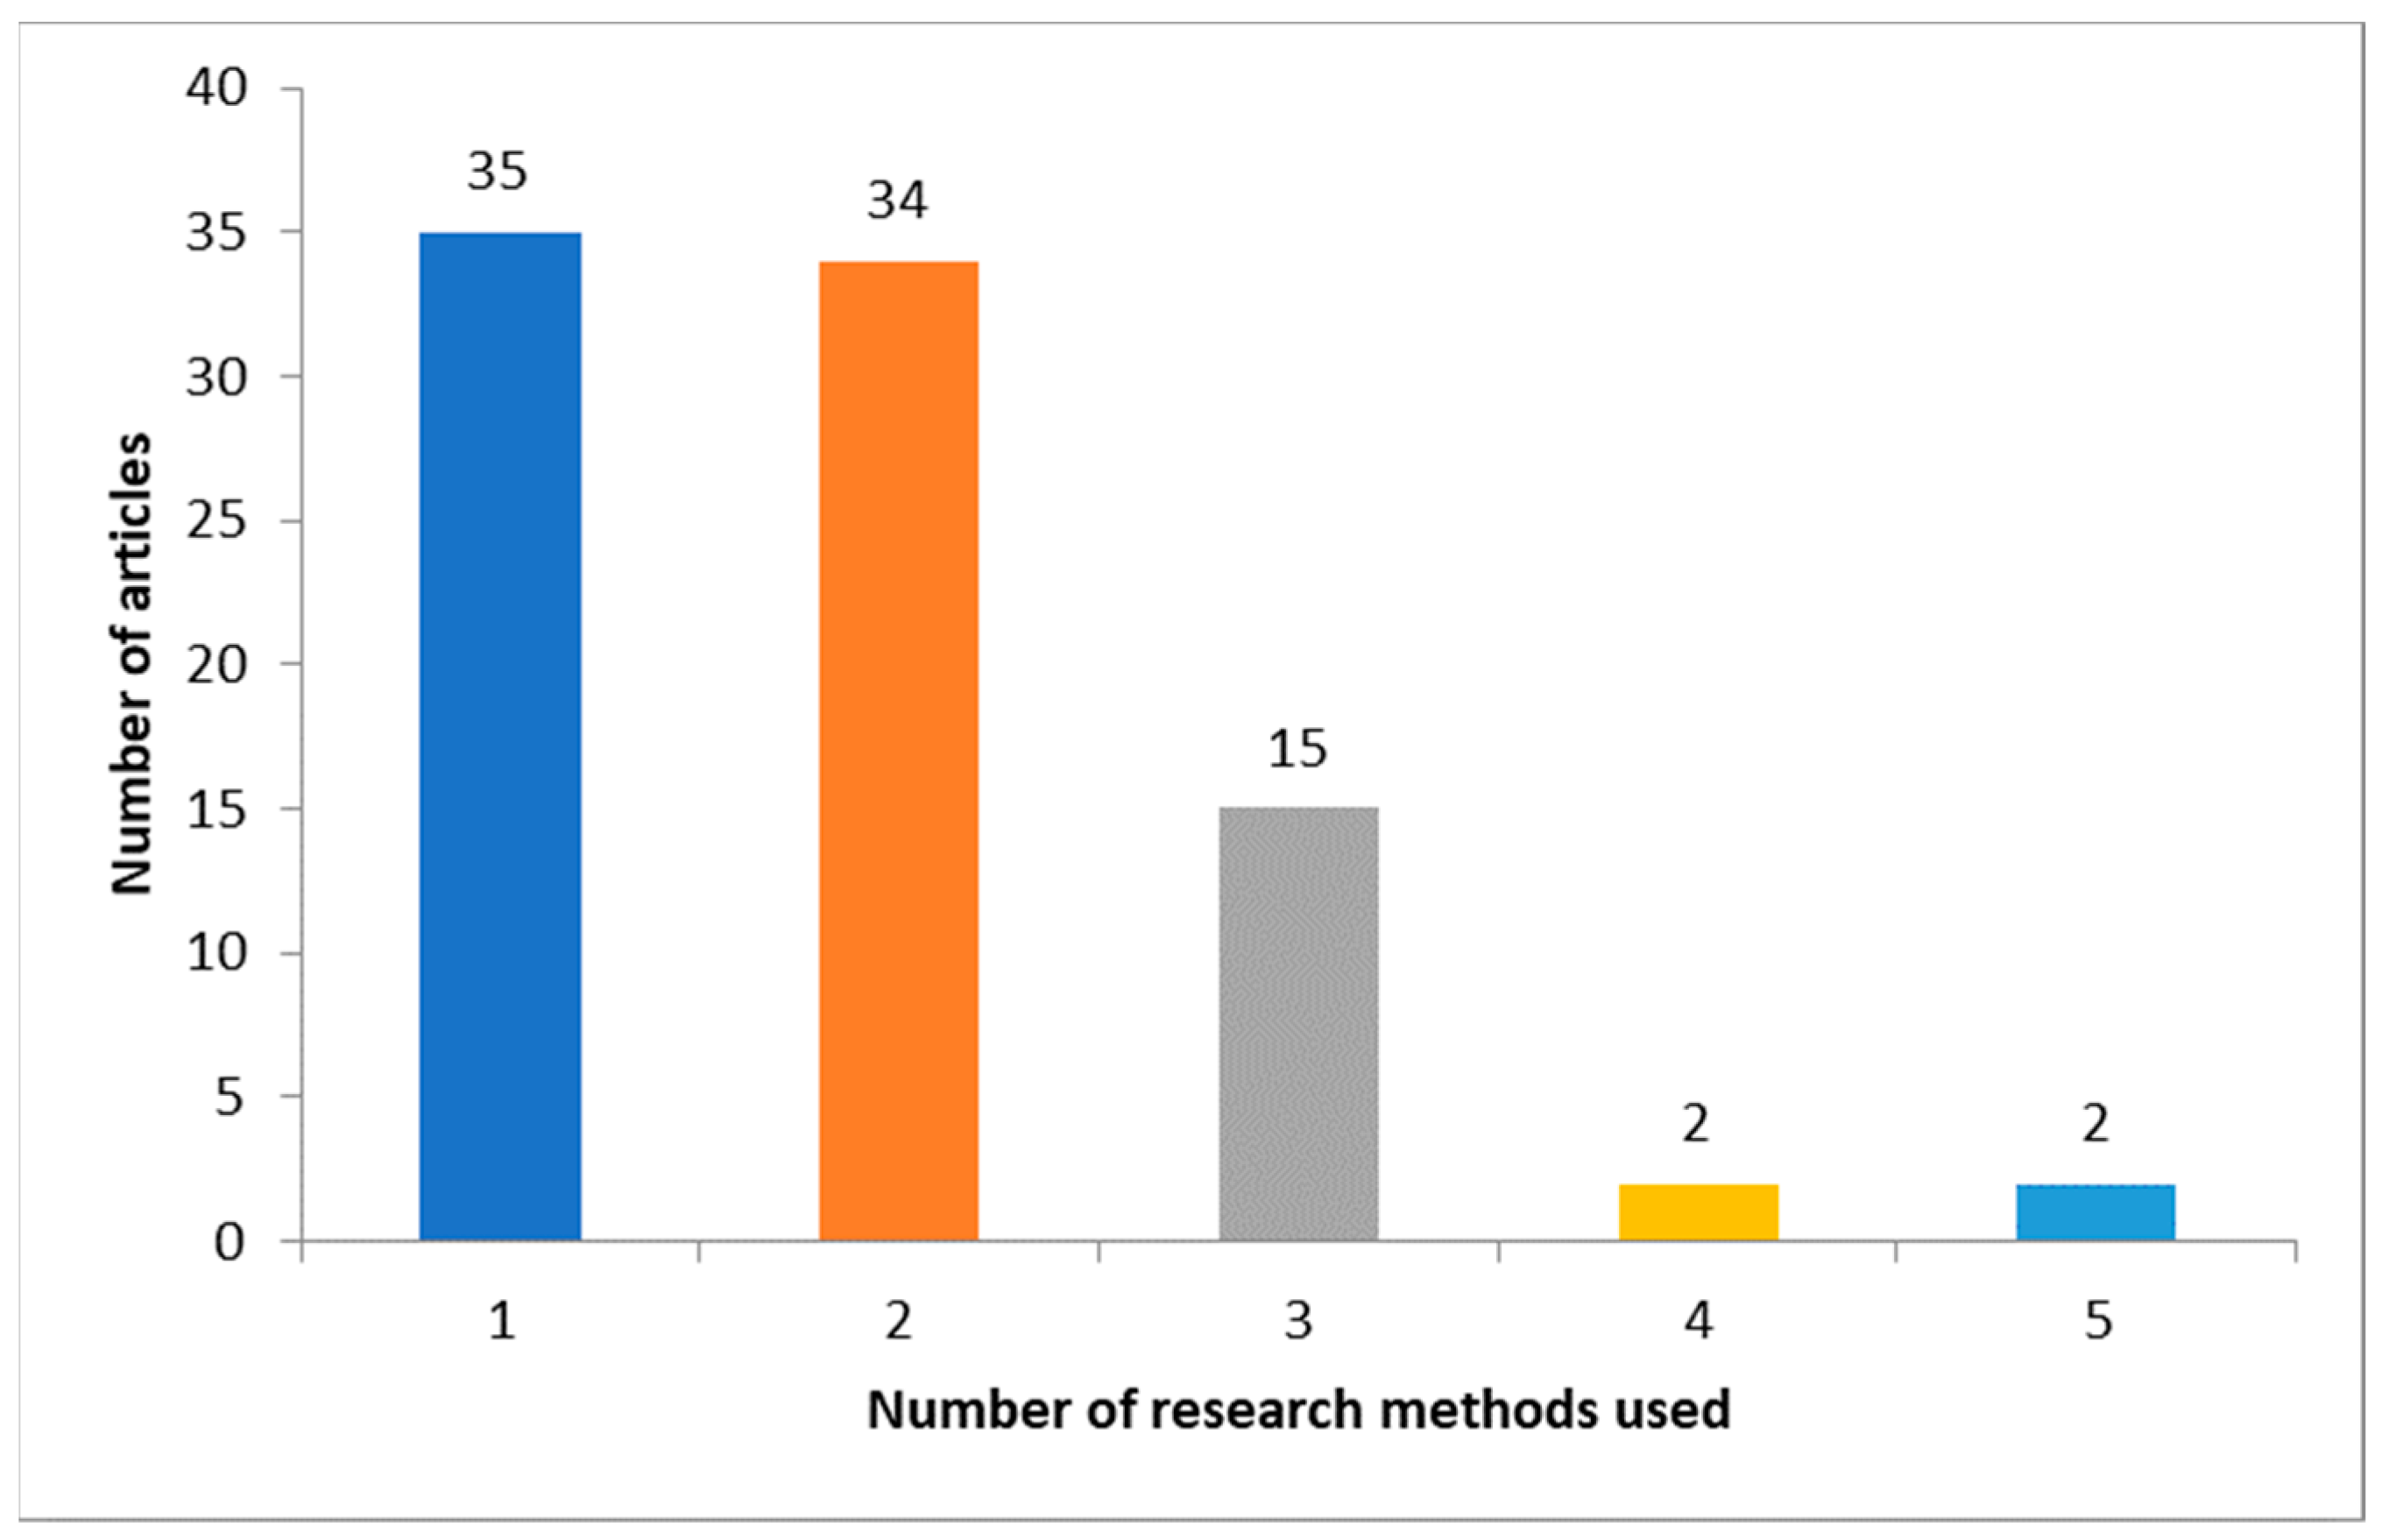
3.2.1. Number of Methods per Article
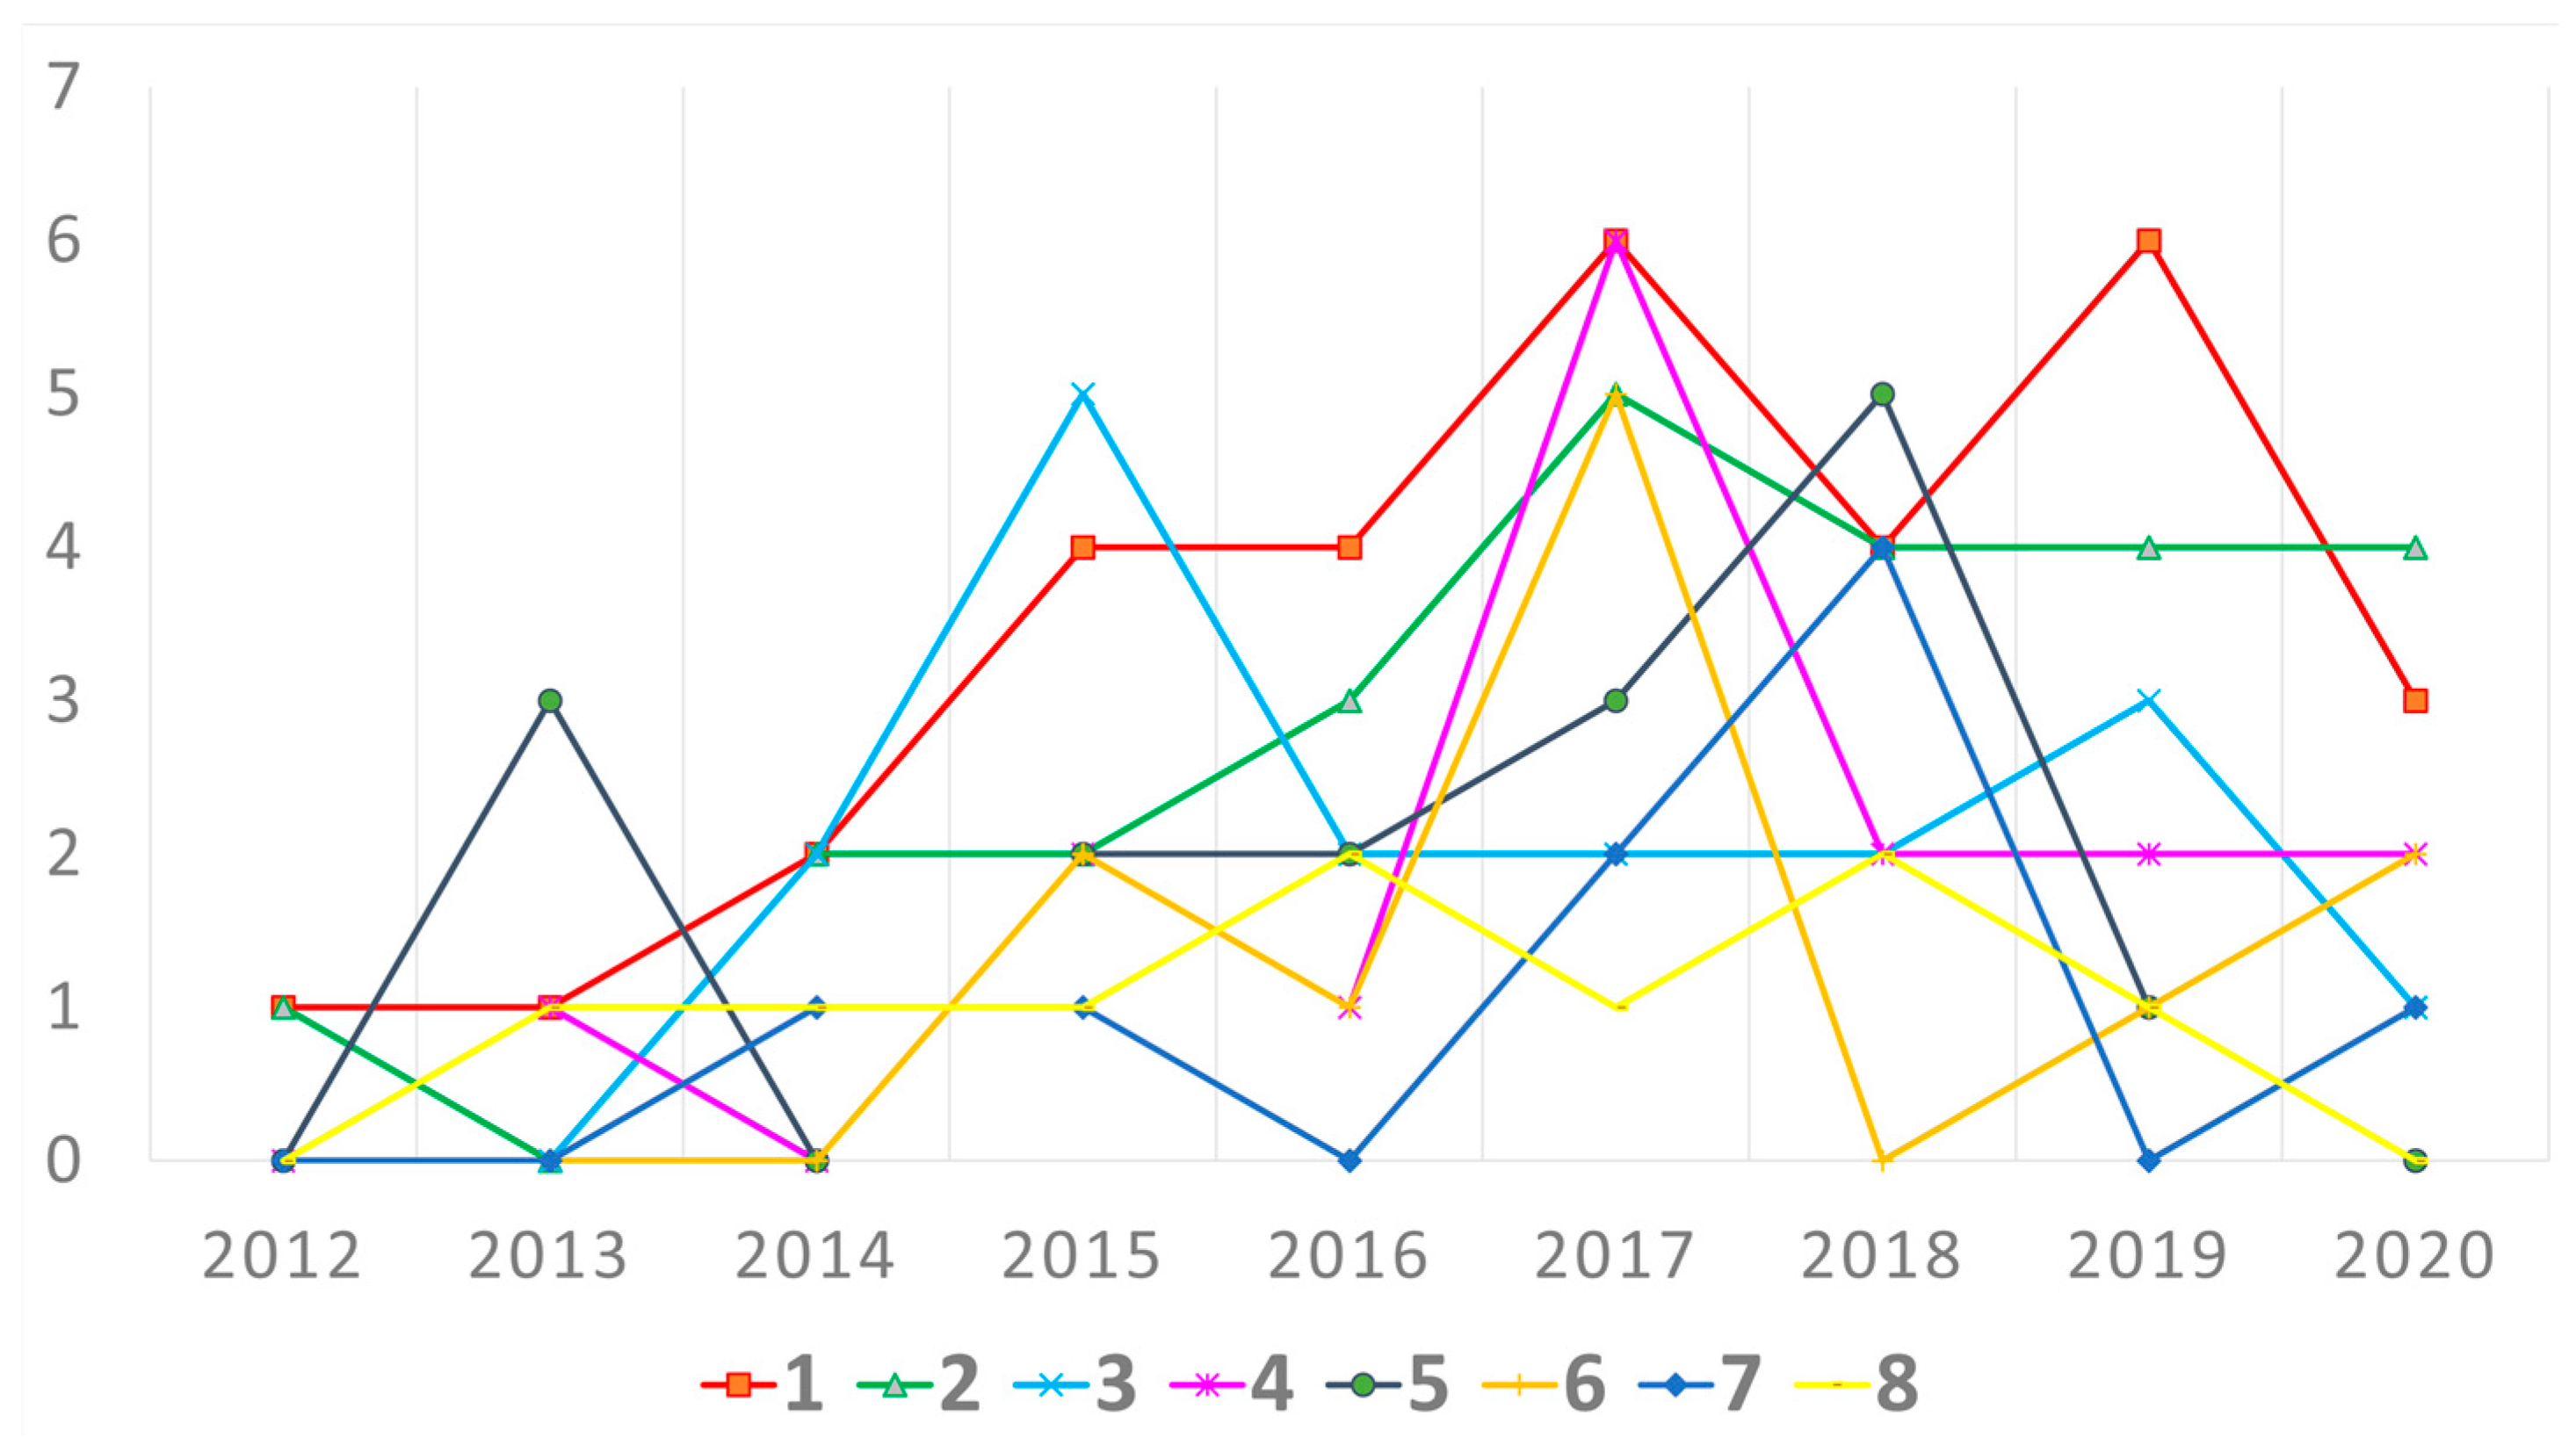
3.2.2. Changes in the Popularity of Using Particular Methods
3.2.3. Dependencies between Research Methods
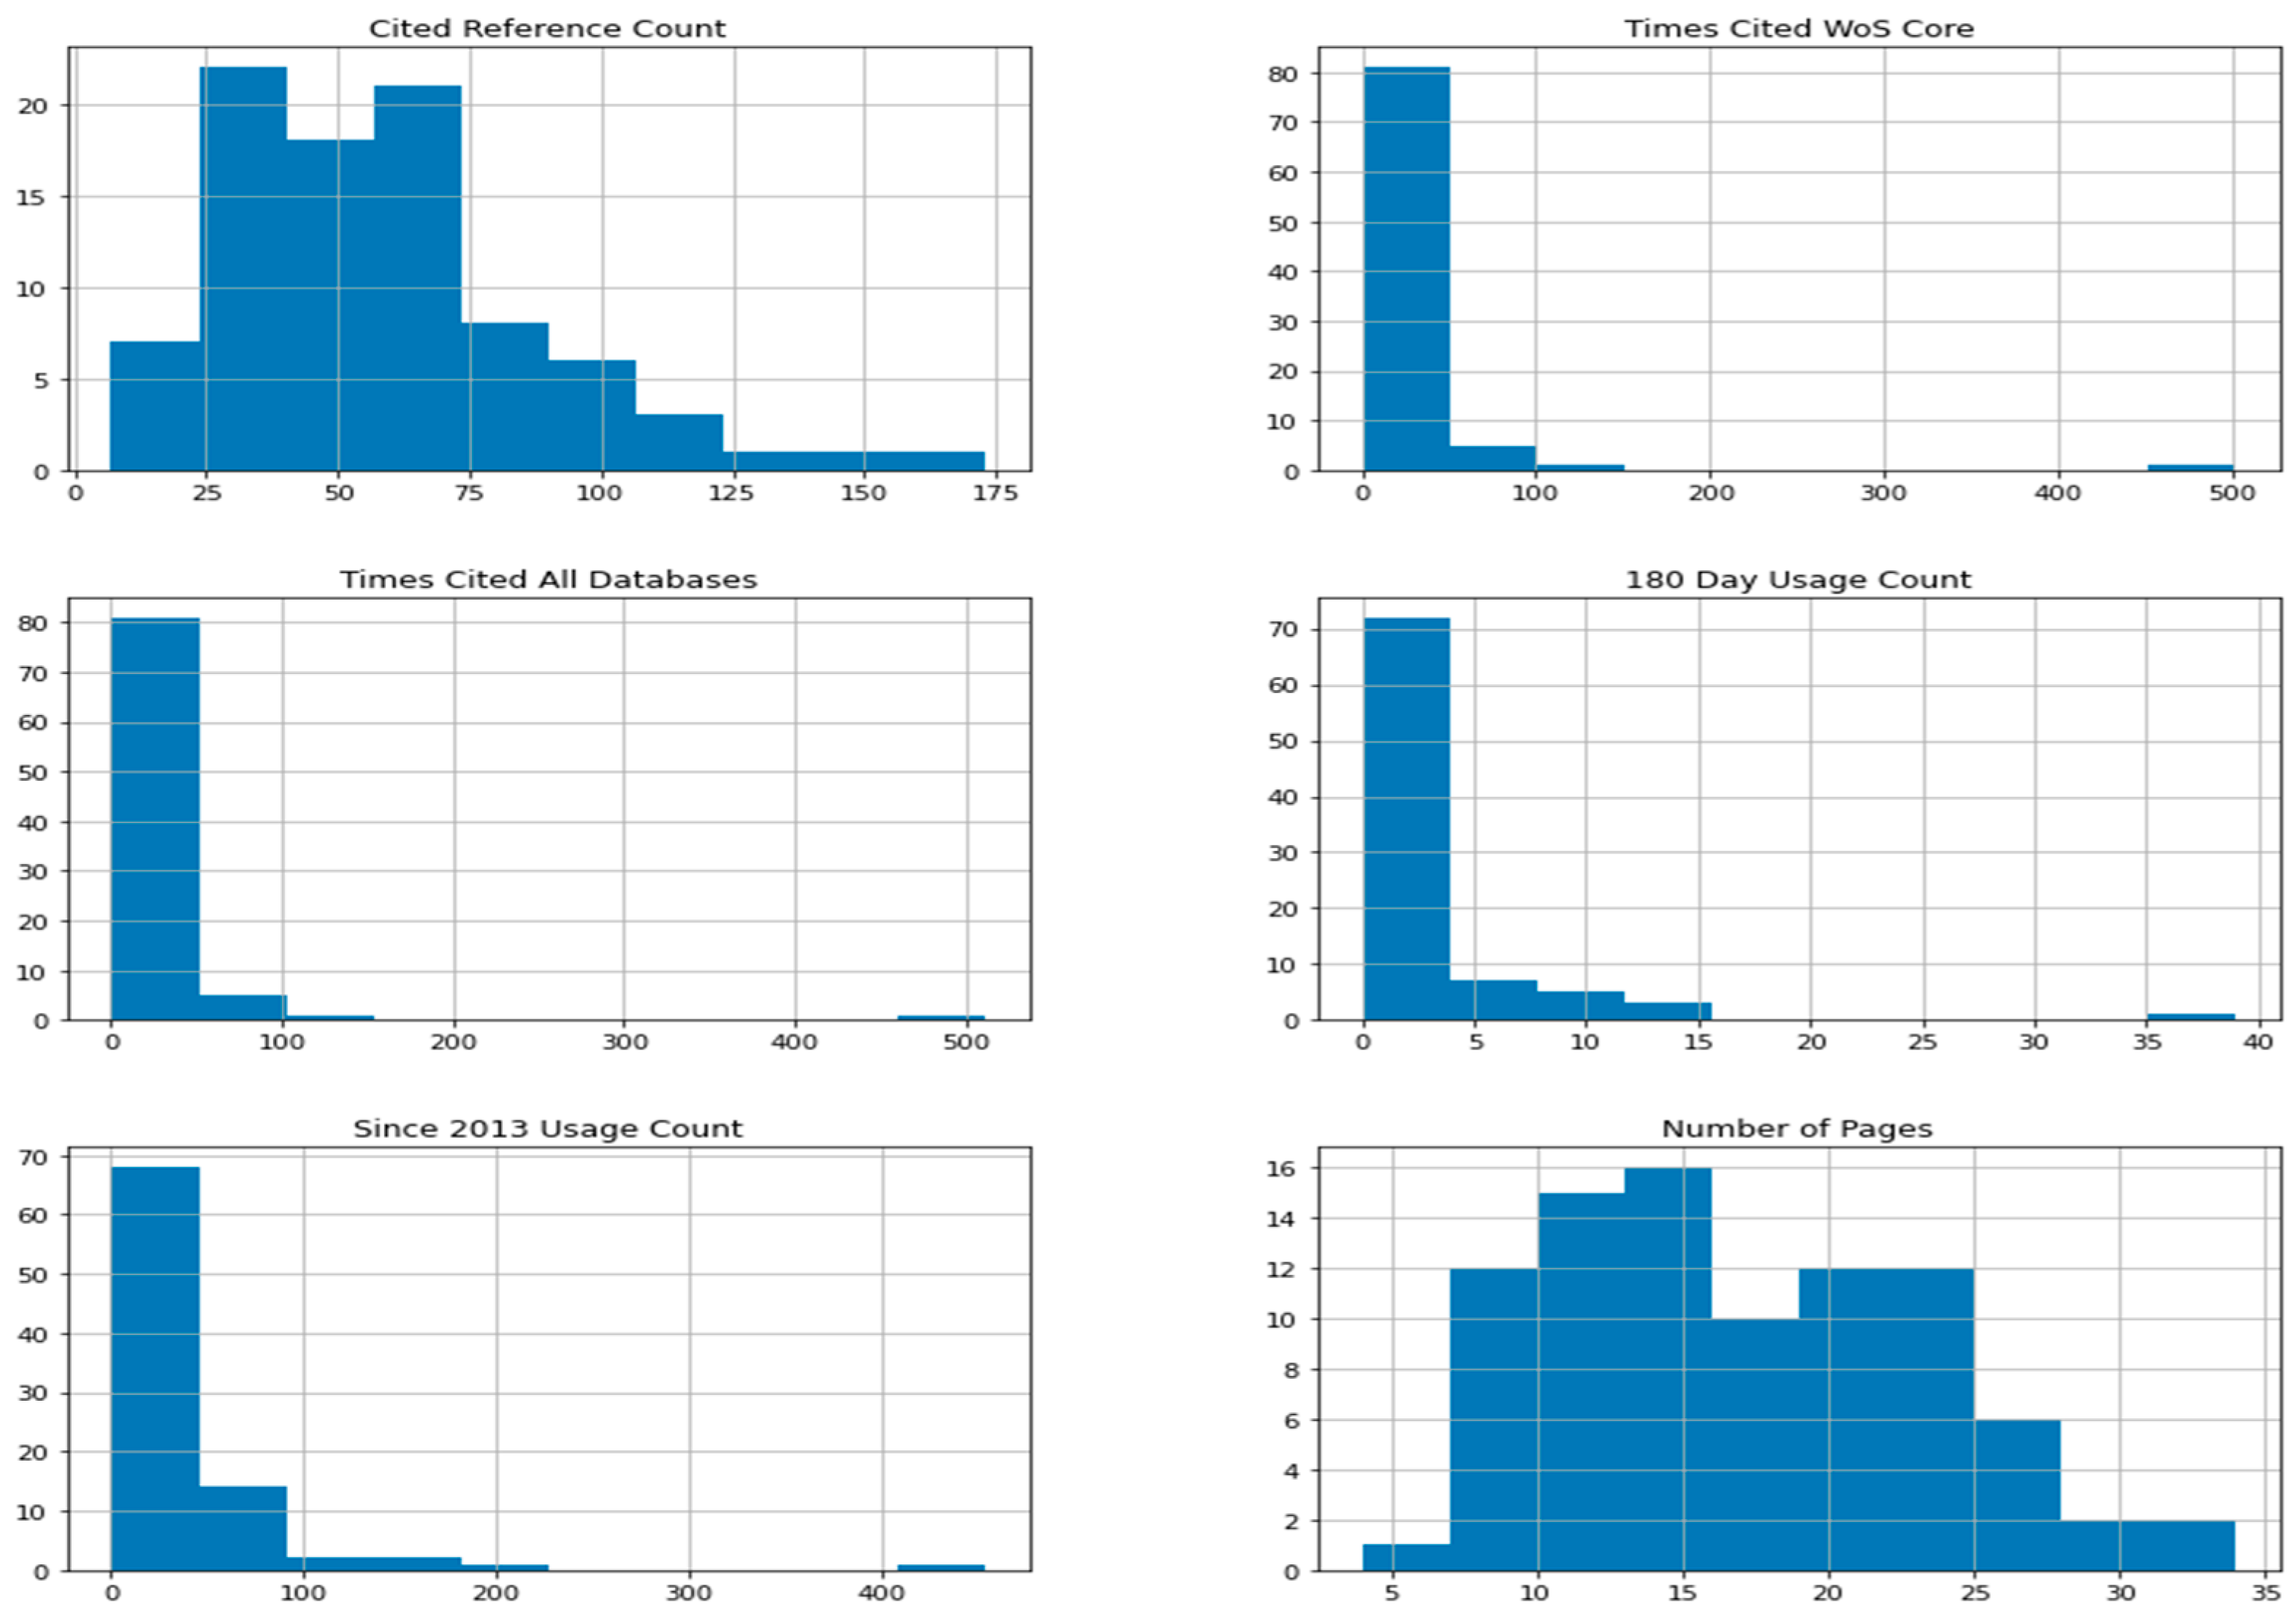
3.2.4. Dependencies between Research Methods and Other Features of the Analyzed Studies
3.3. Research Areas
3.3.1. Identification of the Research Areas of the Studies
3.3.2. Grouping the Identified Research Areas
3.3.3. Studies Published Yearly within the Research Area Groups
3.3.4. Study Methods Used within the Research Area Groups
3.4. Methods and Strategies Used in the Most Influential Works and in the Topics of Special Importance
3.4.1. Analysis of the Most Influential Studies
3.4.2. The Analysis of Topics of Special Interest
4. Discussion
5. Conclusions
Author Contributions
Funding
Institutional Review Board Statement
Informed Consent Statement
Data Availability Statement
Conflicts of Interest
Appendix A


Appendix B

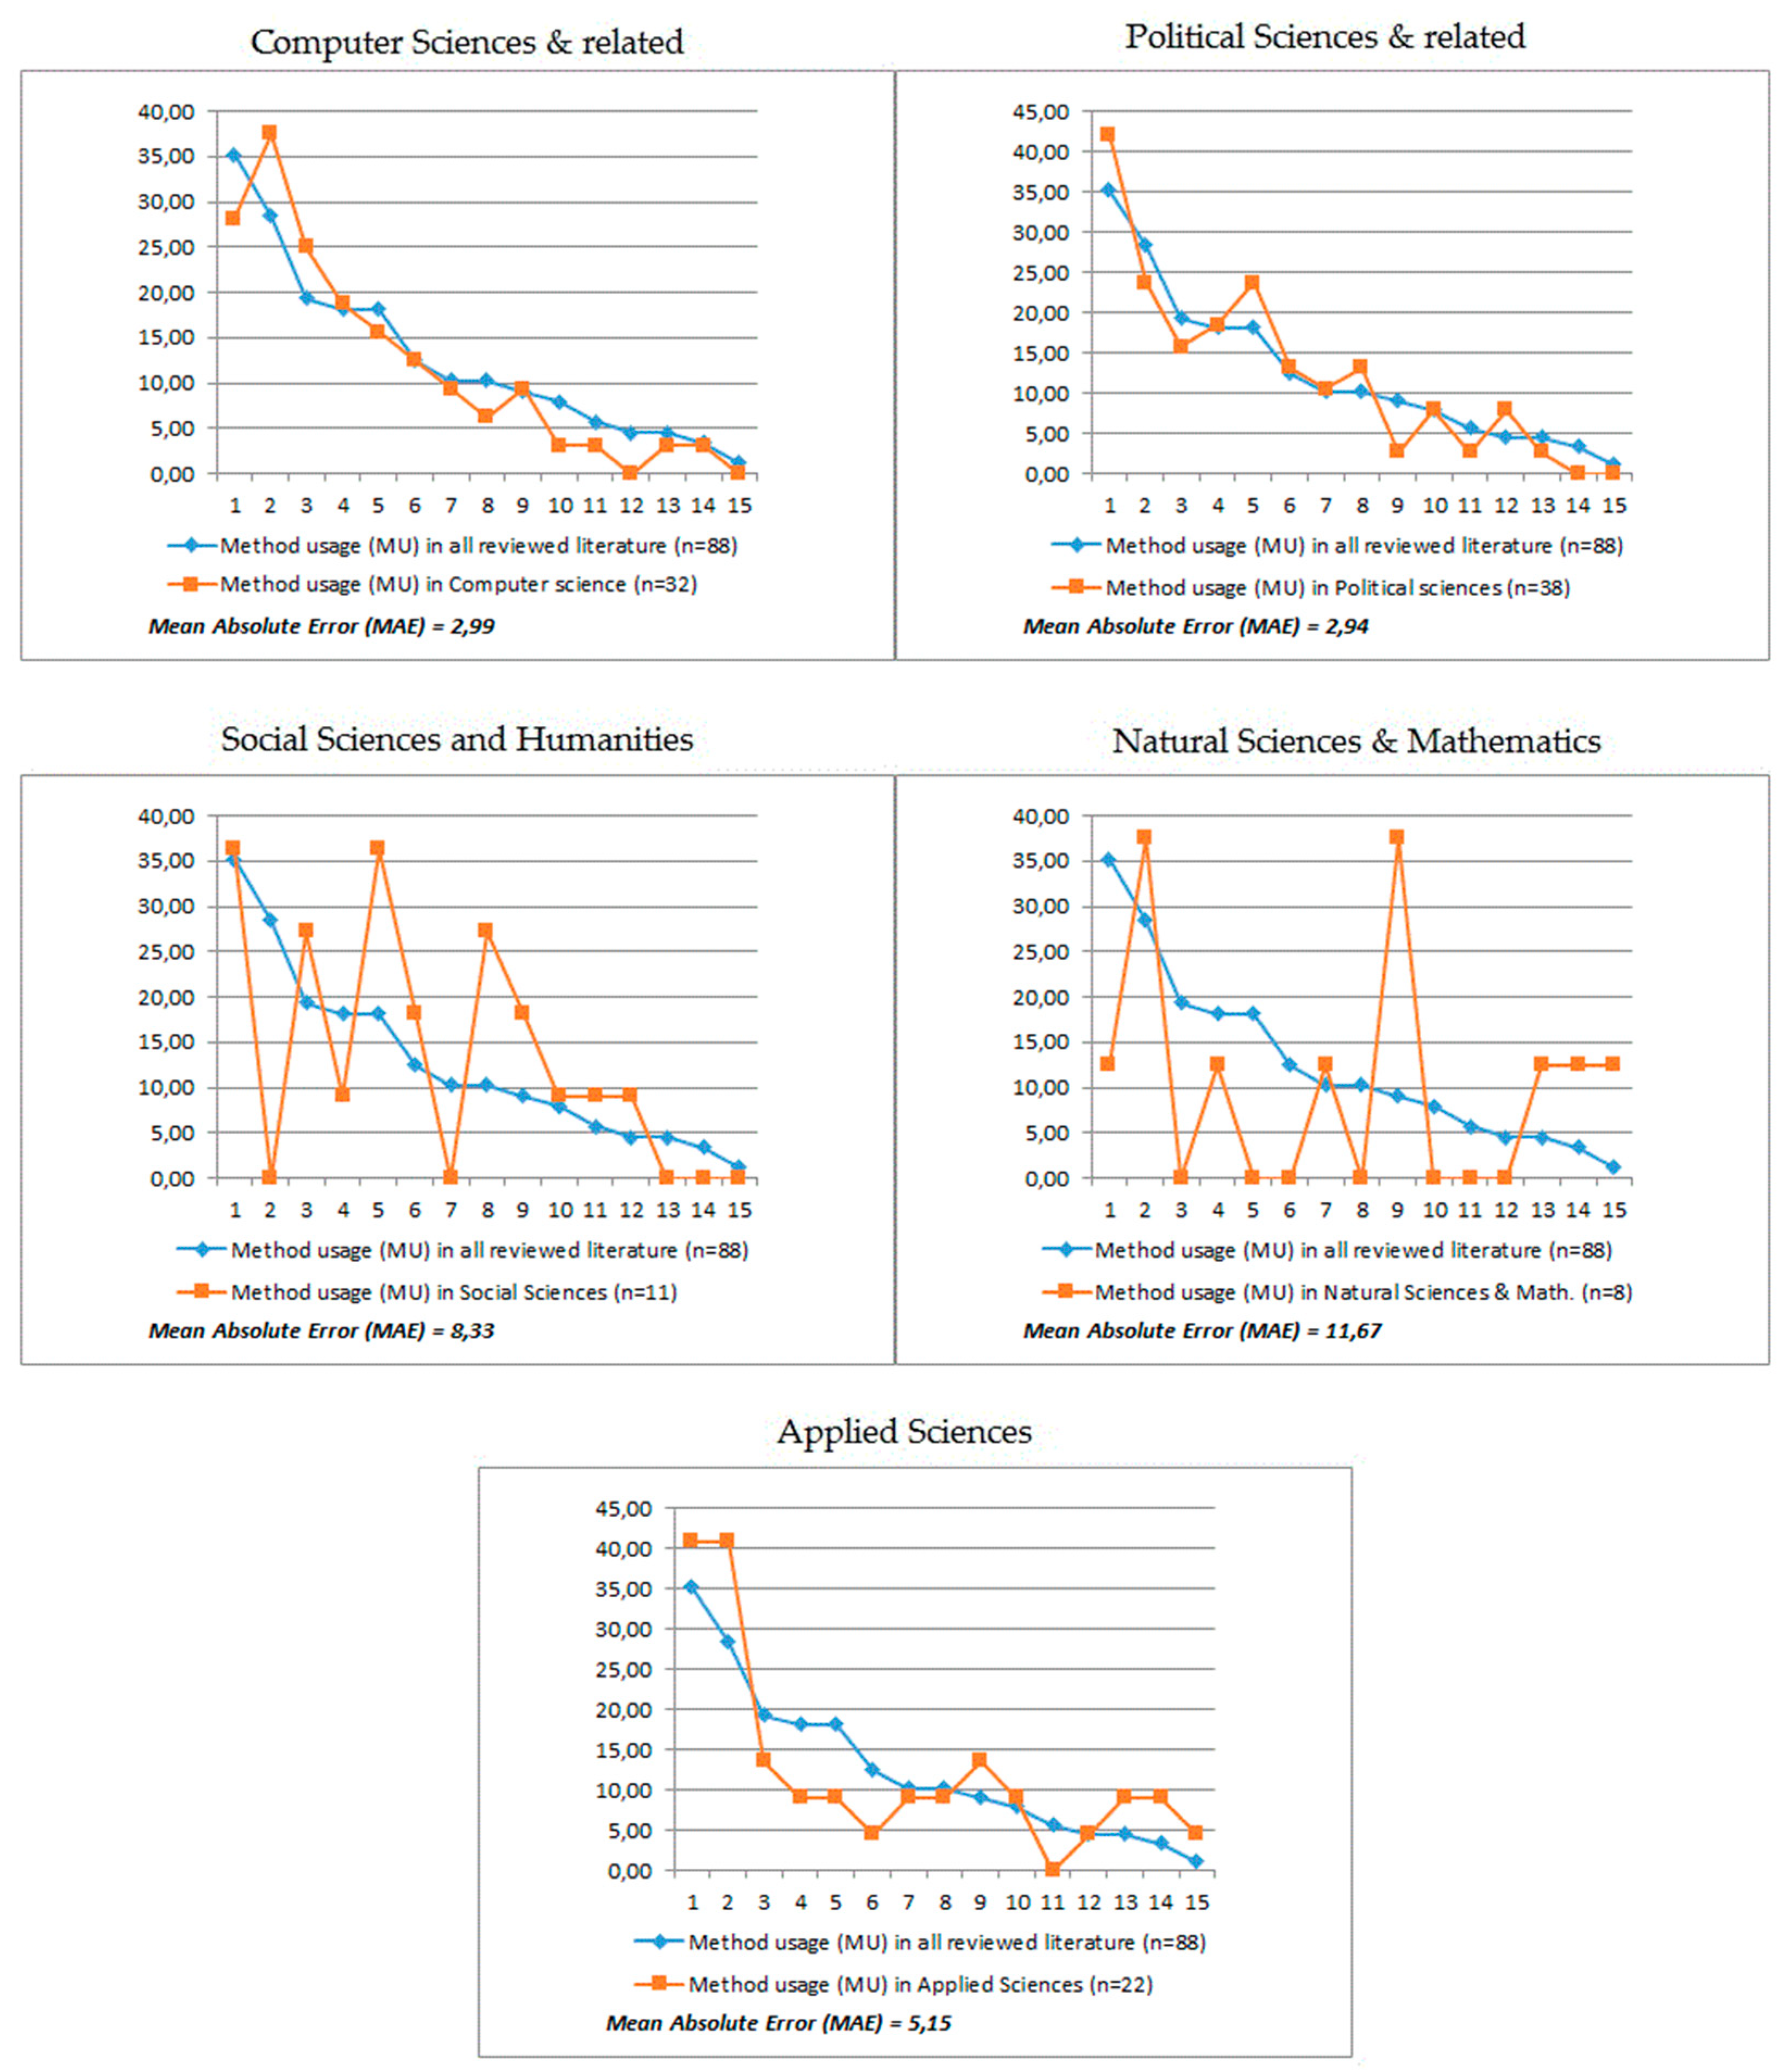
| Research Methods & Strategies (RM) | |||||||||||||||
|---|---|---|---|---|---|---|---|---|---|---|---|---|---|---|---|
| 1 | 2 | 3 | 4 | 5 | 6 | 7 | 8 | 9 | 10 | 11 | 12 | 13 | 14 | 15 | |
| All reviewed literature (n-88) | |||||||||||||||
| NoS | 31 | 25 | 17 | 16 | 16 | 11 | 9 | 9 | 8 | 7 | 5 | 4 | 4 | 3 | 1 |
| Method Usage (MU) | 35.23 | 28.41 | 19.32 | 18.18 | 18.18 | 12.50 | 10.23 | 10.23 | 9.09 | 7.95 | 5.68 | 4.55 | 4.55 | 3.41 | 1.14 |
| RAG 1: Computer Science & related (n = 32) | |||||||||||||||
| NoS | 9 | 12 | 8 | 6 | 5 | 4 | 3 | 2 | 3 | 1 | 1 | 0 | 1 | 1 | 0 |
| Method Usage (MU) | 28.13 | 37.50 | 25.00 | 18.75 | 15.63 | 12.50 | 9.38 | 6.25 | 9.38 | 3.13 | 3.13 | 0.00 | 3.13 | 3.13 | 0.00 |
| DPP | −7.10 | 9.09 | 5.68 | 0.57 | −2.56 | 0.00 | −0.85 | −3.98 | 0.28 | −4.83 | −2.56 | −4.55 | −1.42 | −0.28 | −1.14 |
| Mean Absolute Error (MAE) | 2.99 | ||||||||||||||
| RAG 2: Political Sciences & related (n = 38) | |||||||||||||||
| NoS | 16 | 9 | 6 | 7 | 9 | 5 | 4 | 5 | 1 | 3 | 1 | 3 | 1 | 0 | 0 |
| Method Usage (MU) | 42.11 | 23.68 | 15.79 | 18.42 | 23.68 | 13.16 | 10.53 | 13.16 | 2.63 | 7.89 | 2.63 | 7.89 | 2.63 | 0.00 | 0.00 |
| DPP | 6.88 | −4.72 | −3.53 | 0.24 | 5.50 | 0.66 | 0.30 | 2.93 | −6.46 | −0.06 | −3.05 | 3.35 | −1.91 | −3.41 | −1.14 |
| Mean Absolute Error (MAE) | 2.94 | ||||||||||||||
| RAG 3: Social Sciences & Humanities (n = 11) | |||||||||||||||
| NoS | 4 | 0 | 3 | 1 | 4 | 2 | 0 | 3 | 2 | 1 | 1 | 1 | 0 | 0 | 0 |
| Method Usage (MU) | 36.36 | 0.00 | 27.27 | 9.09 | 36.36 | 18.18 | 0.00 | 27.27 | 18.18 | 9.09 | 9.09 | 9.09 | 0.00 | 0.00 | 0.00 |
| DPP | 1.14 | −28.41 | 7.95 | −9.09 | 18.18 | 5.68 | −10.23 | 17.05 | 9.09 | 1.14 | 3.41 | 4.55 | −4.55 | −3.41 | −1.14 |
| Mean Absolute Error (MAE) | 8.33 | ||||||||||||||
| RAG 4: Natural Sciences & Mathematics (n = 8) | |||||||||||||||
| NoS | 1 | 3 | 0 | 1 | 0 | 0 | 1 | 0 | 3 | 0 | 0 | 0 | 1 | 1 | 1 |
| Method Usage (MU) | 12.50 | 37.50 | 0.00 | 12.50 | 0.00 | 0.00 | 12.50 | 0.00 | 37.50 | 0.00 | 0.00 | 0.00 | 12.50 | 12.50 | 12.50 |
| DPP | −22.73 | 9.09 | −19.32 | −5.68 | −18.18 | −12.50 | 2.27 | −10.23 | 28.41 | −7.95 | −5.68 | −4.55 | 7.95 | 9.09 | 11.36 |
| Mean Absolute Error (MAE) | 11.67 | ||||||||||||||
| RAG 5: Applied Sciences (n = 22) | |||||||||||||||
| NoS | 9 | 9 | 3 | 2 | 2 | 1 | 2 | 2 | 3 | 2 | 0 | 1 | 2 | 2 | 1 |
| Method Usage (MU) | 40.91 | 40.91 | 13.64 | 9.09 | 9.09 | 4.55 | 9.09 | 9.09 | 13.64 | 9.09 | 0.00 | 4.55 | 9.09 | 9.09 | 4.55 |
| DPP | 5.68 | 12.50 | −5.68 | −9.09 | −9.09 | −7.95 | −1.14 | −1.14 | 4.55 | 1.14 | −5.68 | 0.00 | 4.55 | 5.68 | 3.41 |
| Mean Absolute Error (MAE) | 5.15 | ||||||||||||||
| Research Methods & Strategies (RM) | |||||||||||||||
|---|---|---|---|---|---|---|---|---|---|---|---|---|---|---|---|
| 1 | 2 | 3 | 4 | 5 | 6 | 7 | 8 | 9 | 10 | 11 | 12 | 13 | 14 | 15 | |
| All reviewed literature (n-88) | |||||||||||||||
| NoS | 31 | 25 | 17 | 16 | 16 | 11 | 9 | 9 | 8 | 7 | 5 | 4 | 4 | 3 | 1 |
| Method Usage (MU) | 35.23 | 28.41 | 19.32 | 18.18 | 18.18 | 12.50 | 10.23 | 10.23 | 9.09 | 7.95 | 5.68 | 4.55 | 4.55 | 3.41 | 1.14 |
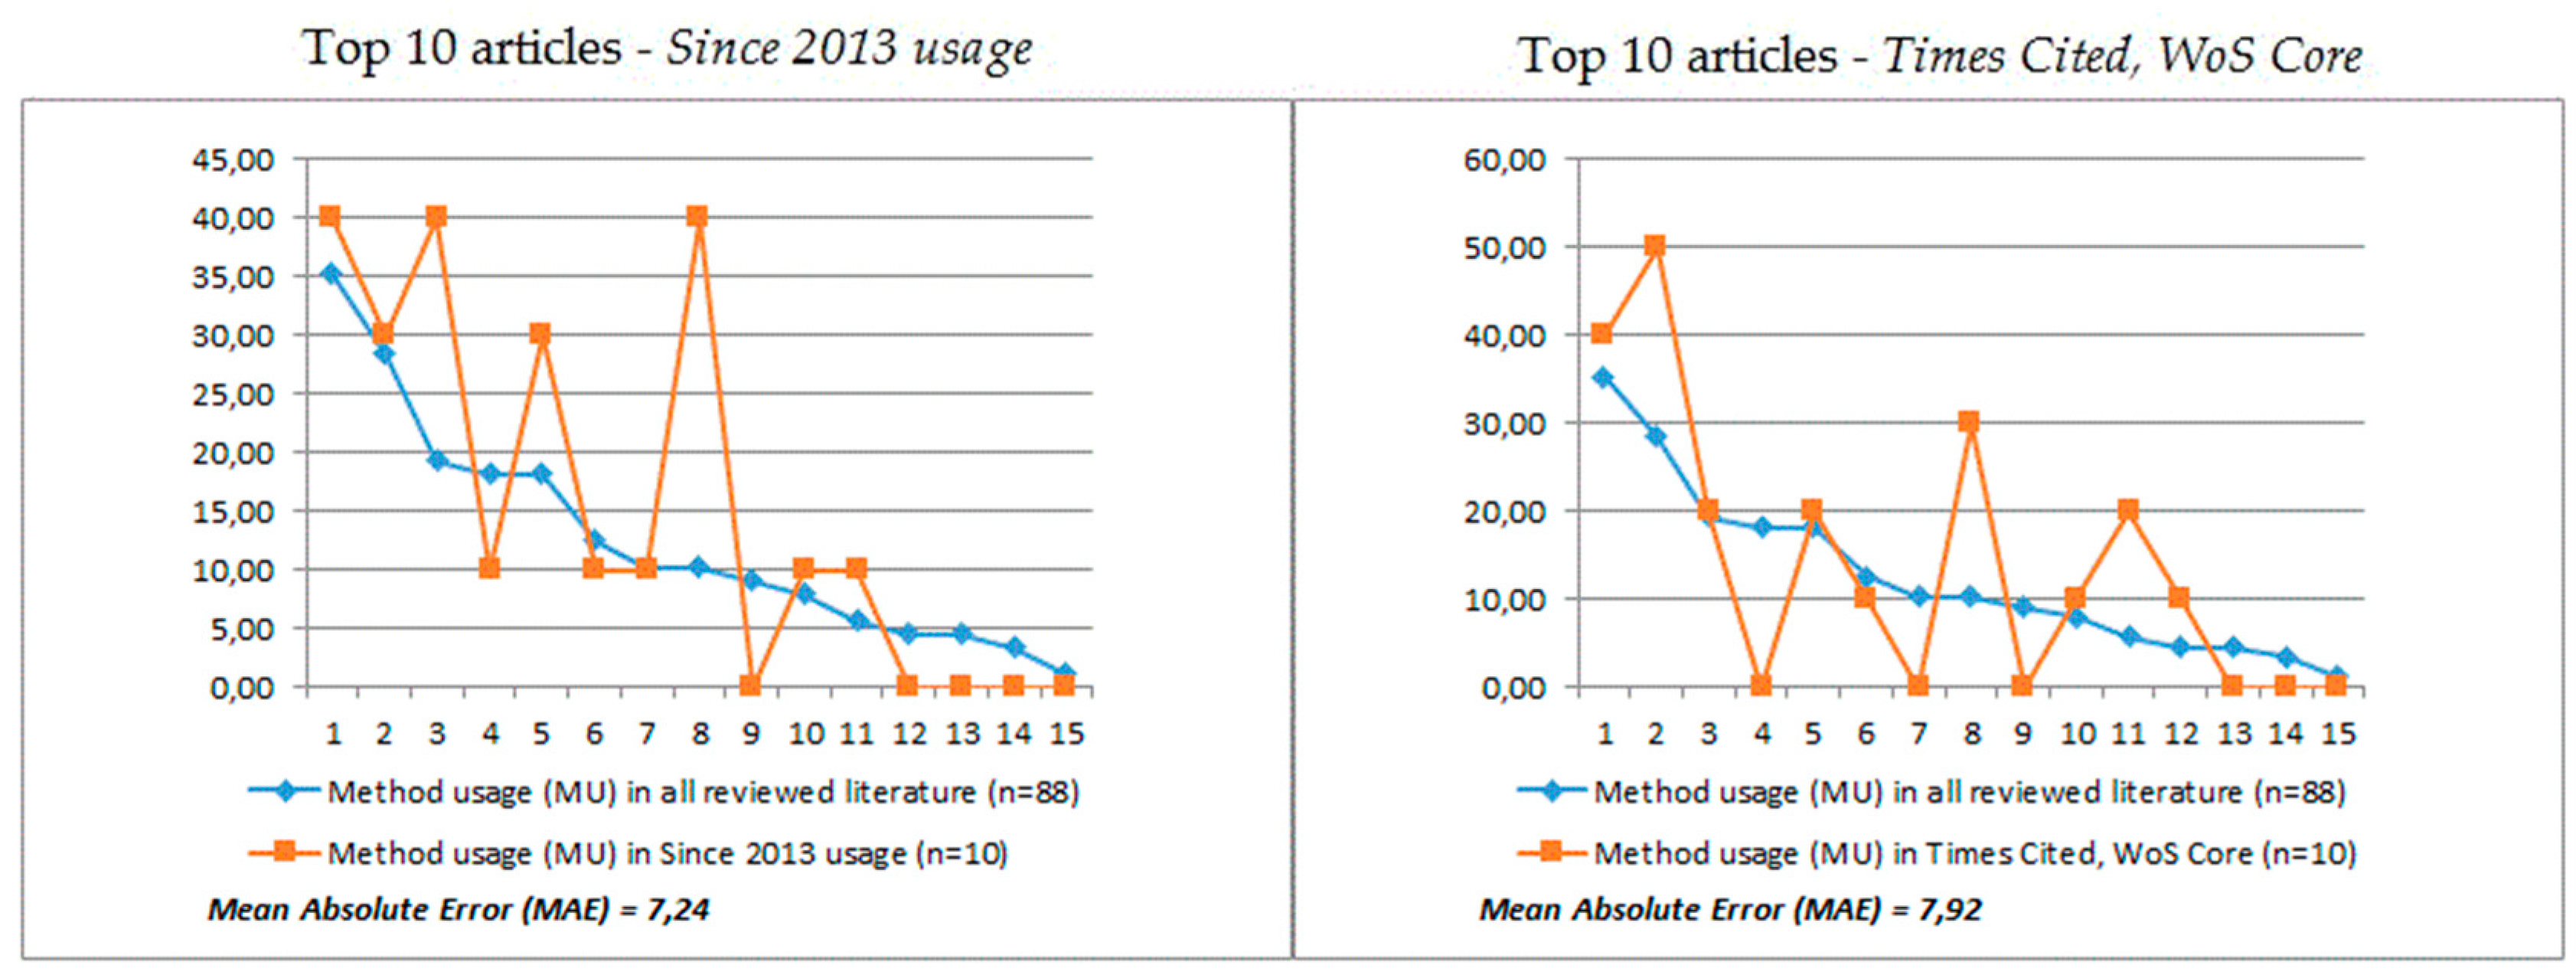
| Top 10 articles, according to usage criterion—Since 2013 usage (n = 10) | |||||||||||||||
| NoS | 4 | 3 | 4 | 1 | 3 | 1 | 1 | 4 | 0 | 1 | 1 | 0 | 0 | 0 | 0 |
| Method Usage (MU) | 40.00 | 30.00 | 40.00 | 10.00 | 30.00 | 10.00 | 10.00 | 40.00 | 0.00 | 10.00 | 10.00 | 0.00 | 0.00 | 0.00 | 0.00 |
| DPP | 4.77 | 1.59 | 20.68 | −8.18 | 11.82 | −2.50 | −0.23 | 29.77 | −9.09 | 2.05 | 4.32 | −4.55 | −4.55 | −3.41 | −1.14 |
| Mean Absolute Error (MAE) | 7.24 | ||||||||||||||
| Top 10 articles, according to citation criterion—Times Cited, WoS Core (n = 10) | |||||||||||||||
| NoS | 4 | 5 | 2 | 0 | 2 | 1 | 0 | 3 | 0 | 1 | 2 | 1 | 0 | 0 | 0 |
| Method Usage (MU) | 40.00 | 50.00 | 20.00 | 0.00 | 20.00 | 10.00 | 0.00 | 30.00 | 0.00 | 10.00 | 20.00 | 10.00 | 0.00 | 0.00 | 0.00 |
| DPP | 4.77 | 21.59 | 0.68 | −18.18 | 1.82 | −2.50 | −10.23 | 19.77 | −9.09 | 2.05 | 14.32 | 5.45 | −4.55 | −3.41 | −1.14 |
| Mean Absolute Error (MAE) | 7.97 | ||||||||||||||
| Research Methods & Strategies (RM) | |||||||||||||||
|---|---|---|---|---|---|---|---|---|---|---|---|---|---|---|---|
| 1 | 2 | 3 | 4 | 5 | 6 | 7 | 8 | 9 | 10 | 11 | 12 | 13 | 14 | 15 | |
| All reviewed literature (n-88) | |||||||||||||||
| NoS | 31 | 25 | 17 | 16 | 16 | 11 | 9 | 9 | 8 | 7 | 5 | 4 | 4 | 3 | 1 |
| Method Usage (MU) | 35.23 | 28.41 | 19.32 | 18.18 | 18.18 | 12.50 | 10.23 | 10.23 | 9.09 | 7.95 | 5.68 | 4.55 | 4.55 | 3.41 | 1.14 |
| Citizenship subgroup (n = 47) | |||||||||||||||
| NoS | 16 | 10 | 13 | 10 | 10 | 11 | 3 | 6 | 3 | 2 | 3 | 2 | 3 | 3 | 0 |
| Method Usage (MU) | 34.04 | 21.28 | 27.66 | 21.28 | 21.28 | 23.40 | 6.38 | 12.77 | 6.38 | 4.26 | 6.38 | 4.26 | 6.38 | 6.38 | 0.00 |
| DPP | −1.18 | −7.13 | 8.34 | 3.09 | 3.09 | 10.90 | −3.84 | 2.54 | −2.71 | −3.70 | 0.70 | −0.29 | 1.84 | 2.97 | −1.14 |
| Mean Absolute Error (MAE) | 3.57 | ||||||||||||||
| Local governance & urban development subgroup (n = 30) | |||||||||||||||
| NoS | 16 | 8 | 7 | 7 | 7 | 4 | 3 | 3 | 1 | 1 | 2 | 2 | 3 | 2 | 0 |
| Method Usage (MU) | 53.33 | 26.67 | 23.33 | 23.33 | 23.33 | 13.33 | 10.00 | 10.00 | 3.33 | 3.33 | 6.67 | 6.67 | 10.00 | 6.67 | 0.00 |
| DPP | 18.11 | −1.74 | 4.02 | 5.15 | 5.15 | 0.83 | −0.23 | −0.23 | −5.76 | −4.62 | 0.98 | 2.12 | 5.45 | 3.26 | −1.14 |
| Mean Absolute Error (MAE) | 3.92 | ||||||||||||||
| Communities subgroup (n = 14) | |||||||||||||||
| NoS | 4 | 7 | 4 | 3 | 2 | 1 | 1 | 2 | 0 | 1 | 0 | 0 | 1 | 1 | 0 |
| Method Usage (MU) | 28.57 | 50.00 | 28.57 | 21.43 | 14.29 | 7.14 | 7.14 | 14.29 | 0.00 | 7.14 | 0.00 | 0.00 | 7.14 | 7.14 | 0.00 |
| DPP | −6.66 | 21.59 | 9.25 | 3.25 | −3.90 | −5.36 | −3.08 | 4.06 | −9.09 | −0.81 | −5.68 | −4.55 | 2.60 | 3.73 | −1.14 |
| Mean Absolute Error (MAE) | 5.65 | ||||||||||||||
| Deliberation subgroup (n = 9) | |||||||||||||||
| NoS | 2 | 2 | 3 | 1 | 2 | 1 | 1 | 0 | 1 | 0 | 0 | 0 | 0 | 0 | 1 |
| Method Usage (MU) | 22.22 | 22.22 | 33.33 | 11.11 | 22.22 | 11.11 | 11.11 | 0.00 | 11.11 | 0.00 | 0.00 | 0.00 | 0.00 | 0.00 | 11.11 |
| DPP | −13.01 | −6.19 | 14.02 | −7.07 | 4.04 | −1.39 | 0.88 | −10.23 | 2.02 | −7.95 | −5.68 | −4.55 | −4.55 | −3.41 | 9.97 |
| Mean Absolute Error (MAE) | 6.33 | ||||||||||||||
Appendix C
| Authors (Year) | Title | Research Area Group | Research Method | Since 2013 Usage | 180 Day Usage Count | Times Cited, WoS Core | Times Cited/Year |
|---|---|---|---|---|---|---|---|
| Linders, D. (2012) | From e-government to we-government: Defining a typology for citizen coproduction in the age of social media | Computer Science & related | 2, 10 | 454 | 39 | 502 | 55.78 |
| Mergel, I.; Desouza, K.C. (2013) | Implementing Open Innovation in the Public Sector: The Case of Challenge.gov | Political Sciences & related | 5, 8 | 192 | 9 | 128 | 16 |
| Diaz-Diaz, R.; Perez-Gonzalez, D. (2016) | Implementation of Social Media Concepts for e-Government: Case Study of a Social Media Tool for Value Co-Creation and Citizen Participation | Computer Science & related; Applied Sciences | 1, 2, 3 | 165 | 14 | 17 | 3.4 |
| Almirall, E.; Lee, M.; Majchrzak, A. (2014) | Open innovation requires integrated competition-community ecosystems: Lessons learned from civic open innovation | Applied Sciences | 1, 2, 8, 12 | 161 | 4 | 68 | 9.71 |
| Mergel, I. (2015) | Opening Government: Designing Open Innovation Processes to Collaborate With External Problem Solvers | Computer Science & related; Humanities & Social Sciences | 5, 8 | 112 | 1 | 42 | 7 |
| Wijnhoven, F.; Ehrenhard, M.; Kuhn, J. (2015) | Open government objectives and participation motivations | Computer Science & related | 3, 6 | 93 | 2 | 76 | 12.67 |
| Mergel, I. (2018) | Open innovation in the public sector: drivers and barriers for the adoption of Challenge.gov | Applied Sciences; Political Sciences & related | 8 | 86 | 14 | 38 | 12.67 |
| Lampe, C.; Zube, P.; Lee, J.; Park, C.H.; Johnston, E. (2014) | Crowdsourcing civility: A natural experiment examining the effects of distributed moderation in online forums | Computer Science & related | 1, 3 | 68 | 1 | 53 | 7.57 |
| Lin, Y.L. (2018) | A comparison of selected Western and Chinese smart governance: The application of ICT in governmental management, participation and collaboration | Political Sciences & related; Computer Science & related | 1, 5, 7 | 63 | 15 | 11 | 3.67 |
| Pieper, A.K.; Pieper, M. (2015) | Political participation via social media: A case study of deliberative quality in the public online budgeting process of Frankfurt/Main, Germany 2013 | Computer Science & related; Applied Sciences | 3 | 62 | 1 | 3 | 0.5 |
| Authors (Year) | Title | Research Area Group | Research Method | Since 2013 Usage | 180 Day Usage Count | Times Cited, WoS Core | Times Cited/Year |
|---|---|---|---|---|---|---|---|
| Linders, D. (2012) | From e-government to we-government: Defining a typology for citizen coproduction in the age of social media | Computer Science & related | 2, 10 | 454 | 39 | 502 | 55.78 |
| Mergel, I.; Desouza, K.C. (2013) | Implementing Open Innovation in the Public Sector: The Case of Challenge.gov | Political Sciences & related | 5, 8 | 192 | 9 | 128 | 16 |
| Wijnhoven, F.; Ehrenhard, M.; Kuhn, J. (2015) | Open government objectives and participation motivations | Computer Science & related | 3, 6 | 93 | 2 | 76 | 12.67 |
| Almirall, E.; Lee, M.; Majchrzak, A. (2014) | Open innovation requires integrated competition-community ecosystems: Lessons learned from civic open innovation | Applied Sciences | 1, 2, 8, 12 | 161 | 4 | 68 | 9.71 |
| Chen, L.J.; Ho, Y.H.; Lee, H.C.; Wu, H.C.; Liu, H.M.; Hsieh, H.H.; Huang, Y.T.; Lung, S.C.C. (2017) | An Open Framework for Participatory PM2.5 Monitoring in Smart Cities | Computer Science & related; Applied Sciences | 1, 2 | 31 | 4 | 68 | 17 |
| Prpić, J.; Taeihagh, A.; Melton, J. (2015) | The Fundamentals of Policy Crowdsourcing | Political Sciences & related | 10, 11 | 8 | 0 | 65 | 10.83 |
| Lampe, C.; Zube, P.; Lee, J.; Park, C.H.; Johnston, E. (2014) | Crowdsourcing civility: A natural experiment examining the effects of distributed moderation in online forums | Computer Science & related | 1, 3 | 68 | 1 | 53 | 7.57 |
| Stritch, J.M.; Pedersen, M.J.; Taggart, G. (2017) | The Opportunities and Limitations of Using Mechanical Turk (MTURK) in Public Administration and Management Scholarship | Computer Science & related | 1, 2 | 22 | 1 | 48 | 12 |
| Charalabidis, Y.; Loukis, E.N.; Androutsopoulou, A.; Karkaletsis, V.; Triantafillou, A. (2014) | Passive crowdsourcing in government using social media | Computer Science & related | 2 | 1 | 0 | 45 | 6.43 |
| Mergel, I. (2015) | Opening Government: Designing Open Innovation Processes to Collaborate With External Problem Solvers | Computer Science & related; Humanities & Social Sciences | 5, 8 | 112 | 1 | 42 | 7 |
Appendix D
| Author | Title | Reference |
|---|---|---|
| Aitamurto, T. | Crowdsourced Off-Road Traffic Law Experiment In Finland | [61] |
| Landemore, H. | Democratic Reason: Politics, Collective Intelligence, and the Rule of the Many | [62] |
| Landemore, H. | Open Democracy: Reinventing Popular Rule for the Twenty-First Century | [63] |
| Levy, P. | Collective Intelligence: Mankind’s Emerging World in Cyberspace | [2] |
| Noveck, B.S. | Smart Citizens, Smarter State. The Technologies of Expertise and the Future of Governing | [64] |
| Noveck, B.S.; Harvey, R.; Dinesh, A. | The Open Policymaking Playbook | [65] |
| Noveck, B.S.; et al. | Crowdlaw for Congress. Strategies for 21st Century Lawmaking | [66] |
| Ryan, M.; Gambrell, D.; Noveck, B.S. | Using Collective Intelligence to Solve Public Problems | [67] |
References
- Malone, T.W. Handbook of Collective Intelligence; Bernstein, M.S., Ed.; The MIT Press: Cambridge/London, UK, 2015. [Google Scholar]
- Levy, P. Collective Intelligence: Mankind’s Emerging World in Cyberspace; Plenum: New York, NY, USA, 1997. [Google Scholar]
- Hong, L.; Page, S. Groups of diverse problem-solvers can outperform groups of high-ability problem-solvers. Proc. Natl. Acad. Sci. USA 2004, 101, 16385–16389. [Google Scholar] [CrossRef] [Green Version]
- Mulgan, G. Big Mind: How Collective Intelligence Can Change Our World; Princeton University Press: Princeton/Oxford, UK, 2018; p. 22. [Google Scholar]
- Malone, T.W.; Laubacher, R.; Dellarocas, C. The collective intelligence genome. MIT Sloan Manag. Rev. 2010, 51, 21–31. [Google Scholar] [CrossRef]
- Woolley, A.W.; Chabris, C.F.; Pentland, A.; Hashmi, N.; Malone, T.W. Evidence for a Collective Intelligence Factor in the Performance of Human Groups. Science 2010, 330, 686–688. [Google Scholar] [CrossRef] [Green Version]
- Bonabeau, E. Decisions 2.0: The Power of Collective Intelligence. MIT Sloan Manag. Rev. 2009, 50, 45–52. [Google Scholar]
- Surowiecki, J. The Wisdom of Crowds; Anchor Books: New York, NY, USA, 2005. [Google Scholar]
- Howe, J. Crowdsourcing: Why the Power of The Crowd Is Driving the Future of Business; Crown Business: New York, NY, USA, 2008. [Google Scholar]
- Folino, G.; Forestiero, A. Using Entropy for Evaluating Swarm Intelligence Algorithms. In Nature Inspired Cooperative Strategies for Optimization (NICSO 2010); Studies in Computational Intelligence; González, J.R., Pelta, D.A., Cruz, C., Terrazas, G., Krasnogor, N., Eds.; Springer: Berlin/Heidelberg, Germany, 2020; Volume 284. [Google Scholar] [CrossRef]
- Mann, R.P.; Garnett, R. The entropic basis of collective behaviour. J. R. Soc. Interface 2015, 12, 20150037. [Google Scholar] [CrossRef]
- Kang, H.; Bei, F.; Shen, Y.; Sun, X.; Chen, Q. A Diversity Model Based on Dimension Entropy and Its Application to Swarm Intelligence Algorithm. Entropy 2021, 23, 397. [Google Scholar] [CrossRef] [PubMed]
- Saebø, Ø.; Rose, J.; Flak, L.S. The shape of eParticipation: Characterizing an emerging research area. Gov. Inf. Q. 2008, 25, 400–428. [Google Scholar] [CrossRef] [Green Version]
- Mureddu, F.; Misuraca, G.; Osimo, D.; Onori, R.; Armenia, S. A Living Roadmap for Policymaking 2.0. In Handbook of Research on Advanced ICT Integration for Governance and Policy Modeling, 1st ed.; Sonntagbauer, P., Nazemi, K., Sonntagbauer, S., Prister, G., Burkhardt, D., Eds.; IGI Global: Hershey, PA, USA, 2014. [Google Scholar] [CrossRef]
- Sun, T.Q.; Medaglia, R. Mapping the challenges of artificial intelligence in the public sector: Evidence from public healthcare. Gov. Inf. Q. 2019, 36, 368–383. [Google Scholar] [CrossRef]
- Madero, V.; Morris, N. Public participation mechanisms and sustainable policy-making: A case study analysis of Mexico City’s Plan Verde. J. Environ. Plan. Manag. 2016, 59, 1728–1750. [Google Scholar] [CrossRef]
- Aitamurto, T. Crowdsourcing for Democracy: New Era in Policy–Making. Publications of the Committee for the Future; Parliament of Finland: Helsinki, Finland, 2012. [Google Scholar]
- Landemore, H. Inclusive Constitution-Making: The Icelandic Experiment. J. Political Philos. 2015, 23, 166–191. [Google Scholar] [CrossRef]
- Greenemeier, L. Smart Machines Join Humans in Tracking Africa Ebola Outbreak. Available online: https://www.scientificamerican.com/article/smart-machines-join-humans-in-tracking-africa-ebola-outbreak/ (accessed on 22 February 2021).
- McKelvey, F.; MacDonald, M. Artificial intelligence policy innovations at the Canadian Federal Government. Can. J. Commun. 2019, 44, 43–50. [Google Scholar] [CrossRef] [Green Version]
- Valle-Cruz, D.; Criado, J.I.; Sandoval-Almazán, R.; Ruvalcaba-Gomez, E.A. Assessing the public policy-cycle framework in the age of artificial intelligence: From agenda-setting to policy evaluation. Gov. Inf. Q. 2020, 37, 101509. [Google Scholar] [CrossRef]
- Joyner-Roberson, E. What Do Drones, AI and Proactive Policing Have in Common? Available online: https://www.sas.com/en_za/insights/articles/risk-fraud/drones-ai-proactive-policing.html (accessed on 22 September 2020).
- Grothaus, M. China’s Airport Facial Recognition Kiosks Should Make Us Fear for Our Privacy. Available online: https://www.fastcompany.com/90324512/chinas-airport-facial-recognition-kiosks-should-make-us-fear-for-ourprivacy (accessed on 22 February 2021).
- Milano, M.; O’Sullivan, B.; Gavanelli, M. Sustainable Policy Making: A Strategic Challenge for Artificial Intelligence. AI Mag. 2014, 35, 22–35. [Google Scholar] [CrossRef] [Green Version]
- Vicente, M.R.; Novo, A. An empirical analysis of e-participation. The role of social networks and e-government over citizens’ online engagement. Gov. Inf. Q. 2014, 31, 379–387. [Google Scholar] [CrossRef]
- Wolfe, J. Varieties of Participatory Democracy and Democratic Theory. Political Sci. Rev. 1986, 16, 1–38. [Google Scholar]
- Pateman, C. Participatory Democracy Revisited. Perspect. Politics 2012, 10, 7–19. [Google Scholar] [CrossRef] [Green Version]
- Sintomer, Y.; Herzberg, C.; Rocke, A. Participatory budgeting in Europe: Potentials and challenges. Int. J. Urban Reg. Res. 2008, 32, 164–178. [Google Scholar] [CrossRef] [Green Version]
- Ansell, C.; Gash, A. Collaborative Governance in Theory and Practice. J. Public Adm. Res. Theory 2007, 18, 543–571. [Google Scholar] [CrossRef] [Green Version]
- Emerson, T.; Nabatchi, T.; Balogh, S. An Integrative Framework for Collaborative Governance. J. Public Adm. Res. Theory 2021, 22, 1–29. [Google Scholar] [CrossRef] [Green Version]
- Moher, D.; Liberati, A.; Tetzla, J.; Altman, D.G.; Group, P. Preferred Reporting Items for Systematic Reviews and Meta Analyses: The PRISMA statement. Ann. Intern. Med. 2009, 151, 6. [Google Scholar] [CrossRef] [PubMed] [Green Version]
- Bücheler, T.; Füchslin, R.M.; Pfeifer, R.; Sieg, J.H. Crowdsourcing, Open Innovation and Collective Intelligence in the scientific method: A research agenda and operational framework. In Proceedings of the Artificial Life XII—Twelfth International Conference on the Synthesis and Simulation of Living Systems, Odense, Denmark, 19–23 August 2010; pp. 679–686. [Google Scholar] [CrossRef]
- Snyder, H. Literature review as a research methodology: An overview and guidelines. J. Bus. Res. 2019, 104, 333–339. [Google Scholar] [CrossRef]
- Wolfswinkel, J.; Furtmueller, E.; Wilderom, C. Using grounded theory as a method for rigorously reviewing literature. Eur. J. Inf. Syst. 2013, 22, 45–55. [Google Scholar] [CrossRef]
- Corbin, J.; Strauss, A. Basics of Qualitative Research, 3rd ed.; Sage: Thousand Oaks, CA, USA, 2008. [Google Scholar]
- Garfield, E.; Sher, I.H. KeyWords Plus Algorithmic Derivative Indexing. J. Am. Soc. Inf. Sci. 1993, 44, 298–299. [Google Scholar] [CrossRef]
- Prpić, J.; Taeihagh, A.; Melton, J. The Fundamentals of Policy Crowdsourcing. Policy Internet 2015, 7, 340–361. [Google Scholar] [CrossRef] [Green Version]
- Taeihagh, A. Crowdsourcing: A New Tool for Policy-Making? Policy Sci. J. 2017, 50, 629–647. [Google Scholar] [CrossRef] [Green Version]
- Kerzner, H. Project Management Organisational Structures. In Project Management Case Studies; Kerzner, H., Ed.; Willey: Hoboken, NJ, USA, 2017. [Google Scholar] [CrossRef]
- Aitamurto, T.; Chen, K. The value of crowdsourcing in public policymaking: Epistemic, democratic and economic value. Theory Pract. Legis. 2017, 5, 55–72. [Google Scholar] [CrossRef]
- Iacuzzil, S.; Massaro, M.; Garlatti, A. Value Creation Through Collective Intelligence: Managing Intellectual Capital. Electron. J. Knowl. Manag. 2020, 18, 68–79. [Google Scholar]
- White, J. Managing Information in the Public Sector; M.E. Sharpe: Armonk, NY, USA, 2007. [Google Scholar]
- Aitamurto, T.; Landemore, H.; Galli, J.S. Unmasking the crowd: Participants’ motivation factors, expectations, and profile in a crowdsourced law reform. Inf. Commun. Soc. 2017, 20, 1239–1260. [Google Scholar] [CrossRef]
- Mergel, I. Opening Government: Designing Open Innovation Processes to Collaborate with External Problem Solvers. Soc. Sci. Comput. Rev. 2015, 33, 599–612. [Google Scholar] [CrossRef] [Green Version]
- Wijnhoven, F.; Ehrenhard, M.; Kuhn, J. Open government objectives and participation motivations. Gov. Inf. Q. 2015, 32, 30–42. [Google Scholar] [CrossRef]
- Guth, K.L.; Brabham, D.C. Finding the diamond in the rough: Exploring communication and platform in crowdsourcing performance. Commun. Monogr. 2017, 84, 510–533. [Google Scholar] [CrossRef]
- Iandoli, L.; Quinto, I.; Spada, P.; Klein, M.; Calabretta, R. Supporting argumentation in online political debate: Evidence from an experiment of collective deliberation. New Media Soc. 2018, 20, 1320–1341. [Google Scholar] [CrossRef]
- Leitner, K.H.; Warnke, P.; Rhomberg, W. New forms of innovation: Critical issues for future pathways. Foresight 2016, 18, 224–237. [Google Scholar] [CrossRef]
- Almirall, E.; Lee, M.; Majchrzak, A. Open innovation requires integrated competition-community ecosystems: Lessons learned from civic open innovation. Bus. Horiz. 2014, 57, 391–400. [Google Scholar] [CrossRef]
- Epp, D.A. Public policy and the wisdom of crowds. Cogn. Syst. Res. 2017, 43, 53–61. [Google Scholar] [CrossRef]
- Bose, T.; Reina, A.; Marshall, J.A.R. Collective decision-making. Curr. Opin. Behav. Sci. 2017, 16, 30–34. [Google Scholar] [CrossRef] [Green Version]
- Liu, H.K. Crowdsourcing Government: Lessons from Multiple Disciplines. Public Admin. Rev. 2017, 77, 656–667. [Google Scholar] [CrossRef] [Green Version]
- Chen, K.; Aitamurto, T. Barriers for Crowd’s Impact in Crowdsourced Policymaking: Civic Data Overload and Filter Hierarchy. Int. Public Manag. J. 2019, 22, 99–126. [Google Scholar] [CrossRef]
- Linders, D. From e-government to we-government: Defining a typology for citizen coproduction in the age of social media. Gov. Inf. Q. 2012, 29, 446–454. [Google Scholar] [CrossRef]
- Hogan, M.; Ojo, A.; Harney, O.; Ruijer, E.; Meijer, A.; Andriessen, J.; Pardijs, M.; Boscolo, P.; Boscolo, E.; Satta, M.; et al. Governance, Transparency and the Collaborative Design of Open Data Collaboration Platforms: Understanding Barriers, Options, and Needs. In Government 3.0—Next Generation Government Technology Infrastructure and Services; Ojo, A., Millard, J., Eds.; Springer: Cham, Switzerland, 2017. [Google Scholar] [CrossRef]
- Flavián, C.; Guinalíu, M.; Gurrea, R. The role played by perceived usability, satisfaction and consumer trust on website loyalty. Inf. Manag. 2006, 43, 1–14. [Google Scholar] [CrossRef]
- Fernández-Martínez, J.; López-Sánchez, M.; Aguilar, J.A.R.; Rubio, D.S.; Nemegyei, B.Z. Co-Designing participatory tools for a New Age: A proposal for combining collective and artificial intelligences. Int. J. Public Adm. Digit. Age 2018, 5, 17. [Google Scholar] [CrossRef]
- Lenart-Gansiniec, R.; Sułkowski, Ł. Crowdsourcing—A New Paradigm of Organisational Learning of Public Organisations. Sustainability 2018, 10, 3359. [Google Scholar] [CrossRef] [Green Version]
- Yates, F. Contingency table involving small numbers and the χ2 test. Suppl. J. R. Stat. Soc. 1934, 1, 217–235. [Google Scholar] [CrossRef]
- Web of Science Core Collection Help. Available online: https://0-images-webofknowledge-com.brum.beds.ac.uk/images/help/WOS/contents.html (accessed on 12 May 2021).
- Landemore, H. Democratic Reason: Politics, Collective Intelligence, and the Rule of the Many; Princeton University Press: Princeton, NJ, USA, 2013. [Google Scholar]
- Landemore, H. Open Democracy: Reinventing Popular Rule for the Twenty-First Century; Princeton University Press: Princeton, NJ, USA, 2020. [Google Scholar]
- Noveck, B.S.; Harvey, R.; Dinesh, A. The Open Policymaking Playbook; New York University: New York, NY, USA, 2019; Available online: https://www.thegovlab.org/static/files/publications/openpolicymaking-april29.pdf (accessed on 14 May 2021).
- Ryan, M.; Gambrell, D.; Noveck, B.S. Using Collective Intelligence to Solve Public Problems; Nesta: London, UK, 2020. [Google Scholar]
- Noveck, B.S.; Konopacki, M.; Dinesh, A.; Ryan, M.; Munozcano, B.R.; Kornberg, M.; Gambrell, D.; Hervey, R.; Joerger, G.; DeJohn, S.; et al. Crowdlaw for Congress. Strategies for 21st Century Lawmaking; New York University: New York, NY, USA, 2020; Available online: https://congress.crowd.law/files/crowdlaw_playbook_Oct2020.pdf (accessed on 14 May 2021).
- Aitamurto, T. Crowdsourced Off.-Road Traffic Law Experiment in Finland; Parliament of Finland: Helsinki, Finland, 2014.
- Noveck, B.S. Smart Citizens, Smarter State: The Technologies of Expertise and the Future of Governing; Harvard University Press: Cambridge, MA, USA, 2015. [Google Scholar]
- Mulgan, G. Social Innovation: How Societies Find the Power to Change. Policy Press: Bristol, UK, 2019. [Google Scholar]
- Verhulst, S.G.; Zahuranec, A.J.; Young, A. Identifying Citizens’ Needs by Combining AI and CI; New York University: New York, NY, USA, 2019; Available online: https://thegovlab.org/static/files/publications/CI-AI_oct2019.pdf (accessed on 17 July 2021).
- Transforming Our World: The 2030 Agenda for Sustainable Development. Available online: https://sdgs.un.org/2030agenda (accessed on 24 July 2021).
- Malone, T. Superminds: The Surprising Power of People and Computers Thinking Together; Little, Brown and Co.: New York, NY, USA, 2018. [Google Scholar]


| (a) | (b) | ||
|---|---|---|---|
| Top 10 Concepts in ARTICLE TITLES | Top 10 Concepts in ARTICLE ABSTRACTS | ||
| Concept | Number of Occurrences | Concept | Number of Occurrences |
| Crowdsourcing | 24 | Public | 153 |
| Open | 16 | Crowdsourcing | 125 |
| Public | 16 | Government | 84 |
| Social | 13 | Data | 82 |
| Innovation | 11 | Social | 79 |
| Case | 10 | Open | 78 |
| Government | 9 | Innovation | 76 |
| Participation | 9 | Research | 64 |
| Online | 9 | Policy | 63 |
| Policy | 9 | Online | 51 |
| (c) | (d) | ||
| Top 10 concepts in AUTHOR KEYWORDS | Top 10 concepts in KEYWORDS PLUS | ||
| Concept | Number of occurrences | Concept | Number of occurrences |
| Crowdsourcing | 50 | Participation | 14 |
| Open | 21 | Innovation | 14 |
| Public | 21 | Media | 9 |
| Policy | 19 | Social | 9 |
| Government | 16 | Coproduction | 8 |
| Innovation | 16 | Government | 8 |
| Social | 14 | E-Government | 7 |
| Participation | 11 | Information | 6 |
| Data | 10 | Democracy | 6 |
| Democracy | 10 | Engagement | 6 |
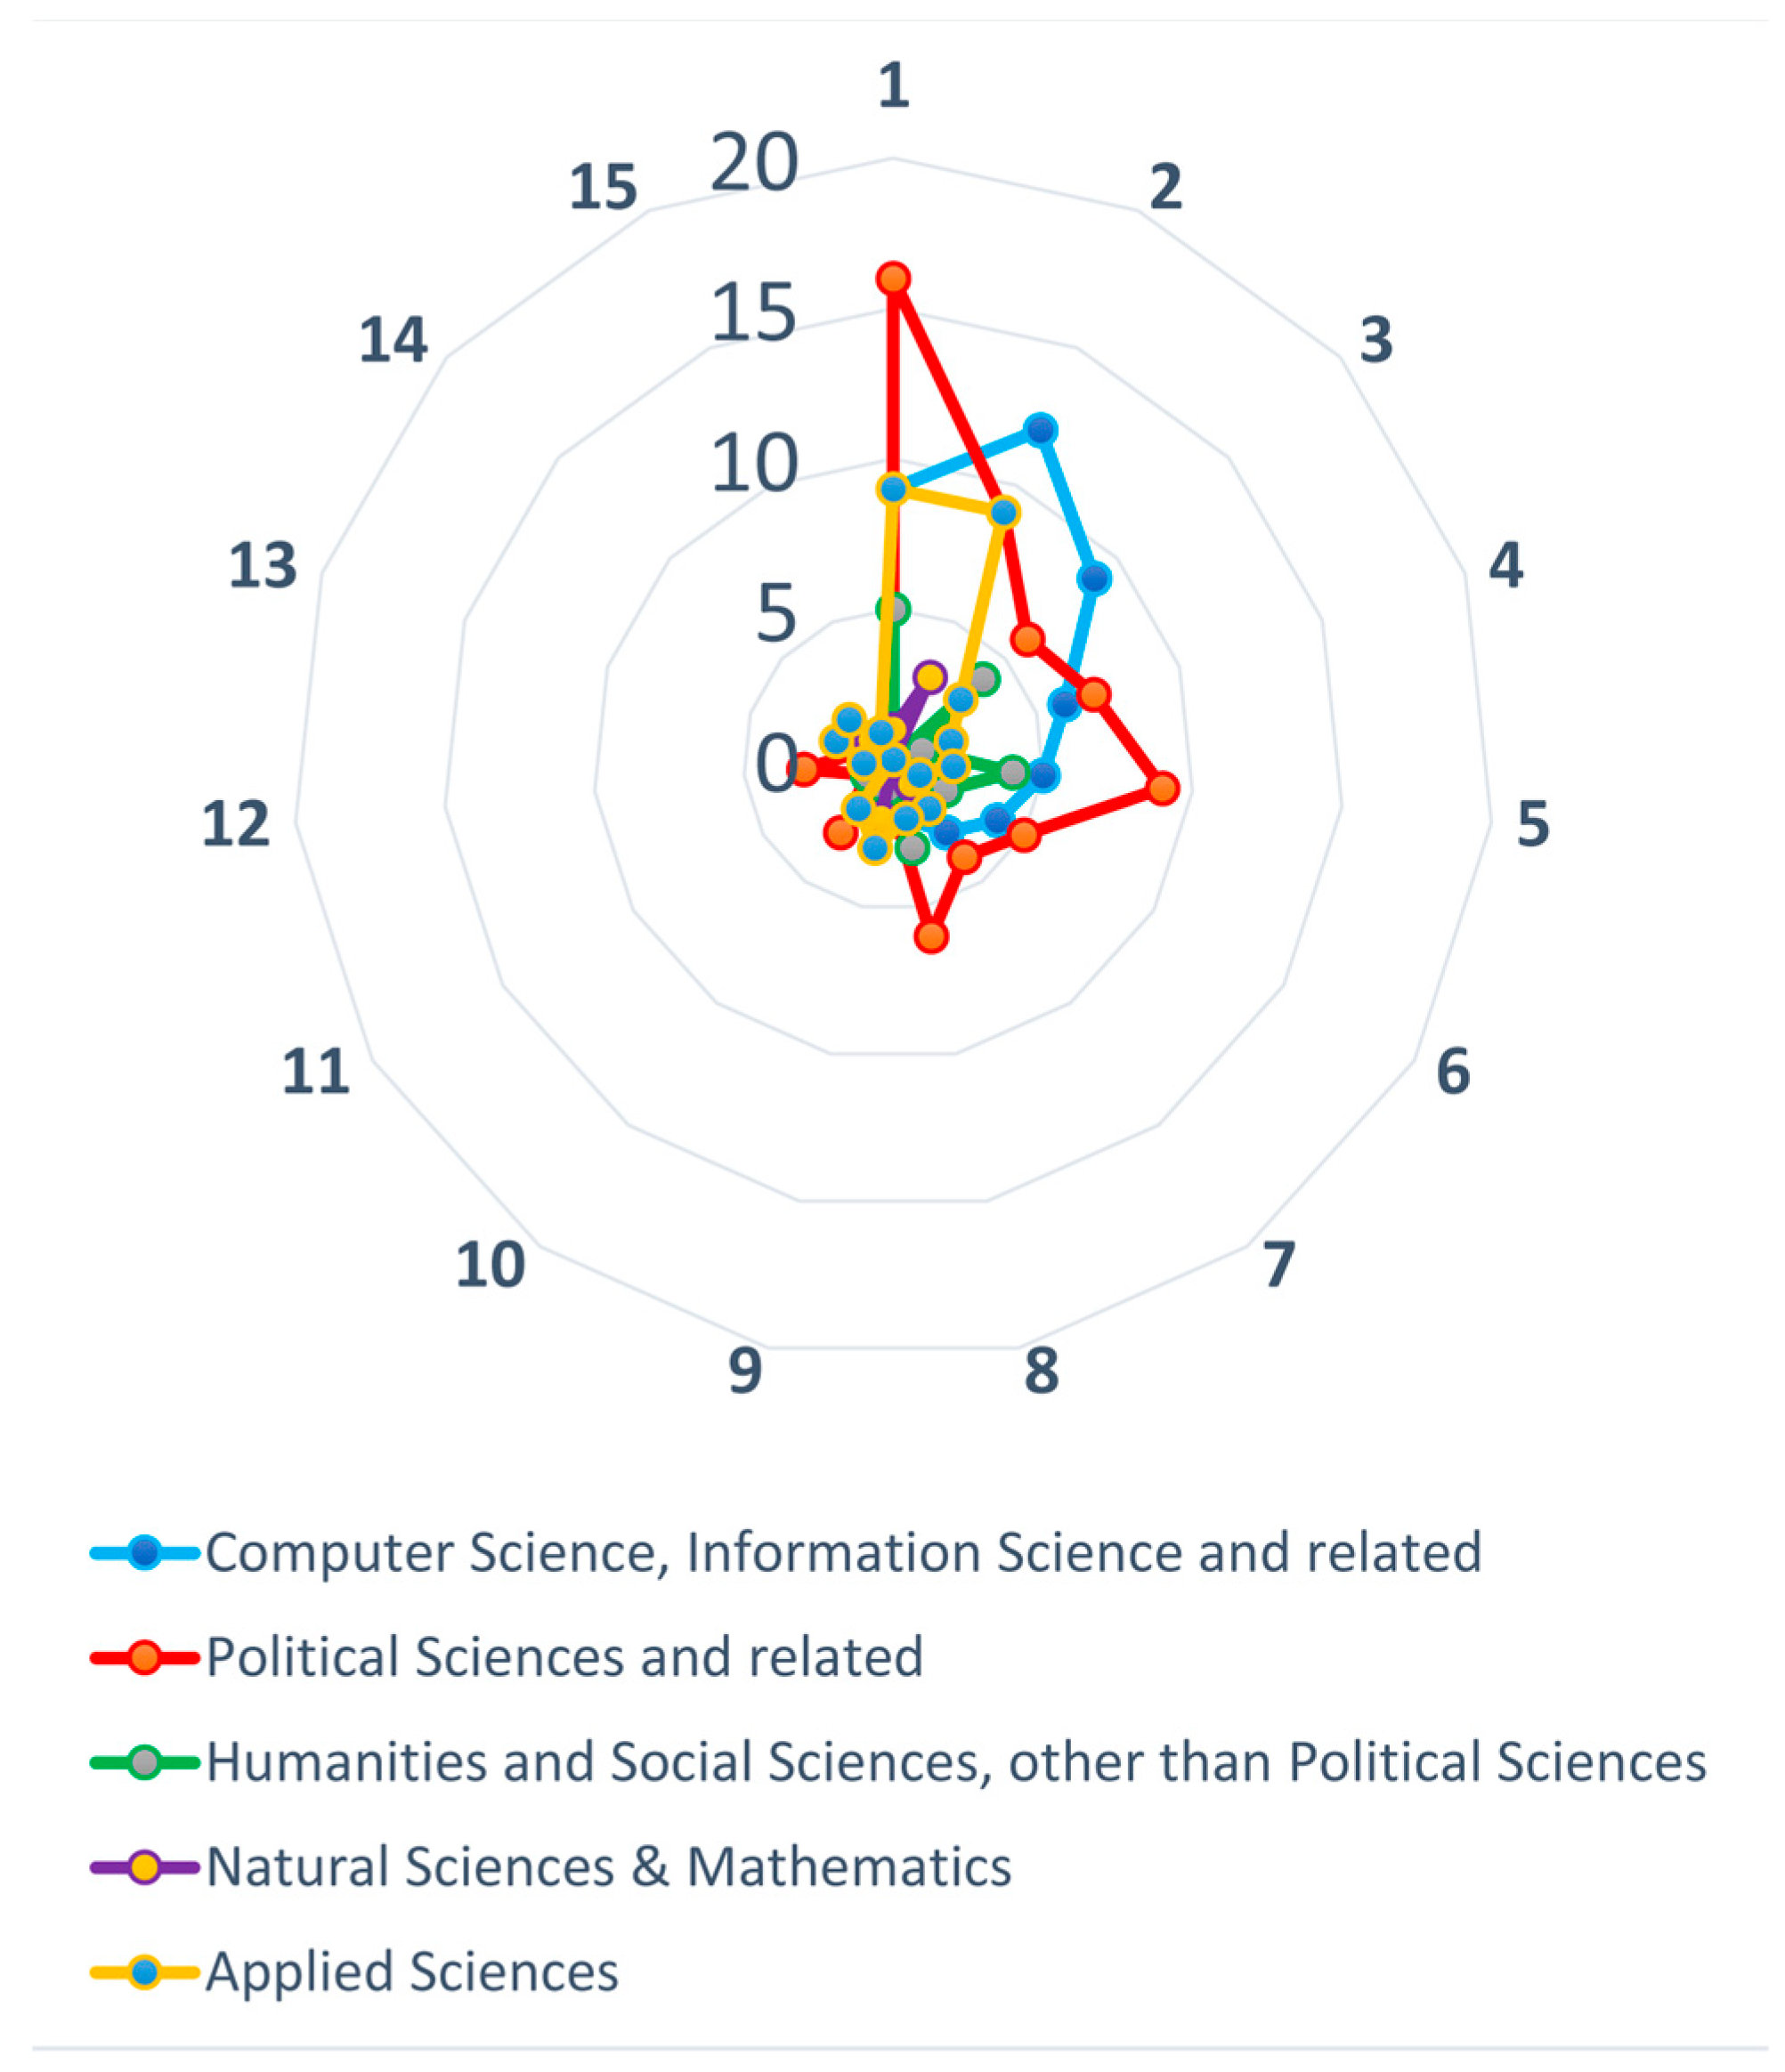
| No. | Method of Studying CI | Description | Literature | No. of Assigned Articles |
|---|---|---|---|---|
| 1. | Analysis of organisational structure/design (RM1) | The studies conducted from organisational perspective. Analysis covers the structures that facilitate the coordination and implementation of rules, resources, technologies, stakeholders, and particular tasks in specific projects or initiatives of open policymaking. These studies present the systems for accomplishing and connecting the activities that occur within examined work organisations, enabling the emergence of CI. | [37,38,39] | 31 |
| 2. | Analysis of created values (RM2) | The studies aim to answer the question: What kind of valuable results were produced in the analysed projects? The analysis of outputs, concerning that they are more valuable, than the inputs, is conducted. For example: epistemic, democratic and economic values in increasing the quality of public service provision can be analysed. | [40,41] | 25 |
| 3. | Analysis of e-participation process (RM3) | The aim of the studies is an analysis of factors that influence the technologically supported participation, or e-participation, which can be defined as participation in societal democratic and consultative processes mediated by information and communication technologies, primarily the internet [13] or as the use of information technologies to engage in discourse among citizens and between citizens and elected or appointed officials over public policy issues [41]. | [13,42] | 17 |
| 4. | Analysis of participants’ behaviour (RM4) | The studies aim to answer the question: What sort of various activities was performed by the users of the examined policymaking platforms and initiatives, what types of operations did they engage in, and how was it related to their individual characteristics. | [43] | 16 |
| 5. | Analysis of collaboration model (RM5) | It is investigated what forms of collaboration between governmental and non-governmental entities occur in the area under study, and what factors influence its facilitation. | [44] | 16 |
| 6. | Analysis of participants’ motivations (RM6) | The studies focus on understanding the participants’ motivations to engage in open policymaking projects. | [43,45] | 11 |
| 7. | Analysis of communication model (RM7) | Analyses of the communication processes, information exchange, establishing information channels between public and civic entities, extraction of valuable information, and the mutual understanding of the content provided are performed. | [46,47] | 9 |
| 8. | Analysis of innovation process (RM8) | Investigating the critical aspects of innovation process in the studied policymaking projects and initiatives/. The studies aim to answer the following questions: what influences innovation capacity, how to stimulate pro-innovative behaviour, what are the potential positive and negative impacts of the outcomes of the innovation processes. | [44,48,49] | 9 |
| 9. | Analysis of decision-making process (RM9) | The studies aim to answer the question: How collective intelligent policy decisions are made, and what affects the quality of the decision-making process. The analysis of processes, sub-processes, and data related to collective decision-making is conducted. | [50,51] | 8 |
| 10. | Analysis of the impact on policymaking (RM10) | The studies present the observed impact of the analysed projects on creating public policies, assess the significance of this impact and factors that influenced it. | [52,53] | 7 |
| 11. | Categorization of the implemented projects (RM11) | Typologies of various governmental or non-governmental initiatives and projects, engaging citizens in policymaking in a model that consider the emergence of collective intelligence, are presented. | [54] | 5 |
| 12. | State-of-the-art review (RM12) | The state of research and practices are presented in these studies in a cross-sectional manner. The studies focus on collecting, categorizing and situating the previously published research and practices in the field, coming from the multiple disciplines. | [37,53] | 4 |
| 13 | Analysis of platform usability (RM13) | These studies aim on understanding the structure of policy-oriented websites, their functions, interfaces and the contents; simplicity of use; the site navigation, and the ability of users to control their activities. | [55,56] | 4 |
| 14 | Analysis of the impact of AI algorithms (RM14) | The aim of these studies is an analysis of the possibilities of using AI techniques in CI processes occurring in policymaking initiatives, and the possible effects of their operation. | [57] | 3 |
| 15. | Analysis of organisational learning (RM15) | The studies focus on organisational learning, as the process of creating, retaining, and transferring knowledge within an policymaking organisation, when an organisation improves over time as it gains experience. | [58] | 1 |
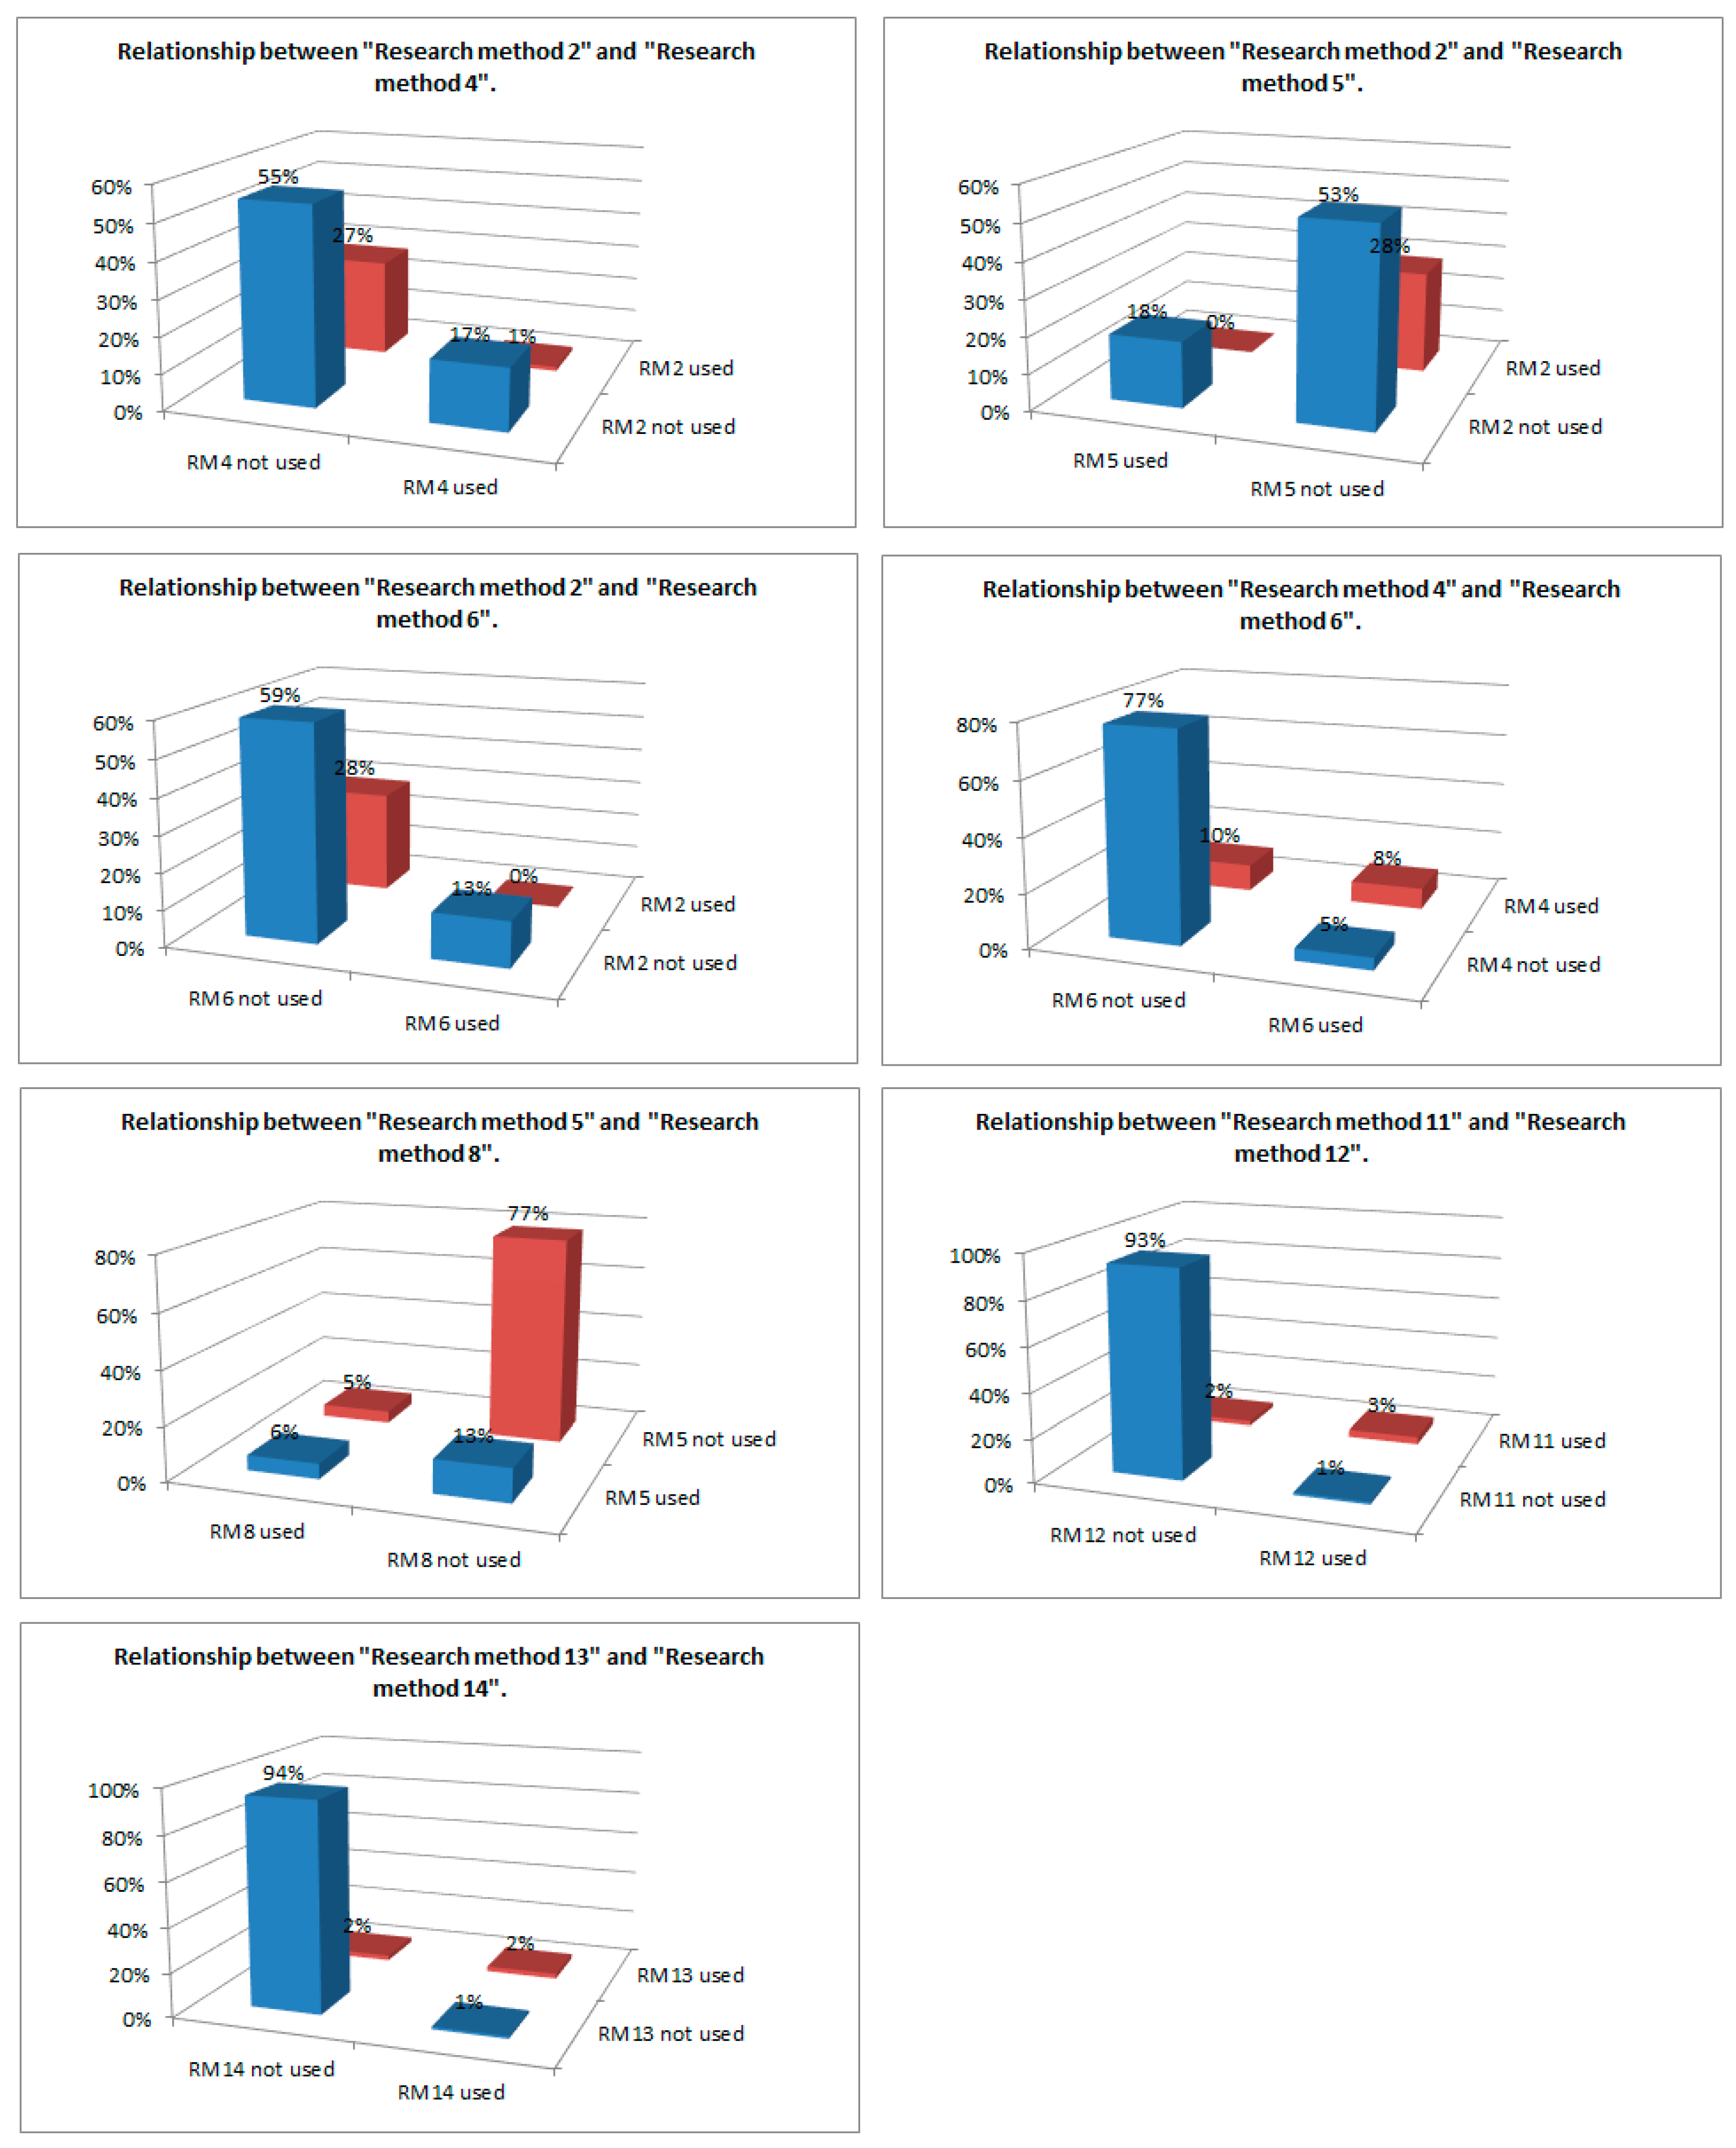
| RM 1 | RM 2 | RM 3 | RM 4 | RM 5 | RM 6 | RM 7 | RM 8 | RM 9 | RM 10 | RM 11 | RM 12 | RM 13 | RM 14 | RM 15 | |
|---|---|---|---|---|---|---|---|---|---|---|---|---|---|---|---|
| RM1 | 0.000 | ||||||||||||||
| RM2 | 0.371 | 0.000 | |||||||||||||
| RM3 | 0.089 | 0.273 | 0.000 | ||||||||||||
| RM4 | 0.089 | 0.030 | 0.143 | 0.000 | |||||||||||
| RM5 | 0.430 | 0.005 | 0.524 | 0.434 | 0.000 | ||||||||||
| RM6 | 0.933 | 0.026 | 0.919 | 0.000 | 1.000 | 0.000 | |||||||||
| RM7 | 0.541 | 0.225 | 0.816 | 0.562 | 0.214 | 0.894 | 0.000 | ||||||||
| RM8 | 0.900 | 0.225 | 0.261 | 0.136 | 0.002 | 0.231 | 0.285 | 0.000 | |||||||
| RM9 | 0.158 | 0.062 | 0.608 | 0.600 | 0.662 | 1.000 | 0.824 | 0.317 | 0.000 | ||||||
| RM10 | 0.227 | 0.377 | 0.177 | 0.781 | 0.781 | 0.882 | 0.712 | 0.712 | 0.383 | 0.000 | |||||
| RM11 | 0.090 | 0.668 | 0.260 | 0.278 | 0.278 | 0.384 | 0.437 | 0.437 | 0.467 | 0.498 | 0.000 | ||||
| RM12 | 0.131 | 0.197 | 0.317 | 0.335 | 0.335 | 0.439 | 0.490 | 0.490 | 0.517 | 0.547 | 0.000 | 0.000 | |||
| RM13 | 0.661 | 0.877 | 0.317 | 0.717 | 0.091 | 0.439 | 0.318 | 0.490 | 0.257 | 0.547 | 0.615 | 0.655 | 0.000 | ||
| RM14 | 0.944 | 0.267 | 0.388 | 0.406 | 0.489 | 0.505 | 0.179 | 0.552 | 0.137 | 0.604 | 0.665 | 0.701 | 0.000 | 0.000 | |
| RM15 | 0.458 | 0.526 | 0.623 | 0.635 | 0.635 | 0.704 | 0.734 | 0.734 | 0.750 | 0.767 | 0.805 | 0.826 | 0.826 | 0.850 | 0.000 |
| Research method 4 | Research method 5 | ||||||
| Research method 2 | 0 | 1 | Sum | Research method 2 | 0 | 1 | Sum |
| 0 | 48 | 15 | 63 | 0 | 16 | 47 | 63 |
| 1 | 24 | 1 | 25 | 1 | 0 | 25 | 25 |
| Sum | 72 | 16 | 88 | Sum | 16 | 72 | 88 |
| Research method 6 | Research method 6 | ||||||
| Research method 2 | 0 | 1 | Sum | Research method 4 | 0 | 1 | Sum |
| 0 | 52 | 11 | 63 | 0 | 68 | 4 | 72 |
| 1 | 25 | 0 | 25 | 1 | 9 | 7 | 16 |
| Sum | 77 | 11 | 88 | Sum | 77 | 11 | 88 |
| Research method 8 | Research method 12 | ||||||
| Research method 5 | 0 | 1 | Sum | Research method 11 | 0 | 1 | Sum |
| 0 | 5 | 11 | 16 | 0 | 82 | 1 | 83 |
| 1 | 4 | 68 | 72 | 1 | 2 | 3 | 5 |
| Sum | 9 | 79 | 88 | Sum | 84 | 4 | 88 |
| Research method 14 | |||||||
| Research method 13 | 0 | 1 | Sum | ||||
| 0 | 83 | 1 | 84 | ||||
| 1 | 2 | 2 | 4 | ||||
| Sum | 85 | 3 | 88 | ||||
| Relationship between | RM2 & RM4 | RM2 & RM5 | RM2 & RM6 | RM4 & RM6 | RM5 & RM8 | RM11 & RM12 | RM13 & RM14 |
|---|---|---|---|---|---|---|---|
| p-value | 0.062 | 0.013 | 0.061 | 0.00016 | 0.009 | 5.05 × 10⁻⁷ | 0.00012 |
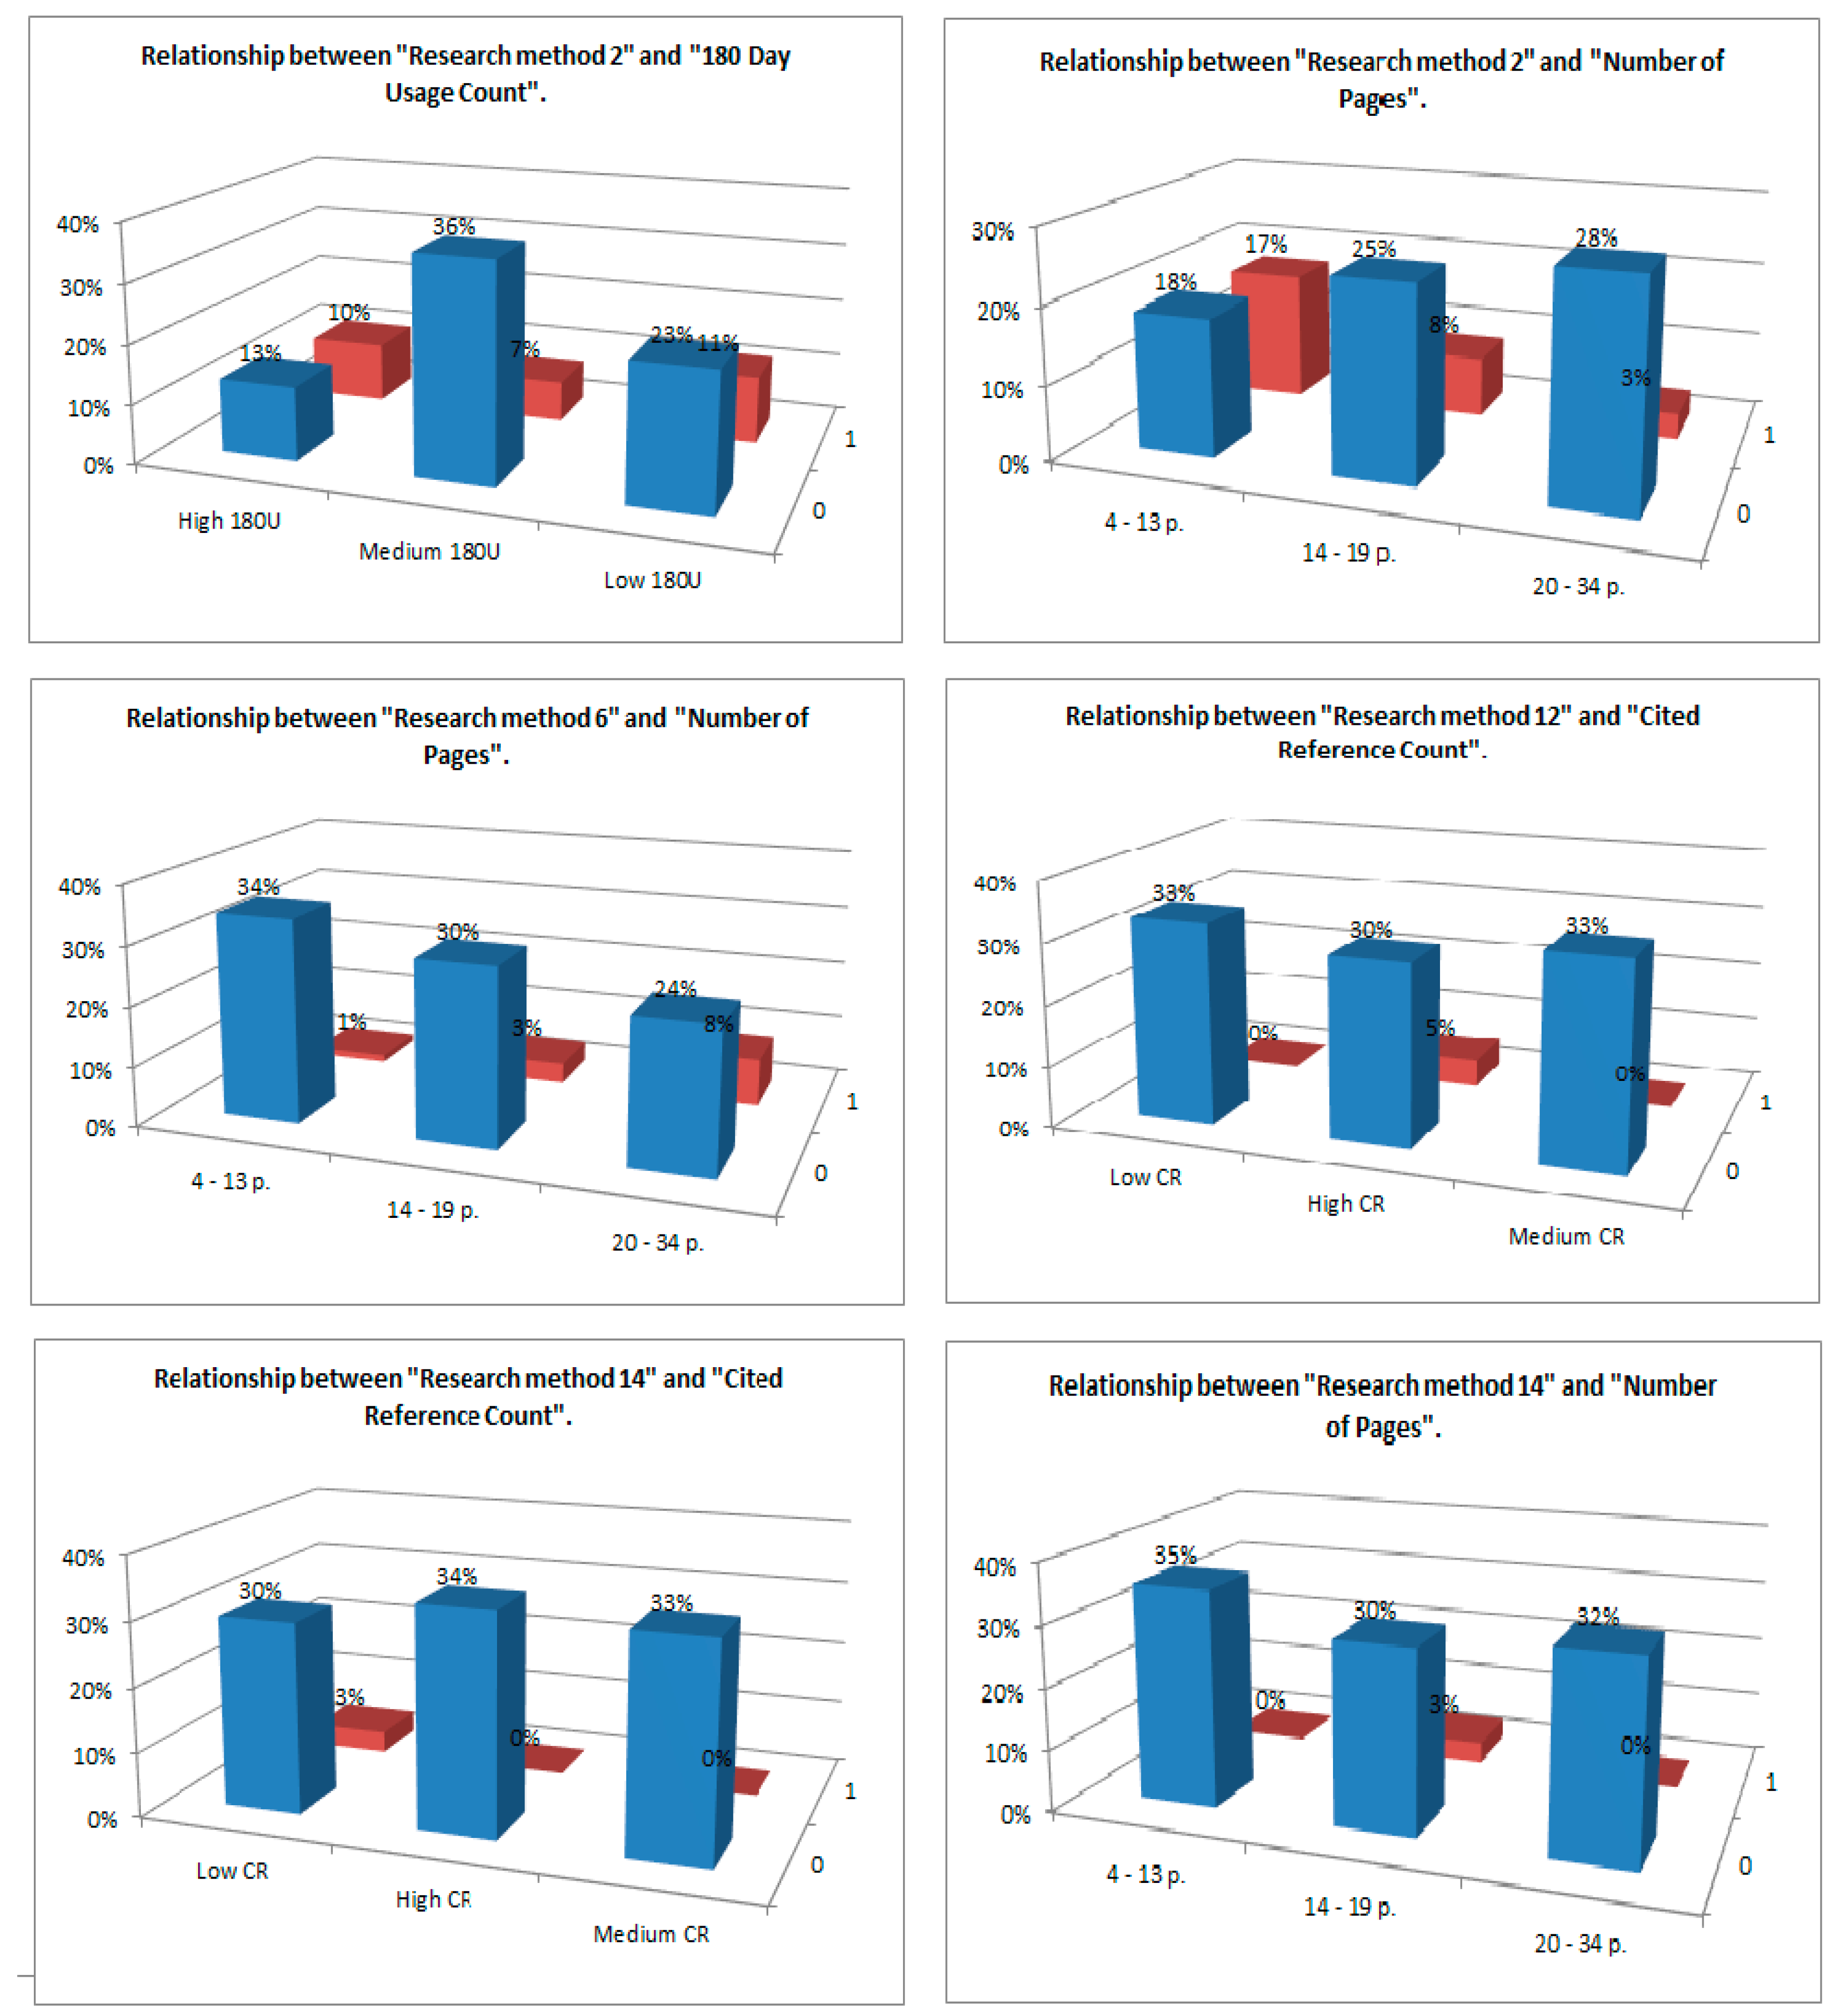
| Cited Reference Count | Times Cited WoS Core | Times Cited All Databases |
|---|---|---|
| 8.85 × 10⁻⁵ | 1.37 × 10⁻¹⁸ | 1.28 × 10⁻¹⁸ |
| 180 Day Usage Count | Since 2013 Usage Count | Number of Pages |
| 6.3 × 10⁻¹⁶ | 6.78 × 10⁻¹⁶ | 0.0307 |
| Low | Medium | High | ||||
|---|---|---|---|---|---|---|
| Range | N | Range | N | Range | N | |
| Cited Reference Count | 0–40.71 | 29 | 40.72–59.42 | 29 | 59.43–173 | 30 |
| Times Cited WoS Core | 0–3 | 34 | 4–11 | 27 | 12–502 | 27 |
| Times Cited All Databases | 0–3 | 33 | 4–11 | 27 | 12–512 | 28 |
| 180 Day Usage Count | 0 | 30 | 1–2 | 38 | 3–39 | 20 |
| Since 2013 Usage Count | 0–8 | 33 | 9–23.42 | 25 | 23.43–454 | 30 |
| Publication Year | 2012–2014 | 10 | 2015–2017 | 38 | 2018–2020 | 40 |
| Number of Pages | 4–13 | 31 | 14–19 | 29 | 20–34 | 28 |
| RM 1 | RM 2 | RM 3 | RM 4 | RM 5 | RM 6 | RM 7 | RM 8 | RM 9 | RM 10 | RM 11 | RM 12 | RM 13 | RM 14 | RM 15 | |
|---|---|---|---|---|---|---|---|---|---|---|---|---|---|---|---|
| CRC | 0.929 | 0.750 | 0.149 | 0.376 | 0.554 | 0.197 | 0.246 | 0.211 | 0.382 | 0.329 | 0.071 | 0.017 | 0.338 | 0.042 | 0.357 |
| CW | 0.905 | 0.232 | 0.156 | 0.775 | 0.456 | 0.906 | 0.188 | 0.511 | 0.503 | 0.586 | 0.340 | 0.124 | 0.892 | 0.085 | 0.319 |
| CA | 0.954 | 0.298 | 0.415 | 0.748 | 0.454 | 0.897 | 0.181 | 0.563 | 0.465 | 0.560 | 0.052 | 0.141 | 0.869 | 0.075 | 0.319 |
| 180U | 0.398 | 0.049 | 0.983 | 0.113 | 0.879 | 0.157 | 0.633 | 0.054 | 0.944 | 0.407 | 0.959 | 0.361 | 0.925 | 0.447 | 0.376 |
| 2013U | 0.239 | 0.726 | 0.877 | 0.929 | 0.850 | 0.823 | 0.505 | 0.780 | 0.258 | 0.939 | 0.907 | 0.864 | 0.318 | 0.263 | 0.430 |
| PY | 0.872 | 0.930 | 0.623 | 0.473 | 0.545 | 0.087 | 0.798 | 0.505 | 0.944 | 0.159 | 0.484 | 0.398 | 0.763 | 0.155 | 0.545 |
| NoP | 0.848 | 0.005 | 0.848 | 0.512 | 0.479 | 0.038 | 0.272 | 0.704 | 0.656 | 0.543 | 0.812 | 0.758 | 0.758 | 0.042 | 0.357 |
| 180 Day Usage Count | Number of Pages | ||||||||
| Research method 2 | High 180U | Medium 180U | Low 180U | Sum | Research method 2 | 4–13 | 14–19 | 20–34 | Sum |
| 0 | 11 | 32 | 20 | 63 | 0 | 16 | 22 | 25 | 63 |
| 1 | 9 | 6 | 10 | 25 | 1 | 15 | 7 | 3 | 25 |
| Sum | 20 | 38 | 30 | 88 | Sum | 31 | 29 | 28 | 88 |
| Number of Pages | Cited Reference Count | ||||||||
| Research method 6 | 4–13 | 14–19 | 20–34 | Sum | Research method 12 | Low CR | High CR | Medium CR | Sum |
| 0 | 30 | 26 | 21 | 77 | 0 | 29 | 26 | 29 | 84 |
| 1 | 1 | 3 | 7 | 11 | 1 | 0 | 4 | 0 | 4 |
| Sum | 31 | 29 | 28 | 88 | Sum | 29 | 30 | 29 | 88 |
| Cited Reference Count | Number of Pages | ||||||||
| Research method 14 | Low CR | High CR | Medium CR | Sum | Research method 14 | 4–13 | 14–19 | 20–34 | Sum |
| 0 | 26 | 30 | 29 | 85 | 0 | 31 | 26 | 28 | 85 |
| 1 | 3 | 0 | 0 | 3 | 1 | 0 | 3 | 0 | 3 |
| Sum | 29 | 30 | 29 | 88 | Sum | 31 | 29 | 28 | 88 |
| Relationship between | RM6 & NoP | RM14 & NoP | RM14 & CRC | RM12 & CRC |
|---|---|---|---|---|
| p-value | 0.042 | 0.063 | 0.067 | 0.032 |
| Relationship between | NoM & CRC | NoM & CW | NoM & CA | NoM & 180U | NoM & 2013U | NoM & PY | NoM & NoP |
|---|---|---|---|---|---|---|---|
| p-value | 0.461 | 0.681 | 0.773 | 0.773 | 0.970 | 0.068 | 0.856 |
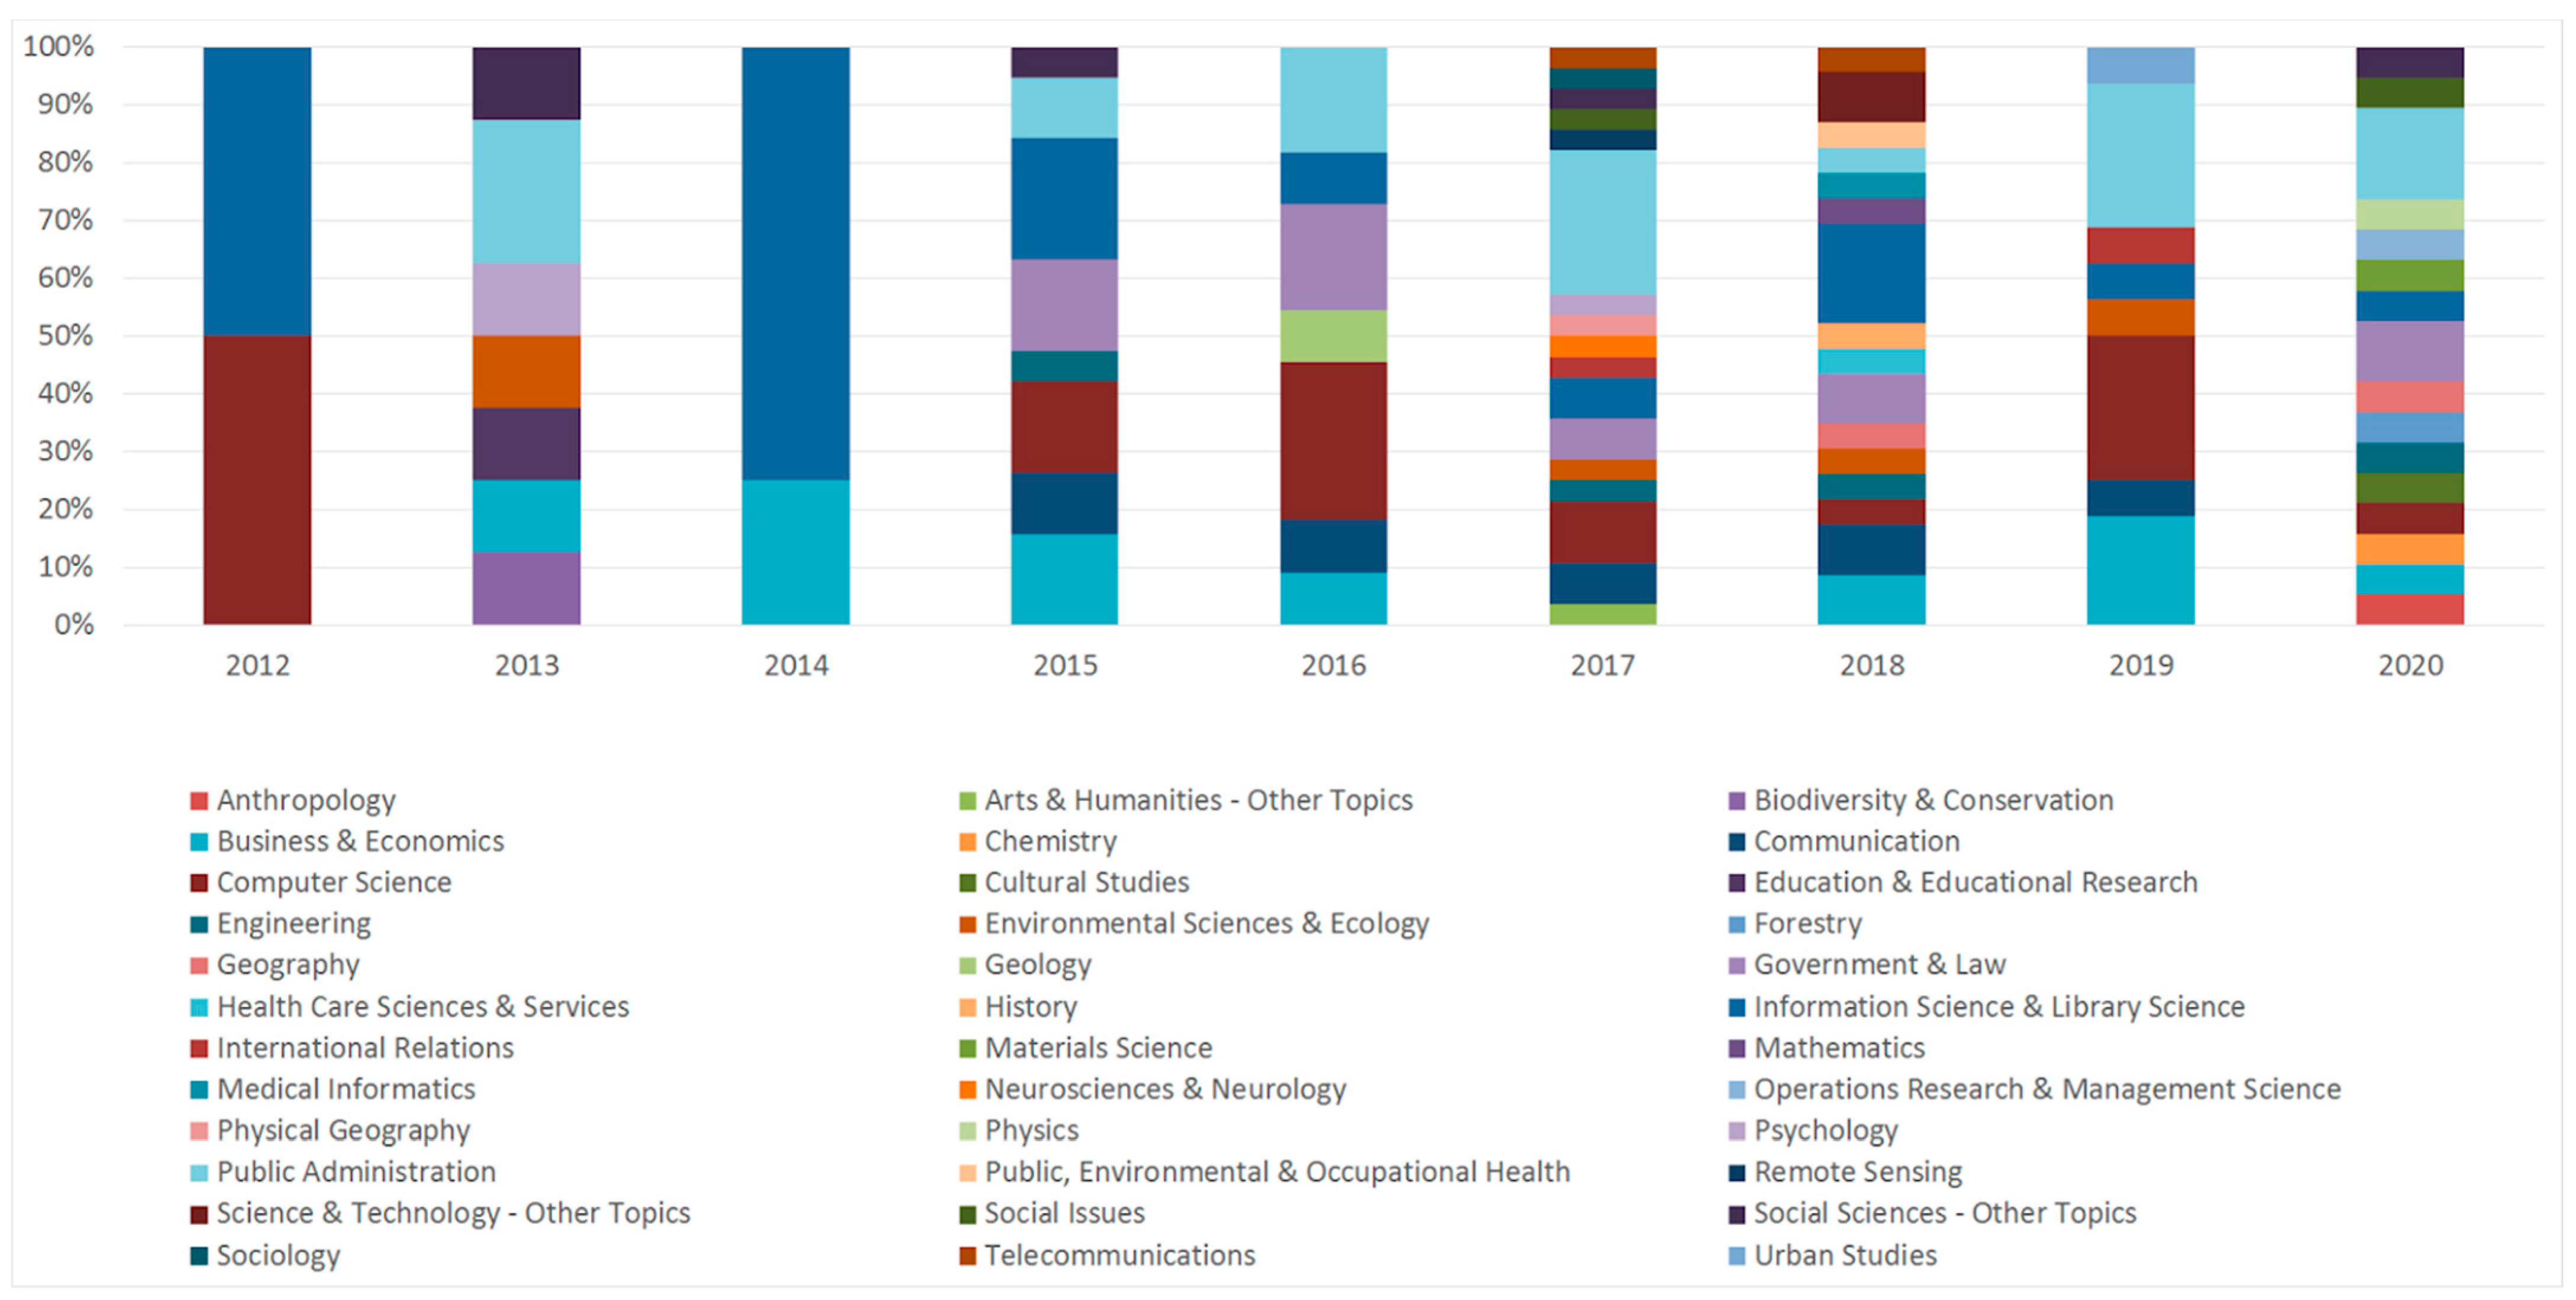
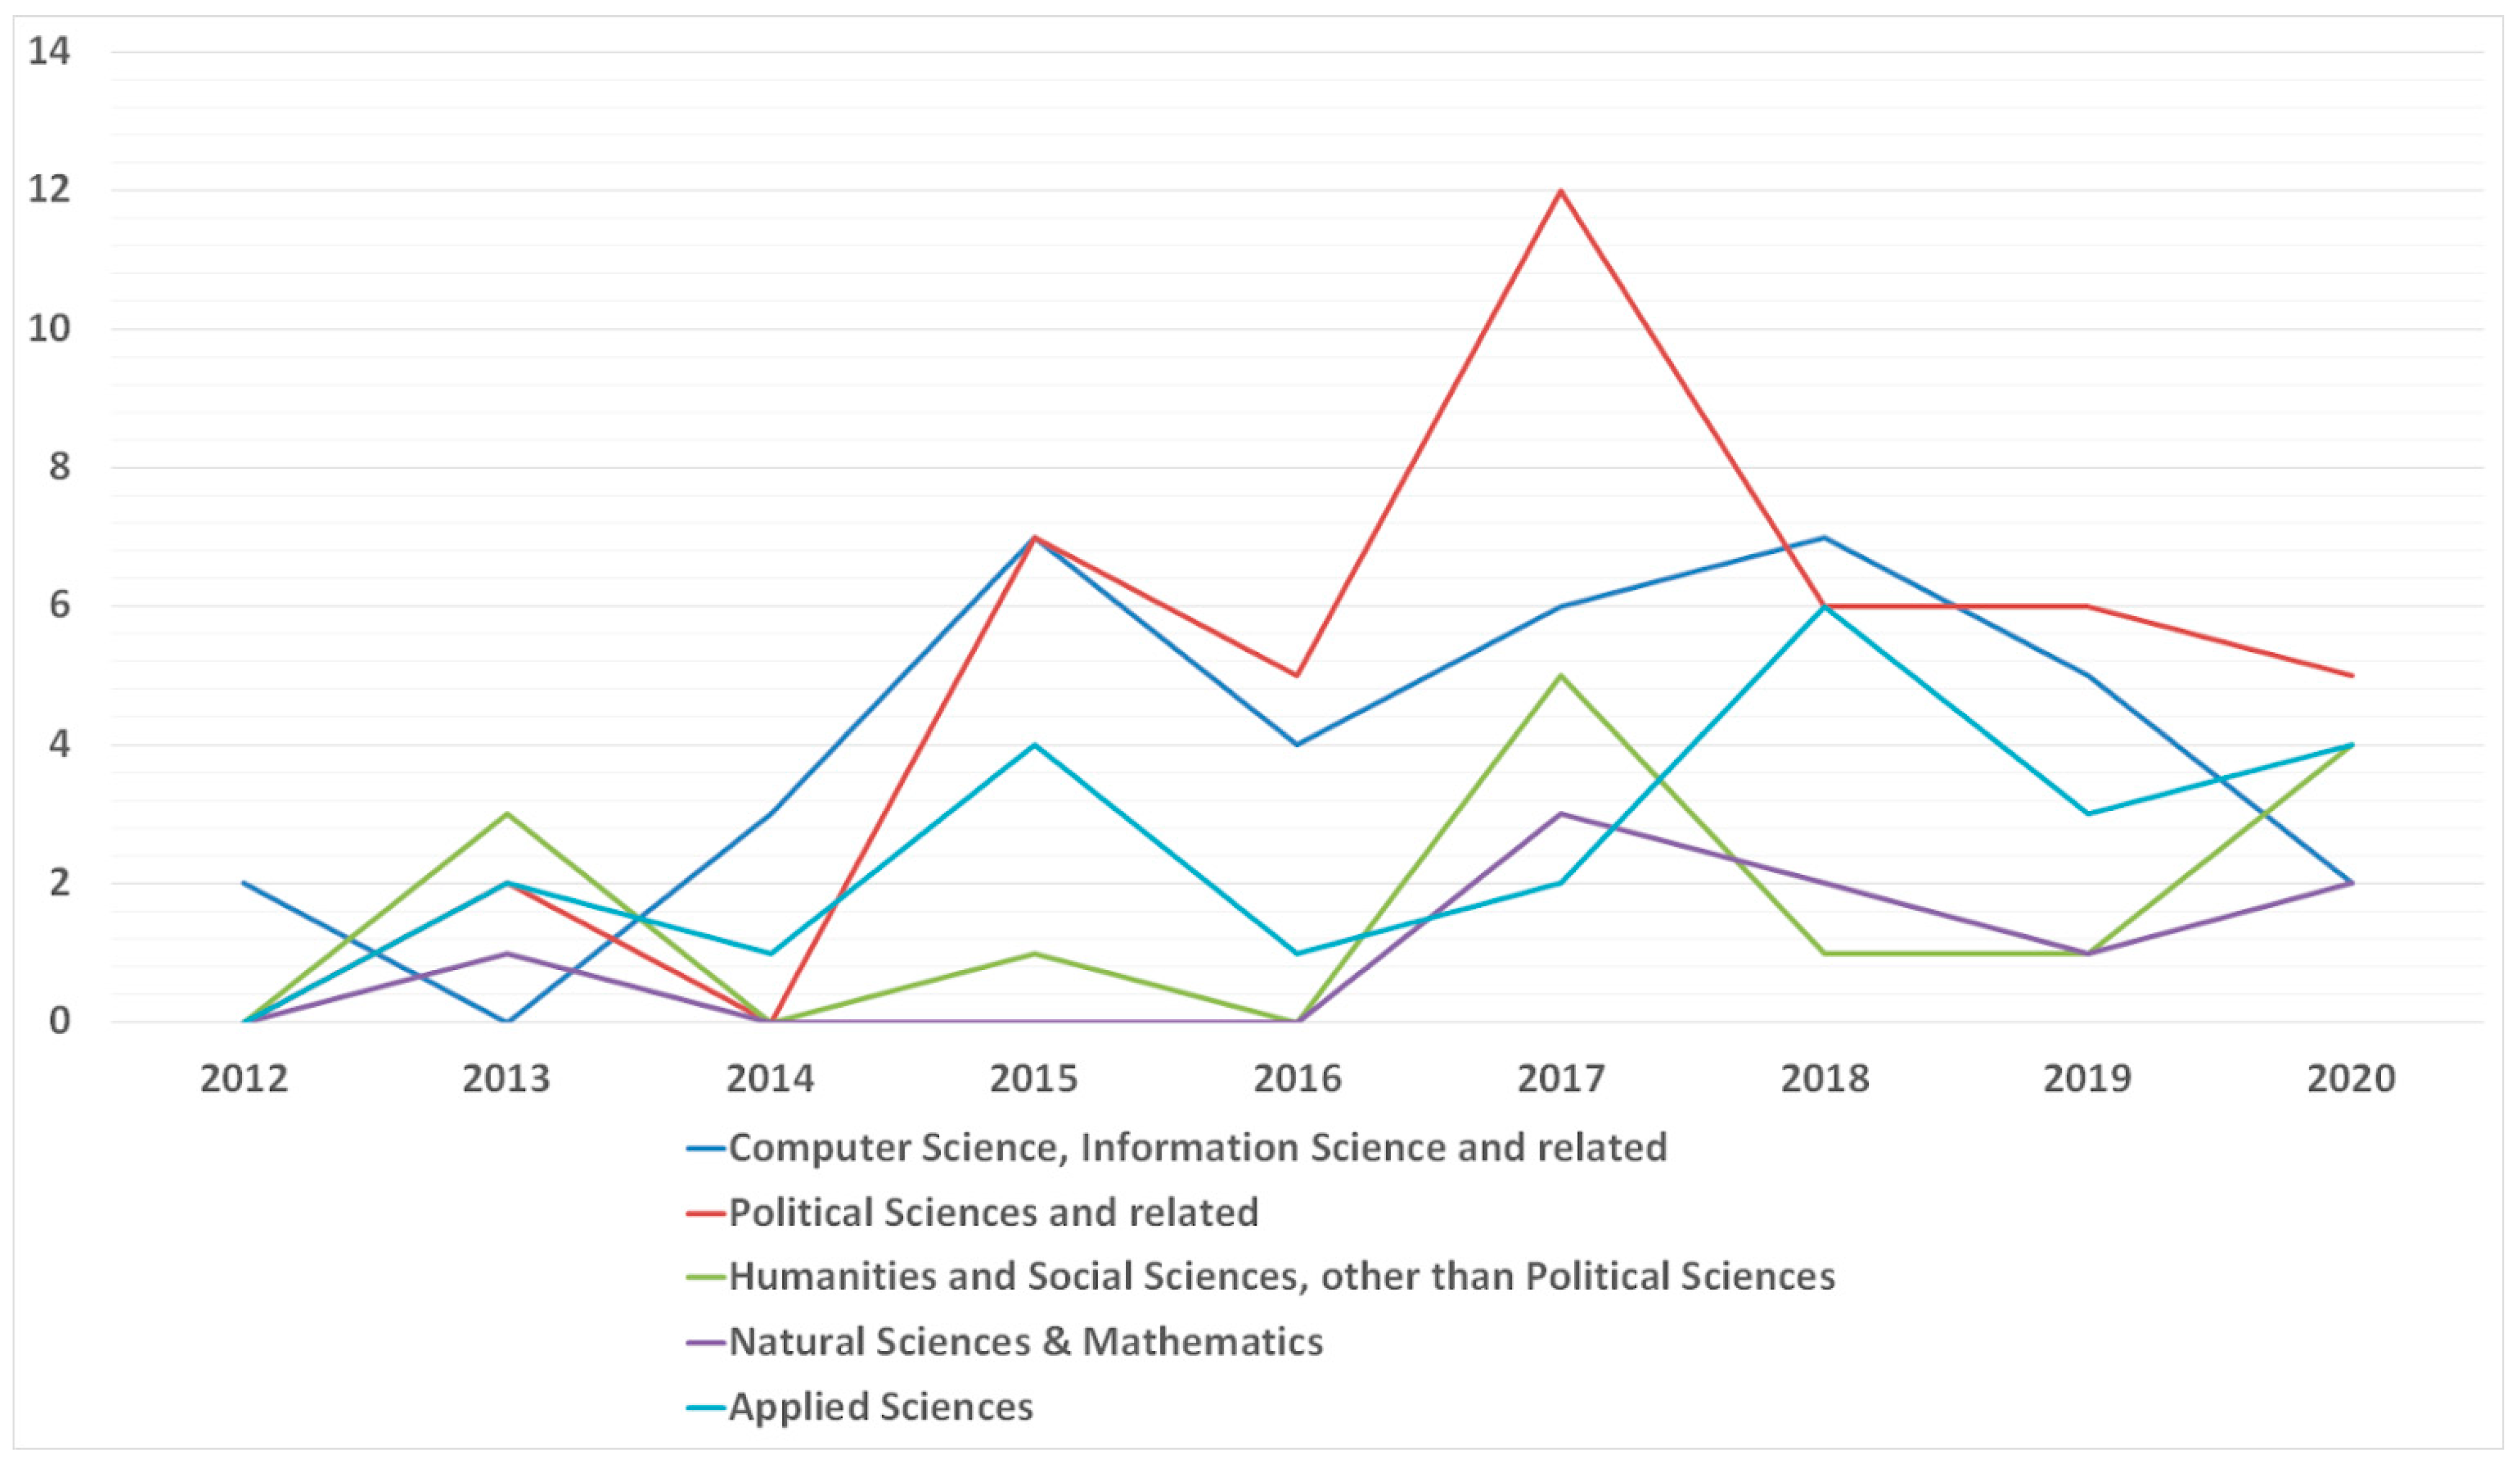
| Research Area Group (RAG) | WoS Research Areas Included | The Total Number of Studies in 2012–2020 |
|---|---|---|
|
Computer Science, Information Science and related | Computer Science, Information Science & Library Science, Telecommunications, Medical Informatics. | 32 |
| Political Sciences and related | Public Administration, International Relations, Government & Law, Communication, Public, Environmental & Occupational Health. | 38 |
| Humanities and Social Sciences, other than Political Sciences | Anthropology, Sociology, Psychology, History, Cultural Studies, Education & Educational Research, Arts & Humanities—Other Topics, Social Issues, Urban Studies, Social Sciences—Other Topics. | 11 |
| Natural Sciences & Mathematics | Mathematics, Physics, Physical Geography, Chemistry, Neurosciences & Neurology, Environmental Sciences & Ecology. | 8 |
| Applied Sciences | Engineering, Health Care Sciences & Services, Business & Economics, Biodiversity & Conservation, Operations Research & Management Science, Science & Technology—Other Topics, Remote Sensing, Forestry | 22 |
| Concept | Number of Studies Where the Concept Appeared | References in Monographic Publications |
|---|---|---|
| Citizenship | 47 | [61,62,63,64] |
| Local governance & Urban development | 30 | [2,63,64,65] |
| Communities | 14 | [2,62,64] |
| Deliberation | 9 | [61,62,64,65,66,67] |
| Open data | 7 | [64,65] |
| Diversity | 5 | [2,61,63,66] |
| Consensus | 5 | [61,62,66] |
Publisher’s Note: MDPI stays neutral with regard to jurisdictional claims in published maps and institutional affiliations. |
© 2021 by the authors. Licensee MDPI, Basel, Switzerland. This article is an open access article distributed under the terms and conditions of the Creative Commons Attribution (CC BY) license (https://creativecommons.org/licenses/by/4.0/).
Share and Cite
Olszowski, R.; Pięta, P.; Baran, S.; Chmielowski, M. Organisational Structure and Created Values. Review of Methods of Studying Collective Intelligence in Policymaking. Entropy 2021, 23, 1391. https://0-doi-org.brum.beds.ac.uk/10.3390/e23111391
Olszowski R, Pięta P, Baran S, Chmielowski M. Organisational Structure and Created Values. Review of Methods of Studying Collective Intelligence in Policymaking. Entropy. 2021; 23(11):1391. https://0-doi-org.brum.beds.ac.uk/10.3390/e23111391
Chicago/Turabian StyleOlszowski, Rafał, Piotr Pięta, Sebastian Baran, and Marcin Chmielowski. 2021. "Organisational Structure and Created Values. Review of Methods of Studying Collective Intelligence in Policymaking" Entropy 23, no. 11: 1391. https://0-doi-org.brum.beds.ac.uk/10.3390/e23111391