
Multilevel Deep Feature Generation Framework for Automated Detection of Retinal Abnormalities Using OCT Images

 ,
,  , , , , ,
Abstract
:1. Introduction
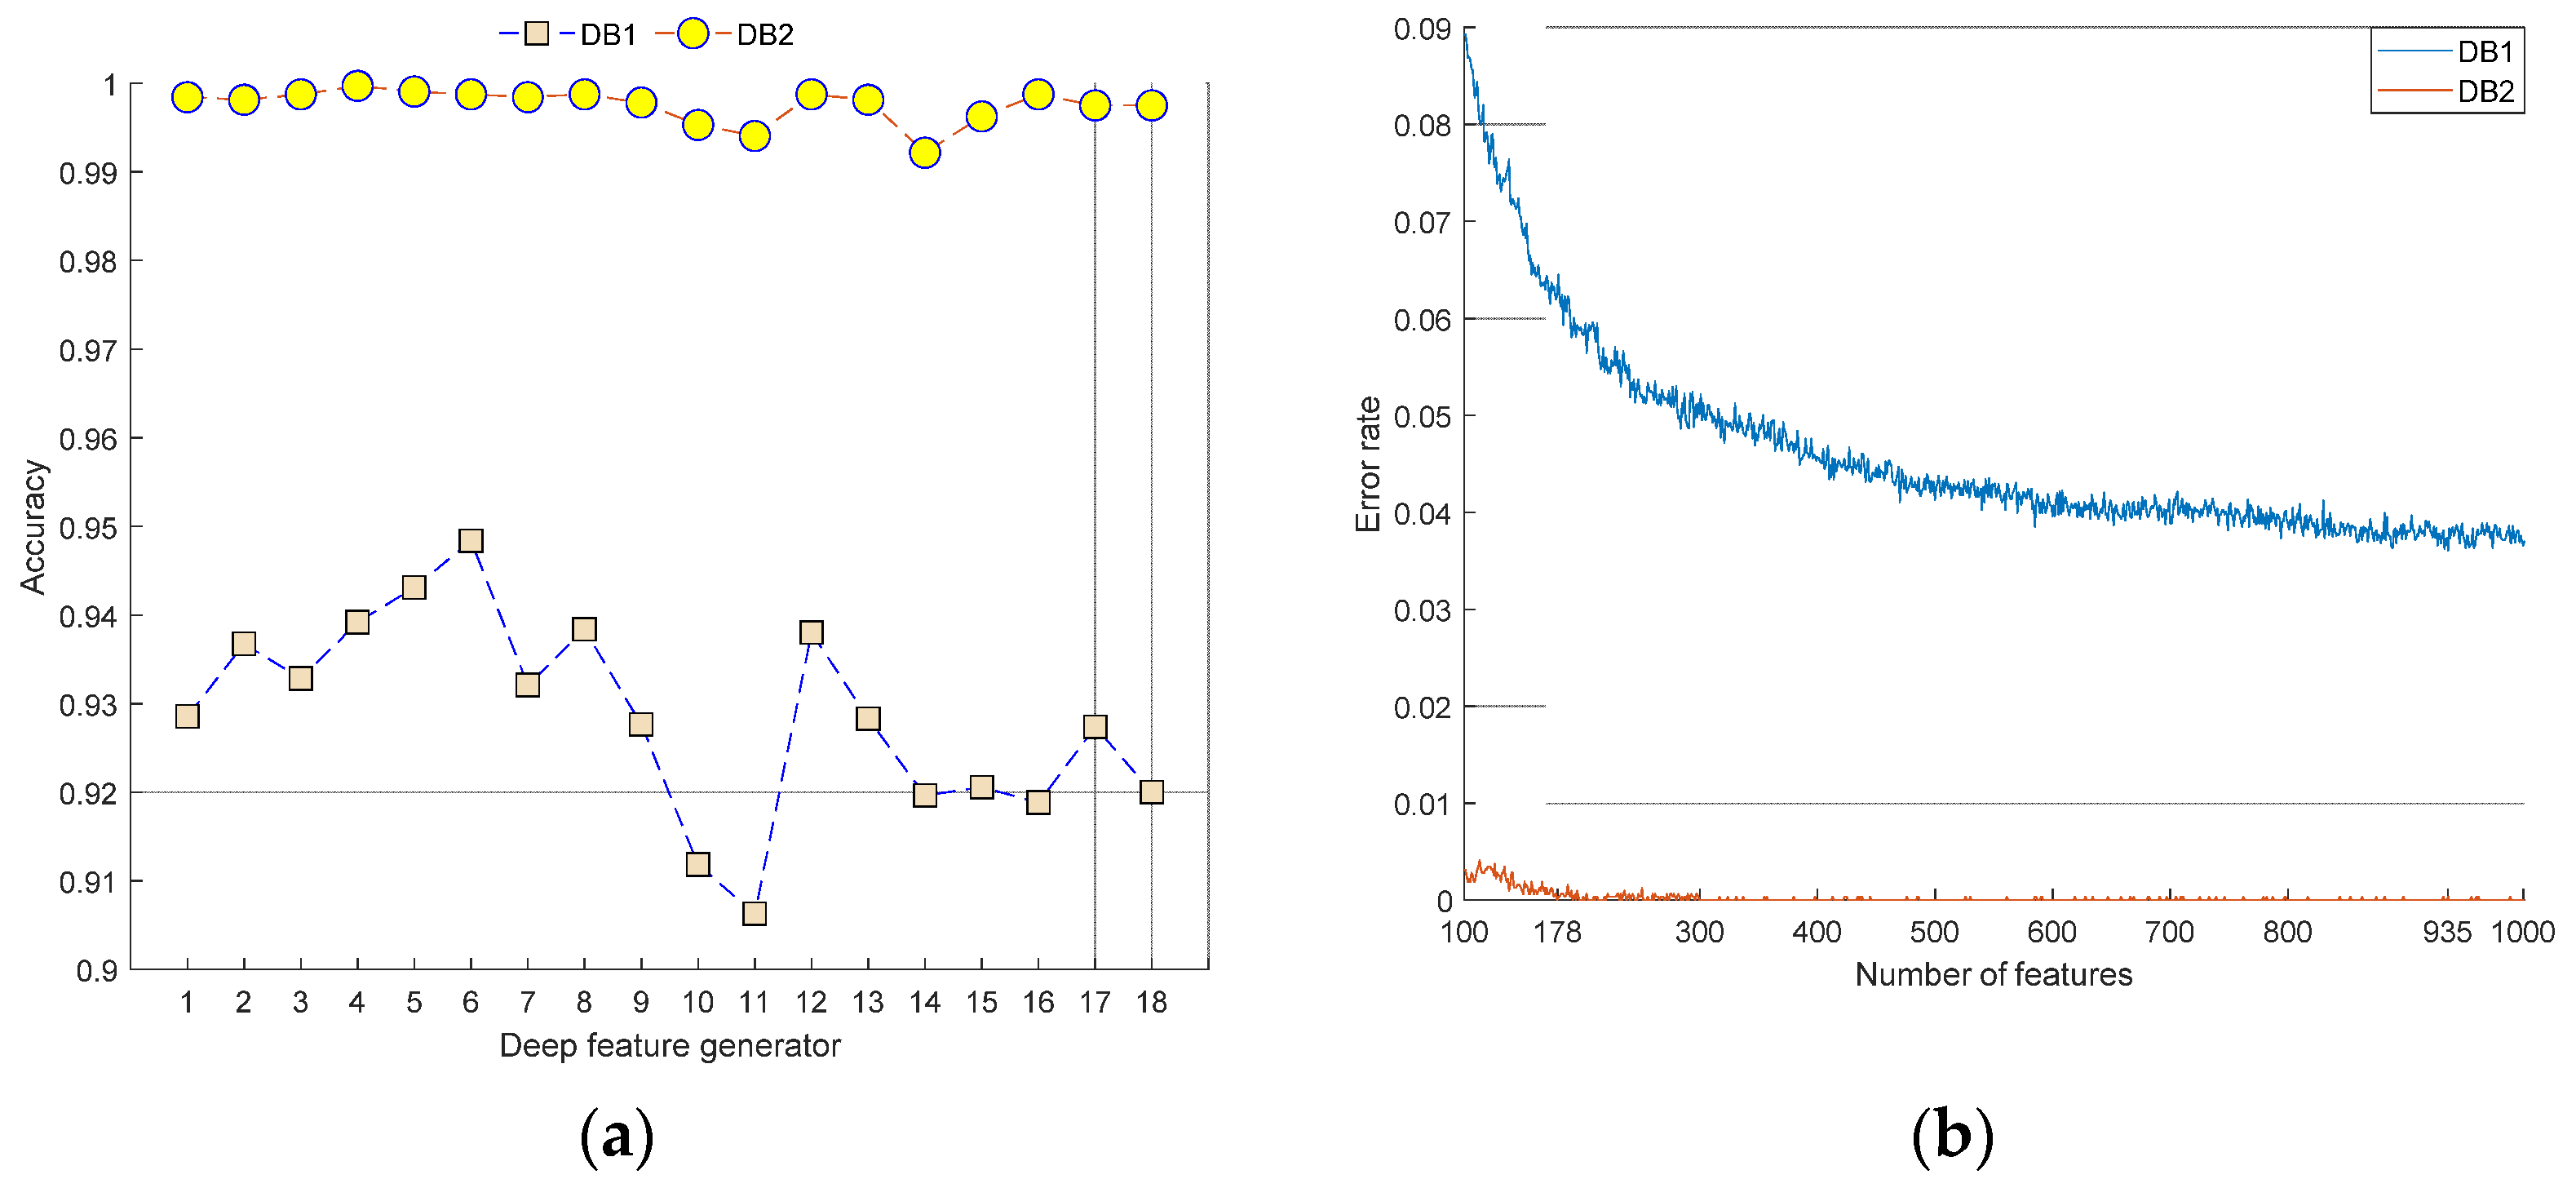
- An intelligent deep feature generator is presented using transfer learning. Using transfer learning, 1000 features are generated from each pre-trained CNN, 18 pre-trained networks are involved in this framework, and an 18-feature generation function is proposed using these pre-trained CNNs and three maximum pooling methods. The proposed framework generates the best deep features to attain the best classification rates.
- An effective learning model is presented by deploying the proposed multiple CNNs based on a deep feature generator, iterative feature selector (IRF), and classification with SVM. This learning model is developed using two public OCT image datasets. It attained the highest classification performance using both OCT datasets.
2. Literature Review
3. Material and Method
3.1. Material
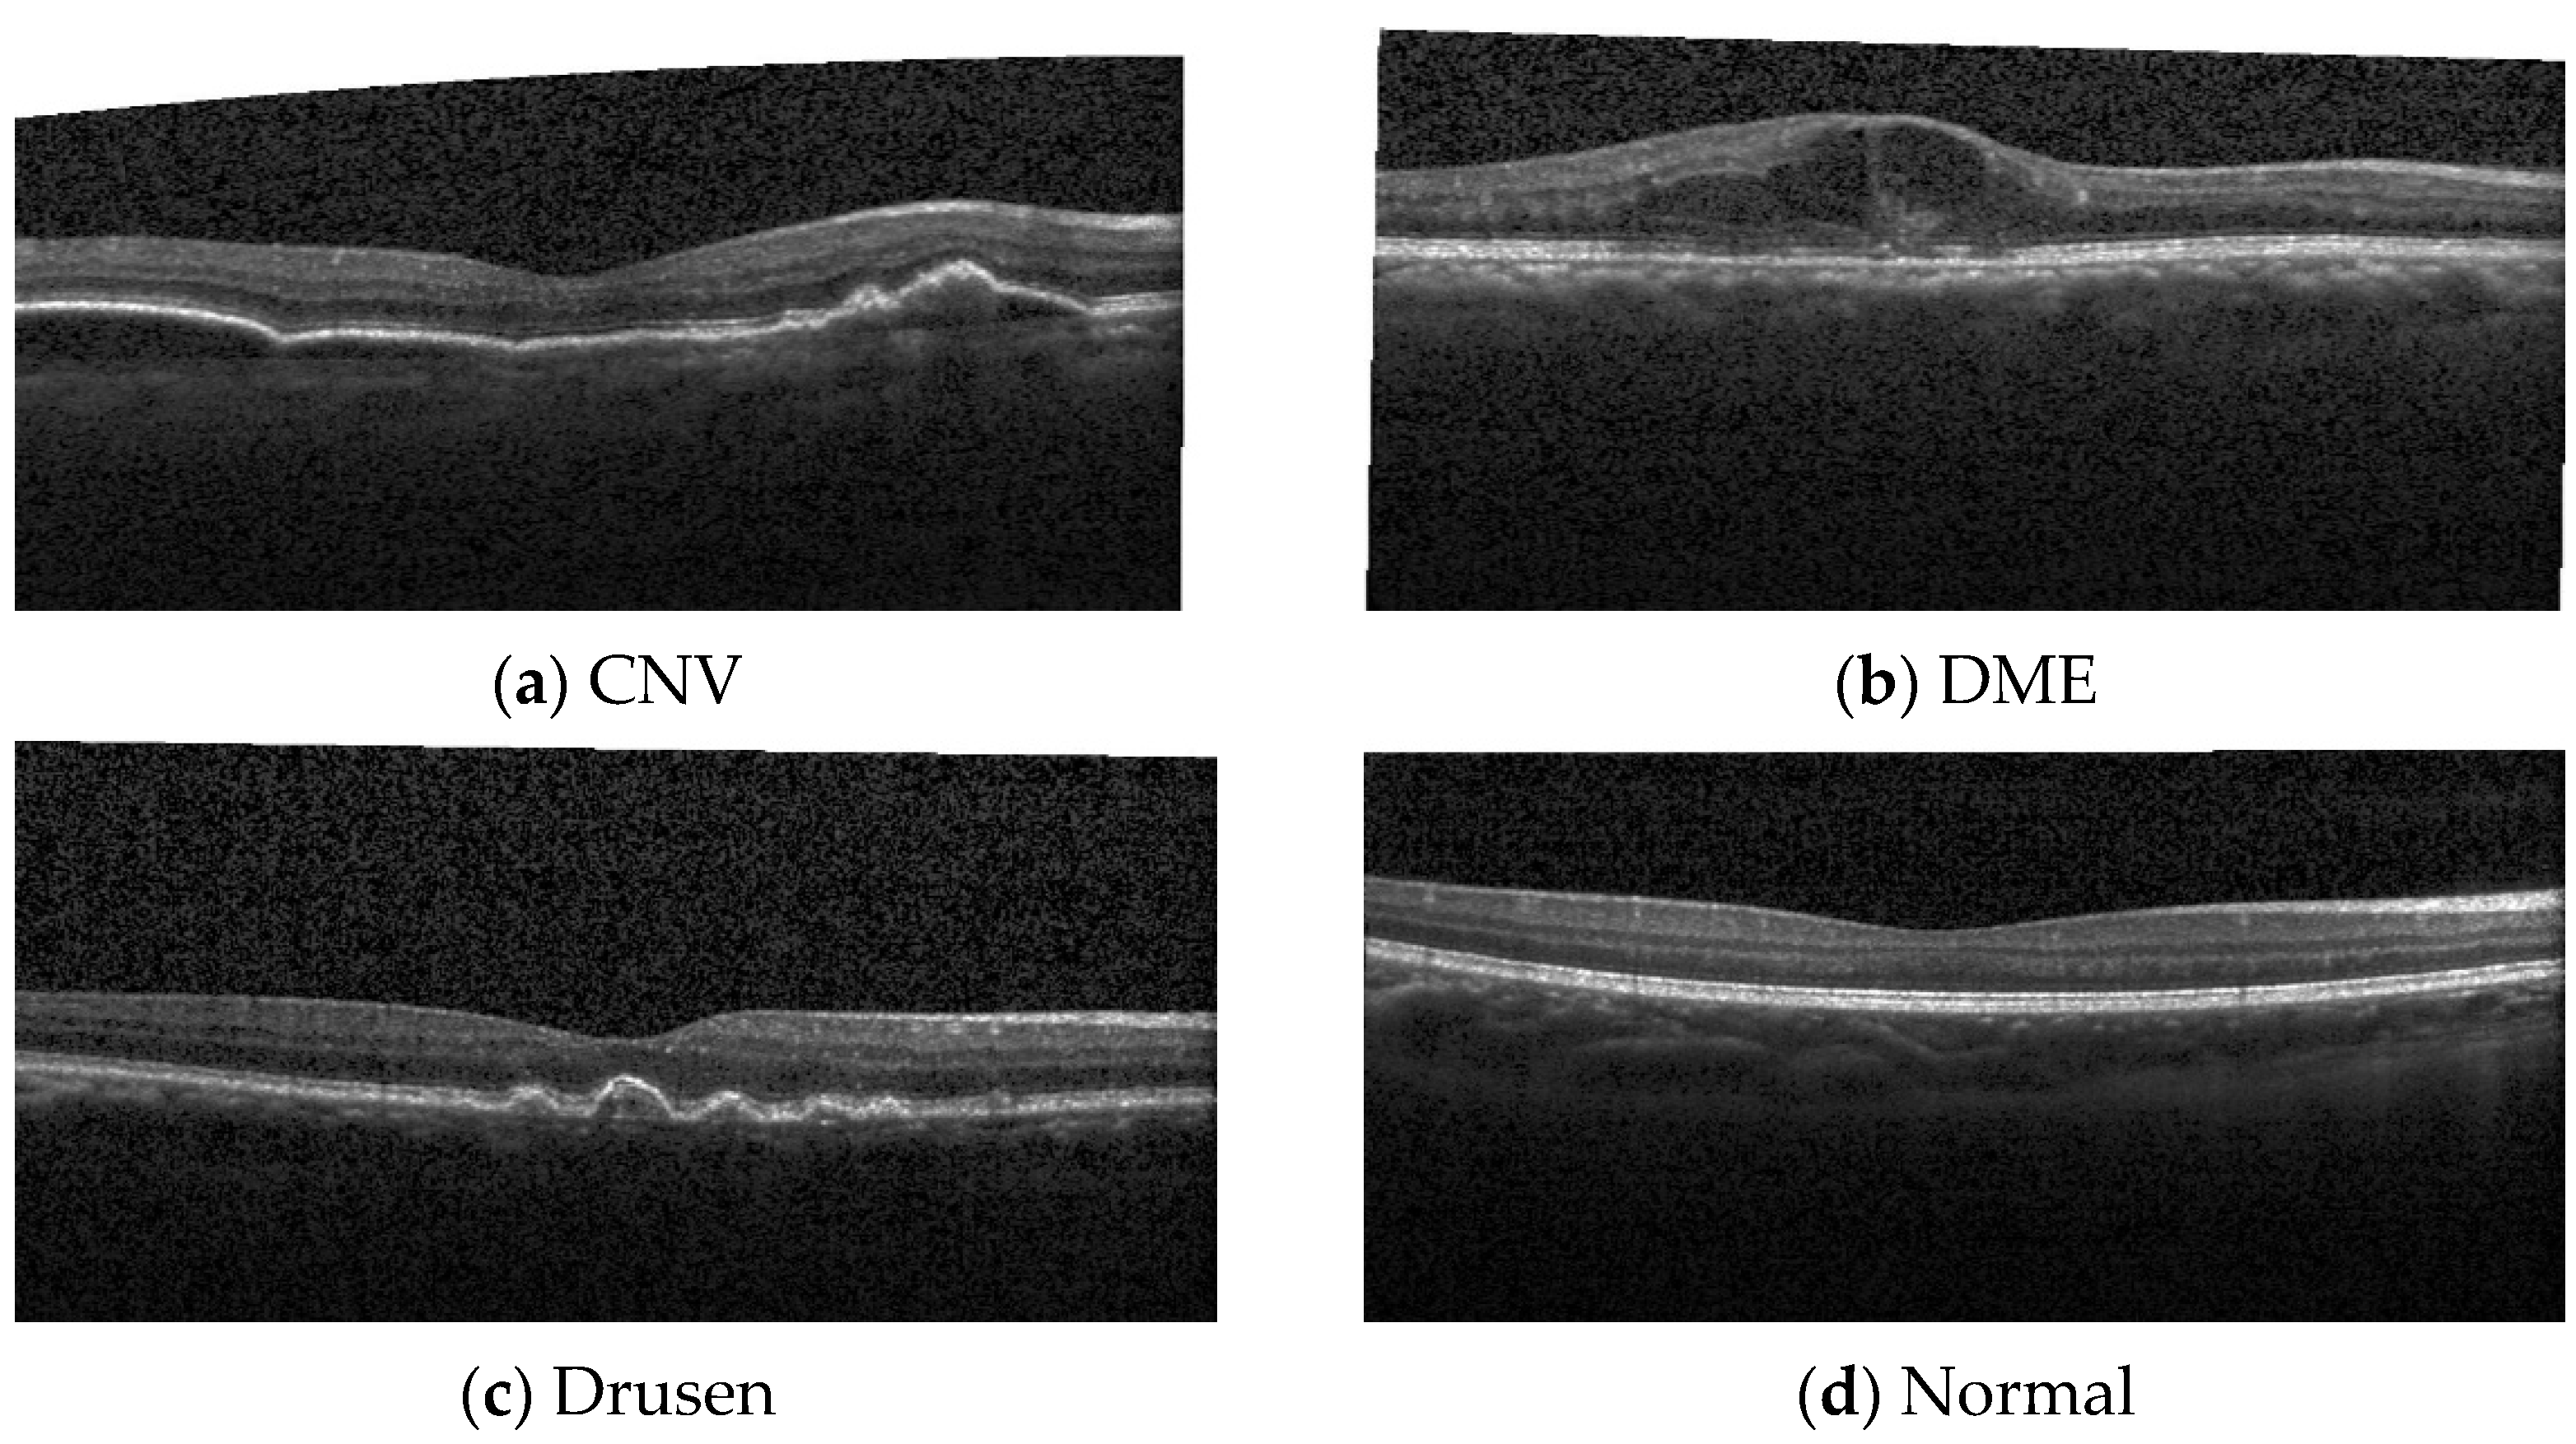
3.1.1. First OCT Image Dataset (DB1)
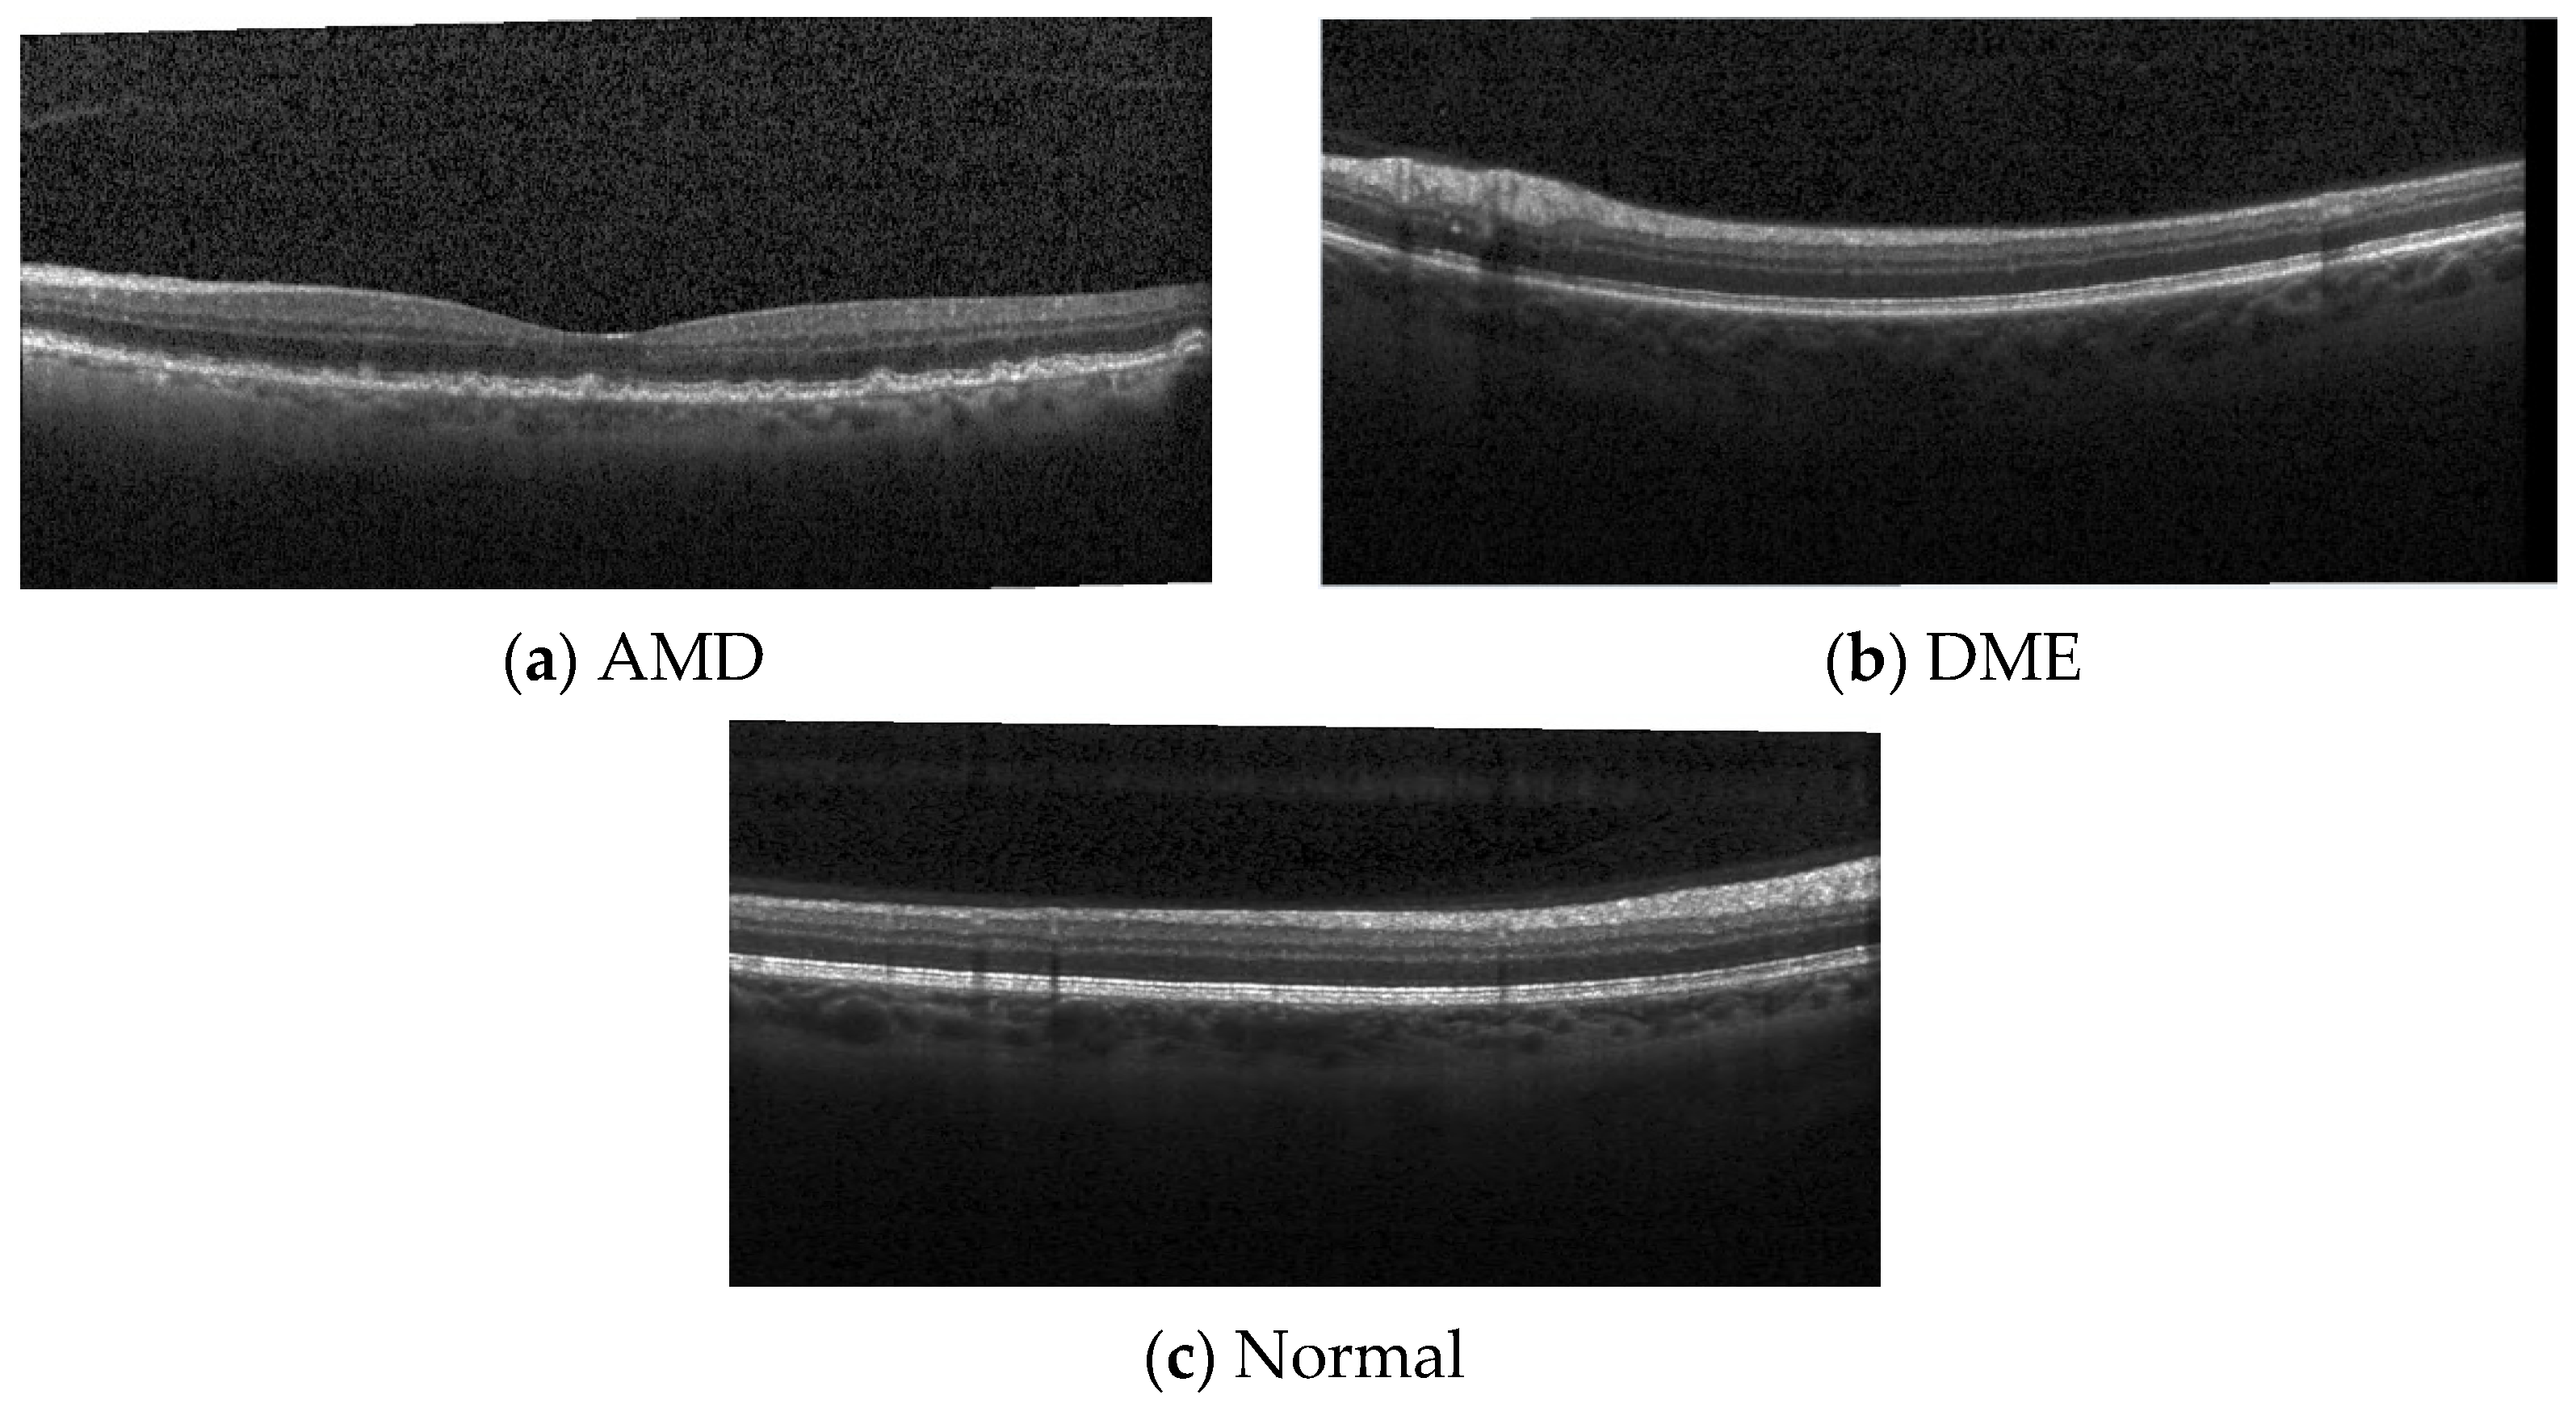
3.1.2. Second Image Dataset (DB2)
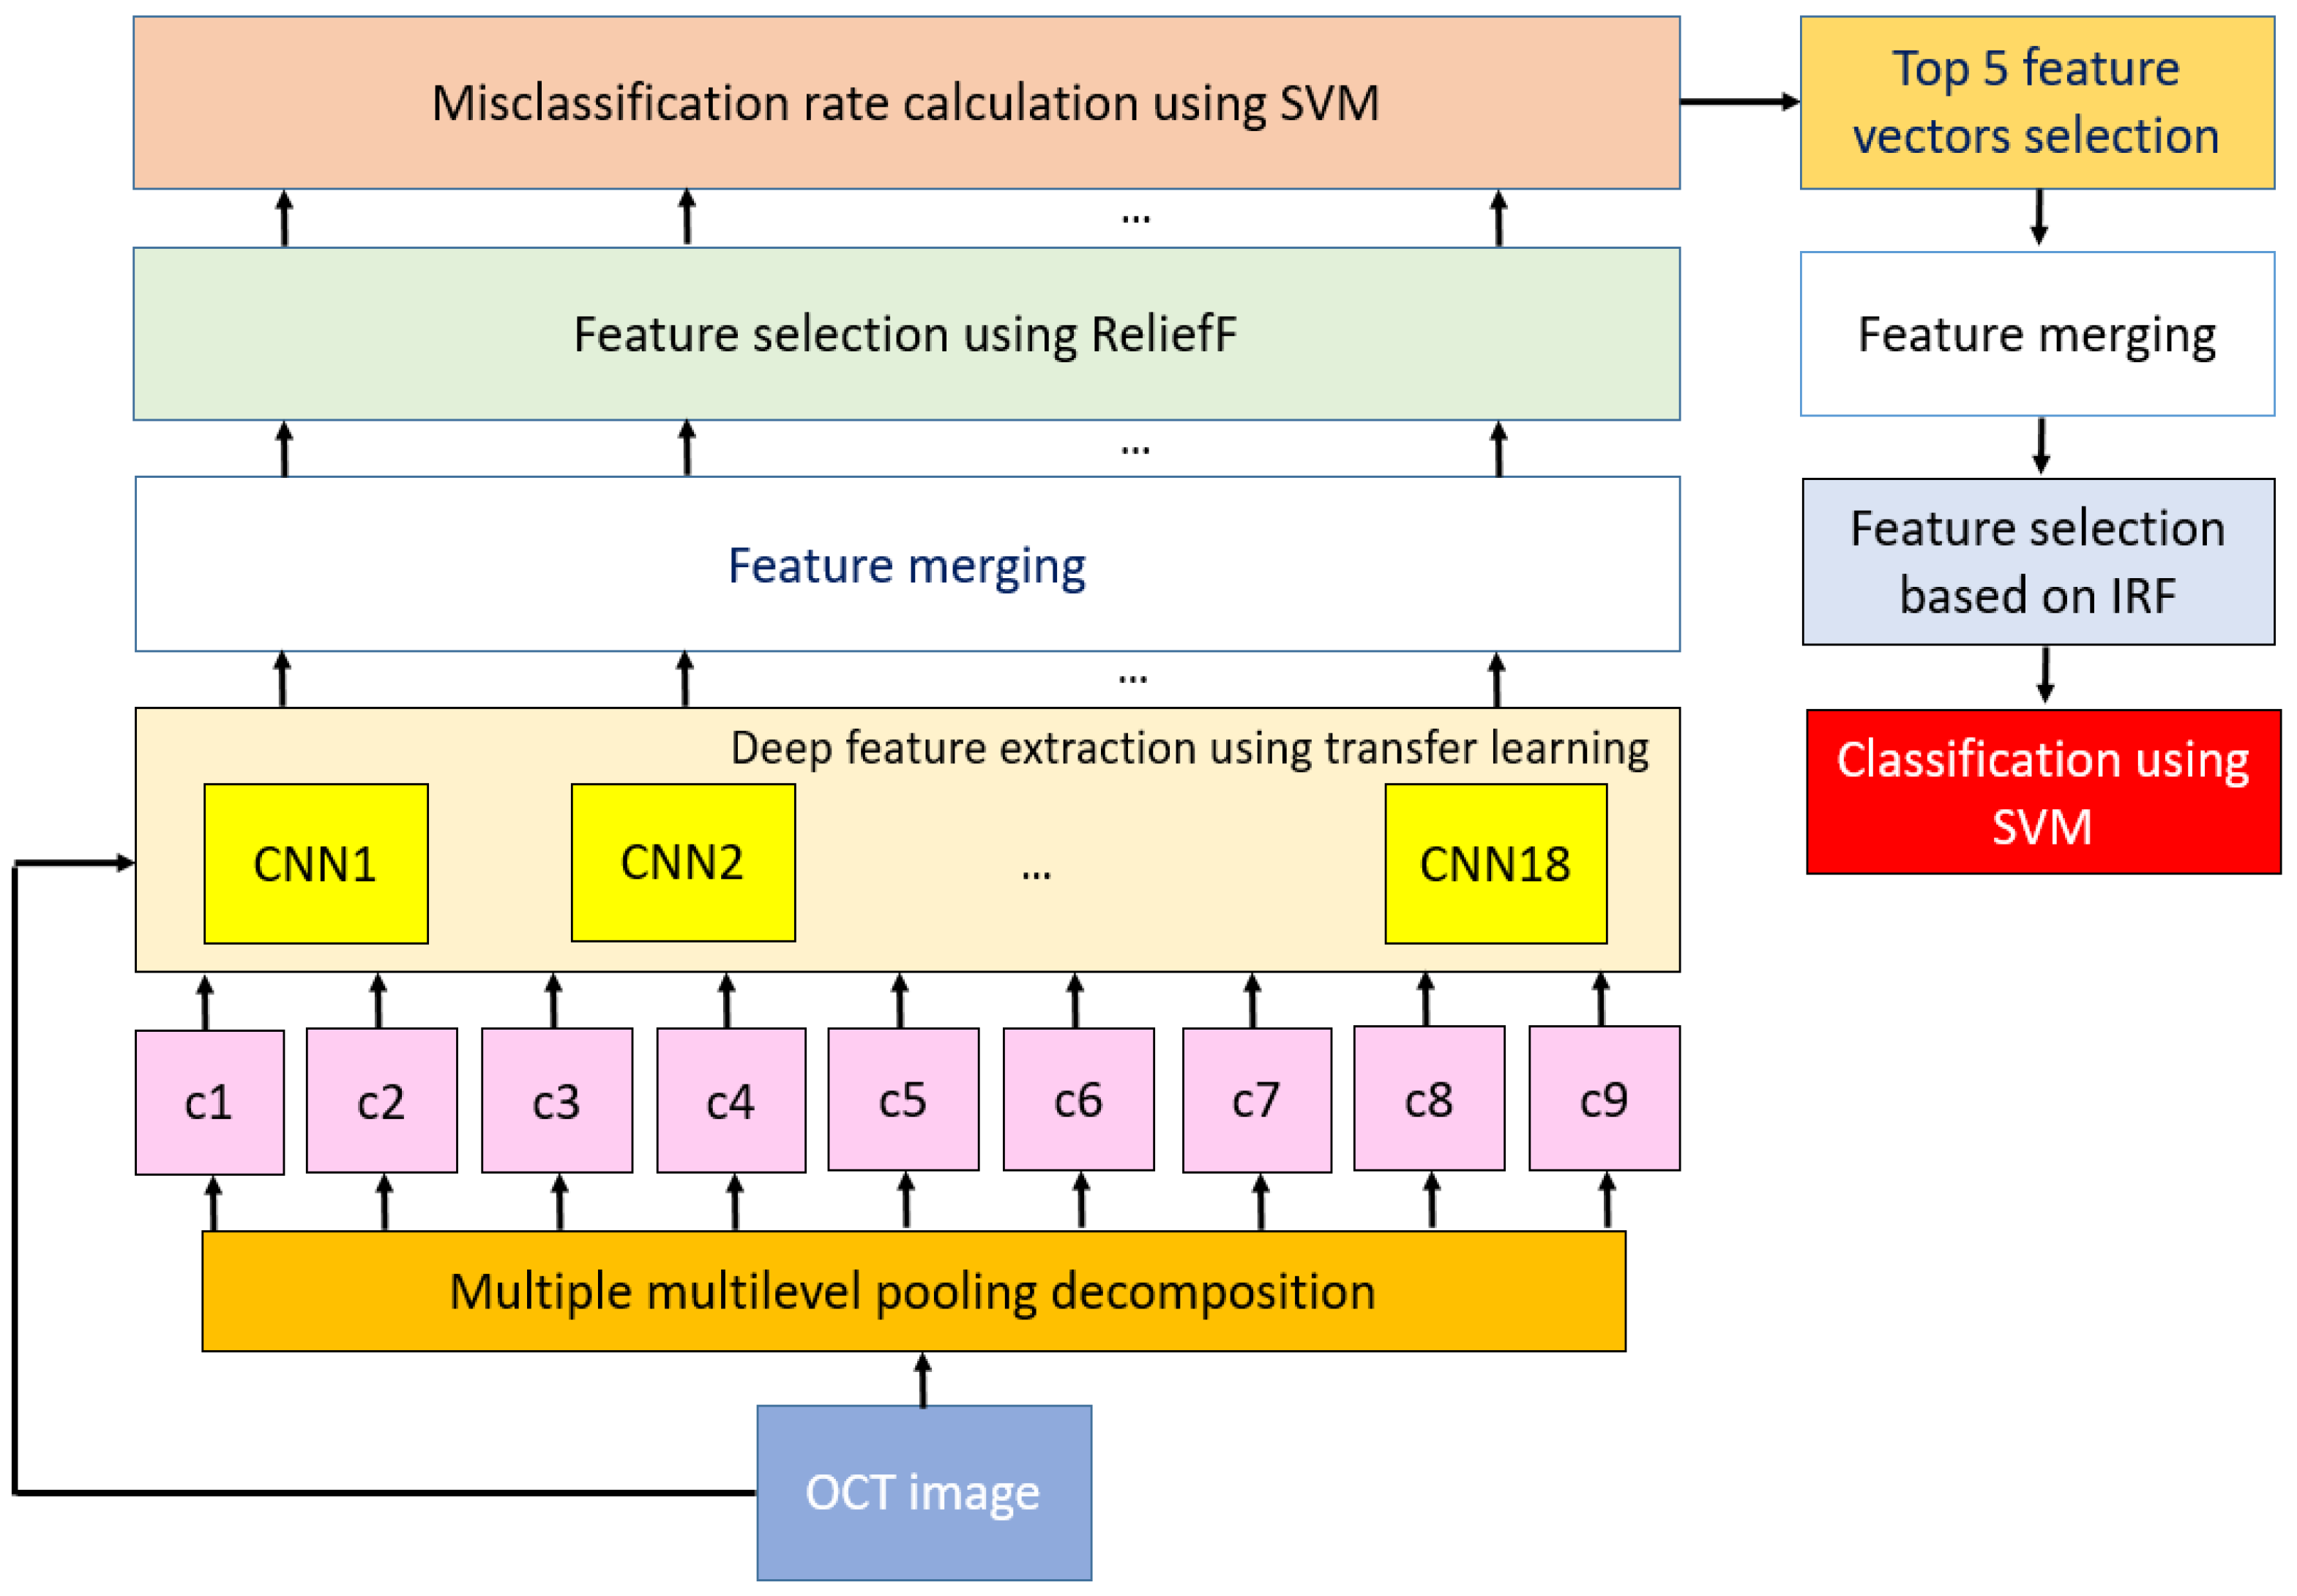
3.2. The Proposed Framework
| Algorithm 1: Pseudocode of proposed framework |
| Input: OCT images |
| Output: Results |
| 01: Load OCT image dataset |
| 02: for k = 1 to 1000 do |
| 03: Read each image |
| 04: for j = 1 to 18 do//Feature generation using 18 pre-trained networks |
| 05: //Extract deep features using jth CNN |
| 06: ;//Counter defining to calculate the number of features. |
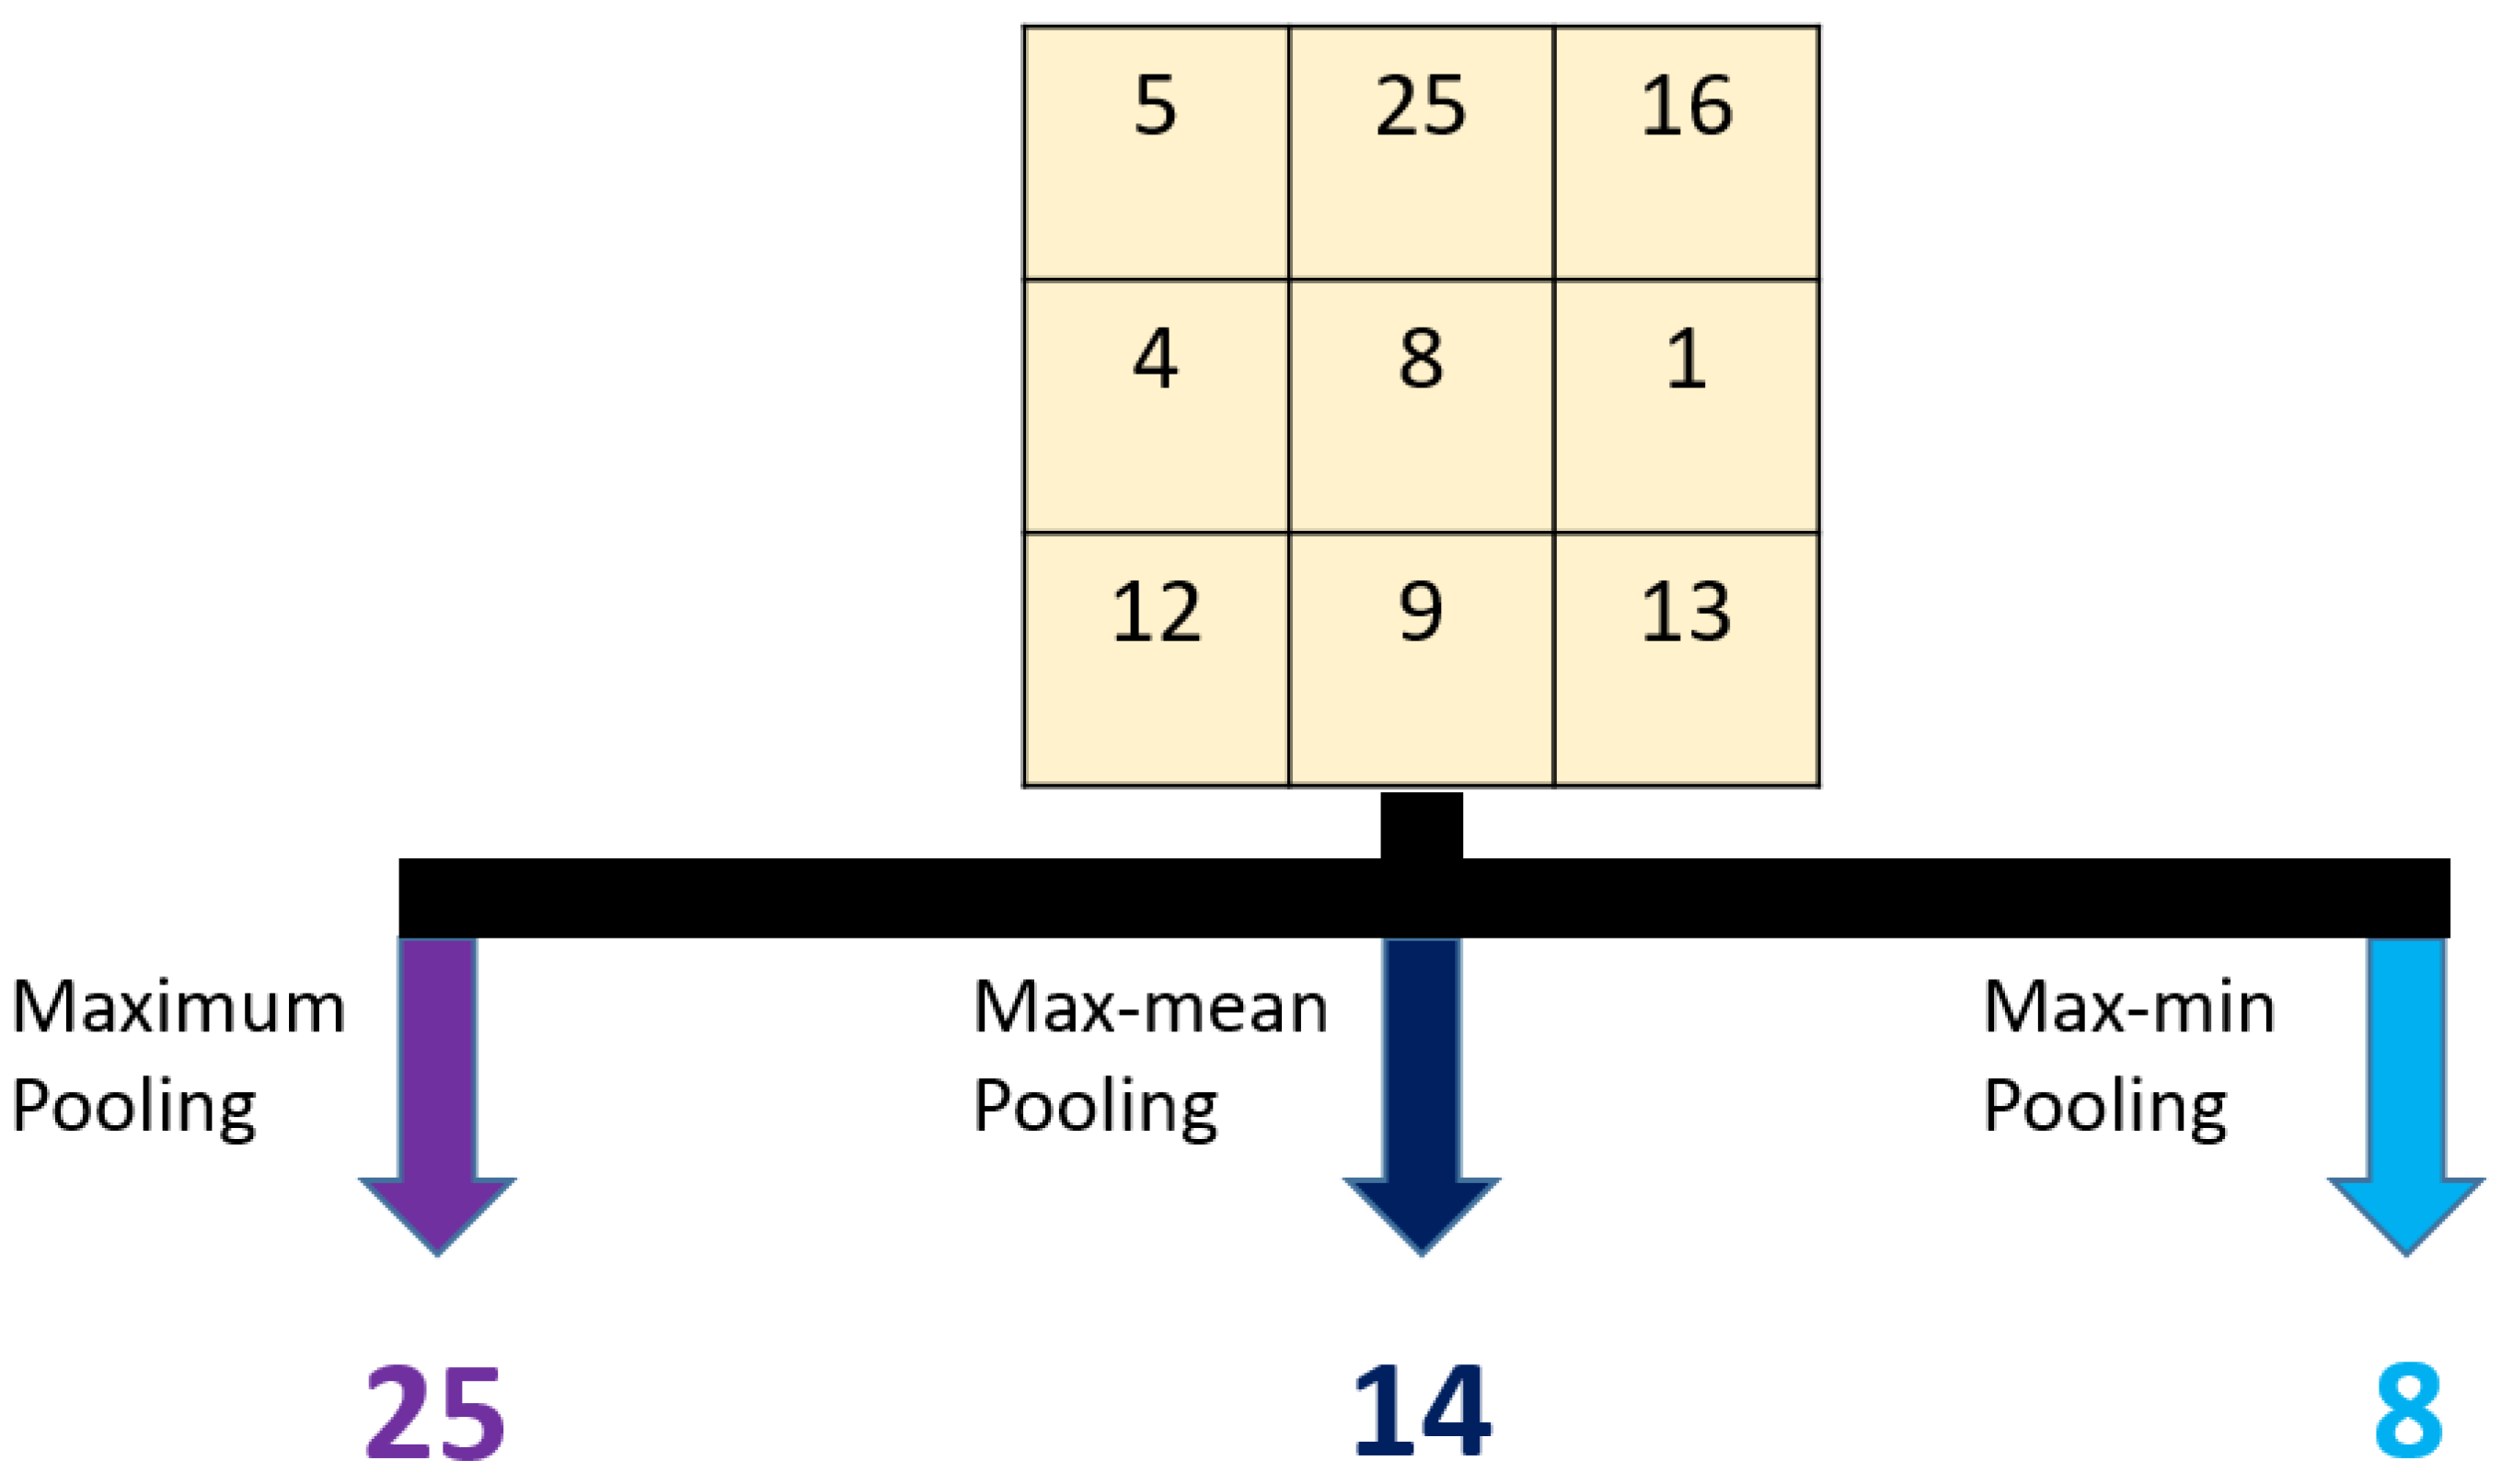
| 07: for i = 1 to 3 do//Creating multilevel feature generation network |
| 08: //Apply maximum pooling with 3 × 3 sized blocks |
| 09: //Apply max-mean pooling |
| 10: //Apply max-min pooling |
| 11: |
| //In Line 11, defines concatenation operator and pre-trained CNN generates 3000 features from compressed images. |
| 12: |
| 13: //Compress using images |
| 14: |
| 15: end for i |
| 16: end for j |
| 17: end for k |
| 18: for j = 1 to 18 do |
| 19: Select the best 1000 features () from with a length of 10,000. |
| 20: Calculate loss values deploying SVM classifier with 5-fold cross-validation |
| 21: end for j |
| 22: Select the best five features using calculated loss values. We have used quadratic support vector machine (QSVM) as a loss value generator in this phase. An error array with a length of 18 is created using this classifier. The optimal five CNNs are chosen using the created loss array. The minimum loss valued CNNs is the optimal performing CNNs. |
| 23: Concatenate these features and obtain 5000 sized feature vector. |
| 24: Apply IRF to 5000 sized feature vector for selecting the best feature vector.25: Classify the selected feature vector using SVM and obtain predicted results. |
3.2.1. Deep Feature Extraction
3.2.2. Feature Selection Using Iterative ReliefF
3.2.3. Classification
- Kernel: Quadratic (2nd degree polynomial),
- Kernel scale: Auto,
- Box constraint: 1,
- Standardize: True.
4. Results
- Feature extraction:
- Feature selection:
- Classification:
- Total:
5. Discussion
- A cognitive transfer learning-based image classification framework is presented.
- An intelligent feature generator is described using 18 pre-trained CNNs and novel multilevel and multiple pooling-based compression methods. Moreover, this feature generator is designed as a learning model. Therefore, it has the best feature vector selection ability.
- The proposed framework is a simple and parametric classification model. It can be extended using more feature extractors, other classifiers, and feature selectors.
- A general computer vision framework is presented with a ten-fold cross-validation strategy. Hence, our developed model is accurate and robust.
- This framework is an extendable framework. By using other effective methods, new-generation image classification methods can be proposed.
- This framework is a fast-learning model since the used CNNs are used in the feedforward mode to extract the features.
- Two OCT image datasets are employed to verify general image classification capability.
6. Conclusions
Author Contributions
Funding
Institutional Review Board Statement
Informed Consent Statement
Data Availability Statement
Conflicts of Interest
References
- Wang, D.; Wang, L. On OCT image classification via deep learning. IEEE Photonics J. 2019, 11, 1–14. [Google Scholar] [CrossRef]
- Rong, Y.; Xiang, D.; Zhu, W.; Yu, K.; Shi, F.; Fan, Z.; Chen, X. Surrogate-assisted retinal OCT image classification based on convolutional neural networks. IEEE J. Biomed. Health Inform. 2018, 23, 253–263. [Google Scholar] [CrossRef] [PubMed]
- Rasti, R.; Rabbani, H.; Mehridehnavi, A.; Hajizadeh, F. Macular OCT classification using a multi-scale convolutional neural network ensemble. IEEE Trans. Med. Imaging 2017, 37, 1024–1034. [Google Scholar] [CrossRef]
- Awais, M.; Müller, H.; Tang, T.B.; Meriaudeau, F. Classification of sd-oct images using a deep learning approach. In Proceedings of the 2017 IEEE International Conference on Signal and Image Processing Applications (ICSIPA), Kuching, Malaysia, 12–14 September 2017; pp. 489–492. [Google Scholar]
- Ambati, J.; Atkinson, J.P.; Gelfand, B.D. Immunology of age-related macular degeneration. Nat. Rev. Immunol. 2013, 13, 438–451. [Google Scholar] [CrossRef] [PubMed] [Green Version]
- Friedman, D.S.; O’Colmain, B.J.; Munoz, B.; Tomany, S.C.; McCarty, C.; De Jong, P.; Nemesure, B.; Mitchell, P.; Kempen, J. Prevalence of age-related macular degeneration in the United States. Arch. Ophthalmol. 2004, 122, 564–572. [Google Scholar]
- Lang, A.; Carass, A.; Hauser, M.; Sotirchos, E.S.; Calabresi, P.A.; Ying, H.S.; Prince, J.L. Retinal layer segmentation of macular OCT images using boundary classification. Biomed. Opt. Express 2013, 4, 1133–1152. [Google Scholar] [CrossRef] [Green Version]
- Lee, C.S.; Baughman, D.M.; Lee, A.Y. Deep learning is effective for classifying normal versus age-related macular degeneration OCT images. Ophthalmol. Retin. 2017, 1, 322–327. [Google Scholar] [CrossRef]
- Raja, H.; Akram, M.U.; Shaukat, A.; Khan, S.A.; Alghamdi, N.; Khawaja, S.G.; Nazir, N. Extraction of retinal layers through convolution neural network (CNN) in an OCT image for glaucoma diagnosis. J. Digit. Imaging 2020, 33, 1428–1442. [Google Scholar] [CrossRef]
- Wang, J. OCT Image Recognition of Cardiovascular Vulnerable Plaque Based on CNN. IEEE Access 2020, 8, 140767–140776. [Google Scholar] [CrossRef]
- Apostolopoulos, S.; Ciller, C.; De Zanet, S.; Wolf, S.; Sznitman, R. RetiNet: Automatic AMD identification in OCT volumetric data. Investig. Ophthalmol. Vis. Sci. 2017, 58, 387. [Google Scholar]
- Perez, L.; Wang, J. The effectiveness of data augmentation in image classification using deep learning. arXiv 2017, arXiv:1712.04621. [Google Scholar]
- Affonso, C.; Rossi, A.L.D.; Vieira, F.H.A.; de Leon Ferreira, A.C.P. Deep learning for biological image classification. Expert Syst. Appl. 2017, 85, 114–122. [Google Scholar] [CrossRef] [Green Version]
- Alzubaidi, L.; Al-Amidie, M.; Al-Asadi, A.; Humaidi, A.J.; Al-Shamma, O.; Fadhel, M.A.; Zhang, J.; Santamaría, J.; Duan, Y. Novel Transfer Learning Approach for Medical Imaging with Limited Labeled Data. Cancers 2021, 13, 1590. [Google Scholar] [CrossRef] [PubMed]
- Lin, G.-S.; Tu, J.-C.; Lin, J.-Y. Keyword Detection Based on RetinaNet and Transfer Learning for Personal Information Protection in Document Images. Appl. Sci. 2021, 11, 9528. [Google Scholar] [CrossRef]
- Vapnik, V. The support vector method of function estimation. In Nonlinear Modeling; Springer: Berlin, Germany, 1998; pp. 55–85. [Google Scholar]
- Goodfellow, I.; Bengio, Y.; Courville, A.; Bengio, Y. Deep Learning; MIT Press Cambridge: Cambridge, MA, USA, 2016; Volume 1. [Google Scholar]
- Faust, O.; Acharya, U.R. Automated classification of five arrhythmias and normal sinus rhythm based on RR interval signals. Expert Syst. Appl. 2021, 181, 115031. [Google Scholar] [CrossRef]
- Sharma, M.; Rajput, J.S.; Tan, R.S.; Acharya, U.R. Automated Detection of Hypertension Using Physiological Signals: A Review. Int. J. Environ. Res. Public Health 2021, 18, 5838. [Google Scholar] [CrossRef] [PubMed]
- Gudigar, A.; Raghavendra, U.; Samanth, J.; Gangavarapu, M.R.; Kudva, A.; Paramasivam, G.; Nayak, K.; Tan, R.-S.; Molinari, F.; Ciaccio, E.J. Automated detection of chronic kidney disease using image fusion and graph embedding techniques with ultrasound images. Biomed. Signal Process. Control 2021, 68, 102733. [Google Scholar] [CrossRef]
- Wang, J.; Deng, G.; Li, W.; Chen, Y.; Gao, F.; Liu, H.; He, Y.; Shi, G. Deep learning for quality assessment of retinal OCT images. Biomed. Opt. Express 2019, 10, 6057–6072. [Google Scholar] [CrossRef] [PubMed]
- Rajagopalan, N.; Narasimhan, V.; Vinjimoor, S.K.; Aiyer, J. Deep CNN framework for retinal disease diagnosis using optical coherence tomography images. J. Ambient. Intell. Humaniz. Comput. 2021, 12, 7569–7580. [Google Scholar] [CrossRef]
- Alsaih, K.; Lemaitre, G.; Rastgoo, M.; Massich, J.; Sidibé, D.; Meriaudeau, F. Machine learning techniques for diabetic macular edema (DME) classification on SD-OCT images. Biomed. Eng. Online 2017, 16, 68. [Google Scholar] [CrossRef] [Green Version]
- Sunija, A.; Kar, S.; Gayathri, S.; Gopi, V.P.; Palanisamy, P. Octnet: A lightweight cnn for retinal disease classification from optical coherence tomography images. Comput. Methods Programs Biomed. 2021, 200, 105877. [Google Scholar]
- Das, V.; Dandapat, S.; Bora, P.K. Multi-scale deep feature fusion for automated classification of macular pathologies from OCT images. Biomed. Signal Process. Control 2019, 54, 101605. [Google Scholar] [CrossRef]
- Lemaitre, G.; Rastgoo, M.; Massich, J.; Sankar, S.; Mériaudeau, F.; Sidibé, D. Classification of SD-OCT Volumes with LBP: Application to DME Detection; Ophthalmic Medical Image Analysis International Workshop; Springer: Berlin/Heidelberg, Germany, 2015. [Google Scholar]
- Tayal, A.; Gupta, J.; Solanki, A.; Bisht, K.; Nayyar, A.; Masud, M. DL-CNN-based approach with image processing techniques for diagnosis of retinal diseases. Multimed. Syst. 2021, 1–22. [Google Scholar] [CrossRef]
- Srinivasan, P.P.; Kim, L.A.; Mettu, P.S.; Cousins, S.W.; Comer, G.M.; Izatt, J.A.; Farsiu, S. Fully automated detection of diabetic macular edema and dry age-related macular degeneration from optical coherence tomography images. Biomed. Opt. Express 2014, 5, 3568–3577. [Google Scholar] [CrossRef] [PubMed] [Green Version]
- Hussain, M.A.; Bhuiyan, A.D.; Luu, C.; Theodore Smith, R.H.; Guymer, R.; Ishikawa, H.S.; Schuman, J.; Ramamohanarao, K. Classification of healthy and diseased retina using SD-OCT imaging and Random Forest algorithm. PLoS ONE 2018, 13, e0198281. [Google Scholar] [CrossRef]
- Bishop, T.R.; von Hinke, S.; Hollingsworth, B.; Lake, A.A.; Brown, H.; Burgoine, T. Automatic classification of takeaway food outlet cuisine type using machine (deep) learning. Mach. Learn. Appl. 2021, 6, 100106. [Google Scholar] [CrossRef]
- Yu, S.; Feng, X.; Wang, B.; Dun, H.; Zhang, S.; Zhang, R.; Huang, X. Automatic Classification of Cervical Cells Using Deep Learning Method. IEEE Access 2021, 9, 32559–32568. [Google Scholar] [CrossRef]
- Öztürk, Ş.; Özkaya, U. Residual LSTM layered CNN for classification of gastrointestinal tract diseases. J. Biomed. Inform. 2021, 113, 103638. [Google Scholar] [CrossRef]
- Kermany, D.; Zhang, K.; Goldbaum, M. Large dataset of labeled optical coherence tomography (oct) and chest X-ray images. Cell 2018, 172, 1122–1131. [Google Scholar] [CrossRef]
- Kermany, D.S.; Goldbaum, M.; Cai, W.; Valentim, C.C.; Liang, H.; Baxter, S.L.; McKeown, A.; Yang, G.; Wu, X.; Yan, F. Identifying medical diagnoses and treatable diseases by image-based deep learning. Cell 2018, 172, 1122–1131.e9. [Google Scholar] [CrossRef]
- Kononenko, I. Estimating attributes: Analysis and extensions of RELIEF. In Proceedings of the European Conference on Machine Learning, Catania, Italy, 6–8 April 1994; pp. 171–182. [Google Scholar]
- Sabour, S.; Frosst, N.; Hinton, G.E. Dynamic routing between capsules. arXiv 2017, arXiv:1710.09829. [Google Scholar]
- Kira, K.; Rendell, L.A. The feature selection problem: Traditional methods and a new algorithm. In Proceedings of the Tenth National Conference on Artificial Intelligence (AAAI), San Jose, CA, USA, 12–16 July 1992; pp. 129–134. [Google Scholar]
- Kira, K.; Rendell, L.A. A practical approach to feature selection. In Machine Learning Proceedings 1992; Elsevier: Aberdeen, Scotland, UK, 1992; pp. 249–256. [Google Scholar]
- Yaman, O.; Tuncer, T.; Tasar, B. DES-Pat: A novel DES pattern-based propeller recognition method using underwater acoustical sounds. Appl. Acoust. 2021, 175, 107859. [Google Scholar] [CrossRef]
- Choubey, D.K.; Tripathi, S.; Kumar, P.; Shukla, V.; Dhandhania, V.K. Classification of Diabetes by Kernel based SVM with PSO. Recent Adv. Comput. Sci. Commun. 2021, 14, 1242–1255. [Google Scholar] [CrossRef]
- Fang, L.; Wang, C.; Li, S.; Rabbani, H.; Chen, X.; Liu, Z. Attention to lesion: Lesion-aware convolutional neural network for retinal optical coherence tomography image classification. IEEE Trans. Med. Imaging 2019, 38, 1959–1970. [Google Scholar] [CrossRef]
- He, X.; Fang, L.; Rabbani, H.; Chen, X.; Liu, Z. Retinal optical coherence tomography image classification with label smoothing generative adversarial network. Neurocomputing 2020, 405, 37–47. [Google Scholar] [CrossRef]
- Seeböck, P.; Waldstein, S.M.; Klimscha, S.; Bogunovic, H.; Schlegl, T.; Gerendas, B.S.; Donner, R.; Schmidt-Erfurth, U.; Langs, G. Unsupervised identification of disease marker candidates in retinal OCT imaging data. IEEE Trans. Med. Imaging 2018, 38, 1037–1047. [Google Scholar] [CrossRef] [Green Version]
- Alqudah, A.M. AOCT-NET: A convolutional network automated classification of multiclass retinal diseases using spectral-domain optical coherence tomography images. Med. Biol. Eng. Comput. 2020, 58, 41–53. [Google Scholar] [CrossRef] [PubMed]
- Huang, L.; He, X.; Fang, L.; Rabbani, H.; Chen, X. Automatic classification of retinal optical coherence tomography images with layer guided convolutional neural network. IEEE Signal Process. Lett. 2019, 26, 1026–1030. [Google Scholar] [CrossRef]
- Fang, L.; Jin, Y.; Huang, L.; Guo, S.; Zhao, G.; Chen, X. Iterative fusion convolutional neural networks for classification of optical coherence tomography images. J. Vis. Commun. Image Represent. 2019, 59, 327–333. [Google Scholar] [CrossRef]
- Saraiva, A.A.; Santos, D.; Pimentel, P.; Sousa, J.V.M.; Ferreira, N.M.F.; Neto, J.d.E.B.; Soares, S.; Valente, A. Classification of Optical Coherence Tomography using Convolutional Neural Networks. In Proceedings of the 11th International Conference on Bioinformatics Models, Methods and Algorithms, Valletta, Malta, 24–26 February 2020; pp. 168–175. [Google Scholar] [CrossRef]


| Study | Method | Purpose | Results (%) |
|---|---|---|---|
| Rajagopalan et al. [22] | CNN | Detecting DMD, DME and normal using OCT images | Acc: 95.70 |
| Alsaih et al. [23] | Local binary patterns and histograms of oriented gradients | Classification of DME and normal using SD-OCT images | Spe: 87.50 Sen: 87.50 |
| Sunija et al. [24] | CNN | Classification of CNV, DME, Drusen and normal using OCT images | Acc: 99.69 |
| Das et al. [25] | CNN | Classification of DME, Drusen, CNV and normal using OCT images | Acc: 99.60 |
| Lemaitre et al. [26] | Local binary patterns | Identification of patients with DME versus normal subjects with SD-OCT images | Spe: 75.00 Sen: 87.50 |
| Rong et al. [2] | CNN | Classification of AMD, DME and normal using OCT images | Acc: 100.0 |
| Tayal et al. [27] | CNN | Identification of CNV, DME, Drusen and normal using OCT images | Acc: 96.50 |
| Srinivasan et al. [28] | CNN | Classification of normal, AMD and DME with SD-OCT images | Acc: 100.0 AMD 100.0 DME 86.67 normal |
| Hussain et al. [29] | Random forest technique | Classification of normal, AMD and DME with SD-OCT images | Acc: 97.33 for two classes case (DME and normal) Acc: 95.58 for three classes case (DME, AMD, and normal) |
| Phase | Method | Parameter |
|---|---|---|
| Feature extraction | Multiple multilevel pooling decomposition | Number of level: 3 Pooling methods: maximum, max-mean and max-min Number of compressed image: 9 |
| Deep feature generation and feature merging | 18 pre-trained convolutional neural networks are used to extract deep features from fully connected layers of these networks. 18 feature vectors with a length of 10,000 are created | |
| Feature selection using ReliefF | The top 1000 features of 10,000 features generated are chosen. | |
| Loss value calculation | Quadratic SVM | |
| Top feature vectors selection | The top five feature vectors have been selected. | |
| Feature selection | Iterative ReliefF | Range of iteration: [100, 1000] Loss value generator: Quadratic SVM |
| Classification | SVM | Kernel function: Polynomial Polynomial order: 2 Kernel scale: Auto Box constraint: 1 Standardize: True |
| No. | CNN | FE Layer | No. | CNN | FE Layer |
|---|---|---|---|---|---|
| 1 | ResNet18 | fc1000 | 10 | NasNetMobile | predictions |
| 2 | ResNet50 | fc1000 | 11 | NasNetLarge | predictions |
| 3 | ResNet101 | fc1000 | 12 | DenseNet201 | fc1000 |
| 4 | DarkNet19 | avg1 | 13 | InceptionV3 | predictions |
| 5 | MobileNetV2 | Logits | 14 | InceptionResNetV2 | predictions |
| 6 | DarkNet53 | conv53 | 15 | GoogLeNet | loss3-classifier |
| 7 | Xception | predictions | 16 | AlexNet | fc8 |
| 8 | EfficientNet b0 | MatMul | 17 | VGG16 | fc8 |
| 9 | ShuffleNet | node_202 | 18 | VGG19 | fc8 |
| Overall Result | DB1 | DB2 |
|---|---|---|
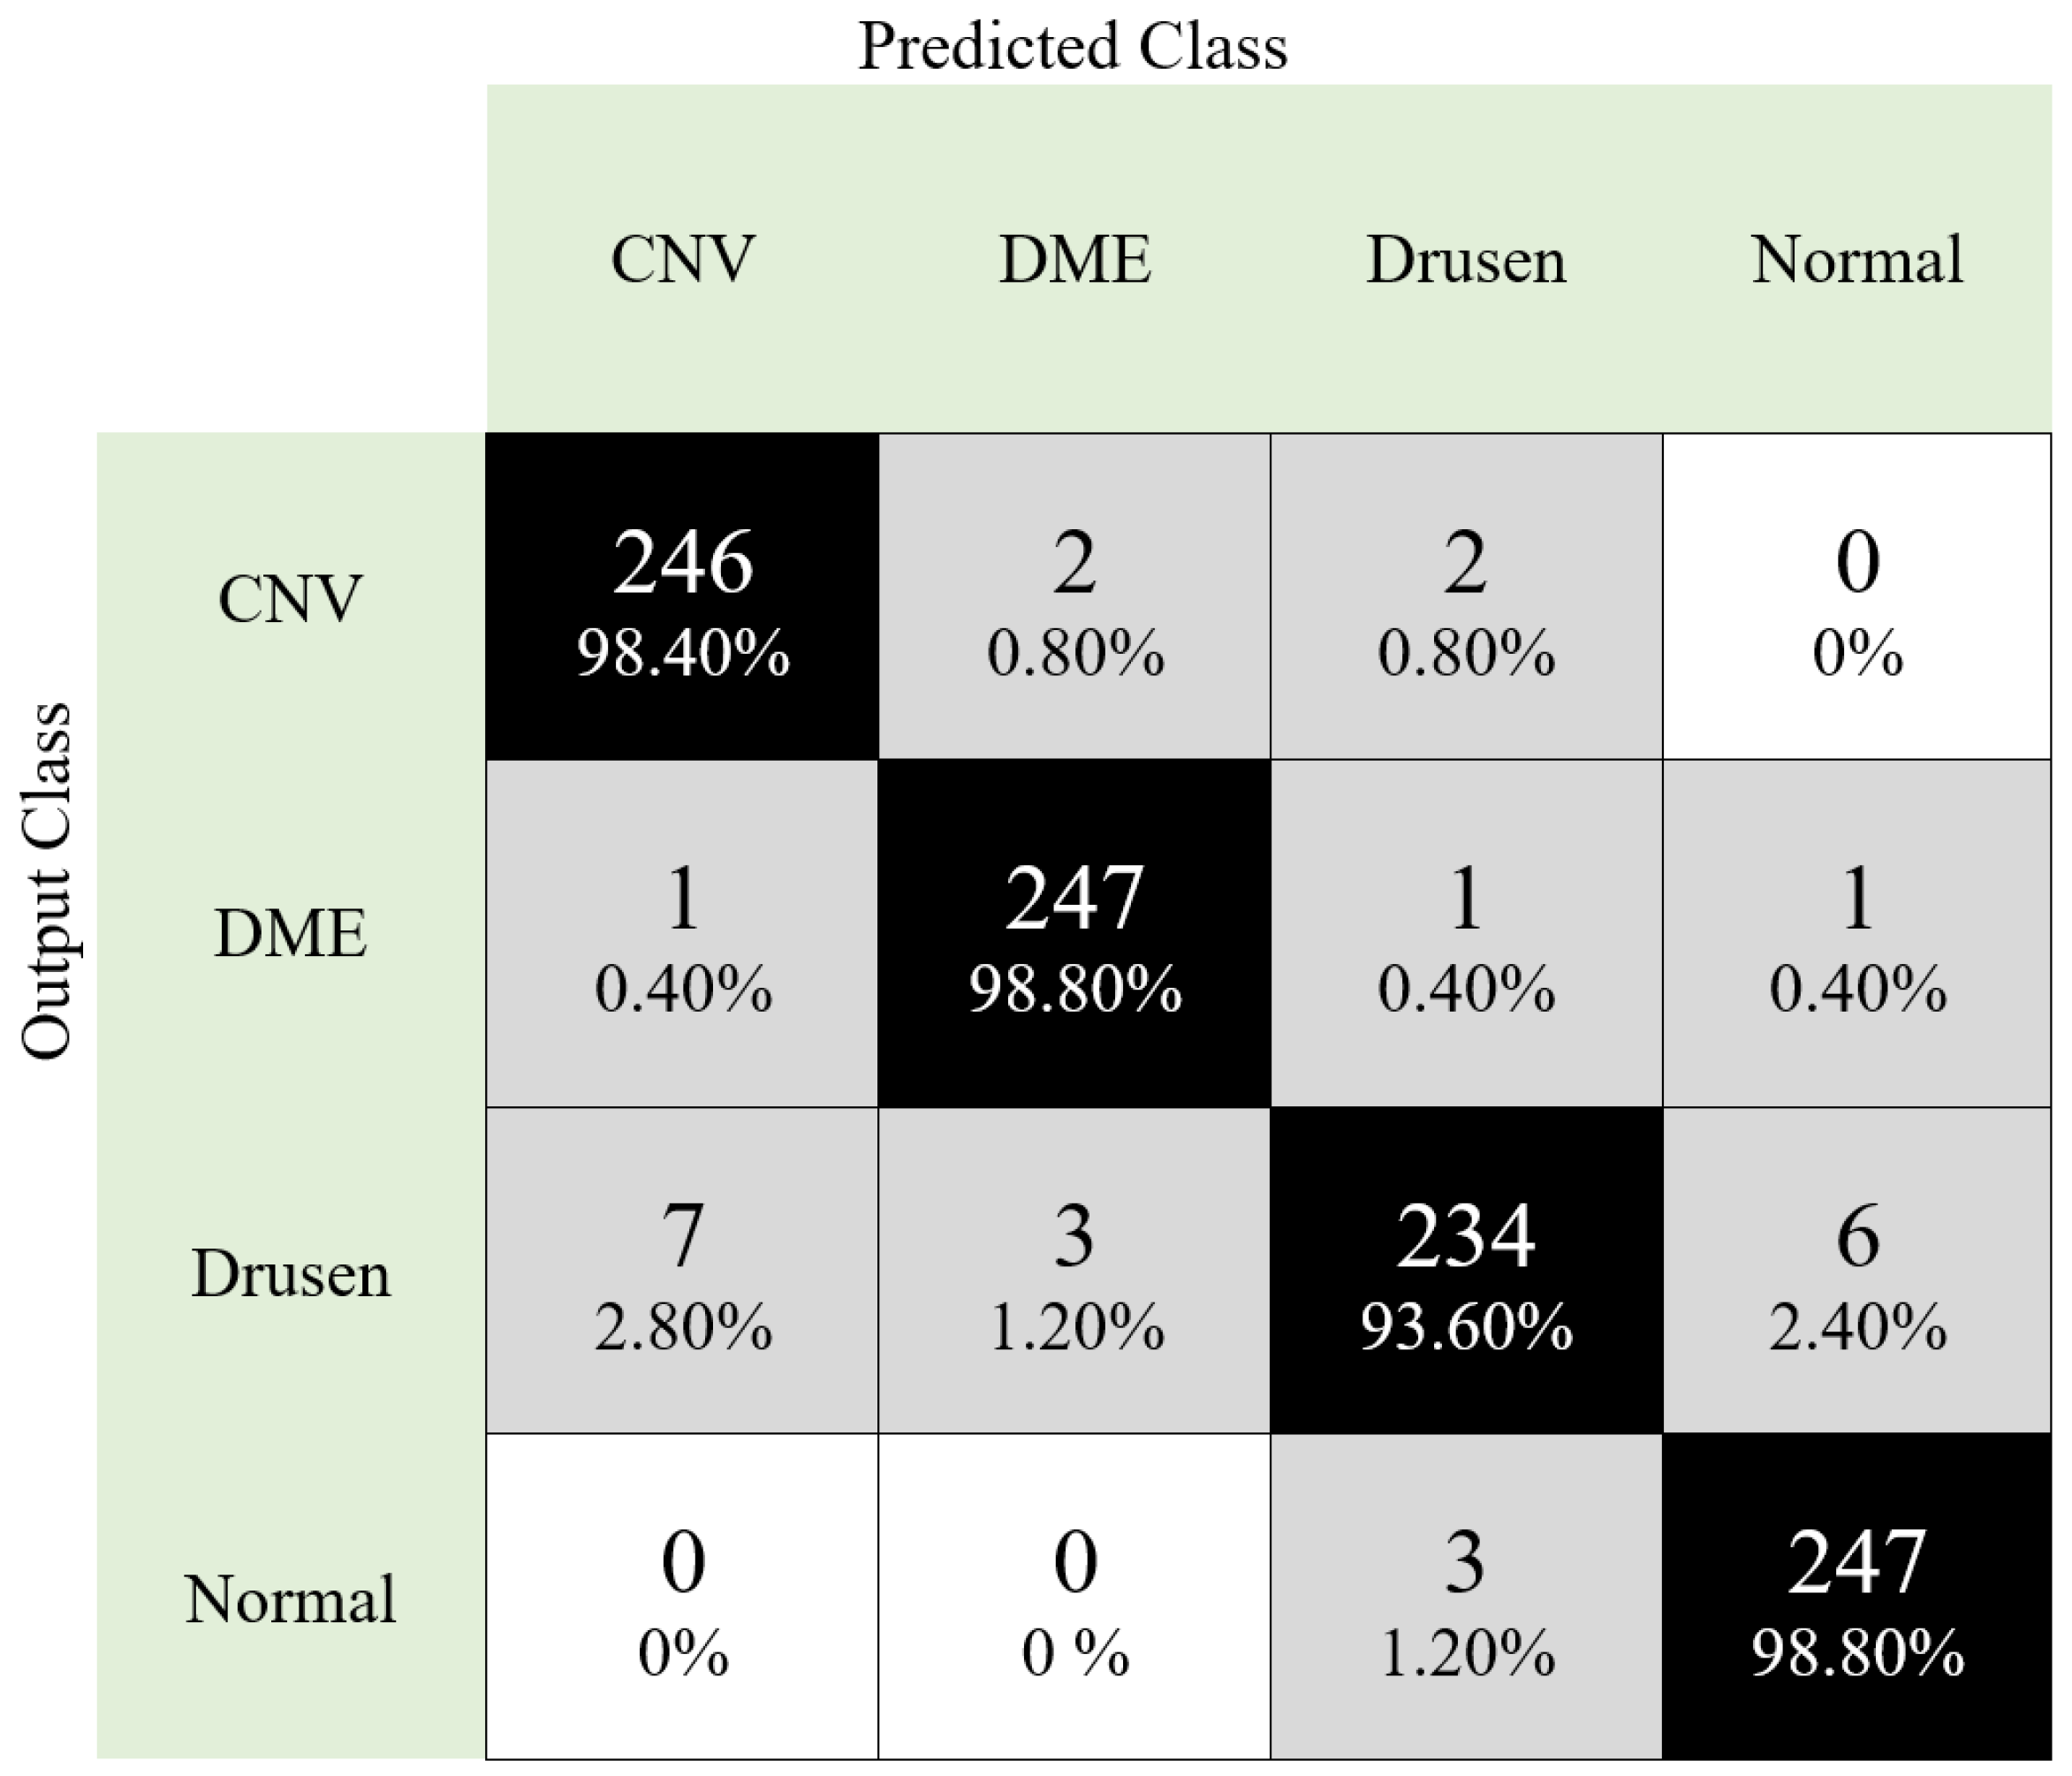
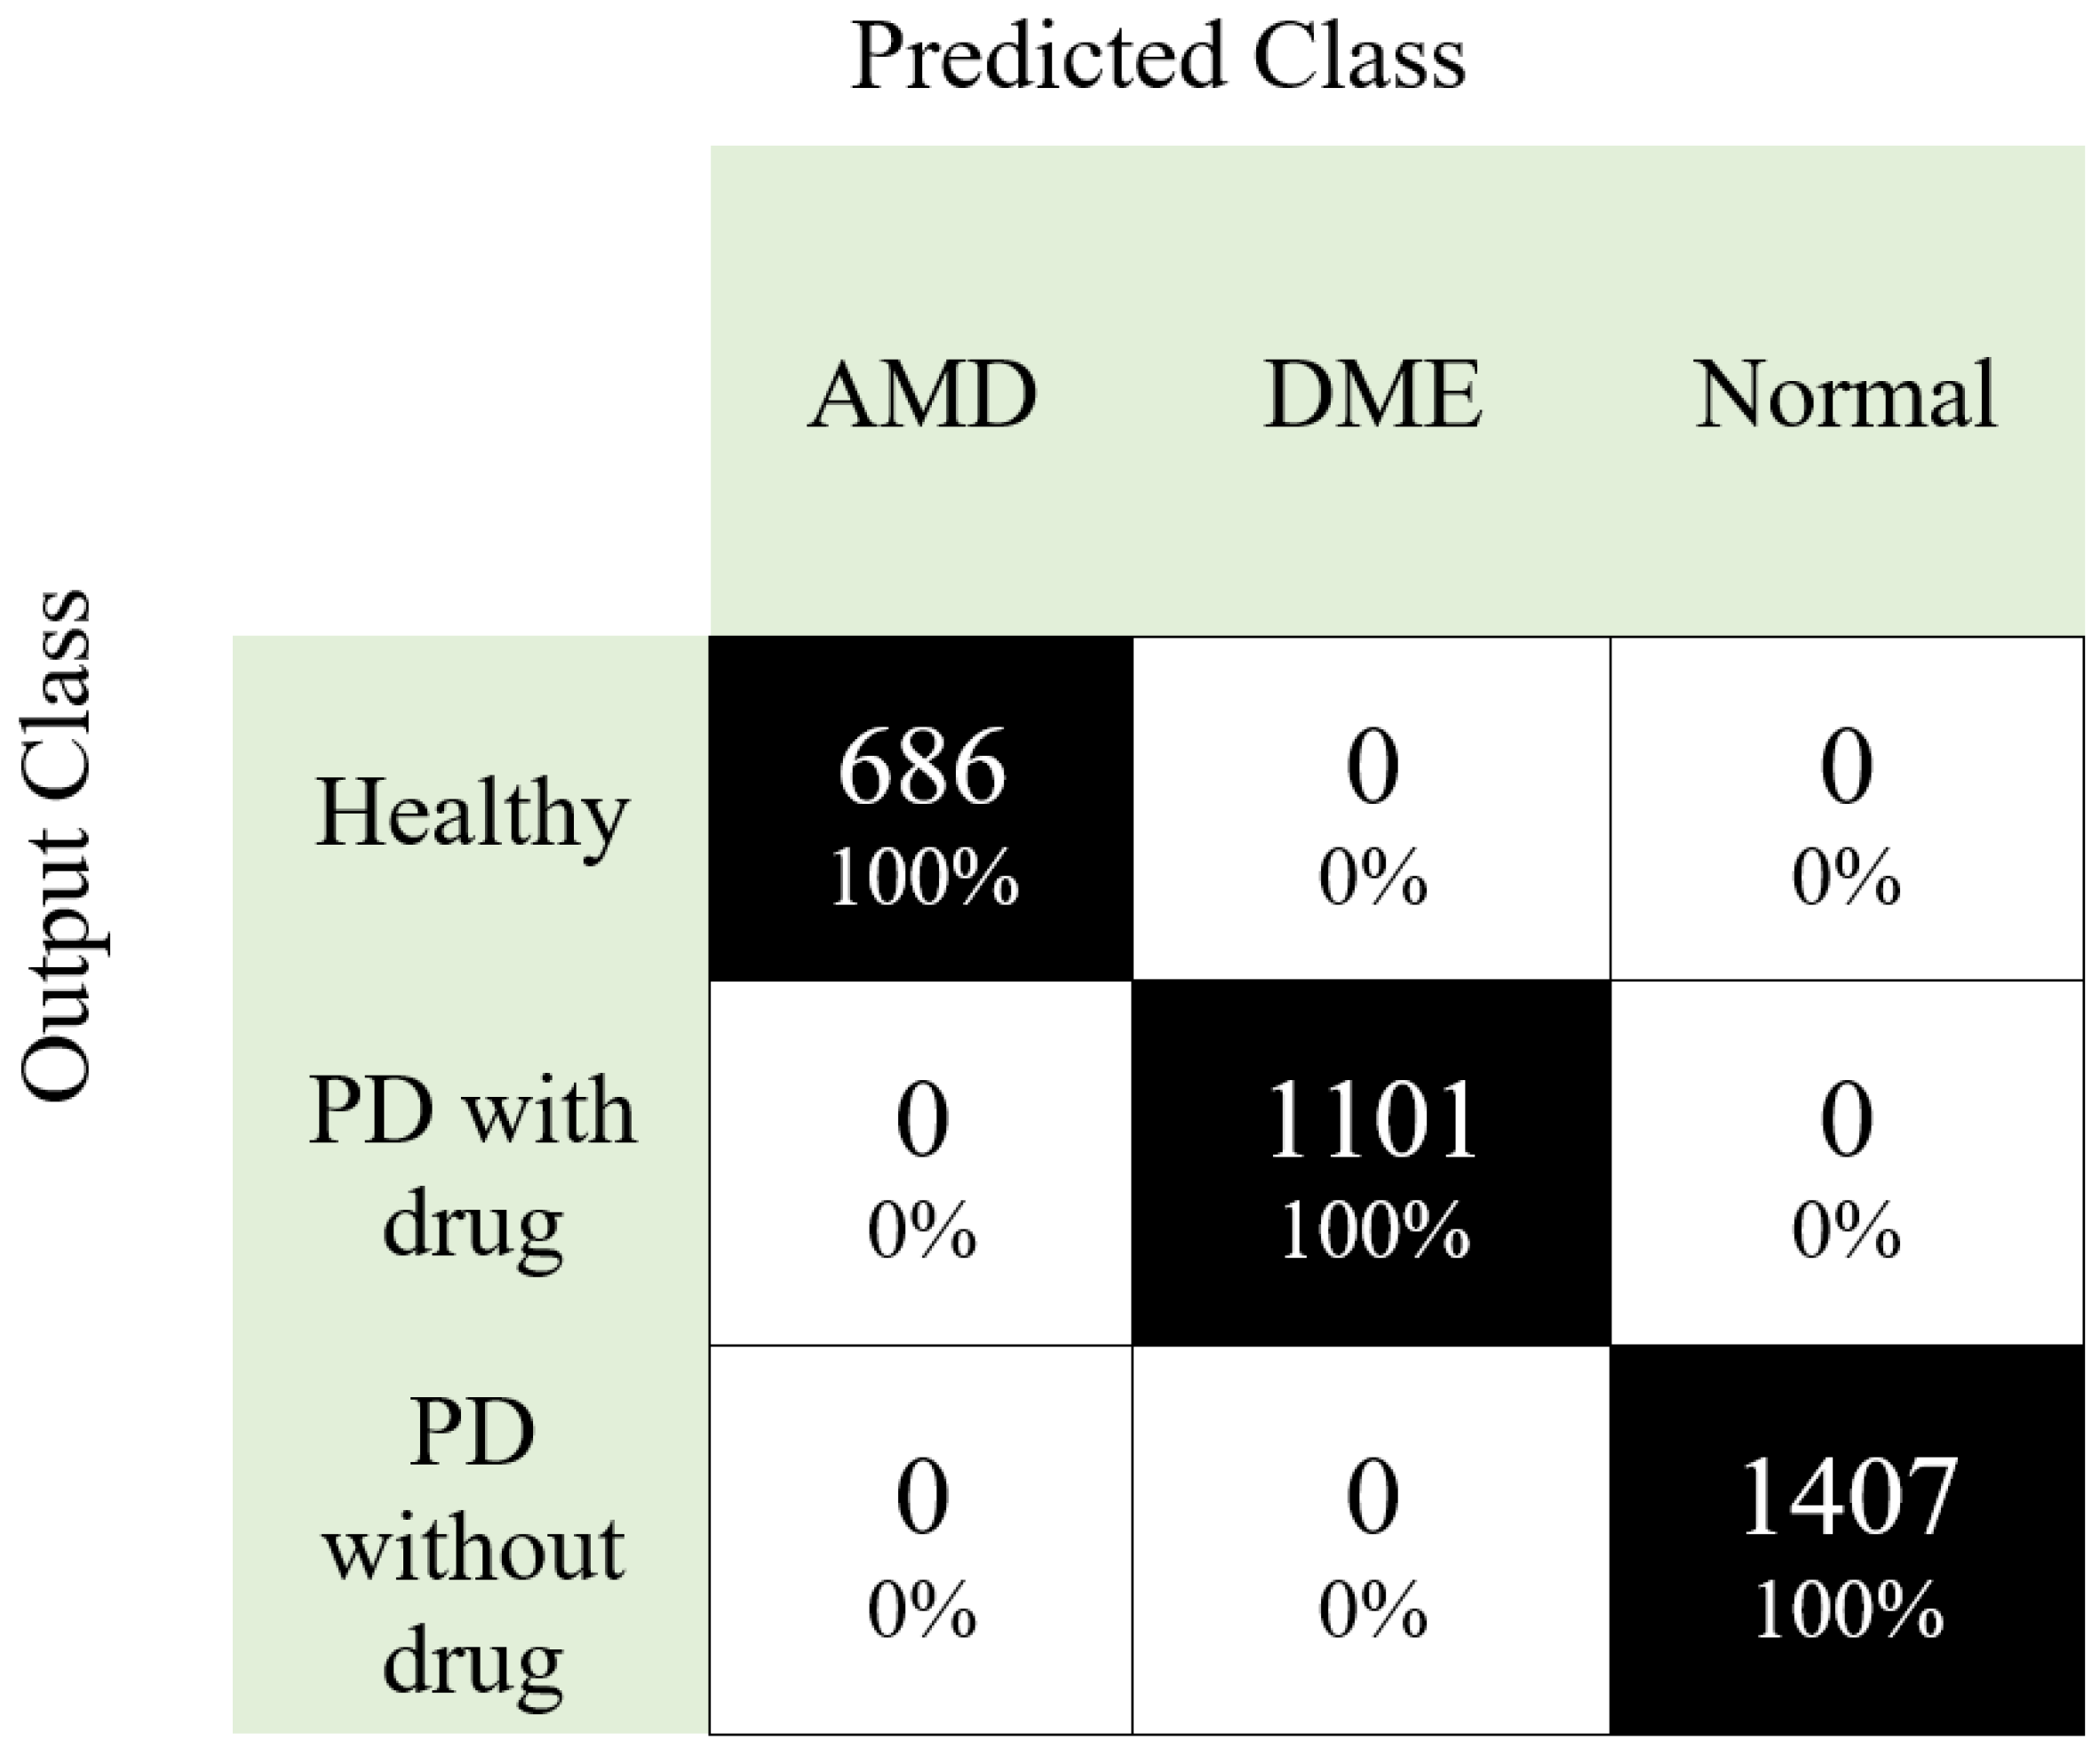
| Accuracy | 97.40 | 100 |
| Precision | 97.40 | 100 |
| Cohen Kappa | 96.40 | 100 |
| F1-score | 97.40 | 100 |
| MCC | 96.53 | 100 |
| Recall | 96.53 | 100 |
| Study | Method | Classifier | Dataset | Split Ratio | Number of Class | The Results (%) |
|---|---|---|---|---|---|---|
| Rong et al. [2] | Convolution neural network | Convolution neural network | 45 subjects 195 Test 1 195 Test 2 207 Test 3 267 Test 4 207 Test 5 | 72:10:18 | 3 | Acc: 100.0 for volume level |
| Rasti et al. [3] | Multi-Scale Convolutional Neural Network Ensemble | Softmax | Dataset 1 862 DME, 969 AMD 2311 normal Dataset 2 856 DME 711 AMD 1707 normal | 5-fold cross validation | 3 | AUC: 99.80 Rec: 99.36 F1:99.34 for Dataset 1 AUC: 99.9 Rec: 97.78 F1:97.71 for Dataset2 |
| Fang et at. [41] | Lesion-aware convolution neural network | Softmax | 500 CNV 500 DME 500 Drusen 500 Normal | 10-fold cross validation | 4 | Acc: 90.10 Sen: 86.80 Pre: 86.20 |
| He et al. [42] | Label smoothing generative adversarial network | Convolution neural network | 1. 37.455 CNV 11.598 DME 8866 Drusen 26.565 Normal 1.581 CNV 4.592 DME 1.563 Drusen 1.168 Normal | Leave-p-out cross- validation | 1. 4 2. 4 | 1. Pre: 87.25 Sen: 87.21 Spe: 95.09 F1: 87.11 2. Pre: 68.36 Sen: 66.68 Spe: 86.73 F1: 67.14 |
| Seeböck et al. [43] | Unsupervised deep learning | Random forest | 268 AMD (early AMD, late AMD) 115 control | 218 AMD 65 control for training 50 AMD 50 control for testing | 3 | Acc: 81.40 |
| Alqudah [44] | Automated convolutional neural network | Softmax | 250 CNV 250 DME 250 Drusen 250 Normal 250 AMD | 95.331 training 40.856 validation 1250 testing | 5 | Acc: 97.10 |
| Huang et al. [45] | Layer guided convolutional neural network | Convolutional neural network | 1. 37.455 CNV 11.598 DME 8866 Drusen 26.565 Normal 2. 1.581 CNV 4.592 DME 1.563 Drusen 1.168 Normal | 100:1 | 1. 4 2. 4 | 1. Acc: 88.40 2. Acc: 89.90 |
| Fang et al. [46] | Iterative fusion convolutional neural network | Convolutional neural network | 37.455 CNV 11.598 DME 8866 Drusen 26.565 Normal | 10-fold cross validation | 4 | Acc: 87.30 |
| Saraiva et al. [47] | Convolutional neural network | Convolutional neural network | 5.313 CNV 7.491 DME 1.773 Drusen 2.319 Normal | 100:1 | 4 | Acc: 94.35 |
| Our method | Convolutional neural networks, iterative ReliefF | Support vector machine | 2750 CNV 2750 DME 2750 Drusen 2750 Normal | 10,000 train and 1000 test (10:1) | 4 | Acc: 97.30 Pre: 97.32 F1: 97.30 Rec: 97.30 CK: 96.40 MCC: 96.41 |
| 686 AMD 1101 DME 1407 Healthy | 10-fold cross-validation | 3 | Acc: 100 Pre: 100 F1: 100 Rec: 100 CK: 100 MCC: 100 |
Publisher’s Note: MDPI stays neutral with regard to jurisdictional claims in published maps and institutional affiliations. |
© 2021 by the authors. Licensee MDPI, Basel, Switzerland. This article is an open access article distributed under the terms and conditions of the Creative Commons Attribution (CC BY) license (https://creativecommons.org/licenses/by/4.0/).
Share and Cite
Barua, P.D.; Chan, W.Y.; Dogan, S.; Baygin, M.; Tuncer, T.; Ciaccio, E.J.; Islam, N.; Cheong, K.H.; Shahid, Z.S.; Acharya, U.R. Multilevel Deep Feature Generation Framework for Automated Detection of Retinal Abnormalities Using OCT Images. Entropy 2021, 23, 1651. https://0-doi-org.brum.beds.ac.uk/10.3390/e23121651
Barua PD, Chan WY, Dogan S, Baygin M, Tuncer T, Ciaccio EJ, Islam N, Cheong KH, Shahid ZS, Acharya UR. Multilevel Deep Feature Generation Framework for Automated Detection of Retinal Abnormalities Using OCT Images. Entropy. 2021; 23(12):1651. https://0-doi-org.brum.beds.ac.uk/10.3390/e23121651
Chicago/Turabian StyleBarua, Prabal Datta, Wai Yee Chan, Sengul Dogan, Mehmet Baygin, Turker Tuncer, Edward J. Ciaccio, Nazrul Islam, Kang Hao Cheong, Zakia Sultana Shahid, and U. Rajendra Acharya. 2021. "Multilevel Deep Feature Generation Framework for Automated Detection of Retinal Abnormalities Using OCT Images" Entropy 23, no. 12: 1651. https://0-doi-org.brum.beds.ac.uk/10.3390/e23121651