
Effects of Match Location, Quality of Opposition and Match Outcome on Match Running Performance in a Portuguese Professional Football Team

 ,
,  , ,
, ,  and
and
Abstract
:1. Introduction
2. Materials and Methods
2.1. Participants and Match Sample
2.2. Data Collection and Procedures
2.3. Contextual Factors
2.4. Physical Load Measures
2.5. Statistical Analysis
3. Results
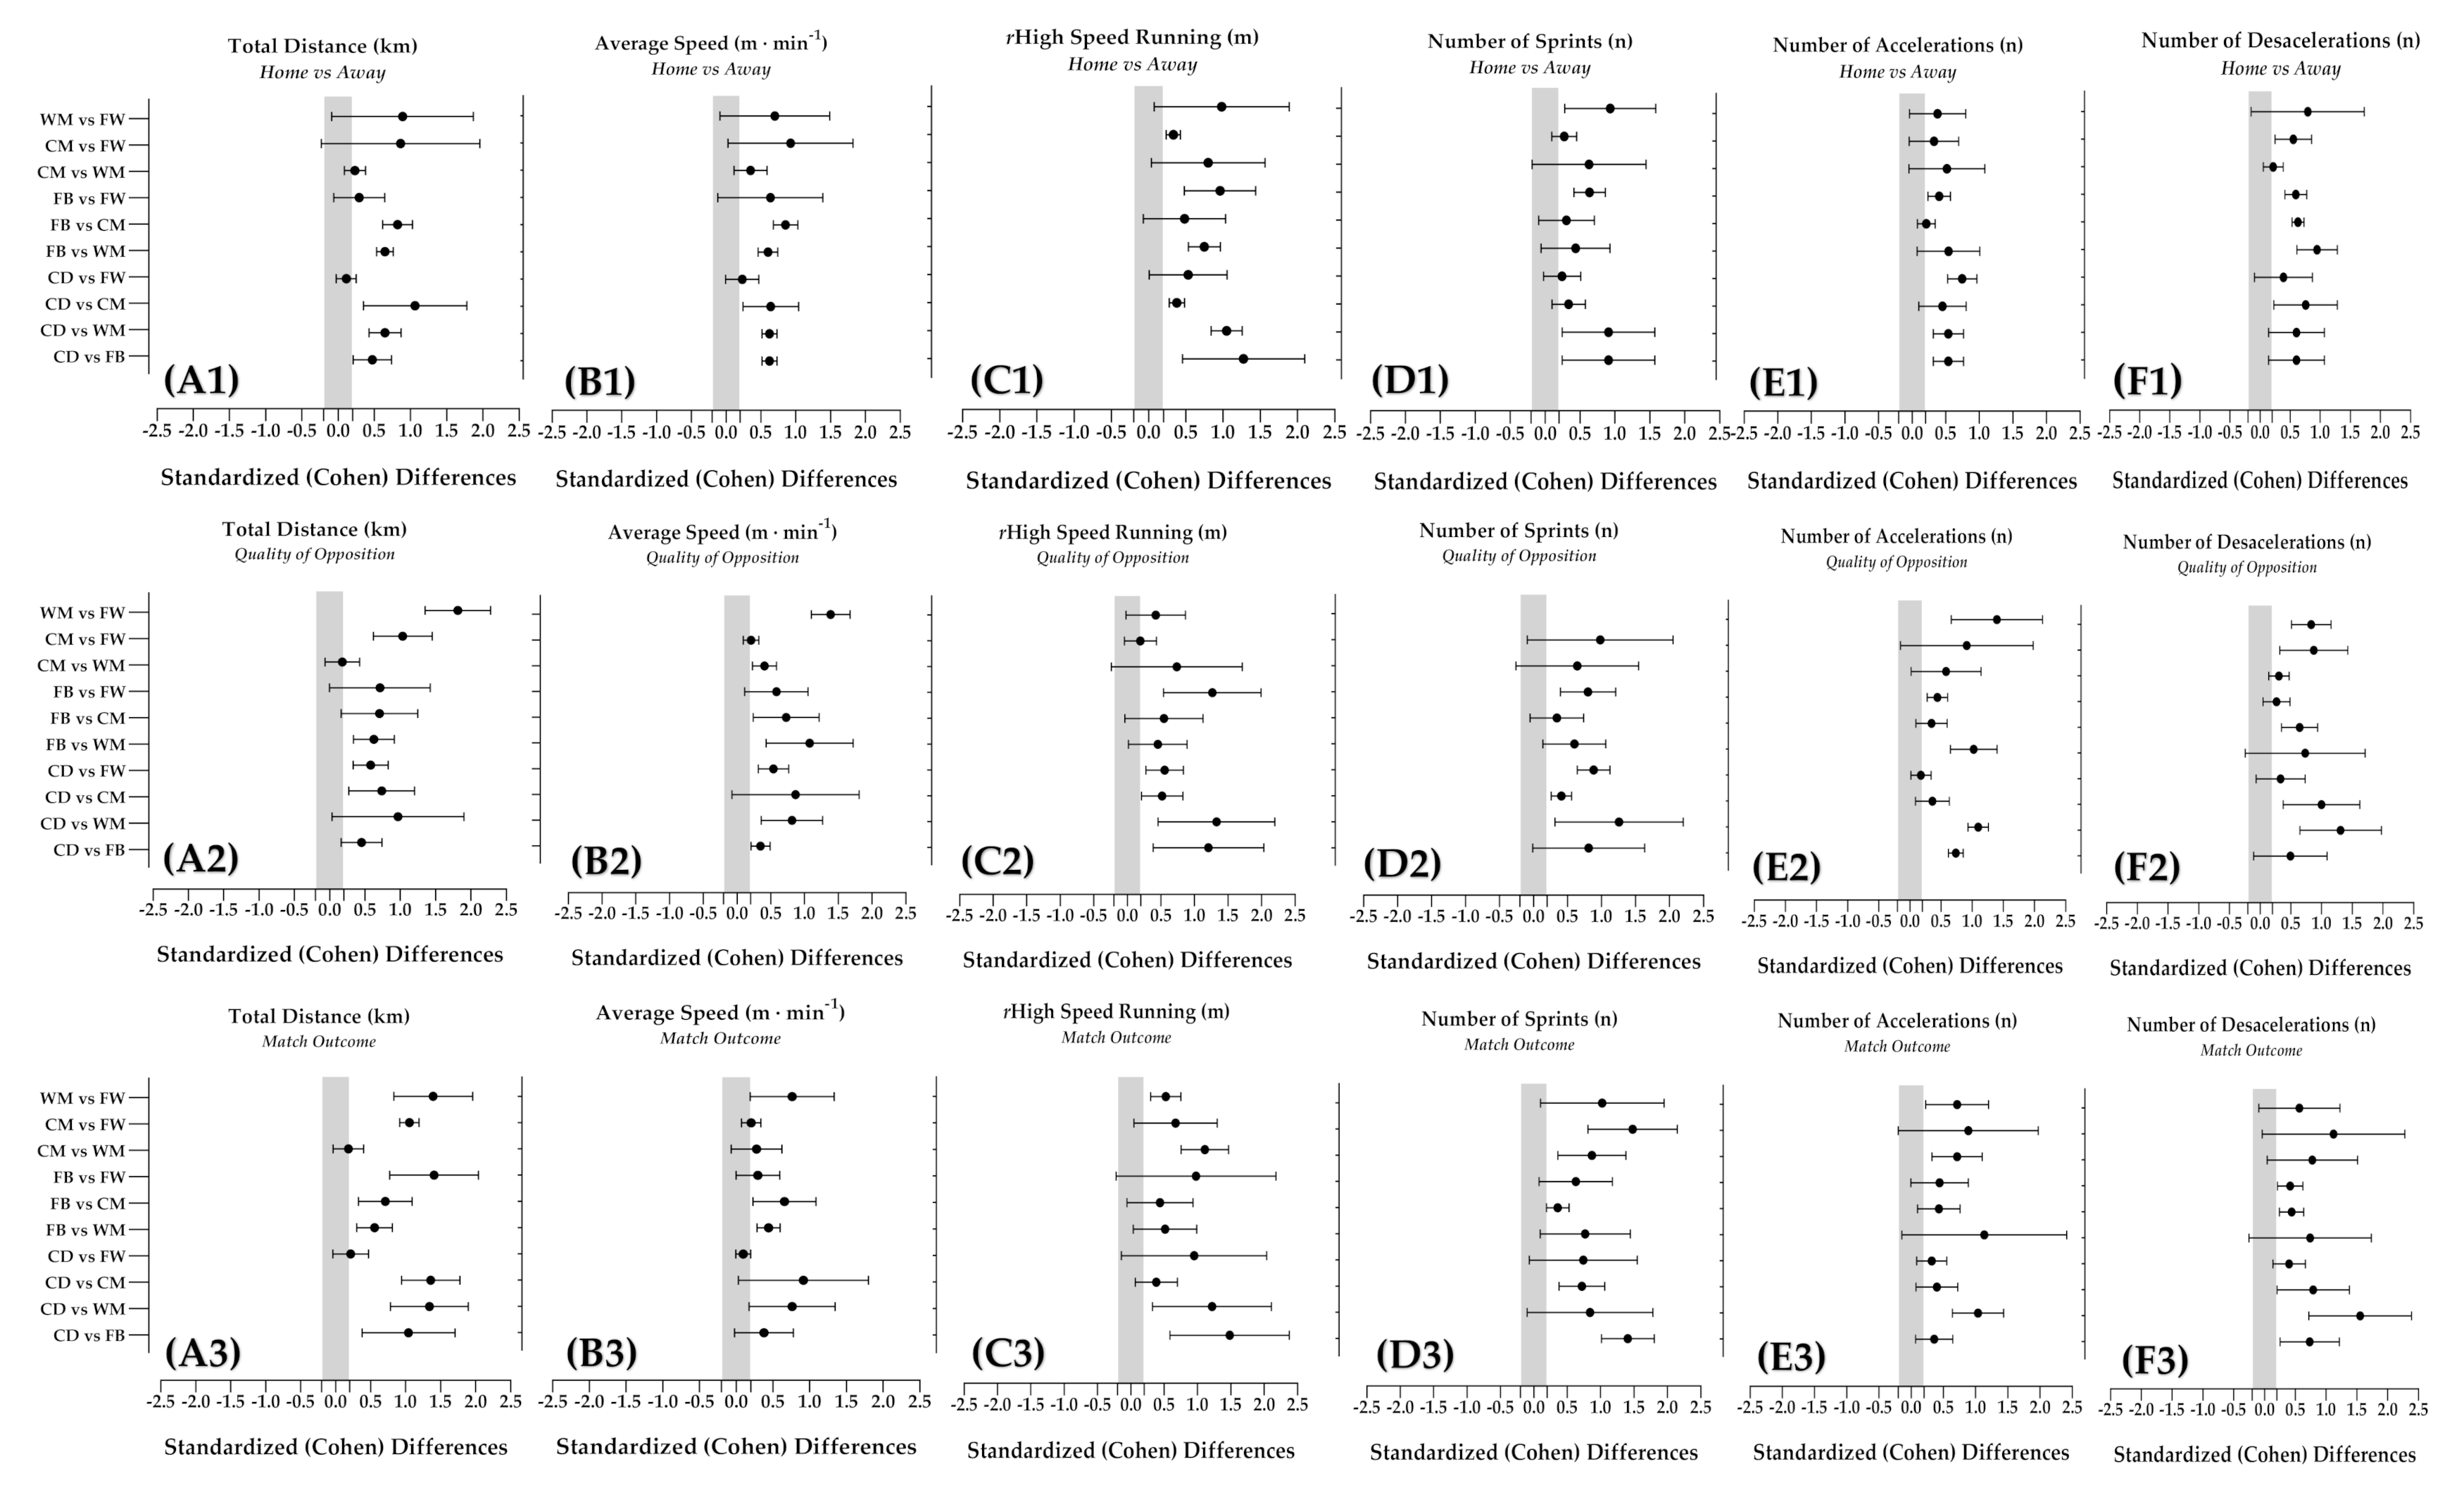
3.1. Effects of Contextual Factors on Match Running Performance
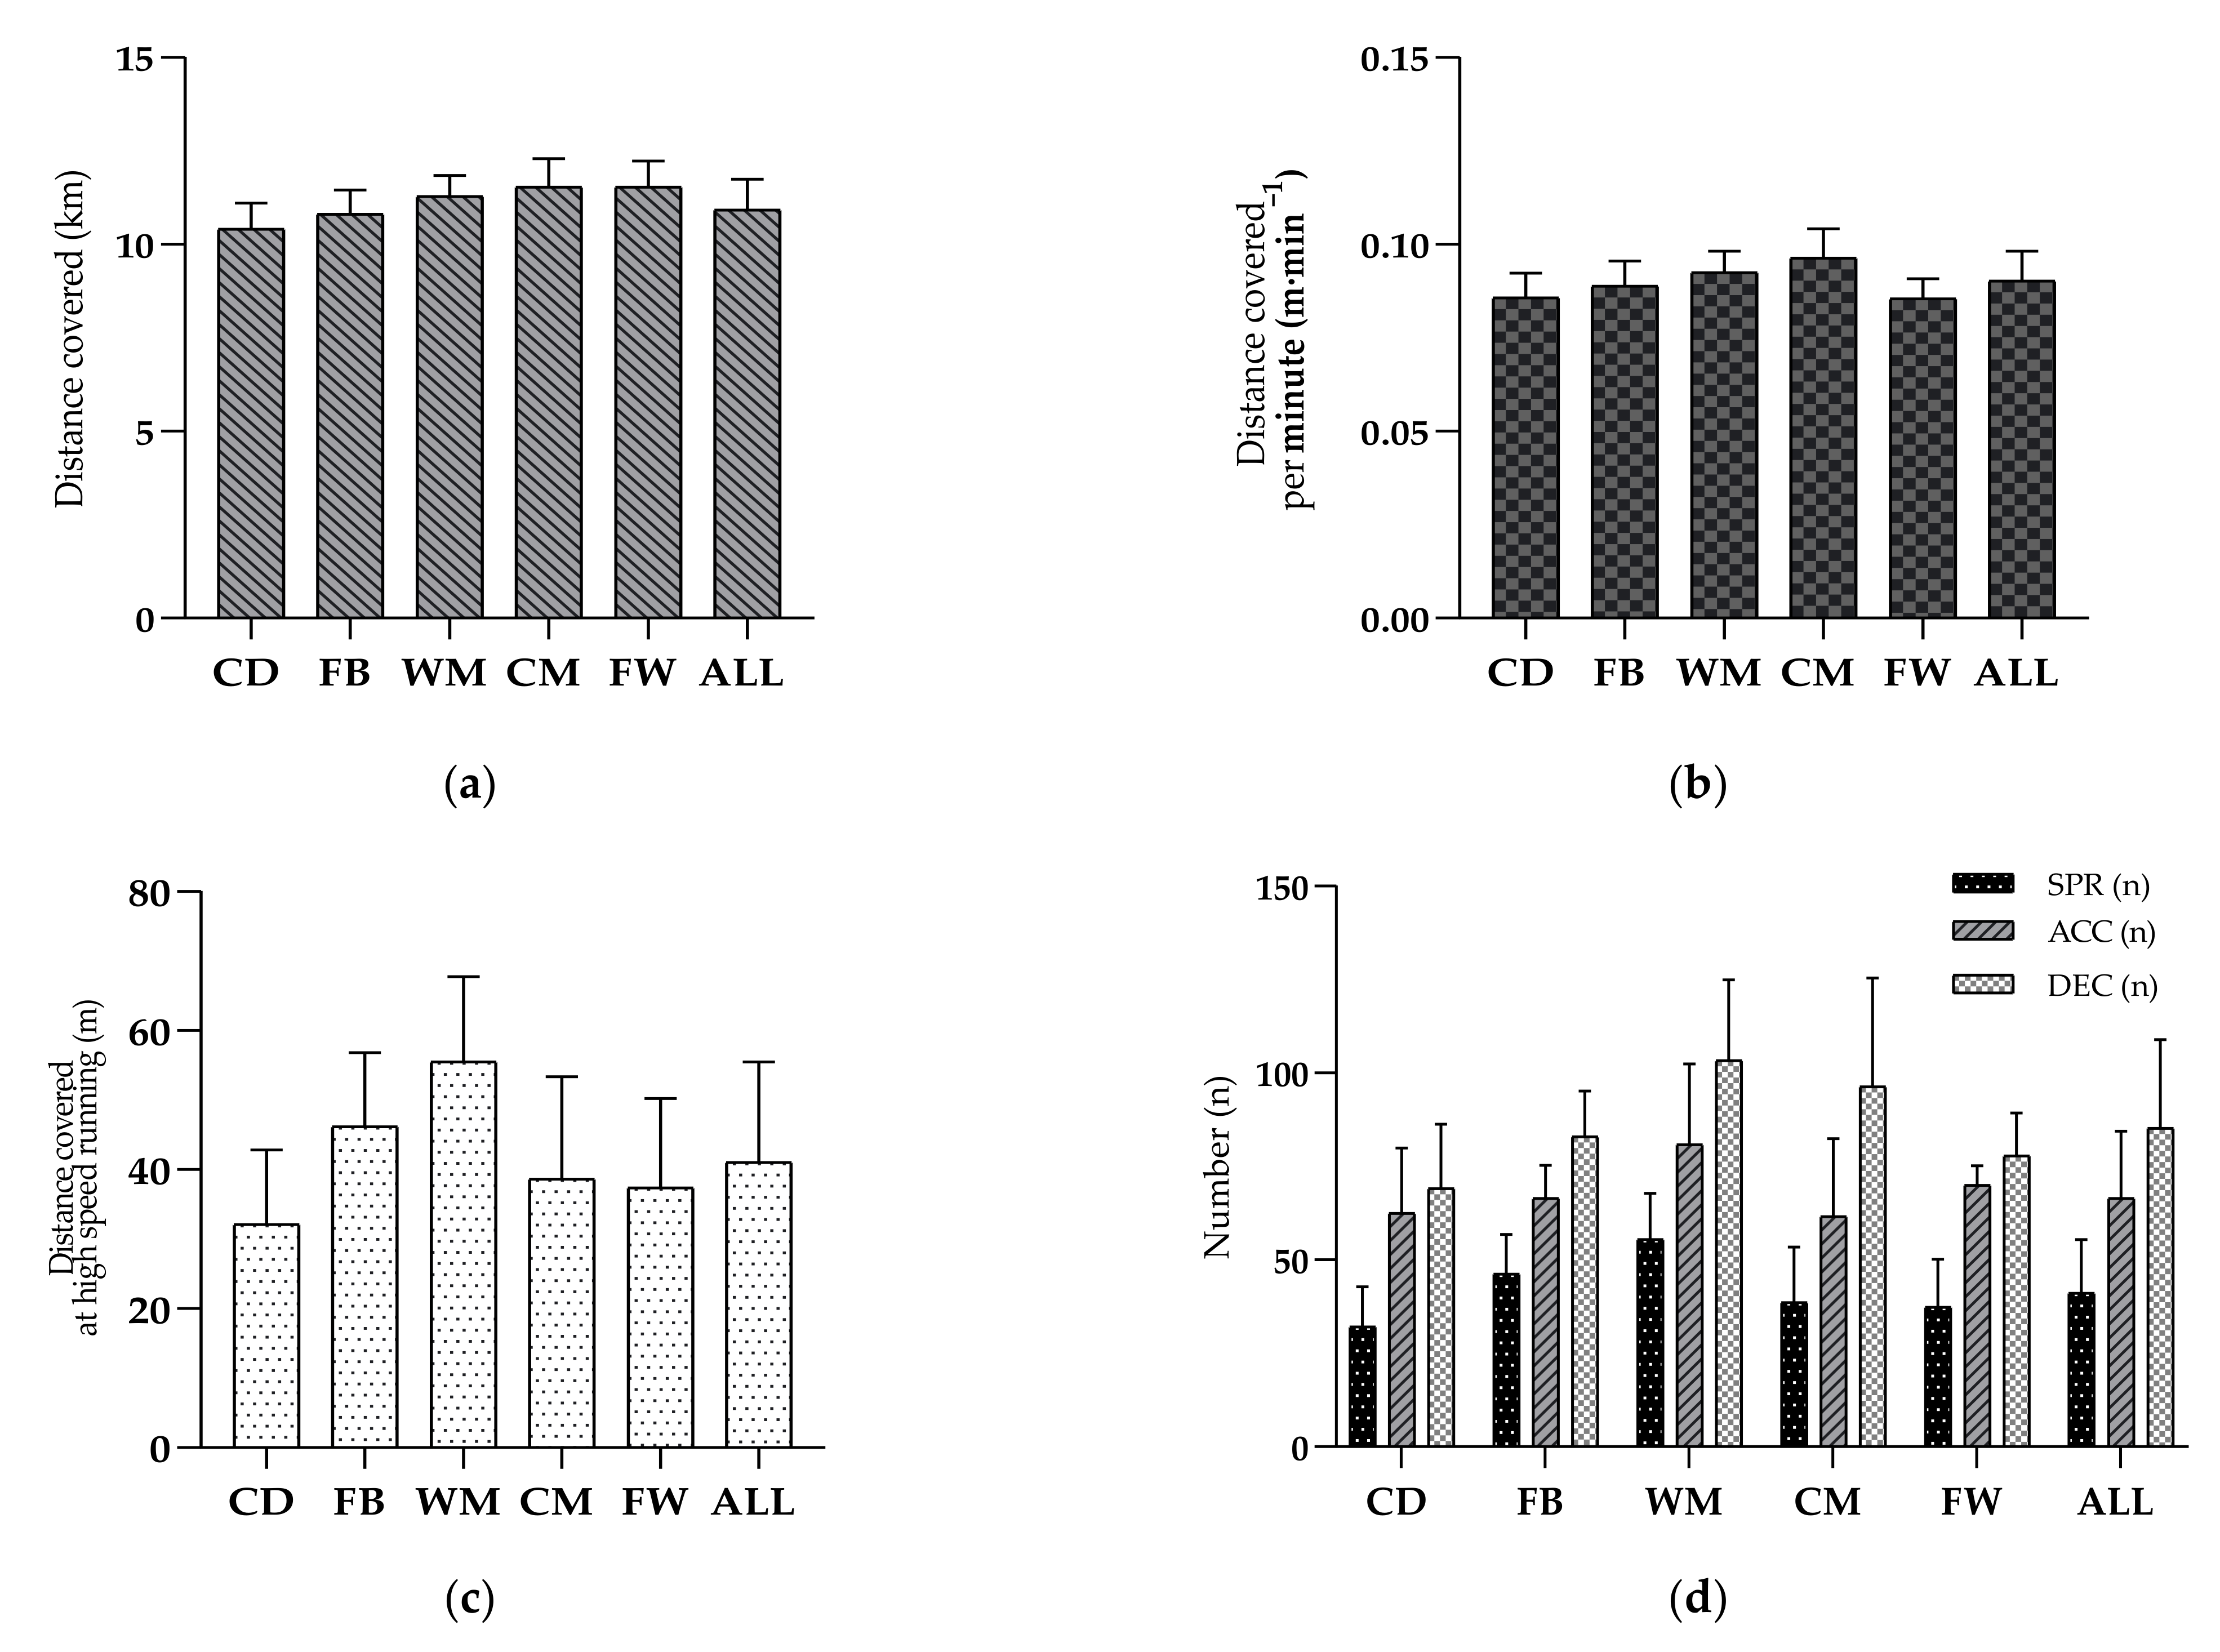
3.2. Effects of Playing Position on Match Running Performance
4. Discussion
4.1. Contextual Factors and Their Influence on Match Running Performance
4.2. Match Running Performance
4.3. Limitations and Future Perspectives
5. Conclusions
Author Contributions
Funding
Data Availability Statement
Acknowledgments
Conflicts of Interest
References
- Iaia, F.M.; Ermanno, R.; Bangsbo, J. High-Intensity Training in Football. Int. J. Sports Physiol. Perform. 2009, 4, 291–306. [Google Scholar] [CrossRef] [PubMed] [Green Version]
- Bangsbo, J.; Mohr, M.; Krustrup, P. Physical and Metabolic Demands of Training and Match-Play in the Elite Football Player. J. Sports Sci. 2006, 24, 665–674. [Google Scholar] [CrossRef]
- Mohr, M.; Krustrup, P.; Bangsbo, J. Match Performance of High-Standard Soccer Players with Special Reference to Development of Fatigue. J. Sports Sci. 2003, 21, 519–528. [Google Scholar] [CrossRef] [PubMed] [Green Version]
- Rampinini, E.; Coutts, A.J.; Castagna, C.; Sassi, R.; Impellizzeri, F.M. Variation in Top Level Soccer Match Performance. Int. J. Sports Med. 2007, 28, 1018–1024. [Google Scholar] [CrossRef] [PubMed] [Green Version]
- Carling, C.; Bloomfield, J.; Nelsen, L.; Reilly, T. The Role of Motion Analysis in Elite Soccer: Contemporary Performance Measurement Techniques and Work Rate Data. Sports Med. 2008, 38, 839–862. [Google Scholar] [CrossRef]
- Teixeira, J.E.; Forte, P.; Ferraz, R.; Leal, M.; Ribeiro, J.; Silva, A.J.; Barbosa, T.M.; Monteiro, A.M. Monitoring Accumulated Training and Match Load in Football: A Systematic Review. Int. J. Environ. Res. Public Health 2021, 18, 3906. [Google Scholar] [CrossRef]
- Miguel, M.; Oliveira, R.; Loureiro, N.; García-Rubio, J.; Ibáñez, S.J. Load Measures in Training/Match Monitoring in Soccer: A Systematic Review. Int. J. Environ. Res. Public Health 2021, 18, 2721. [Google Scholar] [CrossRef]
- Harper, D.J.; Carling, C.; Kiely, J. High-Intensity Acceleration and Deceleration Demands in Elite Team Sports Competitive Match Play: A Systematic Review and Meta-Analysis of Observational Studies. Sports Med. 2019, 49, 1923–1947. [Google Scholar] [CrossRef] [Green Version]
- Bradley, P.S.; Ade, J.D. Are Current Physical Match Performance Metrics in Elite Soccer Fit for Purpose or Is the Adoption of an Integrated Approach Needed? Int. J. Sports Physiol. Perform. 2018, 13, 656–664. [Google Scholar] [CrossRef]
- Carling, C. Interpreting Physical Performance in Professional Soccer Match-Play: Should We Be More Pragmatic in Our Approach? Sports Med. 2013, 43, 655–663. [Google Scholar] [CrossRef] [PubMed]
- Sarmento, H.; Clemente, F.M.; Araújo, D.; Davids, K.; McRobert, A.; Figueiredo, A. What Performance Analysts Need to Know about Research Trends in Association Football (2012–2016): A Systematic Review. Sports Med. 2018, 48, 799–836. [Google Scholar] [CrossRef]
- Vieira, L.H.P.; Carling, C.; Barbieri, F.A.; Aquino, R.; Santiago, P.R.P. Match Running Performance in Young Soccer Players: A Systematic Review. Sports Med. 2019, 49, 289–318. [Google Scholar] [CrossRef] [PubMed]
- Akenhead, R.; Hayes, P.R.; Thompson, K.G.; French, D. Diminutions of Acceleration and Deceleration Output during Professional Football Match Play. J. Sci. Med. Sport 2013, 16, 556–561. [Google Scholar] [CrossRef]
- Bradley, P.S.; Di Mascio, M.; Peart, D.; Olsen, P.; Sheldon, B. High-Intensity Activity Profiles of Elite Soccer Players at Different Performance Levels. J Strength Cond. Res. 2010, 24, 2343–2351. [Google Scholar] [CrossRef] [PubMed]
- Bradley, P.S.; Sheldon, W.; Wooster, B.; Olsen, P.; Boanas, P.; Krustrup, P. High-Intensity Running in English FA Premier League Soccer Matches. J. Sports Sci. 2009, 27, 159–168. [Google Scholar] [CrossRef] [PubMed]
- Di Salvo, V.; Gregson, W.; Atkinson, G.; Tordoff, P.; Drust, B. Analysis of High Intensity Activity in Premier League Soccer. Int. J. Sports Med. 2009, 30, 205–212. [Google Scholar] [CrossRef]
- Di Salvo, V.; Pigozzi, F.; González-Haro, C.; Laughlin, M.S.; De Witt, J.K. Match Performance Comparison in Top English Soccer Leagues. Int. J. Sports Med. 2013, 34, 526–532. [Google Scholar] [CrossRef] [PubMed]
- Bradley, P.S.; Noakes, T.D. Match Running Performance Fluctuations in Elite Soccer: Indicative of Fatigue, Pacing or Situational Influences? J. Sports Sci. 2013, 31, 1627–1638. [Google Scholar] [CrossRef]
- Di Salvo, V.; Baron, R.; Tschan, H.; Calderon Montero, F.J.; Bachl, N.; Pigozzi, F. Performance Characteristics According to Playing Position in Elite Soccer. Int. J. Sports Med. 2007, 28, 222–227. [Google Scholar] [CrossRef]
- Dellal, A.; Chamari, K.; Wong, D.P.; Ahmaidi, S.; Keller, D.; Barros, R.; Bisciotti, G.N.; Carling, C. Comparison of Physical and Technical Performance in European Soccer Match-Play: FA Premier League and La Liga. Eur. J. Sport Sci. 2011, 11, 51–59. [Google Scholar] [CrossRef]
- Malone, J.J.; Di Michele, R.; Morgans, R.; Burgess, D.; Morton, J.P.; Drust, B. Seasonal Training-Load Quantification in Elite English Premier League Soccer Players. Int. J. Sports Physiol. Perform. 2015, 10, 489–497. [Google Scholar] [CrossRef] [Green Version]
- Vigne, G.; Gaudino, C.; Rogowski, I.; Alloatti, G.; Hautier, C. Activity Profile in Elite Italian Soccer Team. Int. J. Sports Med. 2010, 31, 304–310. [Google Scholar] [CrossRef] [PubMed]
- Vigne, G.; Dellal, A.; Gaudino, C.; Chamari, K.; Rogowski, I.; Alloatti, G.; Wong, P.D.; Owen, A.; Hautier, C. Physical Outcome in a Successful Italian Serie A Soccer Team over Three Consecutive Seasons. J. Strength Cond. Res. 2013, 27, 1400–1406. [Google Scholar] [CrossRef] [PubMed]
- Castellano, J.; Blanco-Villaseñor, A.; Alvarez, D. Contextual Variables and Time-Motion Analysis in Soccer. Int. J. Sports Med. 2011, 32, 415–421. [Google Scholar] [CrossRef] [PubMed] [Green Version]
- Lago-Peñas, C.; Rey, E.; Lago-Ballesteros, J.; Casais, L.; Domínguez, E. Analysis of Work-Rate in Soccer According to Playing Positions. Int. J. Perform. Anal. Sport 2009, 9, 218–227. [Google Scholar] [CrossRef]
- Mallo, J.; Mena, E.; Nevado, F.; Paredes, V. Physical Demands of Top-Class Soccer Friendly Matches in Relation to a Playing Position Using Global Positioning System Technology. J. Hum. Kinet. 2015, 47, 179–188. [Google Scholar] [CrossRef] [Green Version]
- Carling, C.; Dupont, G. Are Declines in Physical Performance Associated with a Reduction in Skill-Related Performance during Professional Soccer Match-Play? J. Sports Sci. 2011, 29, 63–71. [Google Scholar] [CrossRef]
- Carling, C. Analysis of Physical Activity Profiles When Running with the Ball in a Professional Soccer Team. J. Sports Sci. 2010, 28, 319–326. [Google Scholar] [CrossRef]
- Hoppe, M.W.; Slomka, M.; Baumgart, C.; Weber, H.; Freiwald, J. Match Running Performance and Success across a Season in German Bundesliga Soccer Teams. Int. J. Sports Med. 2015, 36, 563–566. [Google Scholar] [CrossRef] [PubMed]
- Andrzejewski, M.; Konefał, M.; Chmura, P.; Kowalczuk, E.; Chmura, J. Match Outcome and Distances Covered at Various Speeds in Match Play by Elite German Soccer Players. Int. J. Perform. Anal. Sport 2016, 16, 817–828. [Google Scholar] [CrossRef]
- Chmura, P.; Liu, H.; Andrzejewski, M.; Chmura, J.; Kowalczuk, E.; Rokita, A.; Konefał, M. Is There Meaningful Influence from Situational and Environmental Factors on the Physical and Technical Activity of Elite Football Players? Evidence from the Data of 5 Consecutive Seasons of the German Bundesliga. PLoS ONE 2021, 16, e0247771. [Google Scholar] [CrossRef]
- Chmura, P.; Konefał, M.; Chmura, J.; Kowalczuk, E.; Zając, T.; Rokita, A.; Andrzejewski, M. Match Outcome and Running Performance in Different Intensity Ranges among Elite Soccer Players. Biol. Sport 2018, 35, 197–203. [Google Scholar] [CrossRef]
- Aquino, R.; Munhoz Martins, G.H.; Palucci Vieira, L.H.; Menezes, R.P. Influence of Match Location, Quality of Opponents, and Match Status on Movement Patterns in Brazilian Professional Football Players. J. Strength Cond. Res. 2017, 31, 2155–2161. [Google Scholar] [CrossRef]
- Vieira, L.H.P.; Aquino, R.; Lago-Peñas, C.; Munhoz Martins, G.H.; Puggina, E.F.; Barbieri, F.A. Running Performance in Brazilian Professional Football Players during a Congested Match Schedule. J. Strength Cond. Res. 2018, 32, 313–325. [Google Scholar] [CrossRef]
- Ingebrigtsen, J.; Dalen, T.; Hjelde, G.H.; Drust, B.; Wisløff, U. Acceleration and Sprint Profiles of a Professional Elite Football Team in Match Play. Eur. J. Sport Sci. 2015, 15, 101–110. [Google Scholar] [CrossRef]
- Sæterbakken, A.; Haug, V.; Fransson, D.; Grendstad, H.N.; Gundersen, H.S.; Moe, V.F.; Ylvisaker, E.; Shaw, M.; Riiser, A.; Andersen, V. Match Running Performance on Three Different Competitive Standards in Norwegian Soccer. Sports Med. Int. Open 2019, 3, E82–E88. [Google Scholar] [CrossRef] [PubMed]
- Vigh-Larsen, J.F.; Dalgas, U.; Andersen, T.B. Position-Specific Acceleration and Deceleration Profiles in Elite Youth and Senior Soccer Players. J. Strength Cond. Res. 2018, 32, 1114–1122. [Google Scholar] [CrossRef] [PubMed]
- Burgess, D.J.; Naughton, G.; Norton, K.I. Profile of Movement Demands of National Football Players in Australia. J. Sci. Med. Sport 2006, 9, 334–341. [Google Scholar] [CrossRef] [PubMed]
- Varley, M.C.; Gabbett, T.; Aughey, R.J. Activity Profiles of Professional Soccer, Rugby League and Australian Football Match Play. J. Sports Sci. 2014, 32, 1858–1866. [Google Scholar] [CrossRef] [PubMed]
- Smpokos, E.; Mourikis, C.; Linardakis, M. Seasonal Physical Performance of a Professional Team’s Football Players in a National League and European Matches. J. Hum. Sport Exerc. 2018, 13, 720–730. [Google Scholar] [CrossRef]
- Di Salvo, V.; Baron, R.; González-Haro, C.; Gormasz, C.; Pigozzi, F.; Bachl, N. Sprinting Analysis of Elite Soccer Players during European Champions League and UEFA Cup Matches. J. Sports Sci. 2010, 28, 1489–1494. [Google Scholar] [CrossRef]
- Miñano-Espin, J.; Casáis, L.; Lago-Peñas, C.; Gómez-Ruano, M.Á. High Speed Running and Sprinting Profiles of Elite Soccer Players. J. Hum. Kinet. 2017, 58, 169–176. [Google Scholar] [CrossRef] [PubMed] [Green Version]
- Bradley, P.S.; Dellal, A.; Mohr, M.; Castellano, J.; Wilkie, A. Gender Differences in Match Performance Characteristics of Soccer Players Competing in the UEFA Champions League. Hum. Mov. Sci. 2014, 33, 159–171. [Google Scholar] [CrossRef]
- Andrzejewski, M.; Chmura, J.; Pluta, B.; Strzelczyk, R.; Kasprzak, A. Analysis of Sprinting Activities of Professional Soccer Players. J. Strength Cond. Res. 2013, 27, 2134–2140. [Google Scholar] [CrossRef] [PubMed]
- Clemente, F.M.; Couceiro, M.S.; Martins, F.M.L.; Ivanova, M.O.; Mendes, R. Activity Profiles of Soccer Players during the 2010 World Cup. J. Hum. Kinet. 2013, 38, 201–211. [Google Scholar] [CrossRef] [PubMed]
- Soroka, A.; Lago-Peñas, C. The Effect of a Succession of Matches on the Physical Performance of Elite Football Players during the World Cup Brazil 2014. Int. J. Perform. Anal. Sport 2016, 16, 434–441. [Google Scholar] [CrossRef]
- Chmura, P.; Andrzejewski, M.; Konefał, M.; Mroczek, D.; Rokita, A.; Chmura, J. Analysis of Motor Activities of Professional Soccer Players during the 2014 World Cup in Brazil. J. Hum. Kinet. 2017, 56, 187–195. [Google Scholar] [CrossRef]
- Goncalves, B.; Coutinho, D.; Travassos, B.; Folgado, H.; Caixinha, P.; Sampaio, J. Speed Synchronization, Physical Workload and Match-to-Match Performance Variation of Elite Football Players. PLoS ONE 2018, 13, e0200019. [Google Scholar] [CrossRef] [Green Version]
- Barnes, C.; Archer, D.T.; Hogg, B.; Bush, M.; Bradley, P.S. The Evolution of Physical and Technical Performance Parameters in the English Premier League. Int. J. Sports Med. 2014, 35, 1095–1100. [Google Scholar] [CrossRef]
- Bradley, P.S.; Archer, D.T.; Hogg, B.; Schuth, G.; Bush, M.; Carling, C.; Barnes, C. Tier-Specific Evolution of Match Performance Characteristics in the English Premier League: It’s Getting Tougher at the Top. J. Sports Sci. 2016, 34, 980–987. [Google Scholar] [CrossRef]
- Oliveira, R.; Brito, J.P.; Martins, A.; Mendes, B.; Marinho, D.A.; Ferraz, R.; Marques, M.C. In-Season Internal and External Training Load Quantification of an Elite European Soccer Team. PLoS ONE 2019, 14, e0209393. [Google Scholar] [CrossRef] [Green Version]
- Dalen, T.; Jørgen, I.; Gertjan, E.; Geir Havard, H.; Ulrik, W. Player Load, Acceleration, and Deceleration during Forty-Five Competitive Matches of Elite Soccer. J. Strength Cond. Res. 2016, 30, 351–359. [Google Scholar] [CrossRef]
- Trewin, J.; Meylan, C.; Varley, M.C.; Cronin, J. The Influence of Situational and Environmental Factors on Match-Running in Soccer: A Systematic Review. Sci. Med. Footb. 2017, 1, 183–194. [Google Scholar] [CrossRef] [Green Version]
- Lago-Peñas, C. The Role of Situational Variables in Analysing Physical Performance in Soccer. J. Hum. Kinet. 2012, 35, 89–95. [Google Scholar] [CrossRef]
- Paul, D.J.; Bradley, P.S.; Nassis, G.P. Factors Affecting Match Running Performance of Elite Soccer Players: Shedding Some Light on the Complexity. Int. J. Sports Physiol. Perform. 2015, 10, 516–519. [Google Scholar] [CrossRef] [PubMed] [Green Version]
- Taylor, J.B.; Mellalieu, S.D.; James, N.; Shearer, D.A. The Influence of Match Location, Quality of Opposition, and Match Status on Technical Performance in Professional Association Football. J. Sports Sci. 2008, 26, 885–895. [Google Scholar] [CrossRef] [PubMed]
- Taylor, B.J.; Mellalieu, D.S.; James, N.; Barter, P. Situation Variable Effects and Tactical Performance in Professional Association Football. Int. J. Perform. Anal. Sport 2010, 10, 255–269. [Google Scholar] [CrossRef]
- Redwood-Brown, A.J.; O’Donoghue, P.G.; Nevill, A.M.; Saward, C.; Dyer, N.; Sunderland, C. Effects of Situational Variables on the Physical Activity Profiles of Elite Soccer Players in Different Score Line States. Scand. J. Med. Sci. Sports 2018, 28, 2515–2526. [Google Scholar] [CrossRef] [PubMed]
- Lago, C.; Casais, L.; Dominguez, E.; Sampaio, J. The Effects of Situational Variables on Distance Covered at Various Speeds in Elite Soccer. Eur. J. Sport Sci. 2010, 10, 103–109. [Google Scholar] [CrossRef]
- García-Unanue, J.; Pérez-Gómez, J.; Giménez, J.-V.; Felipe, J.L.; Gómez-Pomares, S.; Gallardo, L.; Sánchez-Sánchez, J. Influence of Contextual Variables and the Pressure to Keep Category on Physical Match Performance in Soccer Players. PLoS ONE 2018, 13, e0204256. [Google Scholar] [CrossRef]
- Bush, M.D.; Archer, D.T.; Hogg, R.; Bradley, P.S. Factors Influencing Physical and Technical Variability in the English Premier League. Int. J. Sports Physiol. Perform. 2015, 10, 865–872. [Google Scholar] [CrossRef]
- Konefał, M.; Chmura, P.; Tessitore, A.; Melcer, T.; Kowalczuk, E.; Chmura, J.; Andrzejewski, M. The Impact of Match Location and Players’ Physical and Technical Activities on Winning in the German Bundesliga. Front. Psychol. 2020, 11, 1748. [Google Scholar] [CrossRef]
- Tucker, W.; Mellalieu, S.; James, N.; Taylor, J. Game Location Effects in Professional Soccer: A Case Study. Int. J. Perform. Anal. Sport 2005, 5, 23–35. [Google Scholar] [CrossRef]
- Gonçalves, L.G.; Clemente, F.; Palucci Vieira, L.; Puggina, E.; Bedo, B.; Moura, F.; Mesquita, F.; Santiago, P.; Almeida, R.; Aquino, R. Effects of Match Location, Quality of Opposition, Match Outcome and Playing Position on Load Parameters and Players’ Prominence during Official Matches in Professional Soccer Players. Hum. Mov. 2021, 22, 35–44. [Google Scholar] [CrossRef]
- Lago, C. The Influence of Match Location, Quality of Opposition, and Match Status on Possession Strategies in Professional Association Football. J. Sports Sci. 2009, 27, 1463–1469. [Google Scholar] [CrossRef] [PubMed]
- Lago-Peñas, C.; Lago-Ballesteros, J. Game Location and Team Quality Effects on Performance Profiles in Professional Soccer. J. Sports Sci. Med. 2011, 10, 465–471. [Google Scholar]
- Jennings, D.; Cormack, S.; Coutts, A.J.; Boyd, L.J.; Aughey, R.J. Variability of GPS Units for Measuring Distance in Team Sport Movements. Int. J. Sports Physiol. Perform. 2010, 5, 565–569. [Google Scholar] [CrossRef] [PubMed] [Green Version]
- Beato, M.; Coratella, G.; Stiff, A.; Iacono, A.D. The Validity and Between-Unit Variability of GNSS Units (STATSports Apex 10 and 18 Hz) for Measuring Distance and Peak Speed in Team Sports. Front. Physiol. 2018, 9, 1288. [Google Scholar] [CrossRef] [Green Version]
- Portas, M.D.; Harley, J.A.; Barnes, C.A.; Rush, C.J. The Validity and Reliability of 1-Hz and 5-Hz Global Positioning Systems for Linear, Multidirectional, and Soccer-Specific Activities. Int. J. Sports Physiol. Perform. 2010, 5, 448–458. [Google Scholar] [CrossRef] [Green Version]
- Barbosa, T.M.; Ramos, R.; Silva, A.J.; Marinho, D.A. Assessment of Passive Drag in Swimming by Numerical Simulation and Analytical Procedure. J. Sports Sci. 2018, 36, 492–498. [Google Scholar] [CrossRef]
- Hopkins, W.G.; Marshall, S.W.; Batterham, A.M.; Hanin, J. Progressive Statistics for Studies in Sports Medicine and Exercise Science. Med. Sci. Sports Exerc. 2009, 41, 3–13. [Google Scholar] [CrossRef] [Green Version]
- Batterham, A.M.; Hopkins, W.G. Making Meaningful Inferences about Magnitudes. Int. J. Sports Physiol. Perform. 2006, 1, 50–57. [Google Scholar] [CrossRef] [PubMed]
- Aquino, R.; Carling, C.; Palucci Vieira, L.H.; Martins, G.; Jabor, G.; Machado, J.; Santiago, P.; Garganta, J.; Puggina, E. Influence of Situational Variables, Team Formation, and Playing Position on Match Running Performance and Social Network Analysis in Brazilian Professional Soccer Players. J. Strength Cond. Res. 2020, 34, 808–817. [Google Scholar] [CrossRef]
- Folgado, H.; Gonçalves, B.; Sampaio, J. Positional Synchronization Affects Physical and Physiological Responses to Preseason in Professional Football (Soccer). Res. Sports Med. 2018, 26, 51–63. [Google Scholar] [CrossRef] [PubMed]
- Ferraz, R.; Gonçalves, B.; Tillaar, R.; Saiz, S.; Sampaio, J.; Marques, M. Effects of Knowing the Task Duration on Players’ Pacing Patterns during Soccer Small-Sided Games. J. Sports Sci. 2017, 36, 116–122. [Google Scholar] [CrossRef] [PubMed]
- Ferraz, R.; Gonçalves, B.; Coutinho, D.; Oliveira, R.; Travassos, B.; Sampaio, J.; Marques, M.C. Effects of Knowing the Task’s Duration on Soccer Players’ Positioning and Pacing Behaviour during Small-Sided Games. Int. J. Environ. Res. Public Health 2020, 11, 3843. [Google Scholar] [CrossRef] [PubMed]
- Gonçalves, B.; Marcelino, R.; Torres-Ronda, L.; Torrents, C.; Sampaio, J. Effects of Emphasising Opposition and Cooperation on Collective Movement Behaviour during Football Small-Sided Games. J. Sports Sci. 2016, 34, 1346–1354. [Google Scholar] [CrossRef] [PubMed]
- Gonçalves, B.V.; Figueira, B.E.; Maçãs, V.; Sampaio, J. Effect of Player Position on Movement Behaviour, Physical and Physiological Performances during an 11-a-Side Football Game. J. Sports Sci. 2014, 32, 191–199. [Google Scholar] [CrossRef]
- Ferraz, R.; Gonçalves, B.; Coutinho, D.; Marinho, D.A.; Sampaio, J.; Marques, M.C. Pacing Behaviour of Players in Team Sports: Influence of Match Status Manipulation and Task Duration Knowledge. PLoS ONE 2018, 13, e0192399. [Google Scholar] [CrossRef] [Green Version]
- Barros, R.M.L.; Misuta, M.S.; Menezes, R.P.; Figueroa, P.J.; Moura, F.A.; Cunha, S.A.; Anido, R.; Leite, N.J. Analysis of the Distances Covered by First Division Brazilian Soccer Players Obtained with an Automatic Tracking Method. J. Sports Sci. Med. 2007, 6, 233–242. [Google Scholar]
- Dellal, A.; Wong, D.P.; Moalla, W.; Chamari, K. Physical and Technical Activity of Soccer Players in the French First League—With Special Reference to Their Playing Position. Int. Sportmed J. 2010, 11, 278–290. [Google Scholar]
- Aquino, R.; Vieira, L.H.P.; Carling, C.; Martins, G.H.M.; Alves, I.S.; Puggina, E.F. Effects of Competitive Standard, Team Formation and Playing Position on Match Running Performance of Brazilian Professional Soccer Players. Int. J. Perform. Anal. Sport 2017, 17, 695–705. [Google Scholar] [CrossRef]
- Bradley, P.S.; Lago-Peñas, C.; Rey, E.; Sampaio, J. The Influence of Situational Variables on Ball Possession in the English Premier League. J. Sports Sci. 2014, 32, 1867–1873. [Google Scholar] [CrossRef] [PubMed]
- Silva, R.; Ceylan, H.; Georgian, B.; Nobari, H.; Carvalho, S.; Sant’ana, T.; Mendes, B.; Chen, Y.S.; Clemente, F. Match-to-Match Variations in External Load Measures during Congested Weeks in Professional Male Soccer Players. J. Men’s Health 2021, 1–11. [Google Scholar] [CrossRef]
- Gregson, W.; Drust, B.; Atkinson, G.; Salvo, V. Match-to-Match Variability of High-Speed Activities in Premier League Soccer. Int. J. Sports Med. 2010, 31, 237–242. [Google Scholar] [CrossRef] [PubMed] [Green Version]
- Yi, Q.; Gómez-Ruano, M.-Á.; Liu, H.; Zhang, S.; Gao, B.; Wunderlich, F.; Memmert, D. Evaluation of the Technical Performance of Football Players in the UEFA Champions League. Int. J. Environ. Res. Public Health 2020, 17, 604. [Google Scholar] [CrossRef] [Green Version]
- Yi, Q.; Gómez, M.-Á.; Liu, H.; Gao, B.; Wunderlich, F.; Memmert, D. Situational and Positional Effects on the Technical Variation of Players in the UEFA Champions League. Front. Psychol. 2020, 11, 1201. [Google Scholar] [CrossRef] [PubMed]
- Kubayi, A.; Toriola, A. The Influence of Situational Variables on Ball Possession in the South African Premier Soccer League. J. Hum. Kinet. 2019, 66, 175–181. [Google Scholar] [CrossRef] [Green Version]
- Trecroci, A.; Porcelli, S.; Perri, E.; Pedrali, M.; Rasica, L.; Alberti, G.; Longo, S.; Iaia, F.M. Effects of Different Training Interventions on the Recovery of Physical and Neuromuscular Performance after a Soccer Match. J. Strength Cond. Res. 2020, 34, 2189–2196. [Google Scholar] [CrossRef]
- Trecroci, A.; Boccolini, G.; Duca, M.; Formenti, D.; Alberti, G. Mental Fatigue Impairs Physical Activity, Technical and Decision-Making Performance during Small-Sided Games. PLoS ONE 2020, 15, e0238461. [Google Scholar] [CrossRef]
- Branquinho, L.; Ferraz, R.; Travassos, B.; Marinho, D.A.; Marques, M.C. Effects of Different Recovery Times on Internal and External Load During Small-Sided Games in Soccer. Sports Health 2021. [Google Scholar] [CrossRef] [PubMed]
- Teixeira, J.E.; Forte, P.; Ferraz, R.; Leal, M.; Ribeiro, J.; Silva, A.J.; Barbosa, T.M.; Monteiro, A.M. Quantifying Sub-Elite Youth Football Weekly Training Load and Recovery Variation. Appl. Sci. 2021, 11, 4871. [Google Scholar] [CrossRef]


| Match Location (n = 128) | Quality of Opposition (n = 128) | Match Outcome (n = 128) | ||||||
|---|---|---|---|---|---|---|---|---|
| Measures | Away (n = 60) | Home (n = 68) | Low-Rank (n = 36) | Medium-Rank (n = 41) | High-Rank (n = 51) | Lose (n = 61) | Draw (n = 36) | Win (n = 31) |
| TD (km) | 10.91 ± 0.83 | 10.95 ± 0.81 | 10.90 ± 0.79 | 10.86 ± 0.73 | 10.99 ± 0.91 | 10.89 ± 0.84 | 10.92 ± 0.78 | 11.00 ± 0.85 |
| AvS (m · min−1) | 0.63 ± 0.23 | 0.66 ± 0.25 | 0.59 ± 0.24 | 0.62 ± 0.24 | 0.69 ± 0.24 | 0.064 ± 0.23 | 0.66 ± 0.28 | 0.64 ± 0.24 |
| rHSR (m) | 68.62 ± 15.23 | 64.17 ± 20.41 | 69.94 ± 15.73 | 61.00 ± 19.95 | 68.57 ± 16.91 | 67.90 ± 15.41 | 61.56 ± 21.27 | 69.61 ±17.64 |
| SPR (n) | 88.74 ± 23.48 | 81.32 ± 23.60 | 85.53 ± 20.39 | 84.41 ± 26.61 | 85.75 ± 23.93 | 87.29 ± 20.41 | 78.08 ± 23.89 | 89.58 ± 28.21 |
| ACC (n) | 40.32 ± 13.48 | 42.03 ± 15.33 | 39.28 ± 14.15 | 39.95 ± 14.09 | 43.37 ± 14.66 | 40.48 ± 13.44 | 42.28 ± 16.19 | 41.07 ± 14.19 |
| DEC (n) | 0.09 ± 0.01 | 0.09 ± 0.01 | 0.09 ± 0.01 | 0.09 ± 0.01 | 0.09 ± 0.01 | 0.09 ± 0.01 | 0.09 ± 0.01 | 0.09 ± 0.018 |
| Variables | Playing Positions | ||||||||||
|---|---|---|---|---|---|---|---|---|---|---|---|
| Measures | Inference | CD vs. FB | CD vs. WM | CD vs. CM | CD vs. FW | FB vs. WM | FB vs. CM | FB vs. FW | CM vs. WM | CM vs. FW | WM vs. FW |
| TD (km) | d | 0.66 | 0.81 | 1.57 | 0.21 | 0.73 | 0.97 | 0.54 | 0.33 | 1.64 | 1.58 |
| 95% CI | 0.55–0.77 | 0.57–1.05 | 1.32–1.82 | 0.17–0.25 | 0.60–0.86 | 0.80–1.14 | 0.38–0.70 | 0.27–0.39 | 1.41–1.87 | 1.29–1.87 | |
| SWC | 0.13 | 0.28 | 0.29 | 0.04 | 0.15 | 0.20 | 0.19 | 0.07 | 0.27 | 0.34 | |
| AvS (m · min−1) | d | 0.55 | 0.58 | 0.92 | 0.06 | 0.49 | 0.98 | 1.17 | 0.52 | 1.56 | 1.26 |
| 95% CI | 0.37–0.73 | 0.52–0.64 | 0.87–0.97 | 0.03–0.09 | 0.44–0.54 | 0.92–1.04 | 1.14–1.20 | 0.51–0.53 | 1.55–1.57 | 1.23–1.29 | |
| SWC | 0.21 | 0.06 | 0.06 | 0.03 | 0.06 | 0.06 | 0.04 | 0.01 | 0.01 | 0.03 | |
| rHSR (m) | d | 0.66 | 0.81 | 1.57 | 0.21 | 0.73 | 0.97 | 0.54 | 0.33 | 1.64 | 1.58 |
| 95% CI | 0.50–0.82 | 0.78–0.84 | 1.52–1.62 | 0.12–0.30 | 0.70–0.76 | 0.96–0.99 | 0.42–0.57 | 0.19–0.47 | 1.62–1.66 | 1.55–1.61 | |
| SWC | 0.18 | 0.03 | 0.06 | 0.10 | 0.04 | 0.01 | 1.10 | 0.16 | 0.02 | 0.03 | |
| SPR (n) | d | 1.38 | 1.29 | 0.51 | 0.43 | 0.79 | 0.59 | 0.79 | 1.21 | 0.15 | 1.39 |
| 95% CI | 1.33–1.43 | 1.27–1.31 | 0.49–0.53 | 0.38–0.48 | 0.78–0.80 | 0.58–0.59 | 0.23–1.35 | 1.14–1.28 | 0.07–0.23 | 1.00–1.78 | |
| SWC | 0.06 | 0.03 | 0.03 | 0.05 | 0.02 | 0.01 | 0.64 | 0.08 | 0.09 | 0.45 | |
| ACC (n) | d | 0.38 | 0.33 | 0.20 | 0.59 | 0.87 | 0.30 | 0.52 | 0.92 | 0.59 | 0.67 |
| 95% CI | 0.51–0.61 | 1.27–1.37 | 0.56–0.70 | 0.48–0.49 | 1.92–2.16 | 0.55–0.78 | 0.67–0.85 | 0.97–1.01 | 1.60–1.71 | 1.04–1.08 | |
| SWC | 0.06 | 0.06 | 0.08 | 0.01 | 0.14 | 0.13 | 0.10 | 0.02 | 0.07 | 0.03 | |
| DEC (n) | d | 0.56 | 0.56 | 0.63 | 0.49 | 2.04 | 0.66 | 0.76 | 0.99 | 1.65 | 1.06 |
| 95% CI | 0.01–1.14 | 1.98–2.31 | 1.14–1.27 | 0.55–0.62 | 1.26–1.62 | 0.53–0.63 | 0.51–0.61 | 1.25–1.34 | 1.89–1.99 | 0.67–1.40 | |
| SWC | 0.08 | 0.19 | 0.08 | 0.04 | 0.21 | 0.06 | 0.05 | 0.05 | 0.06 | 0.42 | |
| Variables | Playing Positions | ||||||||||
|---|---|---|---|---|---|---|---|---|---|---|---|
| Measures | Inference | CD vs. FB | CD vs. WM | CD vs. CM | CD vs. FW | FB vs. WM | FB vs. CM | FB vs. FW | CM vs. WM | CM vs. FW | WM vs. FW |
| TD (km) | d | 0.66 | 1.63 | 1.07 | 0.76 | 0.83 | 1.09 | 1.22 | 0.35 | 1.33 | 2.14 |
| 95% CI | 0.62–0.70 | 1.58–1.68 | 1.00–1.14 | 0.69–0.83 | 0.76–0.90 | 1.03–1.15 | 1.18–1.26 | 0.34–0.35 | 1.20–1.46 | 1.88–2.40 | |
| SWC | 0.05 | 0.06 | 0.08 | 0.08 | 0.08 | 0.06 | 0.04 | 0.01 | 0.15 | 0.30 | |
| AvS (m · min−1) | d | 0.45 | 1.13 | 1.53 | 0.38 | 1.53 | 1.07 | 0.91 | 0.53 | 0.13 | 1.59 |
| 95% CI | 0.41–0.49 | 1.04–1.22 | 1.50–1.56 | 0.26–0.50 | 1.42–1.64 | 1.00–1.14 | 0.87–0.95 | 0.48–0.58 | 0.08–0.18 | 1.38–1.80 | |
| SWC | 0.05 | 0.10 | 0.04 | 0.14 | 0.12 | 0.08 | 0.05 | 0.06 | 0.06 | 0.24 | |
| rHSR (m) | d | 0.57 | 0.95 | 1.06 | 0.39 | 0.74 | 0.98 | 0.86 | 0.34 | 1.15 | 1.79 |
| 95% CI | 0.46–0.68 | 0.83–1.07 | 1.01–1.11 | 0.33–0.45 | 0.71–0.77 | 0.96–1.00 | 0.73–0.99 | 0.33–0.35 | 1.14–1.15 | 1.77–1.81 | |
| SWC | 0.13 | 0.14 | 0.06 | 0.07 | 0.03 | 0.03 | 0.15 | 0.01 | 0.01 | 0.02 | |
| SPR (n) | d | 1.39 | 1.93 | 0.51 | 0.72 | 0.93 | 0.62 | 1.09 | 1.28 | 1.74 | 1.79 |
| 95% CI | 1.35–1.43 | 1.83–2.03 | 0.46–0.56 | 0.54–0.90 | 0.88–0.98 | 0.61–0.63 | 1.00–1.18 | 1.27–1.28 | 1.70–1.78 | 0.45–3.13 | |
| SWC | 0.05 | 0.12 | 0.06 | 0.21 | 0.05 | 0.01 | 0.10 | 0.01 | 0.04 | 1.55 | |
| ACC (n) | d | 0.82 | 1.21 | 0.55 | 0.29 | 1.29 | 0.52 | 0.56 | 0.98 | 1.67 | 1.91 |
| 95% CI | 0.71–0.93 | 1.04–1.38 | 0.52–0.58 | 0.28–0.30 | 1.16–1.42 | 0.49–0.55 | 0.50–0.62 | 0.95–1.01 | 1.64–1.70 | 1.76–2.06 | |
| SWC | 0.13 | 0.20 | 0.03 | 0.01 | 0.15 | 0.03 | 0.06 | 0.04 | 0.03 | 0.18 | |
| DEC (n) | d | 0.92 | 1.78 | 1.44 | 0.62 | 1.42 | 0.85 | 0.42 | 0.42 | 1.27 | 1.06 |
| 95% CI | 0.76–1.08 | 1.47–2.09 | 1.19–1.69 | 0.51–0.73 | 1.17–1.67 | 0.70–1.00 | 0.35–0.49 | 0.35–0.49 | 1.05–1.49 | 0.88–1.24 | |
| SWC | 0.18 | 0.36 | 0.29 | 0.12 | 0.28 | 0.17 | 0.08 | 0.08 | 0.25 | 0.21 | |
| Variables | Playing Positions | ||||||||||
|---|---|---|---|---|---|---|---|---|---|---|---|
| Measures | Inference | CD vs. FB | CD vs. WM | CD vs. CM | CD vs. FW | FB vs. WM | FB vs. CM | FB vs. FW | CM vs. WM | CM vs. FW | WM vs. FW |
| TD (km) | d | 1.07 | 0.39 | 0.74 | 0.98 | 1.86 | 0.34 | 1.15 | 1.79 | 1.07 | 0.39 |
| 95% CI | 0.81–1.33 | 0.09–0.69 | 0.45–1.03 | 0.97–0.99 | 1.79–1.93 | 0.26–0.42 | 0.98–1.32 | 1.78–1.79 | 0.90–1.24 | 0.22–0.56 | |
| SWC | 0.30 | 0.35 | 0.33 | 0.01 | 0.08 | 0.09 | 0.19 | 0.01 | 0.19 | 0.20 | |
| AvS (m · min−1) | d | 0.66 | 1.18 | 1.54 | 0.17 | 0.55 | 0.96 | 0.51 | 0.52 | 0.01 | 1.17 |
| 95% CI | 0.47–0.85 | 1.12–1.24 | 1.49–1.59 | 0.10–0.24 | 0.49–0.61 | 0.90–1.02 | 0.41–0.61 | 0.51–0.53 | –0.02–0.03 | 1.11–1.23 | |
| SWC | 0.22 | 0.07 | 0.06 | 0.09 | 0.07 | 0.07 | 0.12 | 0.01 | 0.04 | 0.07 | |
| rHSR (m) | d | 2.12 | 2.49 | 0.61 | 1.72 | 0.85 | 0.79 | 1.83 | 1.36 | 1.11 | 0.69 |
| 95% CI | 1.97–2.27 | 2.38–2.60 | 0.58–0.64 | 1.69–1.75 | 0.82–0.88 | 0.77–0.81 | 1.81–1.85 | 1.21–1.51 | 1.07–1.15 | 0.63–0.75 | |
| SWC | 0.17 | 0.13 | 0.03 | 0.04 | 0.04 | 0.02 | 0.03 | 0.17 | 0.05 | 0.07 | |
| SPR (n) | d | 1.69 | 1.51 | 0.96 | 1.31 | 1.25 | 0.48 | 1.02 | 1.23 | 1.95 | 1.68 |
| 95% CI | 1.49–1.89 | 1.48–1.54 | 0.88–1.04 | 1.28–1.34 | 1.20–1.30 | 0.44–0.52 | 0.98–1.06 | 1.14–1.32 | 1.78–2.12 | 1.62–1.74 | |
| SWC | 0.23 | 0.04 | 0.10 | 0.03 | 0.06 | 0.05 | 0.05 | 0.10 | 0.20 | 0.07 | |
| ACC (n) | d | 0.56 | 1.32 | 0.63 | 0.49 | 2.04 | 0.66 | 0.76 | 0.99 | 1.66 | 1.06 |
| 95% CI | 0.53–0.59 | 1.19–1.45 | 0.60–0.66 | 0.46–0.52 | 2.00–2.08 | 0.63–0.69 | 0.74–0.78 | 0.91–1.07 | 1.64–1.68 | 1.00–1.12 | |
| SWC | 0.03 | 0.15 | 0.03 | 0.03 | 0.05 | 0.04 | 0.03 | 0.09 | 0.02 | 0.07 | |
| DEC (n) | d | 1.07 | 2.14 | 1.21 | 0.59 | 1.44 | 0.58 | 0.56 | 1.29 | 1.94 | 1.03 |
| 95% CI | 1.00–1.14 | 1.97–2.31 | 1.14–1.28 | 0.55–0.63 | 1.43–1.45 | 0.53–0.63 | 0.51–0.61 | 1.25–1.33 | 1.89–1.99 | 1.01–1.05 | |
| SWC | 0.08 | 0.19 | 0.08 | 0.04 | 0.01 | 0.06 | 0.05 | 0.05 | 0.06 | 0.02 | |
| Measures | CD (n = 36) | FB (n = 31) | WM (n = 19) | CM (n = 33) | FW (n = 9) | ALL (n = 128) | Follow-Up (Post Hoc’s) |
|---|---|---|---|---|---|---|---|
| TD (km) | 10.42 ± 0.69 | 10.82 ± 0.64 | 11.29 ± 0.55 | 11.54 ± 0.76 | 10.27 ± 0.69 | 10.93 ± 0.82 | CM = WM > FB > FW > CD |
| AvS (m · min−1) | 0.09 ± 0.07 | 0.09 ± 0.01 | 0.09 ± 0.01 | 0.09 ± 0.01 | 0.09 ± 0.01 | 0.09 ± 0.01 | CM = WM > FB > FW > CD |
| rHSR (m) | 0.49 ± 0.66 | 0.77 ± 0.17 | 0.89 ± 0.21 | 0.58 ± 0.24 | 0.52 ± 0.21 | 0.64 ± 0.24 | WM = FB > CM > FW > CD |
| SPR (n) | 32.19 ± 10.62 | 46.26 ± 10.58 | 55.58 ± 12.20 | 38.73 ± 14.66 | 37.44 ± 12.76 | 41.13 ± 1.27 | WM = FB > CM > FW > CD |
| ACC (n) | 62.53 ± 17.47 | 66.52 ± 8.76 | 80.89 ± 21.59 | 61.67 ± 20.75 | 70.11 ± 5.11 | 66.53 ± 1.58 | FB = FW = WM > CM > CD |
| DEC (n) | 69.17 ± 14.14 | 83.42 ± 12.12 | 103.42 ± 21.57 | 96.42 ± 29.08 | 77.89 ± 11.47 | 41.13 ± 23.74 | WM = CM > FB > FW > CD |
Publisher’s Note: MDPI stays neutral with regard to jurisdictional claims in published maps and institutional affiliations. |
© 2021 by the authors. Licensee MDPI, Basel, Switzerland. This article is an open access article distributed under the terms and conditions of the Creative Commons Attribution (CC BY) license (https://creativecommons.org/licenses/by/4.0/).
Share and Cite
Teixeira, J.E.; Leal, M.; Ferraz, R.; Ribeiro, J.; Cachada, J.M.; Barbosa, T.M.; Monteiro, A.M.; Forte, P. Effects of Match Location, Quality of Opposition and Match Outcome on Match Running Performance in a Portuguese Professional Football Team. Entropy 2021, 23, 973. https://0-doi-org.brum.beds.ac.uk/10.3390/e23080973
Teixeira JE, Leal M, Ferraz R, Ribeiro J, Cachada JM, Barbosa TM, Monteiro AM, Forte P. Effects of Match Location, Quality of Opposition and Match Outcome on Match Running Performance in a Portuguese Professional Football Team. Entropy. 2021; 23(8):973. https://0-doi-org.brum.beds.ac.uk/10.3390/e23080973
Chicago/Turabian StyleTeixeira, José E., Miguel Leal, Ricardo Ferraz, Joana Ribeiro, José M. Cachada, Tiago M. Barbosa, António M. Monteiro, and Pedro Forte. 2021. "Effects of Match Location, Quality of Opposition and Match Outcome on Match Running Performance in a Portuguese Professional Football Team" Entropy 23, no. 8: 973. https://0-doi-org.brum.beds.ac.uk/10.3390/e23080973