
A Fast and Robust UHPLC-MRM-MS Method to Characterize and Quantify Grape Skin Tannins after Chemical Depolymerization

 ,
,
Abstract
:1. Introduction
2. Results and Discussion
2.1. Optimization
2.2. Method Validation
2.2.1. Linearity
2.2.2. Recovery and Precision
2.2.3. Limits of Detection (LOD) and Quantification (LOQ)
2.2.4. Matrix Effects
2.2.5. Stability
2.3. Advantages of the Method
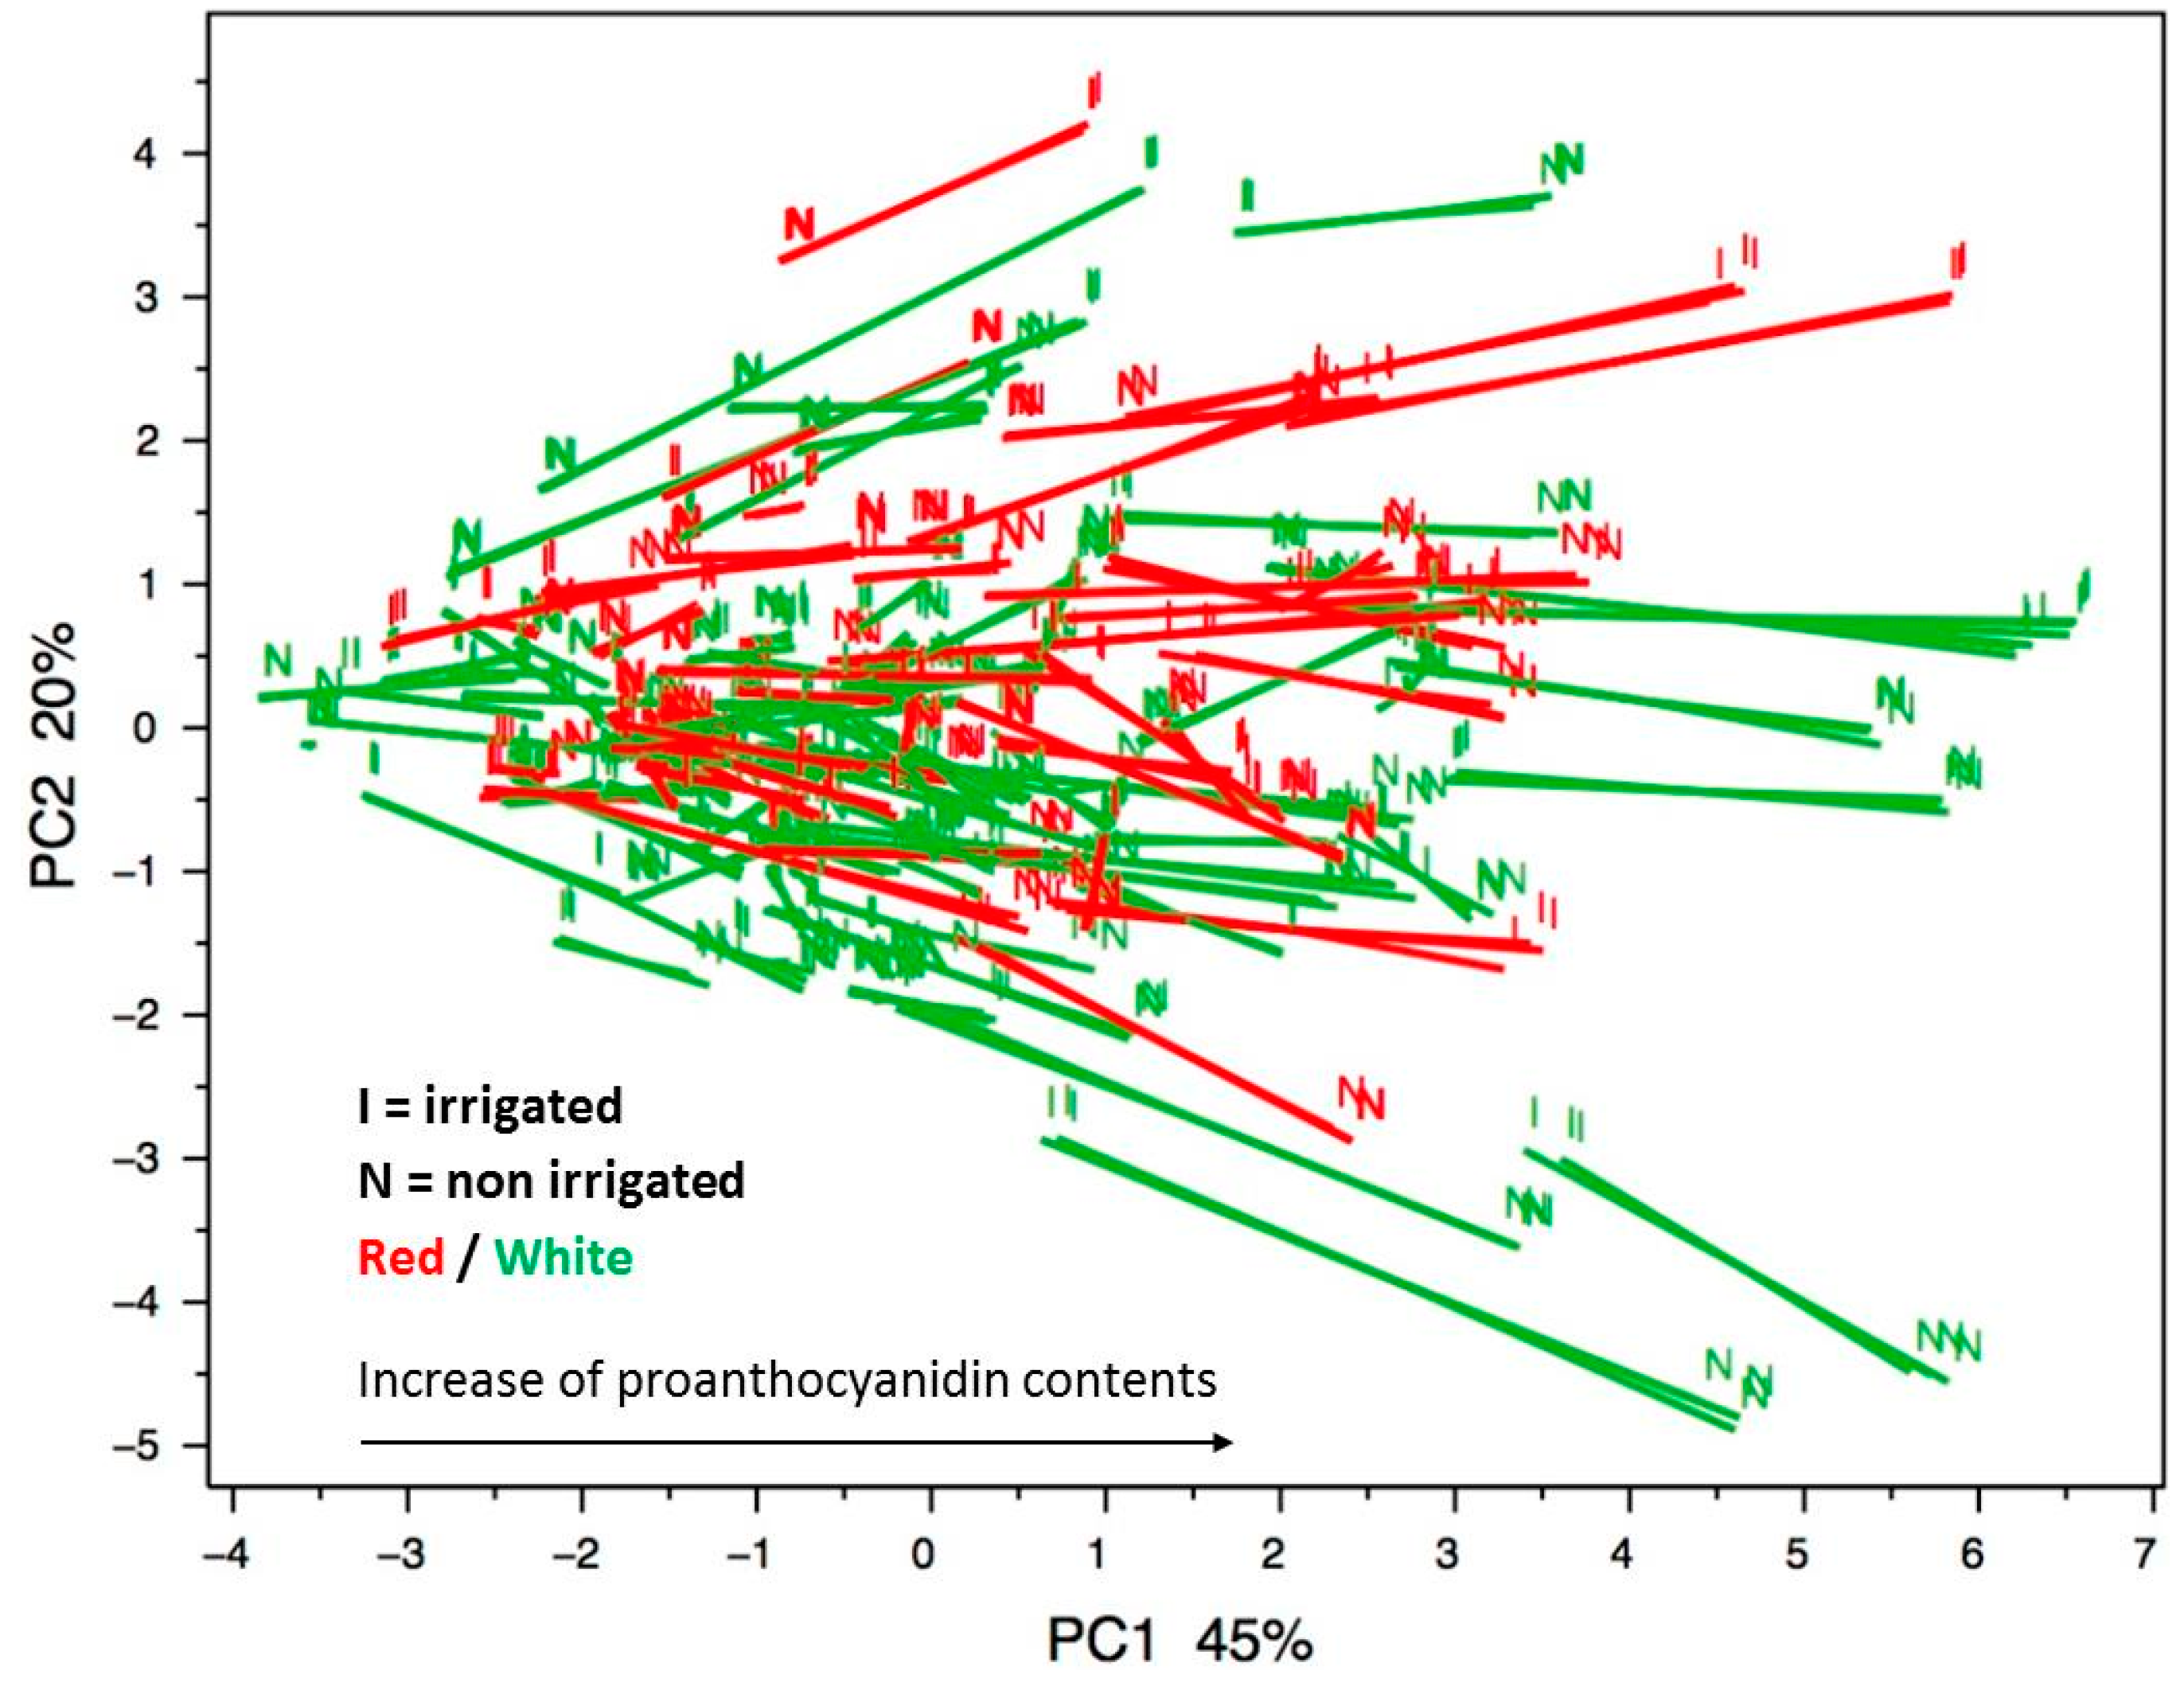
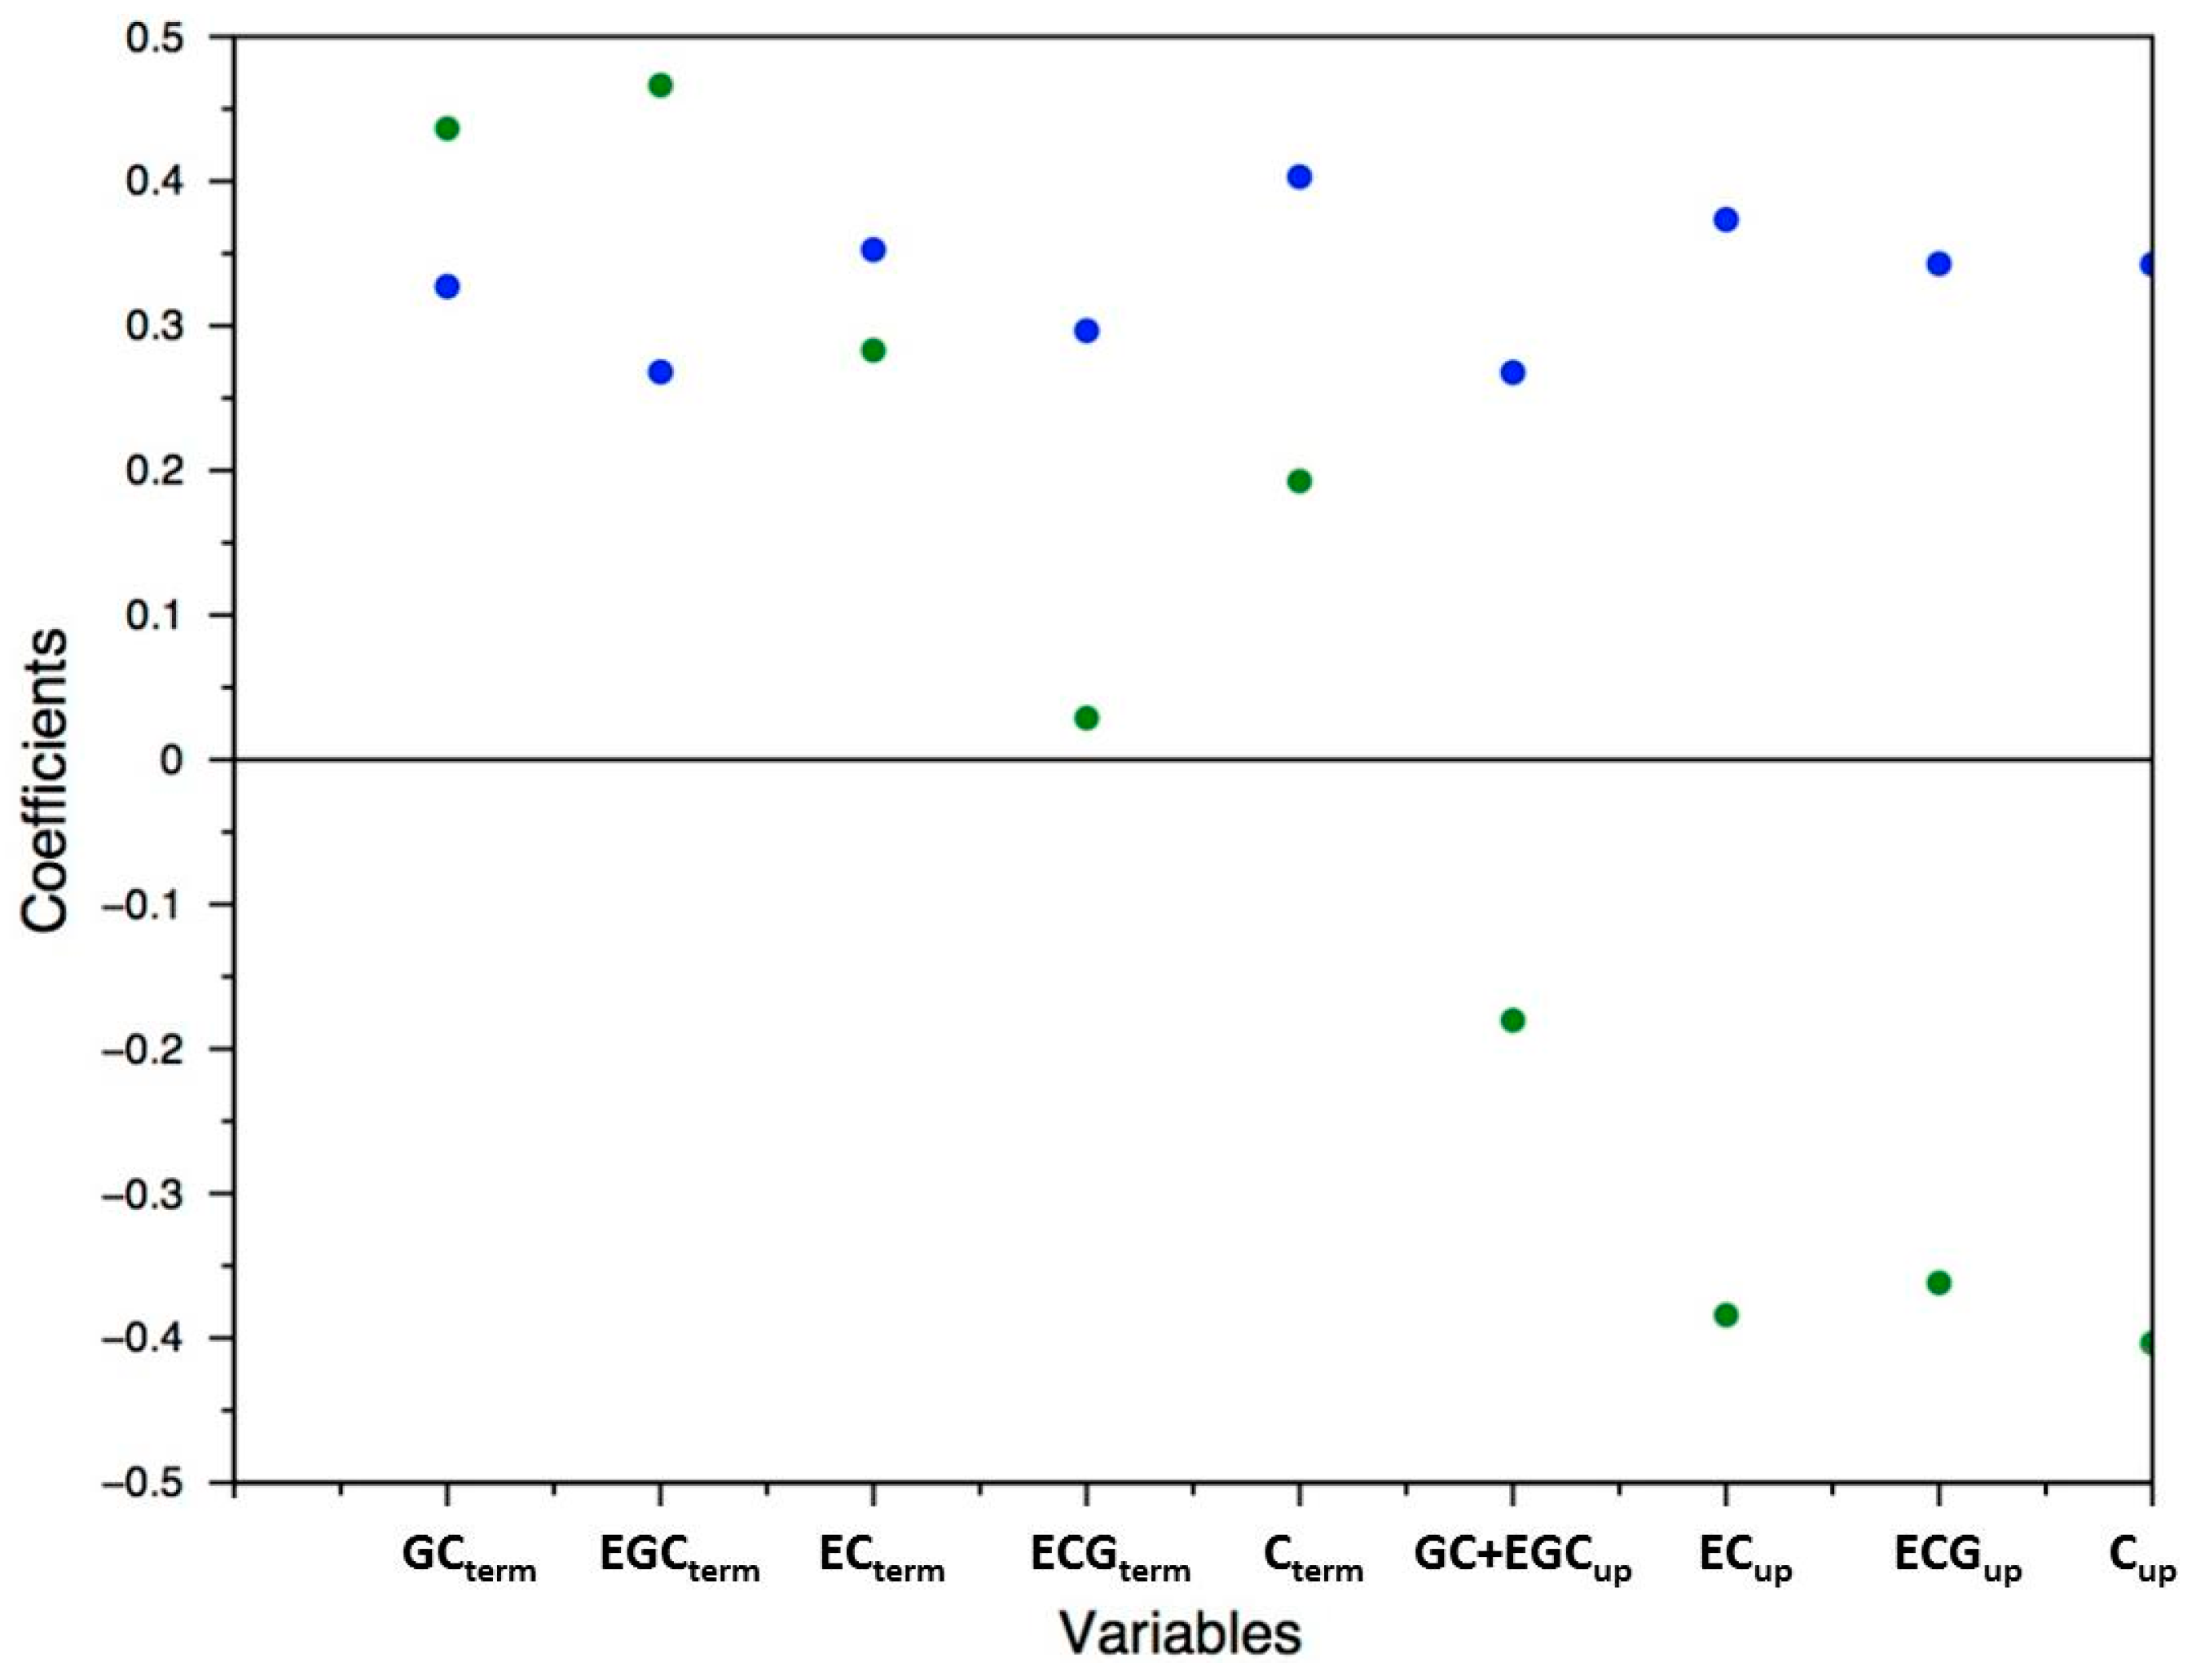
2.4. Application to Large-Scale Analysis of Grape Skin Proanthocyanidin Composition
3. Experimental Section
3.1. Chemicals
3.2. Samples
3.3. Standard and Sample Preparation
3.3.1. Sample Preparation for UHPLC-QqQ-MS Analysis
3.3.2. Sample Preparation for Method Validation
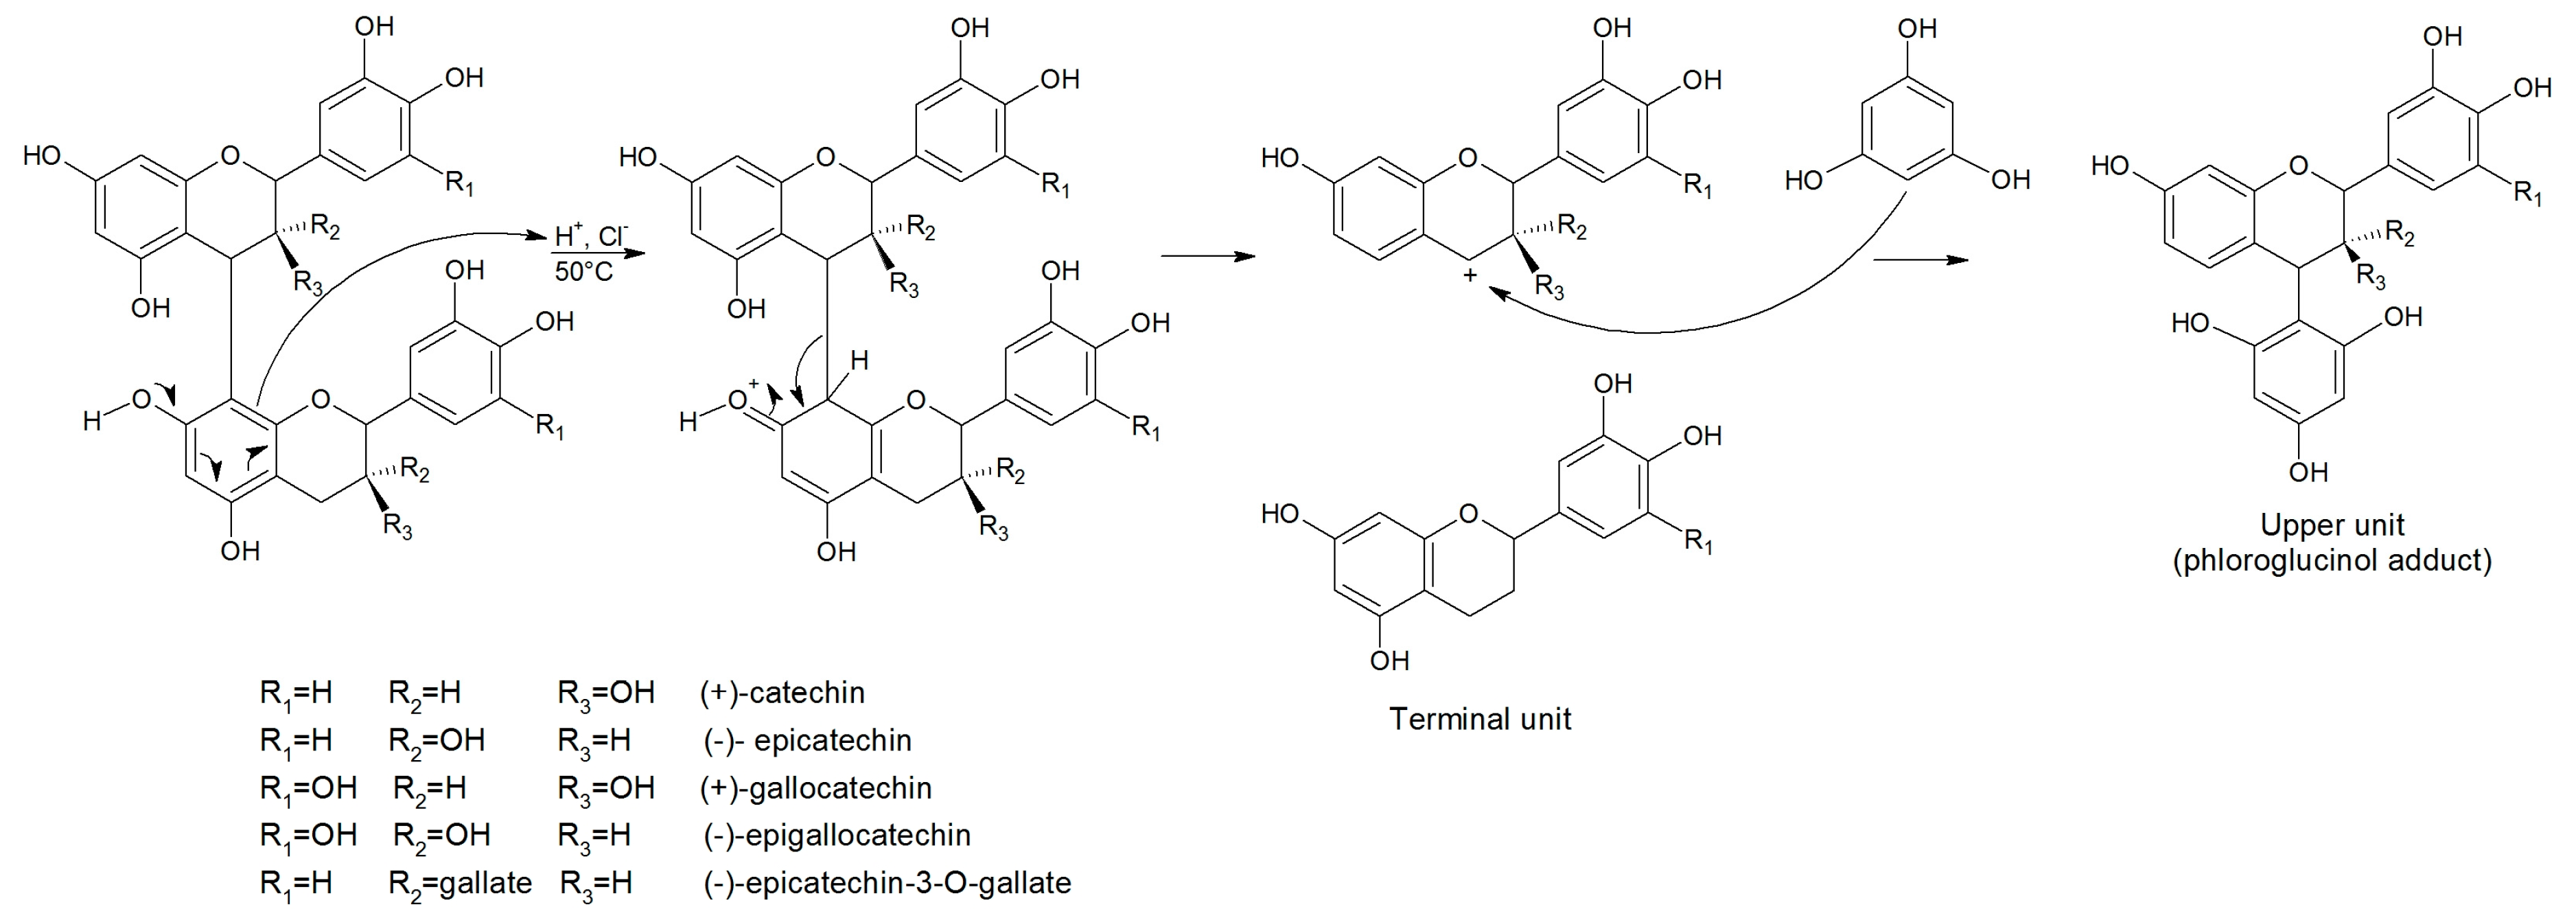
3.3.3. Phloroglucinolysis Reaction
3.4. UHPLC-QqQ-MS Conditions
3.5. Chemometrics
4. Conclusions
Supplementary Materials
Acknowledgments
Author Contributions
Conflicts of Interest
References
- Hayhoe, K.; Cayan, D.; Field, C.B.; Frumhoff, P.C.; Maurer, E.P.; Miller, N.L.; Moser, S.C.; Schneider, S.H.; Cahill, K.N.; Cleland, E.E.; et al. Emissions Pathways, Climate Change, and Impacts on California. Proc. Natl. Acad. Sci. USA 2004, 101, 12422–12427. [Google Scholar] [CrossRef] [PubMed]
- Lobell, D.B.; Field, C.B.; Nicholas Cahill, K.; Bonfils, C. Impacts of future climate change on California perennial crop yields: Model projections withclimate and crop uncertainties. Agric. For. Meteorol. 2006, 141, 208–218. [Google Scholar] [CrossRef]
- Cheynier, V.; Dueñas-Paton, M.; Salas, E.; Maury, C.; Souquet, J.M.; Sarni-Manchado, P.; Fulcrand, H. Structure and Properties of Wine Pigments and Tannins. Am. J. Enol. Vitic. 2006, 57, 298–305. [Google Scholar]
- Souquet, J.-M.; Cheynier, V.; Brossaud, F.; Moutounet, M. Polymeric proanthocyanidins from grape skins. Phytochemistry 1996, 43, 509–512. [Google Scholar] [CrossRef]
- Huang, Y.-F.; Doligez, A.; Fournier-Level, A.; Le Cunff, L.; Bertrand, Y.; Canaguier, A.; Morel, C.; Miralles, V.; Veran, F.; Souquet, J.-M.; et al. Dissecting genetic architecture of grape proanthocyanidin composition through quantitative trait locus mapping. BMC Plant Biol. 2012, 12. [Google Scholar] [CrossRef] [PubMed]
- Ojeda, H.C.; Kraeva, E.; Carbonneau, A.; Deloire, A. Influence of pre- and post-véraison water deficit on synthesis and concentration of skin phenolic compounds during berry growth of Vitis vinifera cv. Shiraz. Am. J. Enol. Vitic. 2002, 53, 261–267. [Google Scholar]
- Kennedy, J.A.; Matthews, M.A.; Waterhouse, A.L. Effect of maturity and vine water status on grape skin and wine flavonoids. Am. J. Enol. Vitic. 2002, 53, 268–274. [Google Scholar]
- Olle, D.; Guiraud, J.L.; Souquet, J.M.; Terrier, N.; Ageorges, A.; Cheynier, V.; Verries, C. Effect of pre- and post-veraison water deficit on proanthocyanidin and anthocyanin accumulation during Shiraz berry development. Aust. J. Grape Wine Res. 2011, 17, 90–100. [Google Scholar] [CrossRef]
- Kennedy, J.A.; Jones, G.P. Analysis of proanthocyanidin cleavage products following acid-catalysis in the Presence of Excess Phloroglucinol. J. Agric. Food Chem. 2001, 49, 1740–1746. [Google Scholar] [CrossRef] [PubMed]
- Arapitsas, P.; Perenzoni, D.; Nicolini, G.; Mattivi, F. Study of sangiovese wines pigment profile by UHPLC-MS/MS. J. Agric. Food Chem. 2012, 60, 10461–10471. [Google Scholar] [CrossRef] [PubMed]
- Ehrhardt, C.; Arapitsas, P.; Stefanini, M.; Flick, G.; Mattivi, F. Analysis of the phenolic composition of fungus-resistant grape varieties cultivated in Italy and Germany using UHPLC-MS/MS. J. Mass Spectrom. 2014, 49, 860–869. [Google Scholar] [CrossRef] [PubMed]
- Lambert, M.; Meudec, E.; Verbaere, A.; Mazerolles, G.; Wirth, J.; Masson, G.; Cheynier, V.; Sommerer, N. A High-Throughput UHPLC-QqQ-MS Method for Polyphenol Profiling in Rosé Wines. Molecules 2015, 20, 7890–7914. [Google Scholar] [CrossRef] [PubMed]
- Li, H.J.; Deinzer, M.L. Tandem mass spectrometry for sequencing proanthocyanidins. Anal. Chem. 2007, 79, 1739–1748. [Google Scholar] [CrossRef] [PubMed]
- Gosetti, F.; Mazzucco, E.; Zampieri, D.; Gennaro, M.C. Signal suppression/enhancement in high-performance liquid chromatography tandem mass spectrometry. J. Chromatogr. A 2010, 1217, 3929–3937. [Google Scholar] [CrossRef] [PubMed]
- Nicolas, S.D.; Péros, J.-P.; Lacombe, T.; Launay, A.; Le Paslier, M.-C.; Bérard, A.; Mangin, B.; Valière, S.; Martins, F.; le Cunff, L.; et al. Genetic diversity, linkage disequilibrium and power of a large grapevine (Vitis vinifera L.) diversity panel newly designed for association studies. BMC Plant Biol. 2016, 16, 74. [Google Scholar] [CrossRef] [PubMed] [Green Version]
- Sample Availability: Samples are not available from the authors.


| Position | Compound | Ion Mode | m/z Precursor Ion a (Th) | m/z Quantifier a (Th) | m/z Qualifier a (Th) | Retention Time (min) | Calibration Range (µmol/L) |
|---|---|---|---|---|---|---|---|
| Upper units | Cup | + | 415.1 | 127.1 | 289.1 | 3.46 | as equivalents of ECterm |
| ECup | + | 415.1 | 127.1 | 289.1 | 4.09 | as equivalents of ECterm | |
| EGCup | + | 431.2 | 127.1 | 305.1 | 1.98 | as equivalents of ECterm | |
| ECGup | + | 567.2 | 153.1 | 247.2 | 4.94 | as equivalents of ECterm | |
| Terminal units | Cterm | + | 291.1 | 139.0 | 123.1 | 4.90 | 0.01–333.33 µmol/L |
| ECterm | + | 291.1 | 139.0 | 123.1 | 5.43 | 0.02–333.33 µmol/L | |
| GCterm | + | 307.1 | 139.0 | 151.0 | 3.23 | as equivalents of EGCterm | |
| EGCterm | + | 307.1 | 139.0 | 151.0 | 4.87 | 0.01–333.33 µmol/L | |
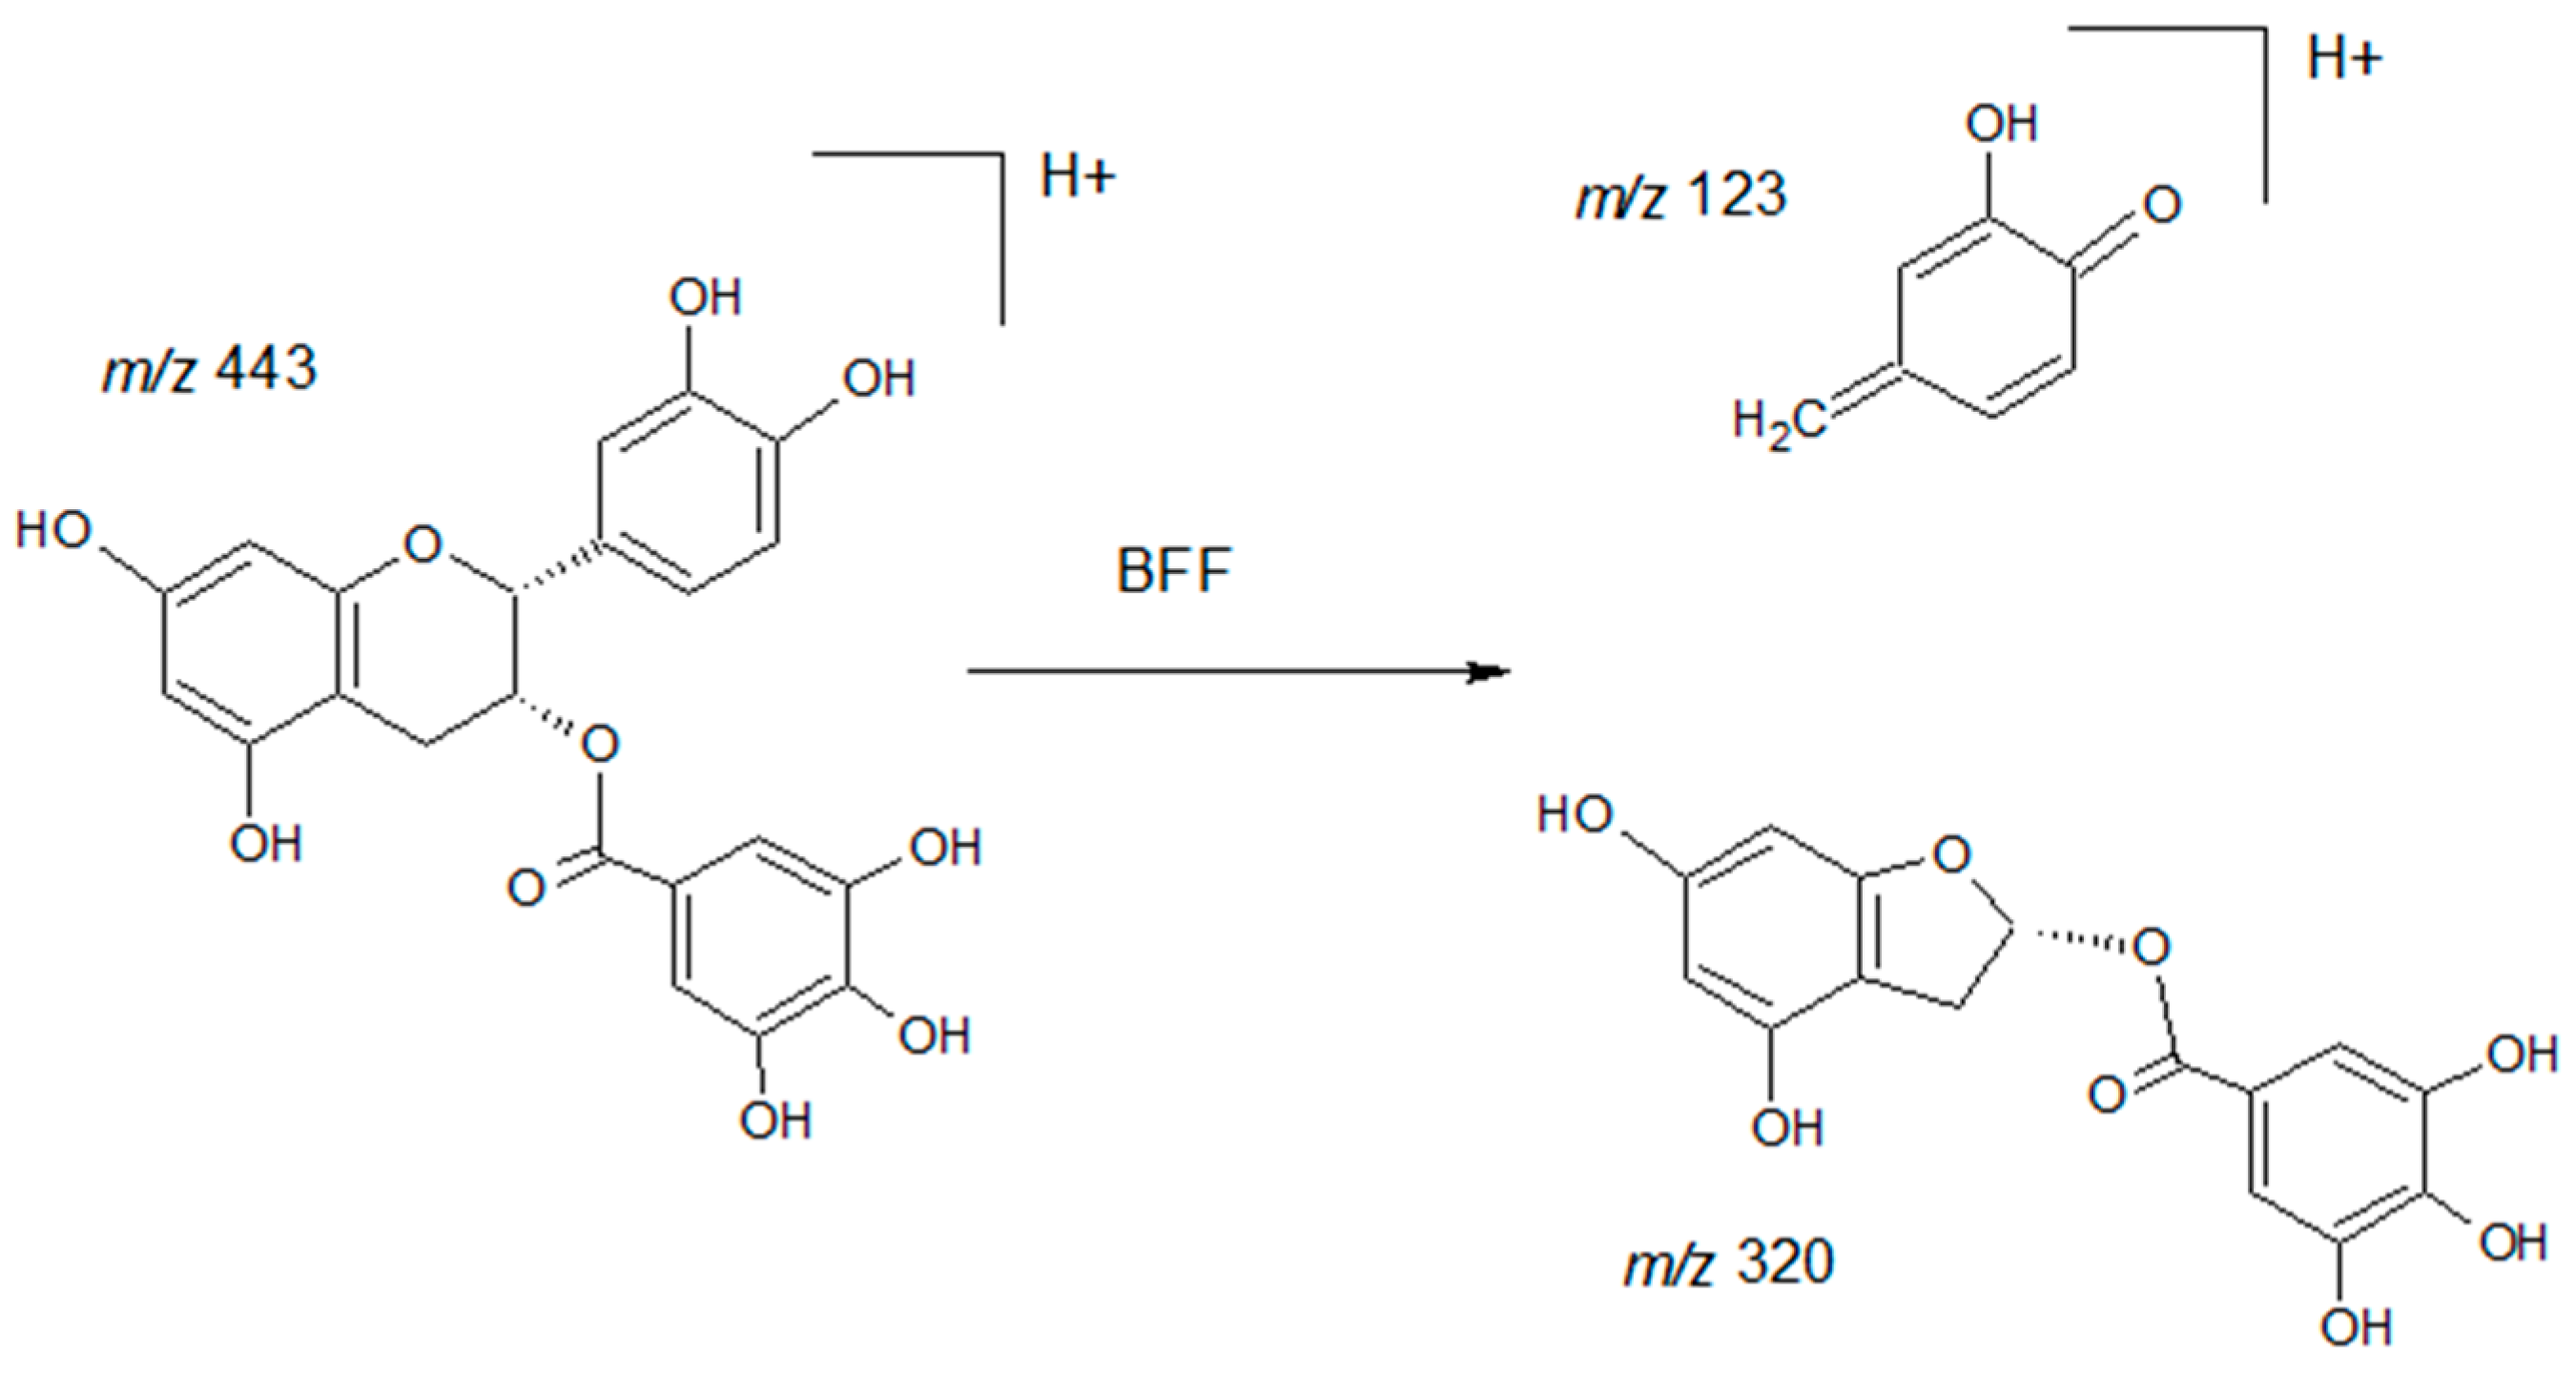
| ECGterm | + | 443.1 | 123.1 | 273.1 | 5.76 | 0.02–333.33 µmol/L |
| Grape Skin Extract | Cup | ECup | EGCup | ECGup | Cterm | ECterm | GCterm | EGCterm | ECGterm |
|---|---|---|---|---|---|---|---|---|---|
| Concentration (µmol/L) | |||||||||
| Composition of the extract used for validation | 0.6 | 168.9 | 104.6 | 14.2 | 13.3 | 0.9 | 4.0 | 0.7 | 0.4 |
| Average of measured concentrations | 0.6 | 109.5 | 51.0 | 7.1 | 14.1 | 1.3 | 4.7 | 0.7 | 0.4 |
| Lowest measured concentration | 0.14 | 18.0 | 1.5 | 0.9 | 3.1 | 0.2 | 0.4 | 0.02 | 0.06 |
| Highest measured concentration | 1.6 | 270.1 | 131.3 | 31.2 | 48.4 | 4.5 | 11.5 | 3.7 | 1.9 |
| ECup | EGCup | ECGup | Cterm | ECterm | EGCterm | ECGterm | |
|---|---|---|---|---|---|---|---|
| Concentration (µmol/L) | |||||||
| GE + A | 238.1 | ||||||
| GE + B | 166.6 | ||||||
| GE + C | 1074 | 171.7 | 101.4 | 536.7 | 489.2 | 110 | |
| GE + D | 358.4 | 98.9 | 33.4 | 141.3 | 122.8 | 47.4 | 27.7 |
| GE + E | 179.6 | 80.7 | 15.9 | 17.7 | 8.3 | 3.4 | 2 |
| GE + F | 131.9 | 75.9 | 11.2 | 9.8 | 0.9 | 0.5 | 0.4 |
| GE + G | 121.8 | 74.8 | 10.3 | 9.5 | 0.6 | 0.3 | |
| GE | 120 | 74.3 | 10 | 9.5 | 0.643 | 0.5 | 0.285 |
| LOD (µmol/L) | 0.026 | 0.008 | 0.029 | 0.021 | 0.008 | 0.002 | 0.007 |
| (nmol/g of grape skin) | 1.456 | 0.448 | 1.624 | 1.176 | 0.448 | 0.112 | 0.392 |
| LOQ (µmol/L) | 0.086 | 0.027 | 0.096 | 0.070 | 0.026 | 0.006 | 0.023 |
| (nmol/g of grape skin) | 4.816 | 1.512 | 5.376 | 3.920 | 1.456 | 0.336 | 1.288 |
| Recovery (%) | |||||||
| A | n.d | 95.0 ± 5.1 | n.d | n.d | n.d | n.d | n.d |
| B | n.d | 101.0 ± 5.9 | n.d | n.d | n.d | n.d | n.d |
| C | 98.0 ± 4.1 | 92.3 ± 5.4 | 85.0 ± 5.6 | 106.7 ± 4.6 | 132.7 ± 4.1 | n.a | 110.7 ± 4.9 |
| D | 104.3 ± 2.5 | 98.7 ± 3.4 | 98.3 ± 4.4 | 97.3 ± 3.5 | 124.3 ± 1.9 | 70.7 ± 2.8 | 114.0 ± 2.1 |
| E | 112.7 ± 2.9 | n.a | 95.0 ± 3.4 | 102.0 ± 4.4 | 127.3 ± 2.9 | 69.3 ± 3.8 | 113.3 ± 2.1 |
| F | n.a | n.a | n.a | 103.4 ± 0.6 | 116.3 ± 1.7 | 73.3 ± 2.0 | 107.0 ± 1.8 |
| G | n.a | n.a | n.a | n.a | 118.0 ± 3.3 | n.a | 108.3 ± 3.1 |
| Interday Precision (RSD %) | |||||||
| C | 5 | 9 | 5 | 6 | 7 | n.a | 7 |
| D | 3 | 6 | 6 | 3 | 3 | 3 | 5 |
| E | 6 | n.a | 6 | 5 | 6 | 3 | 4 |
| F | n.a | n.a | n.a | 5 | 5 | 3 | 7 |
| G | n.a | n.a | n.a | n.a | 8 | n.a | 9 |
| Intraday Precision (RSD %) | |||||||
| A | n.d | 5 | n.d | n.d | n.d | n.d | n.d |
| B | n.d | 6 | n.d | n.d | n.d | n.d | n.d |
| C | 4 | 5 | 5 | 5 | 6 | n.a | 6 |
| D | 2 | 3 | 4 | 3 | 2 | 2 | 2 |
| E | 3 | n.a | 3 | 5 | 5 | 3 | 2 |
| F | n.a | n.a | n.a | 1 | 2 | 1 | 2 |
| G | n.a | n.a | n.a | n.a | 3 | n.a | 3 |
| Suppression/Enhancement Effect (%) | |||||||
| A | n.d | 85.0 ± 10.0 | n.d | n.d | n.d | n.d | n.d |
| B | n.d | 96.0 ± 13.0 | n.d | n.d | n.d | n.d | n.d |
| C | 99.7 ± 4.3 | 105.0 ± 28.3 | 91.3 ± 5.3 | 104.0 ± 5.0 | 103.0 ± 4.0 | n.a | 97.7 ± 5.0 |
| D | 105.0 ± 2.3 | 91.0 ± 21.7 | 92.0 ± 4.6 | 104.3 ± 3.6 | 103.7 ± 2.0 | 110.3 ± 3.0 | 99.7 ± 2.0 |
| E | 120.3 ± 6.0 | n.a | 95.6 ± 5.0 | 110.3 ± 5.0 | 107.0 ± 4.3 | 106.7 ± 4.3 | 104.7 ± 2.3 |
| F | n.a | n.a | n.a | 116.3 ± 1.0 | 99.3 ± 2.0 | 101.3 ± 2.3 | 94.7 ± 1.7 |
| G | n.a | n.a | n.a | n.a | 99.3 ± 3.3 | n.a | 100.0 ± 3.7 |
| Stability (% loss) | |||||||
| 24 h | |||||||
| C | 8 | 8 | 1 | 7 | n.a | n.a | 8 |
| E | 4 | n.a | 5 | 4 | 1 | 1 | 4 |
| G | n.a | n.a | n.a | n.a | 7 | n.a | 3 |
| 48 h | |||||||
| C | 9 | 6 | 0 | 8 | 8 | n.a | 9 |
| E | 7 | n.a | 2 | 4 | 2 | 4 | 10 |
| G | n.a | n.a | n.a | n.a | 15 | n.a | 21 |
© 2016 by the authors. Licensee MDPI, Basel, Switzerland. This article is an open access article distributed under the terms and conditions of the Creative Commons Attribution (CC-BY) license ( http://creativecommons.org/licenses/by/4.0/).
Share and Cite
Pinasseau, L.; Verbaere, A.; Roques, M.; Meudec, E.; Vallverdú-Queralt, A.; Terrier, N.; Boulet, J.-C.; Cheynier, V.; Sommerer, N. A Fast and Robust UHPLC-MRM-MS Method to Characterize and Quantify Grape Skin Tannins after Chemical Depolymerization. Molecules 2016, 21, 1409. https://0-doi-org.brum.beds.ac.uk/10.3390/molecules21101409
Pinasseau L, Verbaere A, Roques M, Meudec E, Vallverdú-Queralt A, Terrier N, Boulet J-C, Cheynier V, Sommerer N. A Fast and Robust UHPLC-MRM-MS Method to Characterize and Quantify Grape Skin Tannins after Chemical Depolymerization. Molecules. 2016; 21(10):1409. https://0-doi-org.brum.beds.ac.uk/10.3390/molecules21101409
Chicago/Turabian StylePinasseau, Lucie, Arnaud Verbaere, Maryline Roques, Emmanuelle Meudec, Anna Vallverdú-Queralt, Nancy Terrier, Jean-Claude Boulet, Véronique Cheynier, and Nicolas Sommerer. 2016. "A Fast and Robust UHPLC-MRM-MS Method to Characterize and Quantify Grape Skin Tannins after Chemical Depolymerization" Molecules 21, no. 10: 1409. https://0-doi-org.brum.beds.ac.uk/10.3390/molecules21101409