
Exogenous Methyl Jasmonate and Salicylic Acid Induce Subspecies-Specific Patterns of Glucosinolate Accumulation and Gene Expression in Brassica oleracea L.


 ,
,
Abstract
: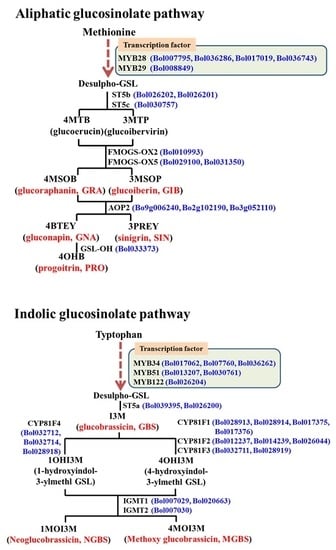
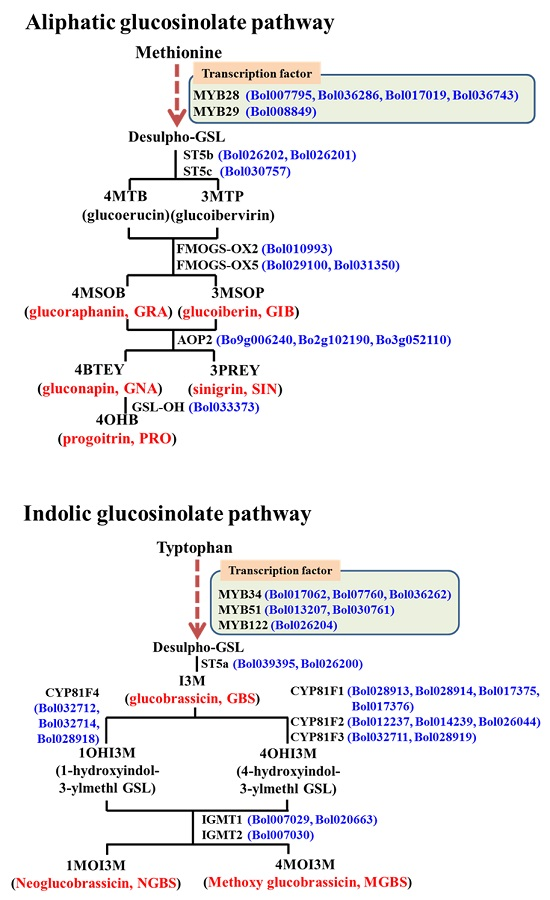
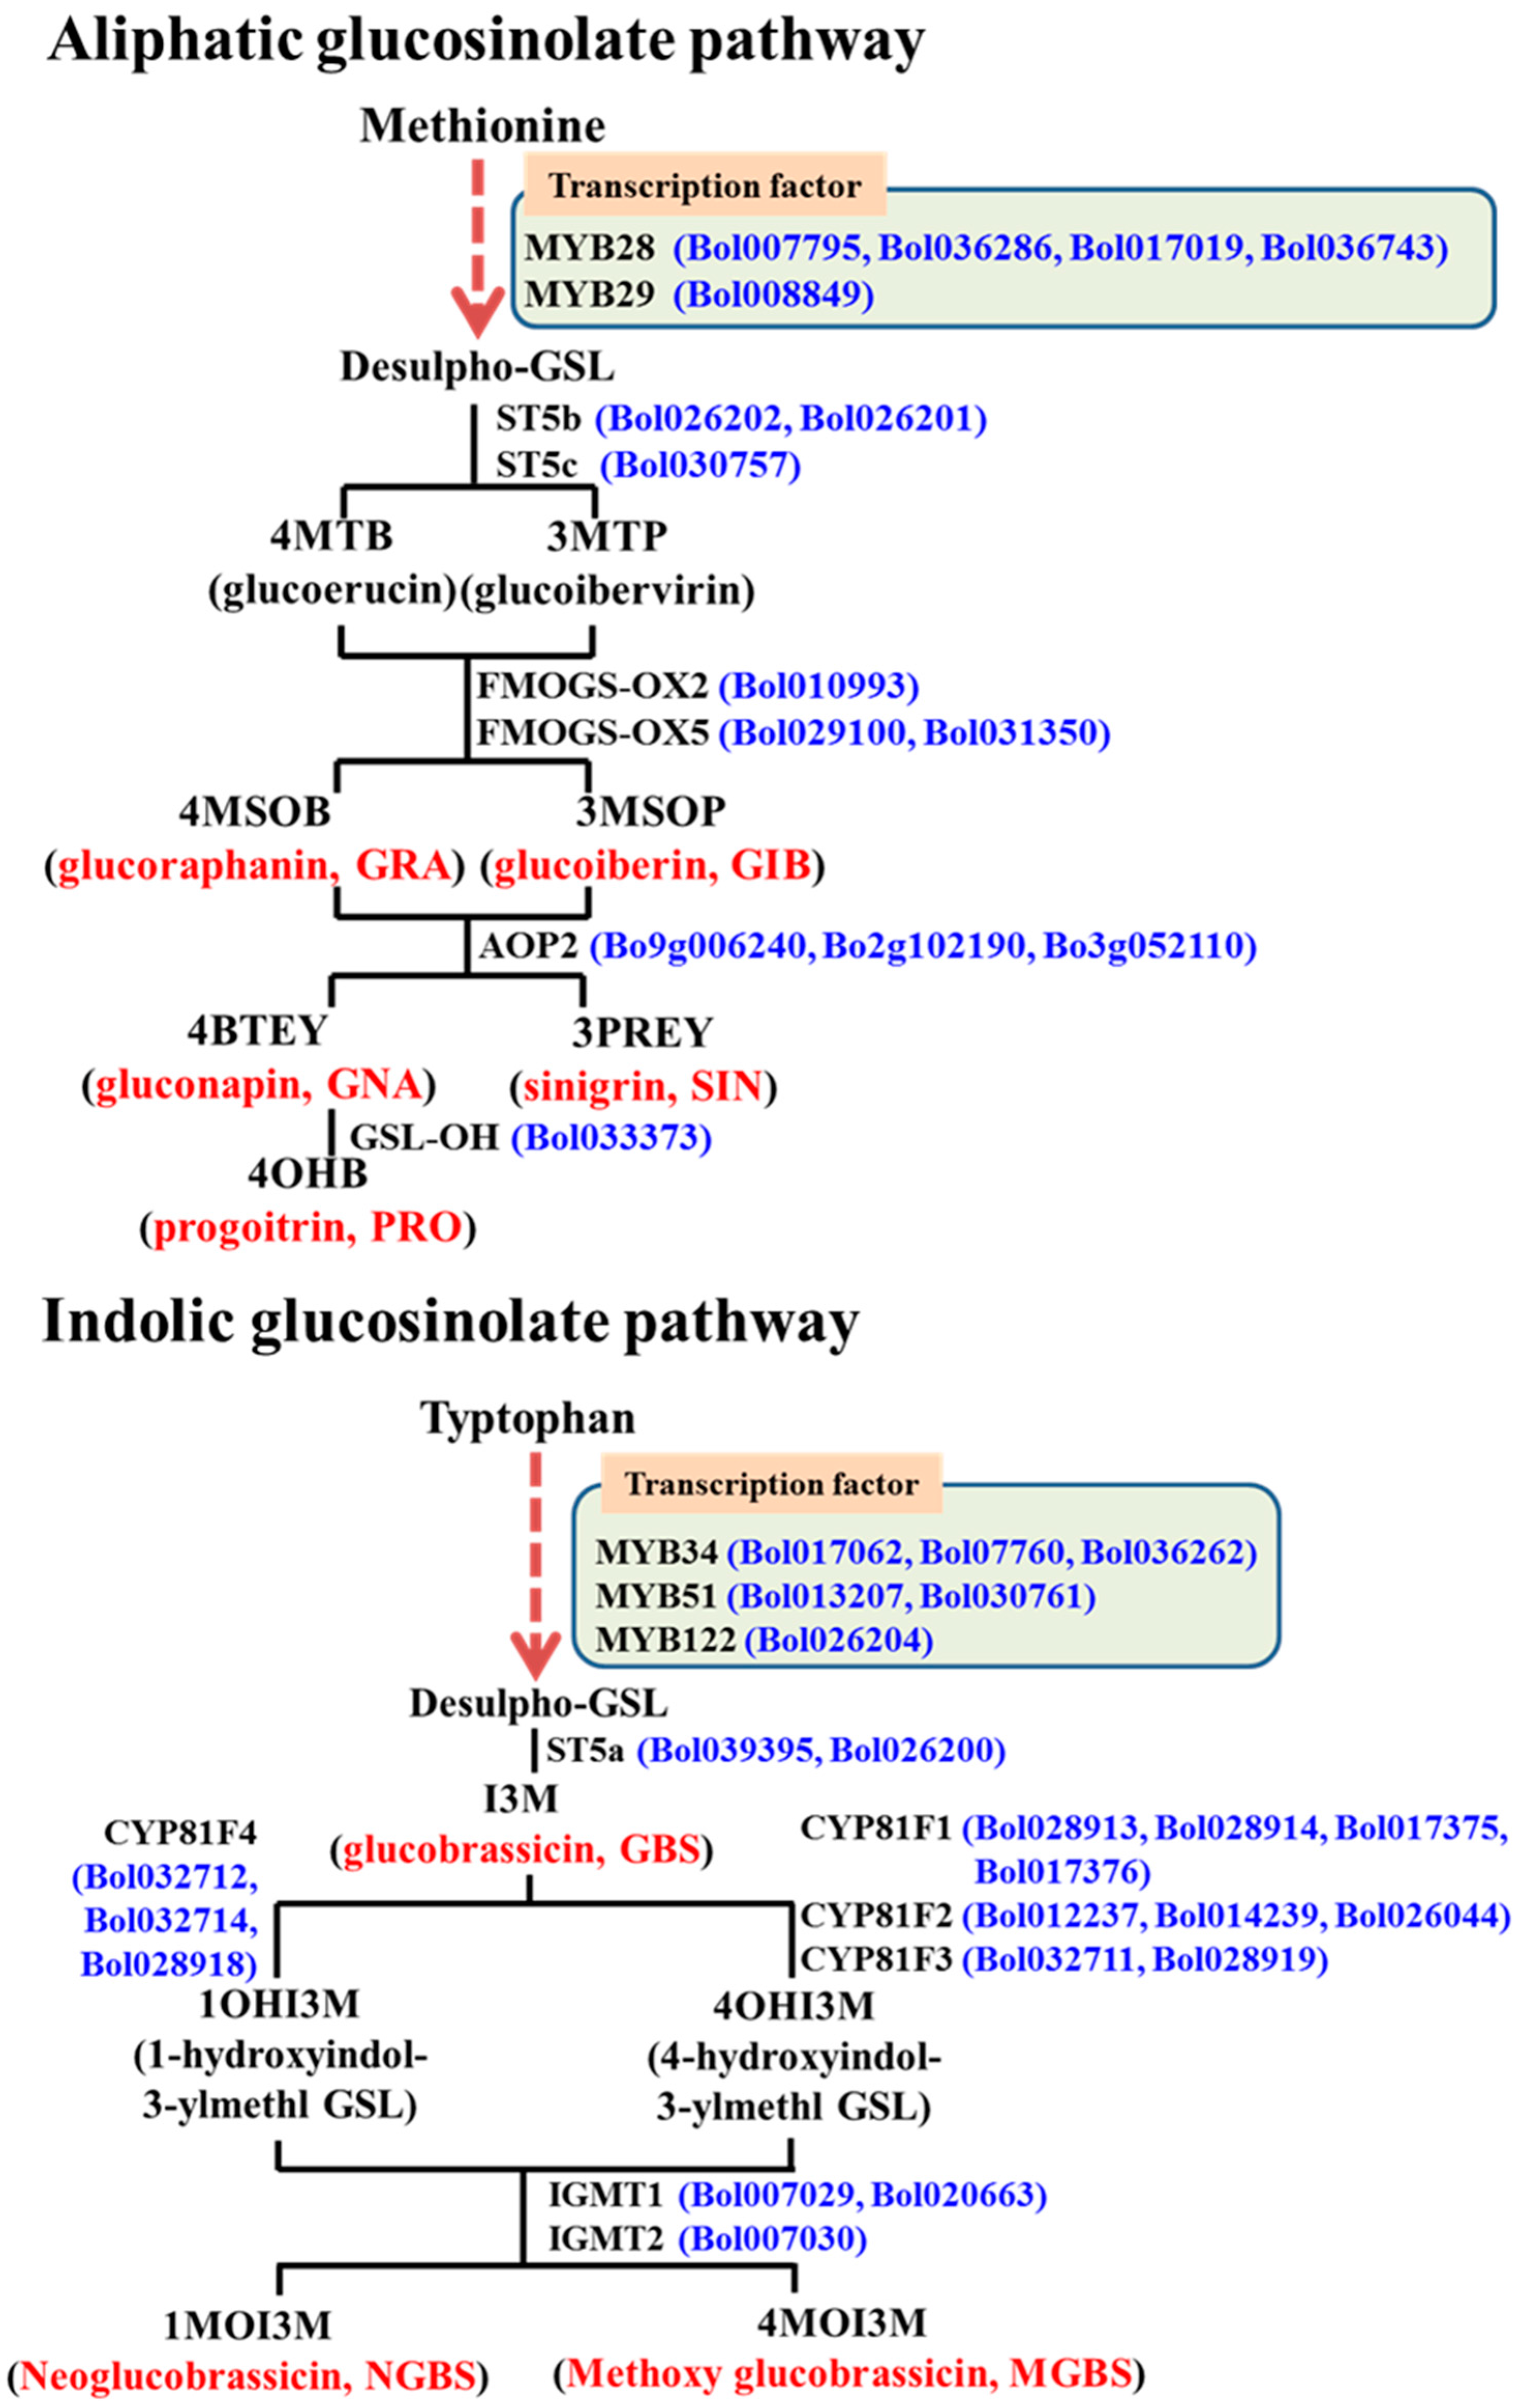
1. Introduction
2. Results
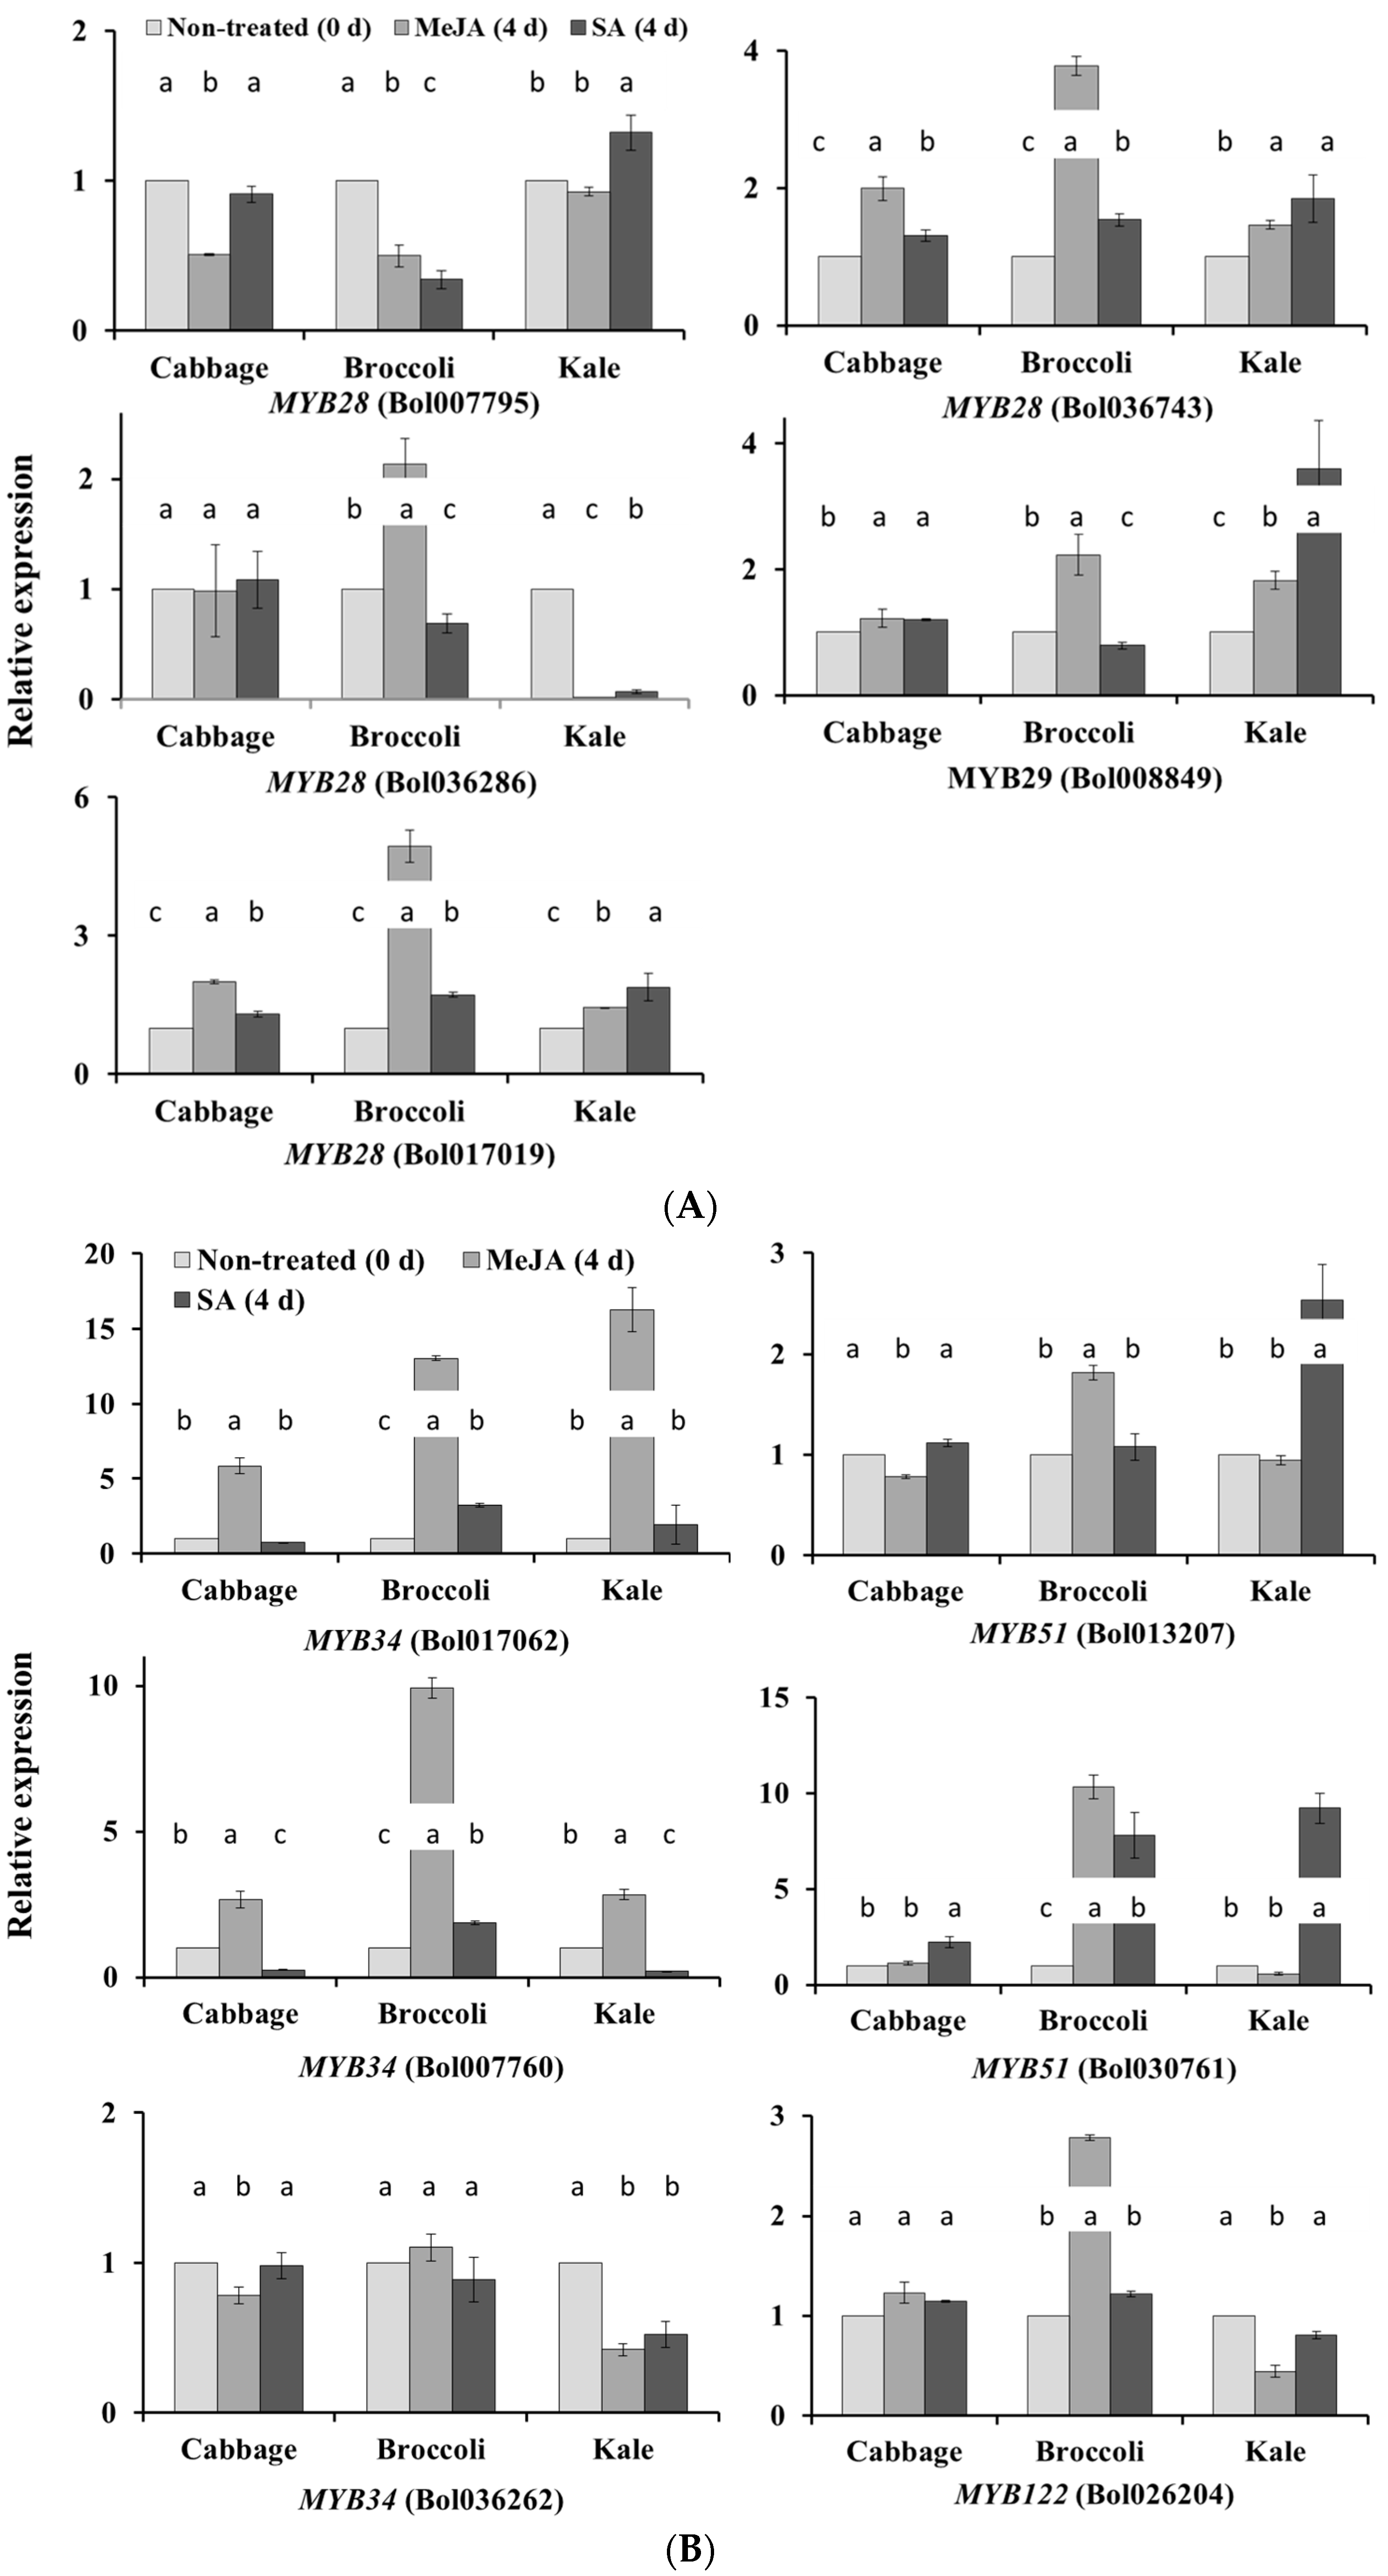
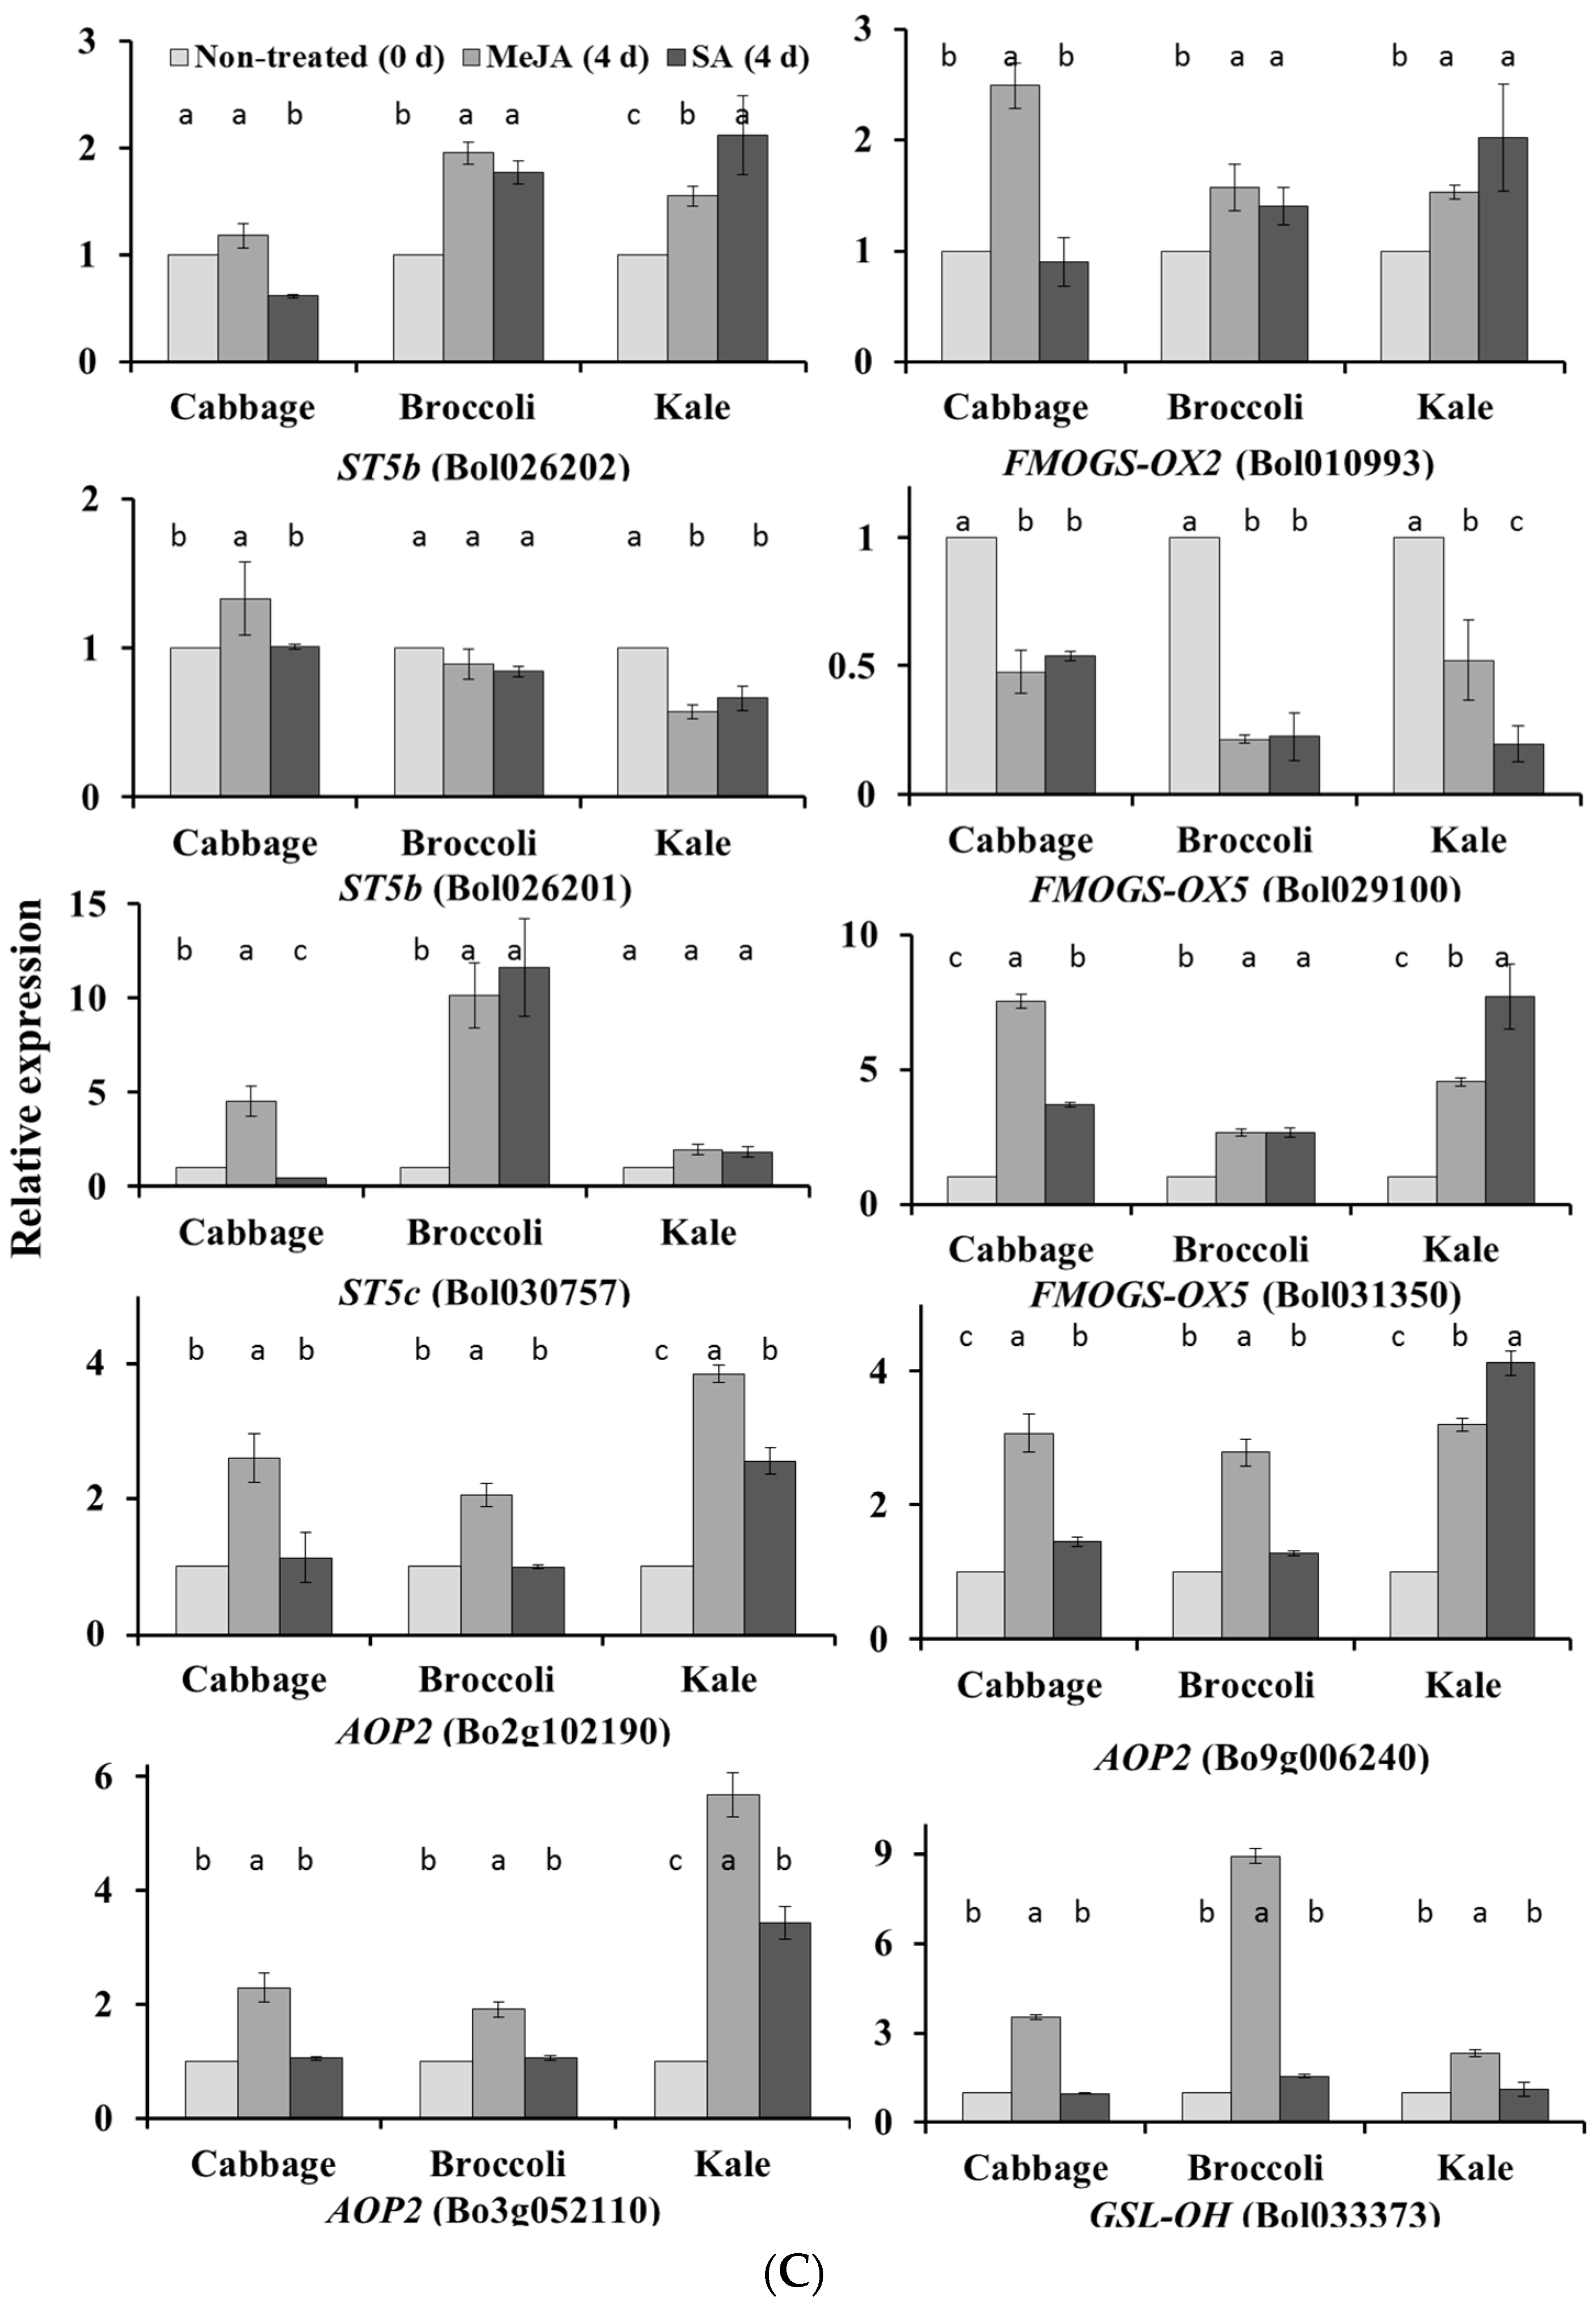
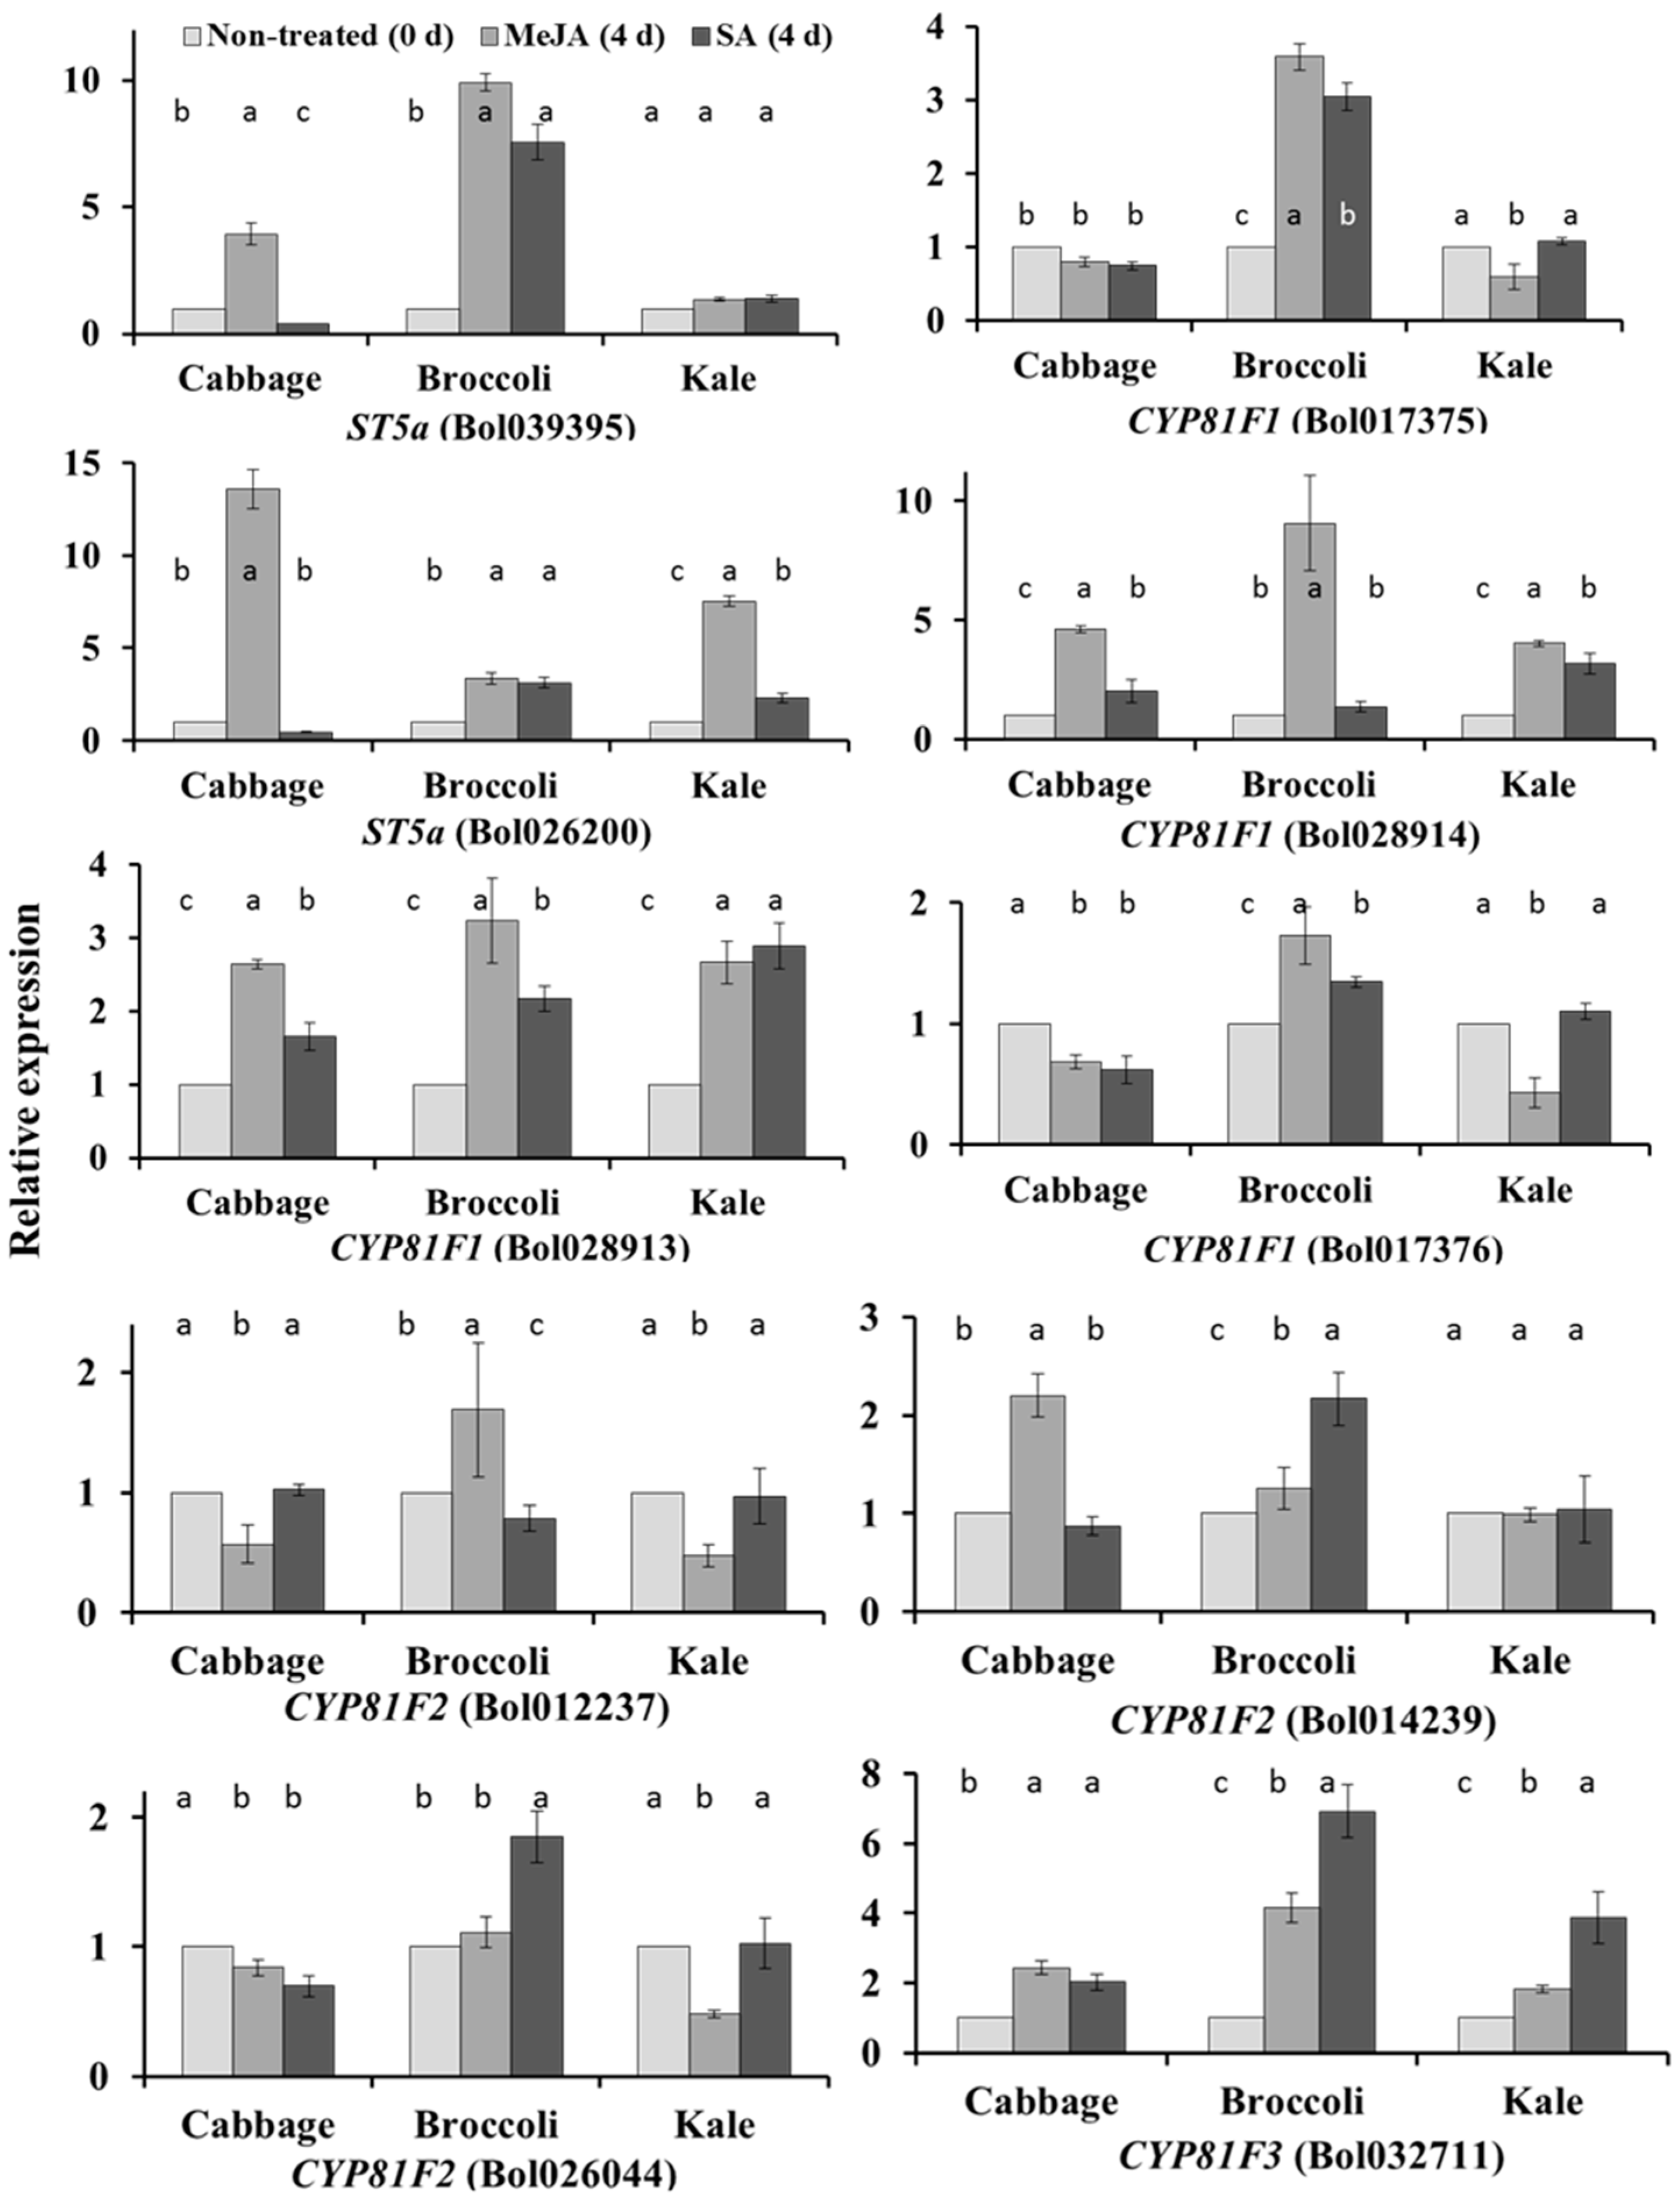
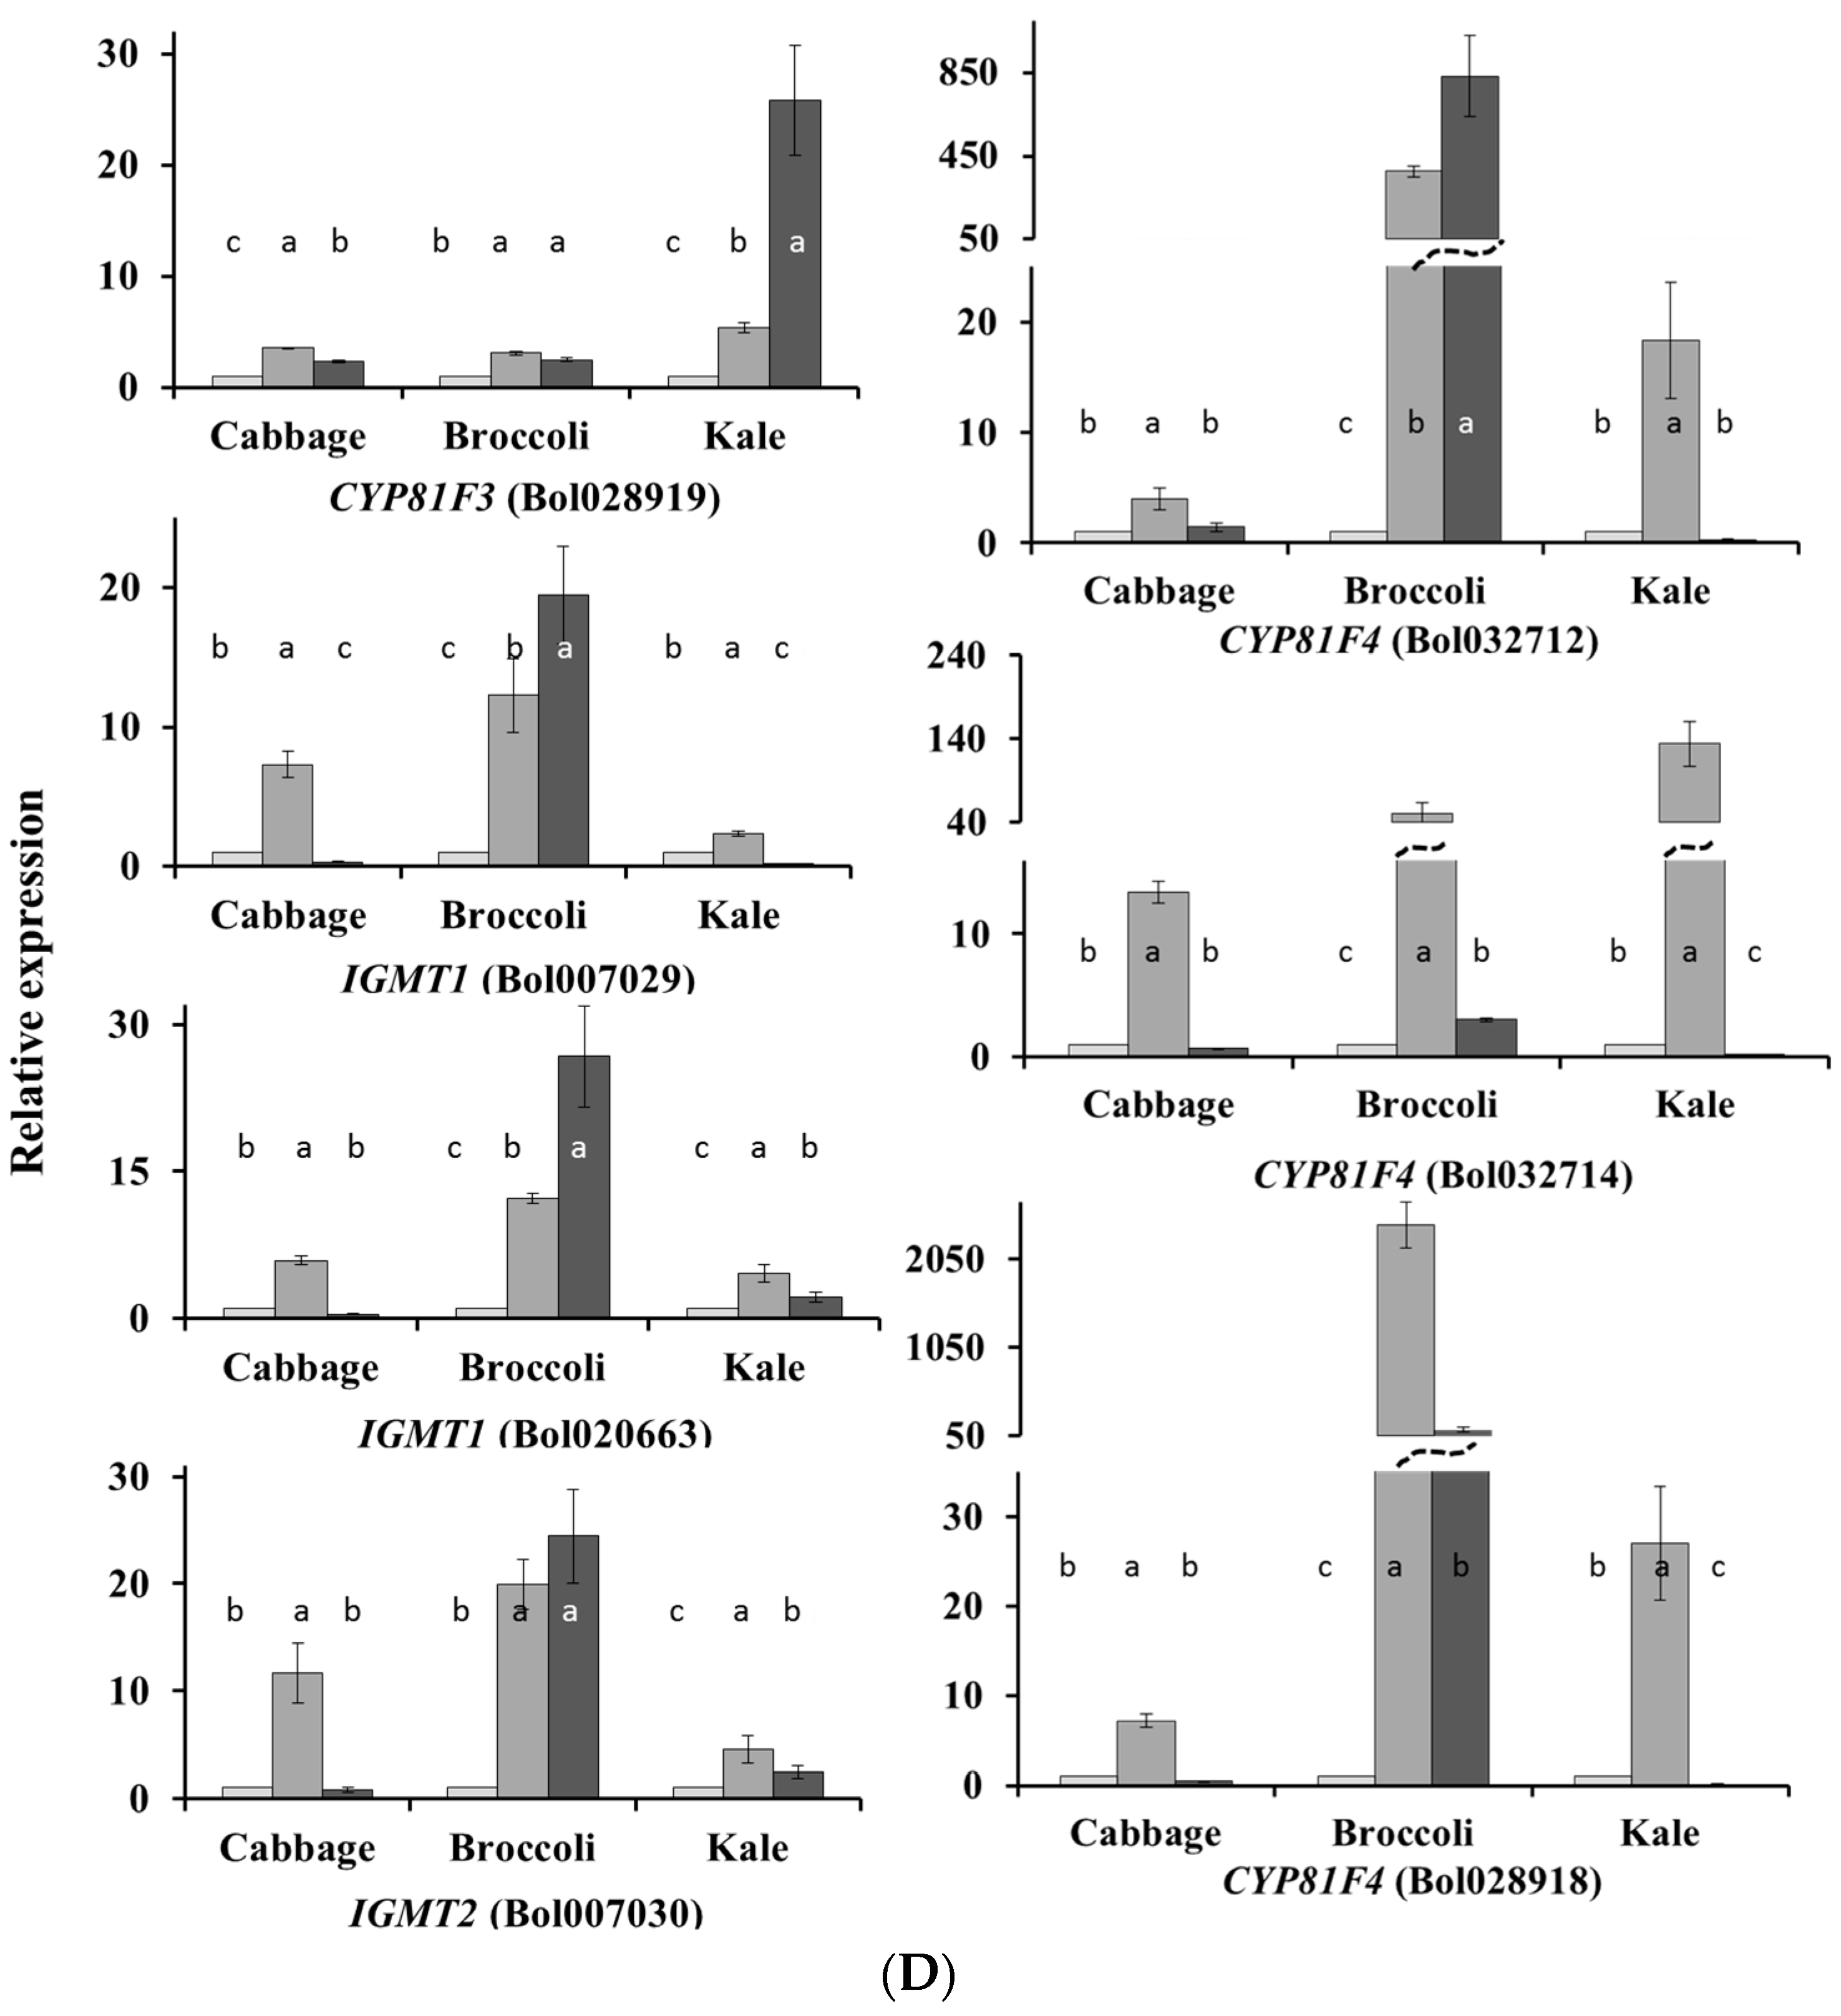
2.1. Subspecies-Specific Effects of Exogenous MeJA or SA on Glucosinolate Biosynthesis Gene Expression
2.2. Subspecies-Independent Effects of Exogenous MeJA or SA on Glucosinolate Biosynthesis Gene Expression
2.3. Subspecies-Specific Glucosinolate Accumulation under MeJA or SA Treatment
2.4. Associations between Glucosinolate Contents and Gene Expression
2.4.1. MYB34, ST5a and CYP81 Gene Expression Is Related to GBS and NGBS Accumulation
2.4.2. CYP81F3 Gene Expression Is Related to MGBS Accumulation under SA Treatment
2.4.3. Expression of ST5c and FMOGS-OX5 Genes in Cabbage Is Related to Accumulation of Aliphatic Glucosinolates
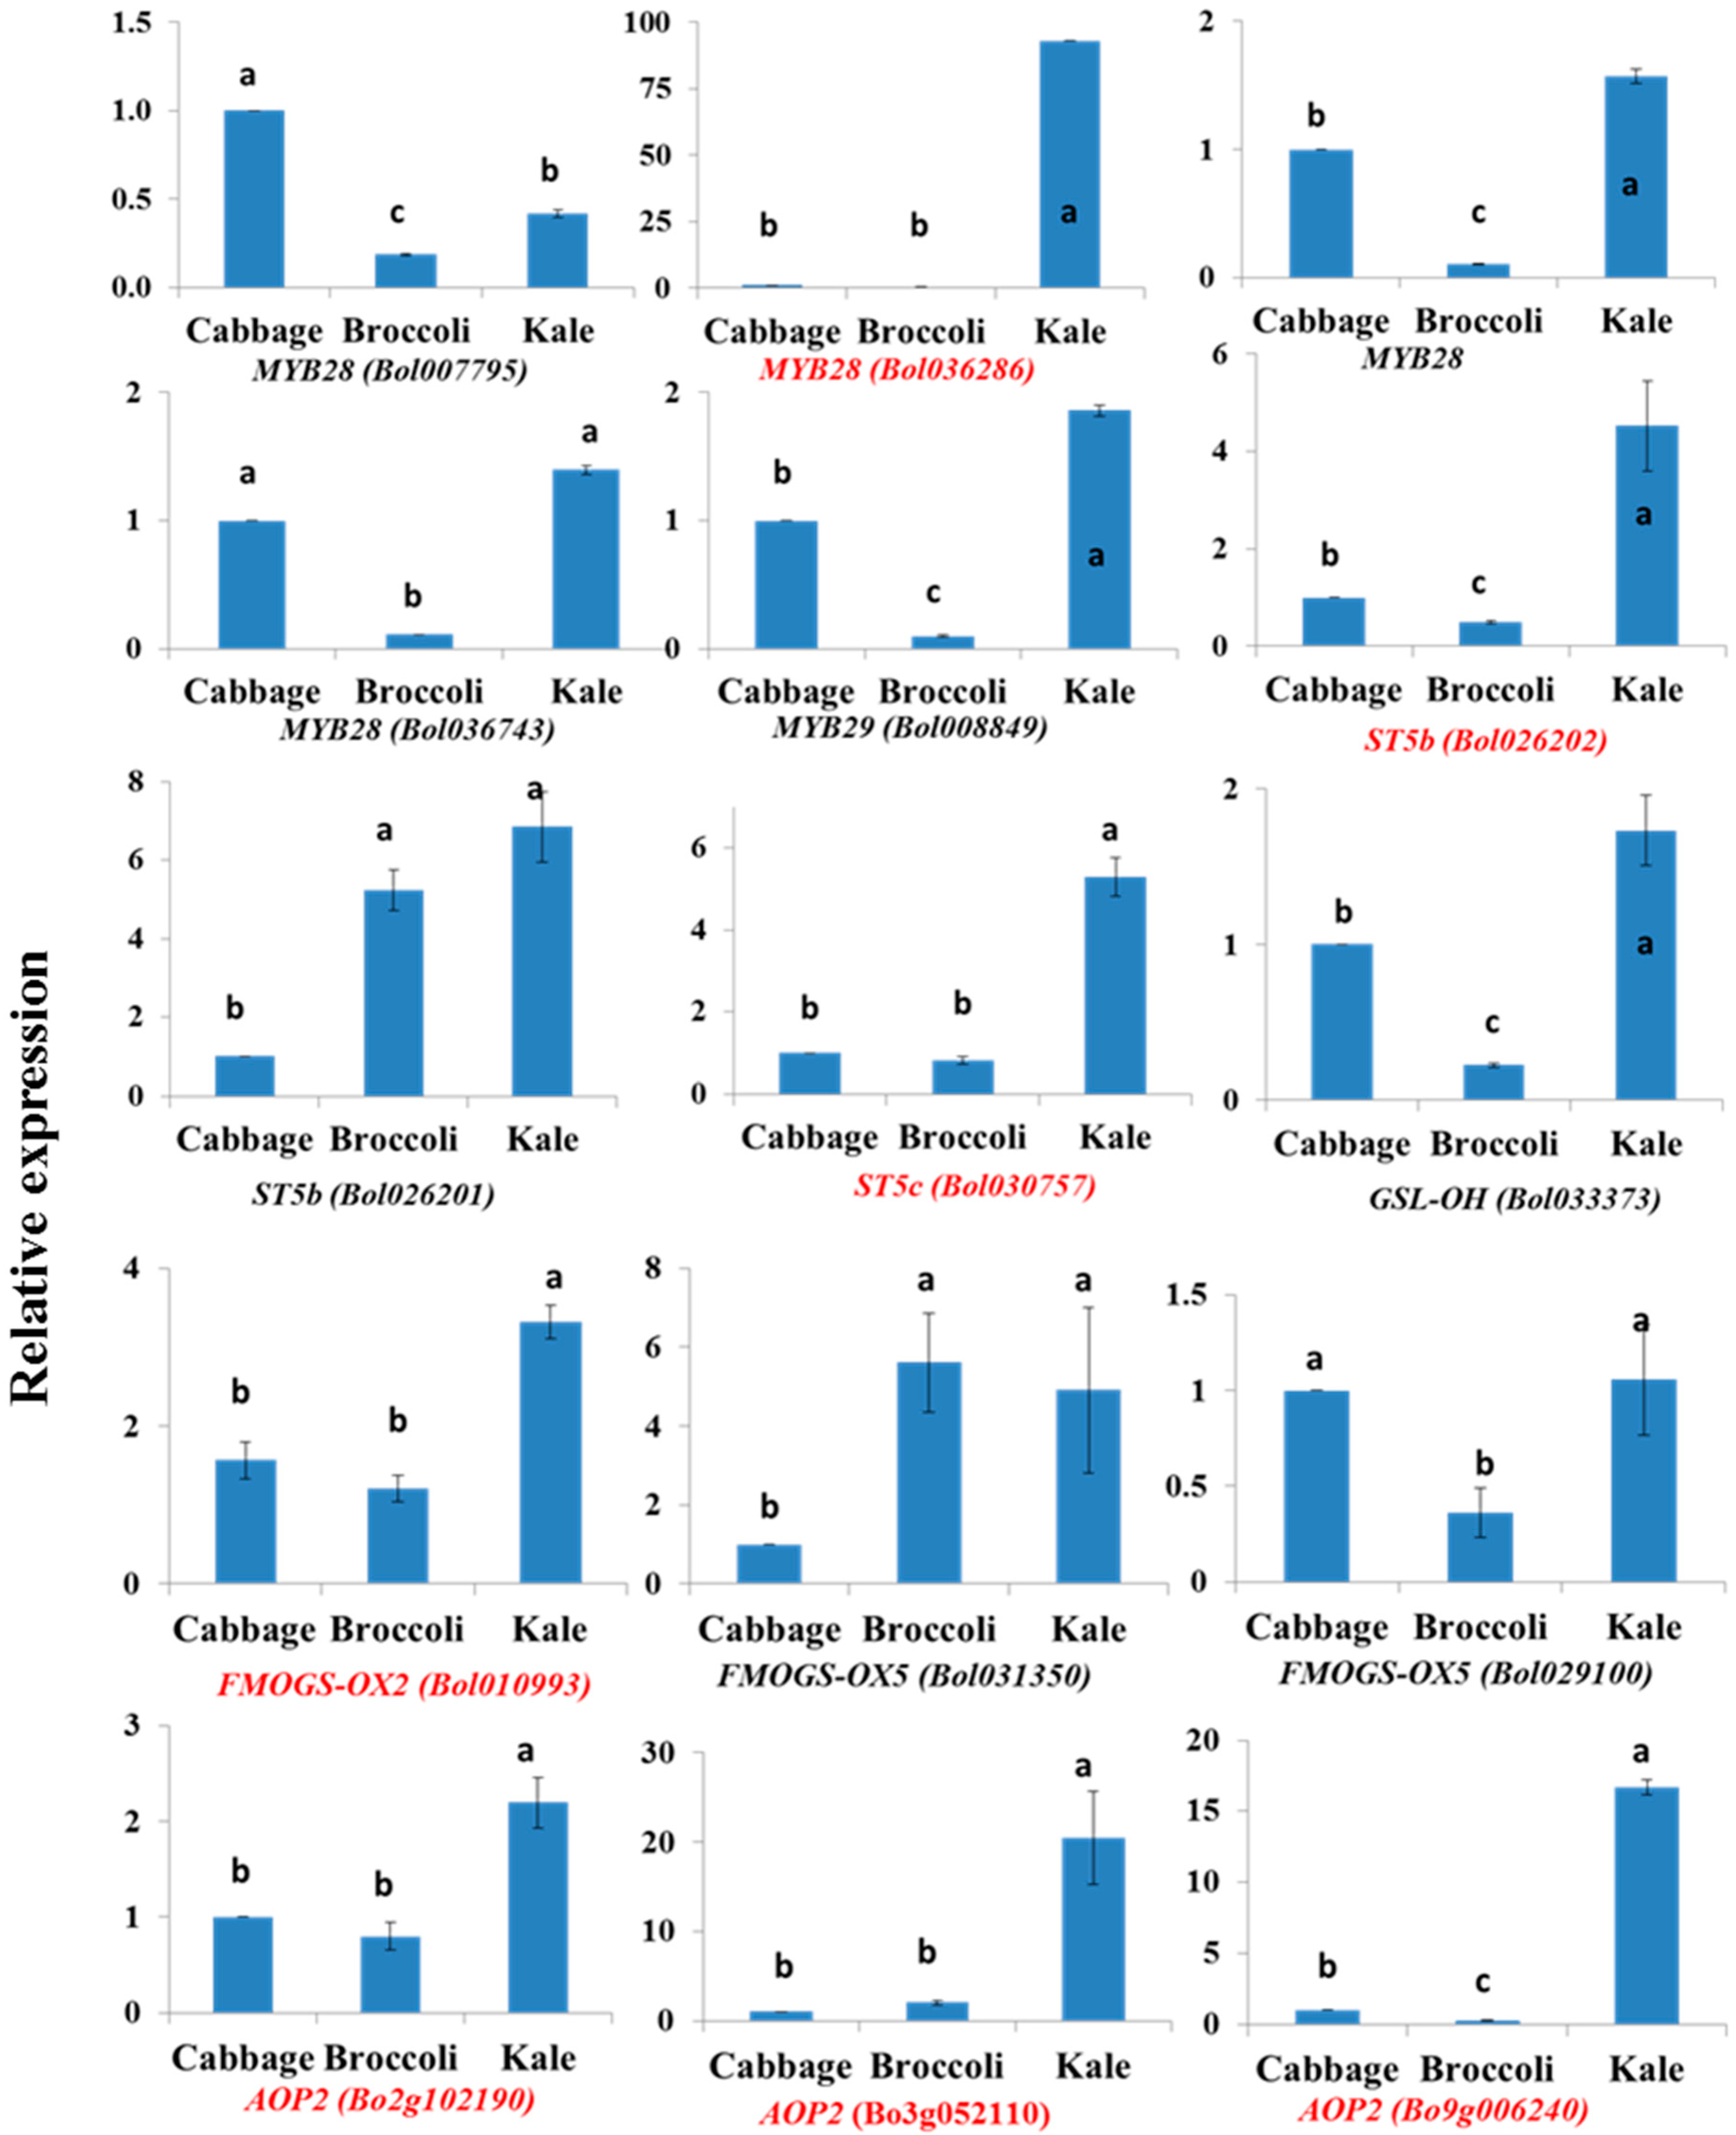
2.5. Natural Variation in Glucosinolate Contents and Gene Expression
2.5.1. Glucosinolate Accumulation and Gene Expression in Kale Leaves
2.5.2. Cabbage Leaves Have Higher GIB and GRA Contents
3. Discussion
3.1. Subspecies-Specific Response to Exogenous MeJA and SA Application
3.2. Association between Glucosinolate Accumulation and Gene Expression under Exogenous MeJA and SA
3.3. Natural Variation in Glucosinolate Biosynthesis and Gene Expression at the Sub-Species Level
4. Materials and Methods
4.1. Plant Materials and Growth Conditions
4.2. MeJA and SA Treatment
4.3. Primer Design for Glucosinolate Biosynthesis Genes
4.4. cDNA Synthesis and Real-Time Quantitative PCR (qPCR) Analysis
4.5. Desulfo-Glucosinolate Extraction for HPLC Analysis
4.6. Statistical Analysis
5. Conclusions
Supplementary Materials
Acknowledgments
Author Contributions
Conflicts of Interest
Abbreviations
| GIB | glucoiberin |
| PRO | progoitrin |
| GRA | glucoraphanin |
| SIN | sinigrin |
| GNA | gluconapin |
| GBS | glucobrassicin |
| MGBS | methoxyglucobrassicin |
| NGBS | neoglucobrassicin |
| 3MTP | 3-methylthiopropyl glucosinolate (glucoiberverin) |
| 4MTB | 4-methylthiobutyl glucosinolate (glucoerucin) |
| 3MSOP | 3-(methylsulfinyl)propyl glucosinolate (glucoiberin) |
| 4MSOB | 4-(methylsulfinyl)butyl GSL (glucoraphanin) |
| Sinigrin | allyl glucosinolate |
| 3BTEY | 3-butenyl glucosinolate (Gluconapin) |
| 4OHB | 4-hydroxybutyl glucosinolate (progoitrin) |
| I3M | 3-indolylmethyl glucosinolate (glucobrassicin) |
| 4OHI3M | 4-hydroxy-3-indolylmethyl glucosinolate (4-hydroxyglucobrassicin) |
| 1MOI3M | 1-methoxy-3-indolylmethyl glucosinolate (neoglucobrassicin) |
| 4MOI3M | 4-methoxy-3-indolylmethyl glucosinolate (4-methoxyglucobrassicin) |
| IGM | indole GSL modifier |
References
- Rodman, J.E.; Karol, K.G.; Price, R.A.; Sytsma, K.J. Molecules, morphology, and Dahlgren’s expanded order Capparales. Syst. Bot. 1993, 21, 289–307. [Google Scholar] [CrossRef]
- Schonhof, I.; Krumbein, A.; Brückner, B. Genotypic effects on glucosinolates and sensory properties of broccoli and cauliflower. Mol. Nutr. Food Res. 2004, 48, 25–33. [Google Scholar] [CrossRef] [PubMed]
- Padilla, G.; Cartea, M.E.; Velasco, P.; de Haro, A.; Ordás, A. Variation of glucosinolates in vegetable crops of Brassica rapa. Phytochemistry 2007, 68, 536–545. [Google Scholar] [CrossRef] [PubMed]
- Rask, L.; Andréasson, E.; Ekbom, B.; Eriksson, S.; Pontoppidan, B.; Meijer, J. Myrosinase: Gene Family Evolution and Herbivore Defense in Brassicaceae. In Plant Molecular Evolution; Springer: Dordrecht, The Netherlands, 2000; pp. 93–113. [Google Scholar]
- Wittstock, U.; Halkier, B.A. Cytochrome P450 CYP79A2 from Arabidopsis thaliana L. catalyzes the conversion of l-phenylalanine to phenylacetaldoxime in the biosynthesis of benzylglucosinolate. J. Biol. Chem. 2000, 275, 14659–14666. [Google Scholar] [CrossRef] [PubMed]
- Bones, A.M.; Rossiter, J.T. The enzymic and chemically induced decomposition of glucosinolates. Phytochemistry 2006, 67, 1053–1067. [Google Scholar] [CrossRef] [PubMed]
- Hayes, J.D.; Kelleher, M.O.; Eggleston, I.M. The cancer chemopreventive actions of phytochemicals derived from glucosinolates. Eur. J. Nutr. 2008, 47, 73–88. [Google Scholar] [CrossRef] [PubMed]
- Zhang, Y.; Kensler, T.W.; Cho, C.G.; Posner, G.H.; Talalay, P. Anticarcinogenic activities of sulforaphane and structurally related synthetic norbornyl isothiocyanates. Proc. Natl. Acad. Sci. USA 1994, 91, 3147–3150. [Google Scholar] [CrossRef] [PubMed]
- Keck, A.S.; Finley, J.W. Cruciferous vegetables: Cancer protective mechanisms of glucosinolate hydrolysis products and selenium. Integr. Cancer Ther. 2004, 3, 5–12. [Google Scholar] [CrossRef] [PubMed]
- Choi, S.H.; Park, S.; Lim, Y.P.; Kim, S.J.; Park, J.T.; An, G. Metabolite profiles of glucosinolates in cabbage varieties (Brassica oleracea var. capitata) by season, color, and tissue position. Hortic. Environ. Biotechnol. 2014, 55, 237–247. [Google Scholar]
- Hecht, S.S. Inhibition of carcinogenesis by isothiocyanates 1*. Drug Metab. Rev. 2000, 32, 395–411. [Google Scholar] [CrossRef] [PubMed]
- Nakajima, M.; Yoshida, R.; Shimada, N.; Yamazaki, H.; Yokoi, T. Inhibition and inactivation of human cytochrome P450 isoforms by phenethyl isothiocyanate. Drug Metab. Dispos. 2001, 29, 1110–1113. [Google Scholar] [PubMed]
- Kang, Y.-H.; Pezzuto, J.M. Induction of quinone reductase as a primary screen for natural product anticarcinogens. Meth. Enzymol. 2004, 382, 380–414. [Google Scholar] [PubMed]
- Rose, P.; Faulkner, K.; Williamson, G.; Mithen, R. 7-Methylsulfinylheptyl and 8-methylsulfinyloctyl isothiocyanates from watercress are potent inducers of phase II enzymes. Carcinogenesis 2000, 21, 1983–1988. [Google Scholar] [CrossRef] [PubMed]
- Matusheski, N.V.; Swarup, R.; Juvik, J.A.; Mithen, R.; Bennett, M.; Jeffery, E.H. Epithiospecifier protein from broccoli (Brassica oleracea L. ssp. italica) inhibits formation of the anticancer agent sulforaphane. J. Agric. Food Chem. 2006, 54, 2069–2076. [Google Scholar] [CrossRef] [PubMed]
- Lin, W.; Wu, R.T.; Wu, T.; Khor, T.-O.; Wang, H.; Kong, A.-N. Sulforaphane suppressed LPS-induced inflammation in mouse peritoneal macrophages through Nrf2 dependent pathway. Biochem. Pharmacol. 2008, 76, 967–973. [Google Scholar] [CrossRef] [PubMed]
- Bonnesen, C.; Eggleston, I.M.; Hayes, J.D. Dietary indoles and isothiocyanates that are generated from cruciferous vegetables can both stimulate apoptosis and confer protection against DNA damage in human colon cell lines. Cancer Res. 2001, 61, 6120–6130. [Google Scholar] [PubMed]
- Mithen, R. Leaf glucosinolate profiles and their relationship to pest and disease resistance in oilseed rape. Euphytica 1992, 63, 71–83. [Google Scholar] [CrossRef]
- Cabello-Hurtado, F.; Gicquel, M.; Esnault, M.A. Evaluation of the antioxidant potential of cauliflower (Brassica oleracea) from a glucosinolate content perspective. Food Chem. 2012, 132, 1003–1009. [Google Scholar] [CrossRef]
- Mawson, R.; Heaney, R.K.; Zdunczyk, Z.; Kozlowska, H. Rapeseed meal-glucosinolates and their antinutritional effects Part 4. Goitrogenicity and internal organs abnormalities in animals. Mol. Nutr. Food Res. 1994, 38, 178–191. [Google Scholar] [CrossRef]
- Kiddle, G.A.; Doughty, K.J.; Wallsgrove, R.M. Salicylic acid-induced accumulation of glucosinolates in oilseed rape (Brassica napus L.) leaves. J. Exp. Bot. 1994, 45, 1343–1346. [Google Scholar] [CrossRef]
- Doughty, K.J.; Kiddle, G.A.; Pye, B.J.; Wallsgrove, R.M.; Pickett, J.A. Selective induction of glucosinolates in oilseed rape leaves by methyl jasmonate. Phytochemistry 1995, 38, 347–350. [Google Scholar] [CrossRef]
- Bartlet, E.; Kiddle, G.; Williams, I.; Wallsgrove, R. Wound-Induced Increases in the Glucosinolate Content of Oilseed Rape and Their Effect on Subsequent Herbivory by a Crucifer Specialist. In Proceedings of the 10th International Symposium on Insect-Plant Relationships; Springer: Dordrecht, The Netherlands, 1999; pp. 163–167. [Google Scholar]
- Mikkelsen, M.D.; Petersen, B.L.; Glawischnig, E.; Jensen, A.B.; Andreasson, E.; Halkier, B.A. Modulation of CYP79 genes and glucosinolate profiles in Arabidopsis by defense signaling pathways. Plant Physiol. 2003, 131, 298–308. [Google Scholar] [CrossRef] [PubMed]
- Ku, K.M.; Choi, J.-H.; Kushad, M.M.; Jeffery, E.H.; Juvik, J.A. Pre-harvest methyl jasmonate treatment enhances cauliflower chemoprotective attributes without a loss in postharvest quality. Plant Foods Hum. Nutr. 2013, 68, 113–117. [Google Scholar] [CrossRef] [PubMed]
- Ku, K.M.; Choi, J.H.; Kim, H.S.; Kushad, M.M.; Jeffery, E.H. Methyl Jasmonate and 1-Methylcyclopropene Treatment Effects on Quinone Reductase Inducing Activity and Post-Harvest Quality of Broccoli. PLoS ONE 2013, 8, e77127. [Google Scholar] [CrossRef] [PubMed]
- Ku, K.M.; Jeffery, E.H.; Juvik, J.A. Exogenous methyl jasmonate treatment increases glucosinolate biosynthesis and quinone reductase activity in kale leaf tissue. PLoS ONE 2014, 9, e103407. [Google Scholar] [CrossRef] [PubMed]
- Ku, K.M.; Jeffery, E.H.; Juvik, J.A. Optimization of methyl jasmonate application to broccoli florets to enhance health-promoting phytochemical content. J. Sci. Food Agric. 2014, 94, 2090–2096. [Google Scholar] [CrossRef] [PubMed]
- Zang, Y.X.; Ge, J.L.; Huang, L.H.; Gao, F.; Lv, X.S.; Zheng, W.W.; Hong, S.B.; Zhu, Z.J. Leaf and root glucosinolates profiles of Chinese cabbage (Brassica rapa ssp. pekinensis) as a systemic response to methyl jasmonate and salicylic acid elicitation. J. Zhejiang Univ. Sci. B 2015, 16, 696–708. [Google Scholar] [CrossRef] [PubMed]
- Zang, Y.; Zhang, H.; Huang, L.; Wang, F.; Gao, F.; Lv, X.; Zhu, Z. Glucosinolate enhancement in leaves and roots of pak choi (Brassica rapa ssp. chinensis) by methyl jasmonate. Hortic. Environ. Biotechnol. 2015, 56, 830–840. [Google Scholar] [CrossRef]
- Bruinsma, M.; van Dam, N.M.; Van Loon, J.J.; Dicke, M. Jasmonic acid-induced changes in Brassica oleracea affect oviposition preference of two specialist herbivores. J. Chem. Ecol. 2007, 33, 655–668. [Google Scholar] [CrossRef] [PubMed]
- Demole, E.; Lederer, E.; Mercier, D.E. Isolement et determination de la structure du jasmonate de methyle, constituant odorant characteristique de l’essence de jasmin. Helv. Chim. Acta 1962, 45, 675–685. [Google Scholar] [CrossRef]
- Scognamiglio, J.; Jones, L.; Letizia, C.S.; Api, A.M. Fragrance material review on methyl jasmonate. Food Chem. Toxicol. 2012, 50, S572–S576. [Google Scholar] [CrossRef] [PubMed]
- Wiesner, M.; Hanschen, F.S.; Schreiner, M.; Glatt, H.; Zrenner, R. Induced production of 1-methoxy-indol-3-ylmethyl glucosinolate by jasmonic acid and methyl jasmonate in sprouts and leaves of Pak Choi (Brassica rapa ssp. chinensis). Int. J. Mol. Sci. 2013, 14, 14996–15016. [Google Scholar] [CrossRef] [PubMed]
- Fritz, V.A.; Justen, V.L.; Bode, A.M.; Schuster, T.; Wang, M. Glucosinolate enhancement in cabbage induced by jasmonic acid application. HortScience 2010, 45, 1188–1191. [Google Scholar]
- Loivamäki, M.; Holopainen, J.K.; Nerg, A.M. Chemical changes induced by methyl jasmonate in oilseed rape grown in the laboratory and in the field. J. Agric. Food Chem. 2004, 52, 7607–7613. [Google Scholar] [CrossRef] [PubMed]
- Pérez-Balibrea, S.; Moreno, D.A.; García-Viguera, C. Genotypic effects on the phytochemical quality of seeds and sprouts from commercial broccoli cultivars. Food Chem. 2011, 125, 348–354. [Google Scholar] [CrossRef]
- Sun, B.; Yan, H.; Liu, N.; Wei, J.; Wang, Q. Effect of 1-MCP treatment on postharvest quality characters, antioxidants and glucosinolates of Chinese kale. Food Chem. 2012, 131, 519–526. [Google Scholar] [CrossRef]
- Augustine, R.; Bisht, N.C. Biotic elicitors and mechanical damage modulate glucosinolate accumulation by co-ordinated interplay of glucosinolate biosynthesis regulators in polyploid Brassica juncea. Phytochemistry 2015, 117, 43–50. [Google Scholar] [CrossRef] [PubMed]
- Smetanska, I.; Krumbein, A.; Schreiner, M.; Knorr, M. Influence of salicylic acid and methyl jasmonate on glucosinolate levels in turnip. J. Hortic. Sci. Biotechnol. 2007, 82, 690–694. [Google Scholar] [CrossRef]
- Celenza, J.L.; Quiel, J.A.; Smolen, G.A.; Merrikh, H.; Silvestro, A.R.; Normanly, J.; Bender, J. The Arabidopsis ATR1 Myb transcription factor controls indolic glucosinolate homeostasis. Plant Physiol. 2005, 137, 253–262. [Google Scholar] [CrossRef] [PubMed]
- Liu, S.; Liu, Y.; Yang, X.; Tong, C.; Edwards, D.; Parkin, I.A. The Brassica oleracea genome reveals the asymmetrical evolution of polyploid genomes. Nat. Commun. 2014, 5. [Google Scholar] [CrossRef]
- Yi, G.E.; Robin, A.H.K.; Yang, K.; Park, J.I.; Kang, J.G.; Yang, T.J. Identification and expression analysis of glucosinolate biosynthetic genes and estimation of glucosinolate contents in edible organs of Brassica oleracea subspecies. Molecules 2015, 20, 13089–13111. [Google Scholar] [CrossRef] [PubMed]
- Guo, R.; Shen, W.; Qian, H.; Zhang, M.; Liu, L.; Wang, Q. Jasmonic acid and glucose synergistically modulate the accumulation of glucosinolates in Arabidopsis thaliana. J. Exp. Bot. 2013, 64, 5707–5719. [Google Scholar] [CrossRef] [PubMed]
- Jost, R.; Altschmied, L.; Bloem, E.; Bogs, J.; Gershenzon, J.; Hähnel, U. Expression profiling of metabolic genes in response to methyl jasmonate reveals regulation of genes of primary and secondary sulfur-related pathways in Arabidopsis thaliana. Photosynth. Res. 2005, 86, 491–508. [Google Scholar] [CrossRef] [PubMed]
- Mewis, I.; Appel, H.M.; Hom, A.; Raina, R.; Schultz, J.C. Major signaling pathways modulate Arabidopsis glucosinolate accumulation and response to both phloem-feeding and chewing insects. Plant Physiol. 2005, 138, 1149–1162. [Google Scholar] [CrossRef] [PubMed]
- Kim, H.S.; Juvik, J.A. Effect of selenium fertilization and methyl jasmonate treatment on glucosinolate accumulation in broccoli florets. J. Am. Soc. Hortic. Sci. 2011, 136, 239–246. [Google Scholar]
- Schreiner, M.; Krumbein, A.; Knorr, D.; Smetanska, I. Enhanced glucosinolates in root exudates of Brassica rapa ssp. rapa mediated by salicylic acid and methyl jasmonate. J. Agric. Food Chem. 2011, 59, 1400–1405. [Google Scholar] [CrossRef] [PubMed]
- Liu, A.G.; Juvik, J.A.; Jeffery, E.H.; Berman-Booty, L.D.; Clinton, S.K.; Erdman, J.W.J. Enhancement of broccoli indole glucosinolates by methyl jasmonate treatment and effects on prostate carcinogenesis. J. Med. Food 2014, 17, 1177–1182. [Google Scholar] [CrossRef] [PubMed]
- Baenas, N.; Villaño, D.; García-Viguera, C.; Moreno, D.A. Optimizing elicitation and seed priming to enrich broccoli and radish sprouts in glucosinolates. Food Chem. 2016, 204, 314–319. [Google Scholar] [CrossRef] [PubMed]
- Meenu Augustine, R.; Majee, M.; Pradhan, A.K.; Bisht, N.C. Genomic origin, expression differentiation and regulation of multiple genes encoding CYP83A1, a key enzyme for core glucosinolate biosynthesis, from the allotetraploid Brassica juncea. Planta 2015, 241, 651–665. [Google Scholar] [CrossRef] [PubMed]
- Sharma, M.; Mukhopadhyay, A.; Gupta, V.; Pental, D.; Pradhan, A.K. BjuBCYP79F1 Regulates Synthesis of Propyl Fraction of Aliphatic Glucosinolates in Oilseed Mustard Brassica juncea: Functional Validation through Genetic and Transgenic Approaches. PLoS ONE 2016, 11, e0150060. [Google Scholar] [CrossRef] [PubMed]
- Pfalz, M.; Mikkelsen, M.D.; Bednarek, P.; Olsen, C.E.; Halkier, B.A.; Kroymann, J. Metabolic engineering in Nicotiana benthamiana reveals key enzyme functions in Arabidopsis indole glucosinolate modification. Plant Cell 2011, 23, 716–729. [Google Scholar] [CrossRef] [PubMed]
- Frerigmann, H.; Gigolashvili, T. MYB34, MYB51, and MYB122 distinctly regulate indolic glucosinolate biosynthesis in Arabidopsis thaliana. Mol. Plant 2014, 7, 814–828. [Google Scholar] [CrossRef] [PubMed]
- Bednarek, P.; Pislewska-Bednarek, M.; Svatos, A.; Schneider, B.; Doubsky, J. A glucosinolate metabolism pathway in living plant cells mediates broad-spectrum antifungal defense. Science 2009, 323, 101–106. [Google Scholar] [CrossRef] [PubMed]
- Kim, J.H.; Lee, B.W.; Schroeder, F.C.; Jander, G. Identification of indole glucosinolate breakdown products with antifeedant effects on Myzus persicae (green peach aphid). Plant J. 2008, 54, 1015–1026. [Google Scholar] [CrossRef] [PubMed]
- Pfalz, M.; Vogel, H.; Kroymann, J. The gene controlling the indole glucosinolate modifier1 quantitative trait locus alters indole glucosinolate structures and aphid resistance in Arabidopsis. Plant Cell 2009, 21, 985–999. [Google Scholar] [CrossRef] [PubMed]
- Hahn, C.; Müller, A.; Kuhnert, N.; Albach, D. Diversity of Kale (Brassica oleracea var. sabellica): Glucosinolate Content and Phylogenetic Relationships. J. Agric. Food Chem. 2016, 64, 3215–3225. [Google Scholar] [CrossRef] [PubMed]
- Araki, R.; Hasumi, A.; Nishizawa, O.I.; Sasaki, K.; Kuwahara, A.; Sawada, Y.; Saito, K. Novel bioresources for studies of Brassica oleracea: Identification of a kale MYB transcription factor responsible for glucosinolate production. Plant Biotechnol. J. 2013, 11, 1017–1027. [Google Scholar] [CrossRef] [PubMed]
- Meyer, M.; Adam, S.T. Comparison of glucosinolate levels in commercial broccoli and red cabbage from conventional and ecological farming. Eur. Food Res. Technol. 2008, 226, 1429–1437. [Google Scholar] [CrossRef]
- Tian, Q.; Rosselot, R.A.; Schwartz, S.J. Quantitative determination of intact glucosinolates in broccoli, broccoli sprouts, Brussels sprouts, and cauliflower by high-performance liquid chromatography—Electrospray ionization—Tandem mass spectrometry. Anal. Biochem. 2005, 343, 93–99. [Google Scholar] [CrossRef] [PubMed]
- Gigolashvili, T.; Yatusevich, R.; Rollwitz, I.; Humphry, M.; Gershenzon, J.; Flügge, U.I. The plastidic bile acid transporter 5 is required for the biosynthesis of methionine-derived glucosinolates in Arabidopsis thaliana. Plant Cell 2009, 21, 1813–1829. [Google Scholar] [CrossRef] [PubMed]
- Kim, Y.B.; Li, X.; Kim, S.J.; Kim, H.H.; Lee, J.; Kim, H. MYB transcription factors regulate glucosinolate biosynthesis in different organs of Chinese cabbage (Brassica rapa ssp. pekinensis). Molecules 2013, 18, 8682–8695. [Google Scholar] [CrossRef] [PubMed]
- Robin, A.H.K.; Yi, G.E.; Laila, R.; Yang, K.; Park, J.I.; Kim, H.R.; Nou, I.S. Expression Profiling of Glucosinolate Biosynthetic Genes in Brassica oleracea L. var. capitata Inbred Lines Reveals Their Association with Glucosinolate Content. Molecules 2016, 21, 787. [Google Scholar] [CrossRef] [PubMed]
- Livak, K.J.; Schmittgen, T.D. Analysis of relative gene expression data using real-time quantitative PCR and the 2−ΔΔCt method. Methods 2001, 25, 402–408. [Google Scholar] [CrossRef] [PubMed]
- Nawaz, I.; Iqbal, M.; Hakvoort, H.W.; Bliek, M.; de Boer, B.; Schat, H. Expression levels and promoter activities of candidate salt tolerance genes in halophytic and glycophytic Brassicaceae. Environ. Exp. Bot. 2014, 99, 59–66. [Google Scholar] [CrossRef]
- De Hoon, M.; Imoto, S.; Miyano, S. Cluster 3.0; University of Tokyo, Human Genome Center: Tokyo, Japan, 2002. [Google Scholar]
- Saldanha, A.J. Java Treeview—Extensible visualization of microarray data. Bioinformatics 2004, 20, 3246–3248. [Google Scholar] [CrossRef] [PubMed]
- Sample Availability: Seeds of the genotypes from three subspecies are available from the authors.


| Subspecies | Treatment | GIB | PRO | GRA | SIN | GNA | GBS | MGBS | NGBS |
|---|---|---|---|---|---|---|---|---|---|
| Cabbage | Control | 0.38 ± 0.17 b | 0.58 ± 0.66 b | 0.60 ± 0.29 a | 0.57 ± 0.25 b | 0.06 ± 0.07 b | 0.66 ± 0.20 b | bdl | 0.01 ± 0.004 b |
| MeJA | 1.63 ± 0.54 a | 2.33 ± 0.44 a | 1.27 ± 0.41 a | 1.58 ± 0.22 a | 0.19 ± 0.06 ab | 7.24 ± 3.16 a | bdl | 0.04 ± 0.006 a | |
| p (cabbage) | SA | 1.40 ± 0.41 a | 2.21 ± 0.18 a | 1.75 ± 0.77 a | 1.30 ± 0.13 a | 0.25 ± 0.02 a | 1.23 ± 1.23 b | bdl | 0.04 ± 0.007 a |
| Treatment | 0.02 | 0.006 | 0.09 | 0.003 | 0.016 | 0.008 | 0.002 | ||
| Broccoli | Control | 0.20 ± 0.02 b | 0.10 ± 0.027 a | 0.09 ± 0.009 b | 0.25 ± 0.062 ab | bdl | 0.29 ± 0.29 b | 0.01 ± 0.003 b | 0.04 ± 0.023 b |
| p (broccoli) | MeJA | 0.23 ± 0.015 ab | 0.10 ± 0.006 a | 0.08 ± 0.015 b | 0.40 ± 0.083 a | bdl | 1.46 ± 0.09 a | 0.11 ± 0.016 ab | 6.31 ± 2.07 a |
| SA | 0.28 ± 0.025 a | 0.13 ± 0.036 a | 0.14 ± 0.02 a | 0.14 ± 0.065 b | bdl | 0.20 ± 0.16 b | 0.19 ± 0.087 a | 0.11 ± 0.024 b | |
| Treatment | 0.012 | 0.37 | 0.007 | 0.011 | <0.001 | 0.016 | 0.001 | ||
| Kale | Control | 0.11 ± 0.025 a | 7.54 ± 5.02 a | 0.20 ± 0.087 a | 4.11 ± 2.25 a | 3.02 ± 1.63 a | 0.25 ± 0.102 b | 0.02 ± 0.002 a | 0.02 ± 0.01 b |
| MeJA | 0.41 ± 0.438 a | 6.20 ± 5.54 a | 1.67 ± 2.35 a | 6.37 ± 3.93 a | 2.23 ± 1.12 a | 4.52 ± 0.817 a | 0.08 ± 0.027 a | 0.38 ± 0.24 a | |
| SA | 0.10 ± 0.058 a | 5.48 ± 3.11 a | 0.63 ± 0.735 a | 2.89 ± 0.493 a | 2.54 ± 1.43 a | 0.45 ± 0.299 b | 0.08 ± 0.055 a | 0.07 ± 0.035 ab | |
| p (kale) | Treatment | 0.301 | 0.864 | 0.473 | 0.326 | 0.795 | <0.001 | 0.14 | 0.041 |
| p value | Subspecies | <0.001 | <0.001 | NS | <0.001 | <0.001 | 0.005 | <0.001 | <0.001 |
| Variable | PC1 | PC2 | PC3 | PC4 | PC5 |
| GBS | −0.025 | 0.326 | −0.416 | 0.081 | −0.250 |
| MGBS | 0.253 | 0.031 | 0.030 | −0.017 | 0.345 |
| NGBS | 0.150 | 0.344 | 0.344 | −0.107 | −0.044 |
| ST5a (Bol026200) | 0.078 | 0.310 | 0.446 | 0.164 | −0.174 |
| ST5a (Bol039395) | 0.317 | 0.098 | 0.050 | 0.012 | −0.250 |
| CYP81F1 (Bol028913) | 0.199 | 0.259 | −0.101 | 0.387 | 0.013 |
| CYP81F1 (Bol028914) | 0.053 | 0.483 | 0.163 | −0.125 | 0.171 |
| CYP81F1 (Bol017375) | 0.305 | −0.007 | 0.197 | 0.096 | −0.165 |
| CYP81F1 (Bol017376) | 0.245 | −0.071 | 0.260 | 0.272 | −0.219 |
| CYP81F2 (Bol012237) | 0.155 | −0.065 | 0.250 | 0.423 | −0.147 |
| CYP81F2 (Bol014239) | 0.210 | −0.113 | −0.321 | −0.052 | 0.041 |
| CYP81F2 (Bol026044) | 0.244 | −0.285 | −0.036 | −0.125 | 0.230 |
| CYP81F3 (Bol032711) | 0.284 | −0.090 | −0.103 | −0.045 | 0.369 |
| CYP81F3 (Bol028919) | 0.016 | 0.084 | 0.019 | 0.554 | 0.541 |
| CYP81F4 (Bol032712) | 0.296 | −0.082 | −0.018 | −0.058 | −0.153 |
| CYP81F4 (Bol032714) | 0.004 | 0.326 | −0.182 | −0.122 | 0.237 |
| CYP81F4 (Bol028918) | 0.111 | 0.349 | 0.314 | −0.344 | 0.066 |
| IGMT1 (Bol007029) | 0.318 | −0.070 | −0.138 | −0.143 | −0.115 |
| IGMT1 (Bol020663) | 0.304 | −0.100 | −0.152 | −0.200 | 0.116 |
| IGMT2 (Bol007030) | 0.331 | 0.003 | −0.105 | −0.057 | −0.059 |
| % variation explained | 41.5 | 15.0 | 12.7 | 7.6 | 6.3 |
| p (subspecies) | <0.01 | 0.49 | <0.01 | 0.05 | <0.01 |
| p (treatment) | <0.01 | <0.01 | <0.01 | 0.46 | <0.01 |
| p (subspecies × treatment) | <0.01 | 0.019 | <0.01 | 0.03 | 0.16 |
| Source of Variation | Mean PC Scores (±Sd) | ||||
| Subspecies | |||||
| Cabbage | −1.26 ± 0.41 | −0.06 ± 0.22 | −0.57 ± 0.17 | −0.01 ± 0.26 | −0.58 ± 0.2 |
| Broccoli | 2.35 ± 0.41 | −0.15 ± 0.22 | 0.77 ± 0.17 | −0.47 ± 0.26 | −0.01 ± 0.2 |
| Kale | −1.09 ± 0.41 | 0.21 ± 0.22 | −0.19 ± 0.17 | 0.48 ± 0.26 | 0.59 ± 0.2 |
| Treatment | |||||
| Control | −1.57 ± 0.41 | −1.11 ± 0.22 | 0.63 ± 0.17 | −0.22 ± 0.26 | −0.45 ± 0.2 |
| MeJA | 0.76 ± 0.41 | 1.96 ± 0.22 | −0.61 ± 0.17 | −0.02 ± 0.26 | −0.30 ± 0.2 |
| SA | 0.81 ± 0.41 | −0.84 ± 0.22 | −0.01 ± 0.17 | 0.24 ± 0.26 | 0.75 ± 0.2 |
| Subspecies × treatment | |||||
| Cabbage × Control | −1.61 ± 0.71 | −1.09 ± 0.38 | 0.58 ± 0.30 | −0.21 ± 0.45 | −0.52 ± 0.35 |
| Cabbage × MeJA | −0.31 ± 0.71 | 1.47 ± 0.38 | −2.69 ± 0.30 | 0.24 ± 0.45 | −1.03 ± 0.35 |
| Cabbage × SA | −1.85 ± 0.71 | −0.56 ± 0.38 | 0.38 ± 0.30 | −0.05 ± 0.45 | −0.20 ± 0.35 |
| Broccoli × Control | −1.56 ± 0.71 | −1.13 ± 0.38 | 0.65 ± 0.30 | −0.23 ± 0.45 | −0.43 ± 0.35 |
| Broccoli × MeJA | 3.81 ± 0.71 | 2.52 ± 0.38 | 2.47 ± 0.30 | −0.25 ± 0.45 | −0.36 ± 0.35 |
| Broccoli × SA | 4.82 ± 0.71 | −1.85 ± 0.38 | −0.81 ± 0.30 | −0.93 ± 0.45 | 0.76 ± 0.35 |
| Kale × Control | −1.54 ± 0.71 | −1.12 ± 0.38 | 0.64 ± 0.30 | −0.23 ± 0.45 | −0.40 ± 0.35 |
| Kale × MeJA | −1.21 ± 0.71 | 1.87 ± 0.38 | −1.63 ± 0.30 | −0.05 ± 0.45 | 0.48 ± 0.35 |
| Kale × SA | −0.52 ± 0.71 | −0.11 ± 0.38 | 0.39 ± 0.30 | 1.71 ± 0.45 | 1.69 ± 0.35 |
| Genes | Kale: Cabbage | Kale: Broccoli |
|---|---|---|
| Aliphatic Transcription Factor-Related | ||
| MYB28 (Bol007795) | 0.4 | 2.3 |
| MYB28 (Bol036286) | 93 | 253 |
| MYB28 (Bol017019) | 1.6 | 15.6 |
| MYB28 (Bol036743) | 1.4 | 12.9 |
| MYB29 (Bol008849) | 1.9 | 19.1 |
| Aliphatic Biosynthesis-Related | ||
| FMOGS-OX2 (Bol010993) | 3.3 | 2.7 |
| FMOGS-OX5 (Bol029100) | 1.1 | 2.9 |
| FMOGS-OX5 (Bol031350) | 4.9 | 0.9 |
| GSL-OH (Bol033373) | 1.7 | 7.8 |
| ST5b (Bol026202) | 4.5 | 9.1 |
| ST5b (Bol026201) | 6.8 | 1.3 |
| ST5c (Bol030757) | 5.3 | 6.5 |
| AOP2 (Bo2g102190) | 2.2 | 2.7 |
| AOP2 (Bo3g052110) | 20.5 | 10 |
| AOP2 (Bo9g006240) | 16.7 | 66 |
| Glucosinolate Compounds | ||
| GIB | 0.3 | 0.6 |
| PRO | 13 | 72 |
| GRA | 0.3 | 2.2 |
| SIN | 7.2 | 17 |
| GNA | 53 | - |
| Gene Name | Accession Number | GBS (Cabbage) | NGBS (Broccoli) | MGBS (Kale) | |||
|---|---|---|---|---|---|---|---|
| Broccoli | Kale | Cabbage | Kale | Cabbage | Broccoli | ||
| MYB34 | Bol007760 | 2.5 | 20.4 | ||||
| Bol017062 | 1.0 | 2.7 | |||||
| Bol036262 | 3.4 | 2.7 | |||||
| MYB51 | Bol013207 | 2.0 | 3.0 | ||||
| Bol030761 | 0.3 | 1.9 | |||||
| MYB122 | Bol026204 | 2.2 | 3.1 | ||||
| ST5a | Bol026200 | 3.5 | 6.5 | ||||
| Bol039395 | 1.9 | 1.3 | |||||
| CYP81F4 | Bol032712 | 2.7 | 1.0 | ||||
| Bol032714 | 316 | 0.6 | |||||
| Bol028918 | 1.44 | 1.4 | |||||
| CYP81F1 | Bol017375 | 4.3 | 24 | ||||
| Bol017376 | 2.8 | 35 | |||||
| Bol028913 | 2.2 | 1.4 | |||||
| Bol028914 | 3.2 | 3.8 | |||||
| CYP81F2 | Bol012237 | 1.2 | 1.95 | ||||
| Bol014239 | 2.5 | 2.1 | |||||
| Bol026044 | 1.5 | 1.9 | |||||
| CYP81F3 | Bol028919 | 2.6 | 1.4 | ||||
| Bol032711 | 1.5 | 1.9 | |||||
| IGMT1 | Bol007029 | 3.98 | 5.1 | ||||
| Bol020663 | 3.5 | 2.35 | |||||
| IGMT2 | Bol007030 | 1.8 | 3.97 | ||||
| Content increased (fold) | 2.24 | 2.6 | 4.3 | 2.54 | α (infinity) | 17 | |
© 2016 by the authors. Licensee MDPI, Basel, Switzerland. This article is an open access article distributed under the terms and conditions of the Creative Commons Attribution (CC-BY) license ( http://creativecommons.org/licenses/by/4.0/).
Share and Cite
Yi, G.-E.; Robin, A.H.K.; Yang, K.; Park, J.-I.; Hwang, B.H.; Nou, I.-S. Exogenous Methyl Jasmonate and Salicylic Acid Induce Subspecies-Specific Patterns of Glucosinolate Accumulation and Gene Expression in Brassica oleracea L. Molecules 2016, 21, 1417. https://0-doi-org.brum.beds.ac.uk/10.3390/molecules21101417
Yi G-E, Robin AHK, Yang K, Park J-I, Hwang BH, Nou I-S. Exogenous Methyl Jasmonate and Salicylic Acid Induce Subspecies-Specific Patterns of Glucosinolate Accumulation and Gene Expression in Brassica oleracea L. Molecules. 2016; 21(10):1417. https://0-doi-org.brum.beds.ac.uk/10.3390/molecules21101417
Chicago/Turabian StyleYi, Go-Eun, Arif Hasan Khan Robin, Kiwoung Yang, Jong-In Park, Byung Ho Hwang, and Ill-Sup Nou. 2016. "Exogenous Methyl Jasmonate and Salicylic Acid Induce Subspecies-Specific Patterns of Glucosinolate Accumulation and Gene Expression in Brassica oleracea L." Molecules 21, no. 10: 1417. https://0-doi-org.brum.beds.ac.uk/10.3390/molecules21101417