Article

Polyphenol Composition, Antioxidant Activity and Cytotoxicity of Seeds from Two Underexploited Wild Licania Species: L. rigida and L. tomentosa

by
Igor Parra Pessoa
1,
José Joaquim Lopes Neto
1,
Thiago Silva de Almeida
1,
Davi Felipe Farias
2,
Leonardo Rogério Vieira
1,
Jackeline Lima de Medeiros
1,
Aline Augusti Boligon
3,
Ad Peijnenburg
4,
Ivan Castelar
5 and
Ana Fontenele Urano Carvalho
1,*
1
Department of Biochemistry and Molecular Biology, Federal University of Ceará, 60020-181 Fortaleza, CE, Brazil
2
Department of Molecular Biology, Federal University of Paraíba, 58051-900 João Pessoa, PB, Brazil
3
Health Sciences Center, Federal University of Santa Maria, 97105-900 Santa Maria, RS, Brazil
4
RIKILT, Wageningen University and Research, P.O. Box 230, 6700 AE Wageningen, The Netherlands
5
Department of Finance, Federal University of Ceará, 60020-181 Fortaleza, CE, Brazil
*
Author to whom correspondence should be addressed.
Submission received: 2 November 2016 / Revised: 14 December 2016 / Accepted: 19 December 2016 / Published: 21 December 2016
(This article belongs to the Section Natural Products Chemistry)

Abstract

:
Studies have shown the benefit of antioxidants in the prevention or treatment of human diseases and promoted a growing interest in new sources of plant antioxidants for pharmacological use. This study aimed to add value to two underexploited wild plant species (Licania rigida) and L. tomentosa) from Brazilian flora. Thus, the phenolic compounds profile of their seed ethanol extract and derived fractions were elucidated by HPLC, the antioxidant capacity was assessed by in vitro chemical tests and the cytotoxicity determined using the human carcinoma cell lines MCF-7 and Caco-2. Eleven phenolic compounds were identified in the extracts of each species. The extracts and fractions showed excellent antioxidant activity in the DPPH assay (SC50, ranging from 9.15 to 248.8 µg/mL). The aqueous fraction of L. rigida seeds was most effective in preventing lipid peroxidation under basal conditions (IC50 60.80 µg/mL) whereas, in the presence of stress inducer, the methanolic fraction of L. tomentosa performed best (IC50 8.55 µg/mL). None of the samples showed iron chelating capacity. Ethanolic seed extracts of both species did not reveal any cytotoxicity against MCF-7 and Caco-2 cells. Both plant species showed a promising phenolic profile with potent antioxidant capacity and deserve attention to be sustainably explored.

1. Introduction

Brazil is the most megadiverse country on Earth and is the subject of significant global interest and debate regarding deforestation and environmental protection. However, much of the potential of its plant species is still unknown. One strategy to contribute to the conservation of valuable species for solving human health problems is to provide knowledge to awaken public actions aiming to protect this arsenal of plant species, which, besides their role in the natural ecosystems, can also contribute to prevent and treat chronic diseases. Epidemiological studies have shown that a regular intake of fruits and vegetables is associated with low risk of several chronic diseases including cancer, cardiovascular disease and aging in general, their polyphenols content and respective antioxidant activity apparently being responsible for that [1,2,3]. Therefore, there is a growing interest in the discovery of new sources of natural antioxidants in plants for the pharmacological and food/nutraceutical industries [4,5].
The Chrysobalanaceae is a family of trees, shrubs and flowering plants consisting of 17 genera and about 450 species distributed in tropical and subtropical regions worldwide. Licania is the most representative genus, which includes the species L. rigida Benth and L. tomentosa Benth [6,7]. These two Licania species are widely spread in Brazil, but more commonly found in the Brazilian Northeast region. In folk medicine, both species have numerous therapeutic attributes. L. rigida fruits are used against diabetes with proved hypoglycemic activity and diuretic effects [8]. Seed extracts of L. tomentosa have been demonstrated to exert inhibitory activity against the herpes simplex virus, and extracts of its leaves and fruits have been shown to have anti-cancer properties against leukemia cell strains [9,10]. As for the chemical composition, these two plant species have been described to contain flavonoids, tannins and steroids, as well as triterpenoids of the oleanane, ursane and lupane groups [11,12].
A previous study by our group identified promising antibacterial, anticholinesterase and antioxidant activities in ethanolic extracts of seeds from L. tomentosa and L. rigida, highlighting a biological potential for these species [13]. Thus, the aim of the present study was to characterize and quantify the phenolic compounds of L. tomentosa and L. rigida seed extracts and their respective fractions, to estimate their antioxidant capacity by different methods and to determine their possible cytotoxicity towards two cancer cell lines The goal for that is to increase attention and investments on wild plants, leveraging the results of scientific investigation, enhancing the link between in situ conservation strategies and sustainable use of plant diversity.

2. Results and Discussion

2.1. Chemical Characterization

The qualitative phytochemical analysis of the seed ethanolic extracts from L. tomentosa (LtEE) and L. rigida (LrEE) showed similar overall profile and revealed tannins, flavonoids and saponin classes. The data are presented in Table 1.
The phytochemical analysis can be a first step to guide the subsequent tests, but the assays used for this analysis do not provide much information about the quantity or the proportion of the constituent compounds. For this purpose, we ran three further analyses—determinations of total phenolics, tannins and total flavonoids, as shown in Table 2—which, in turn, confirmed some of the results of the previous analysis and gave us a more tangible perspective on the amount of each type of phenolic compound. In general, L. rigida was shown to be richer in tannins than L. tomentosa, the aqueous fraction of both species containing the highest levels (0.294 and 0.182 tannic acid equivalent in mg per g of the sample, respectively).The tannin content of the ethyl acetate fractions from both plants was below the detection limit of the method. The total phenolic contents of extracts and fractions of both Licania seeds ranged from 96.95 to 206.98 mg of gallic acid equivalent/g of extract which are much higher than those described for some fruits, such as apple (1.91 mg/g), watermelon (1 mg/g), grape (0.93 mg/g), orange (1.95 mg/g) and kiwifruit (3.18 mg/g) [14]. Similarly, the total flavonoids content of LtEAF (90.61 mg of quercetin/g of extract) showed values much higher than those described to apple (0.45 mg/g), mangosteen (0.41 mg/g), pear (0.32 mg/g) and tomato fruits (0.38 mg/g).
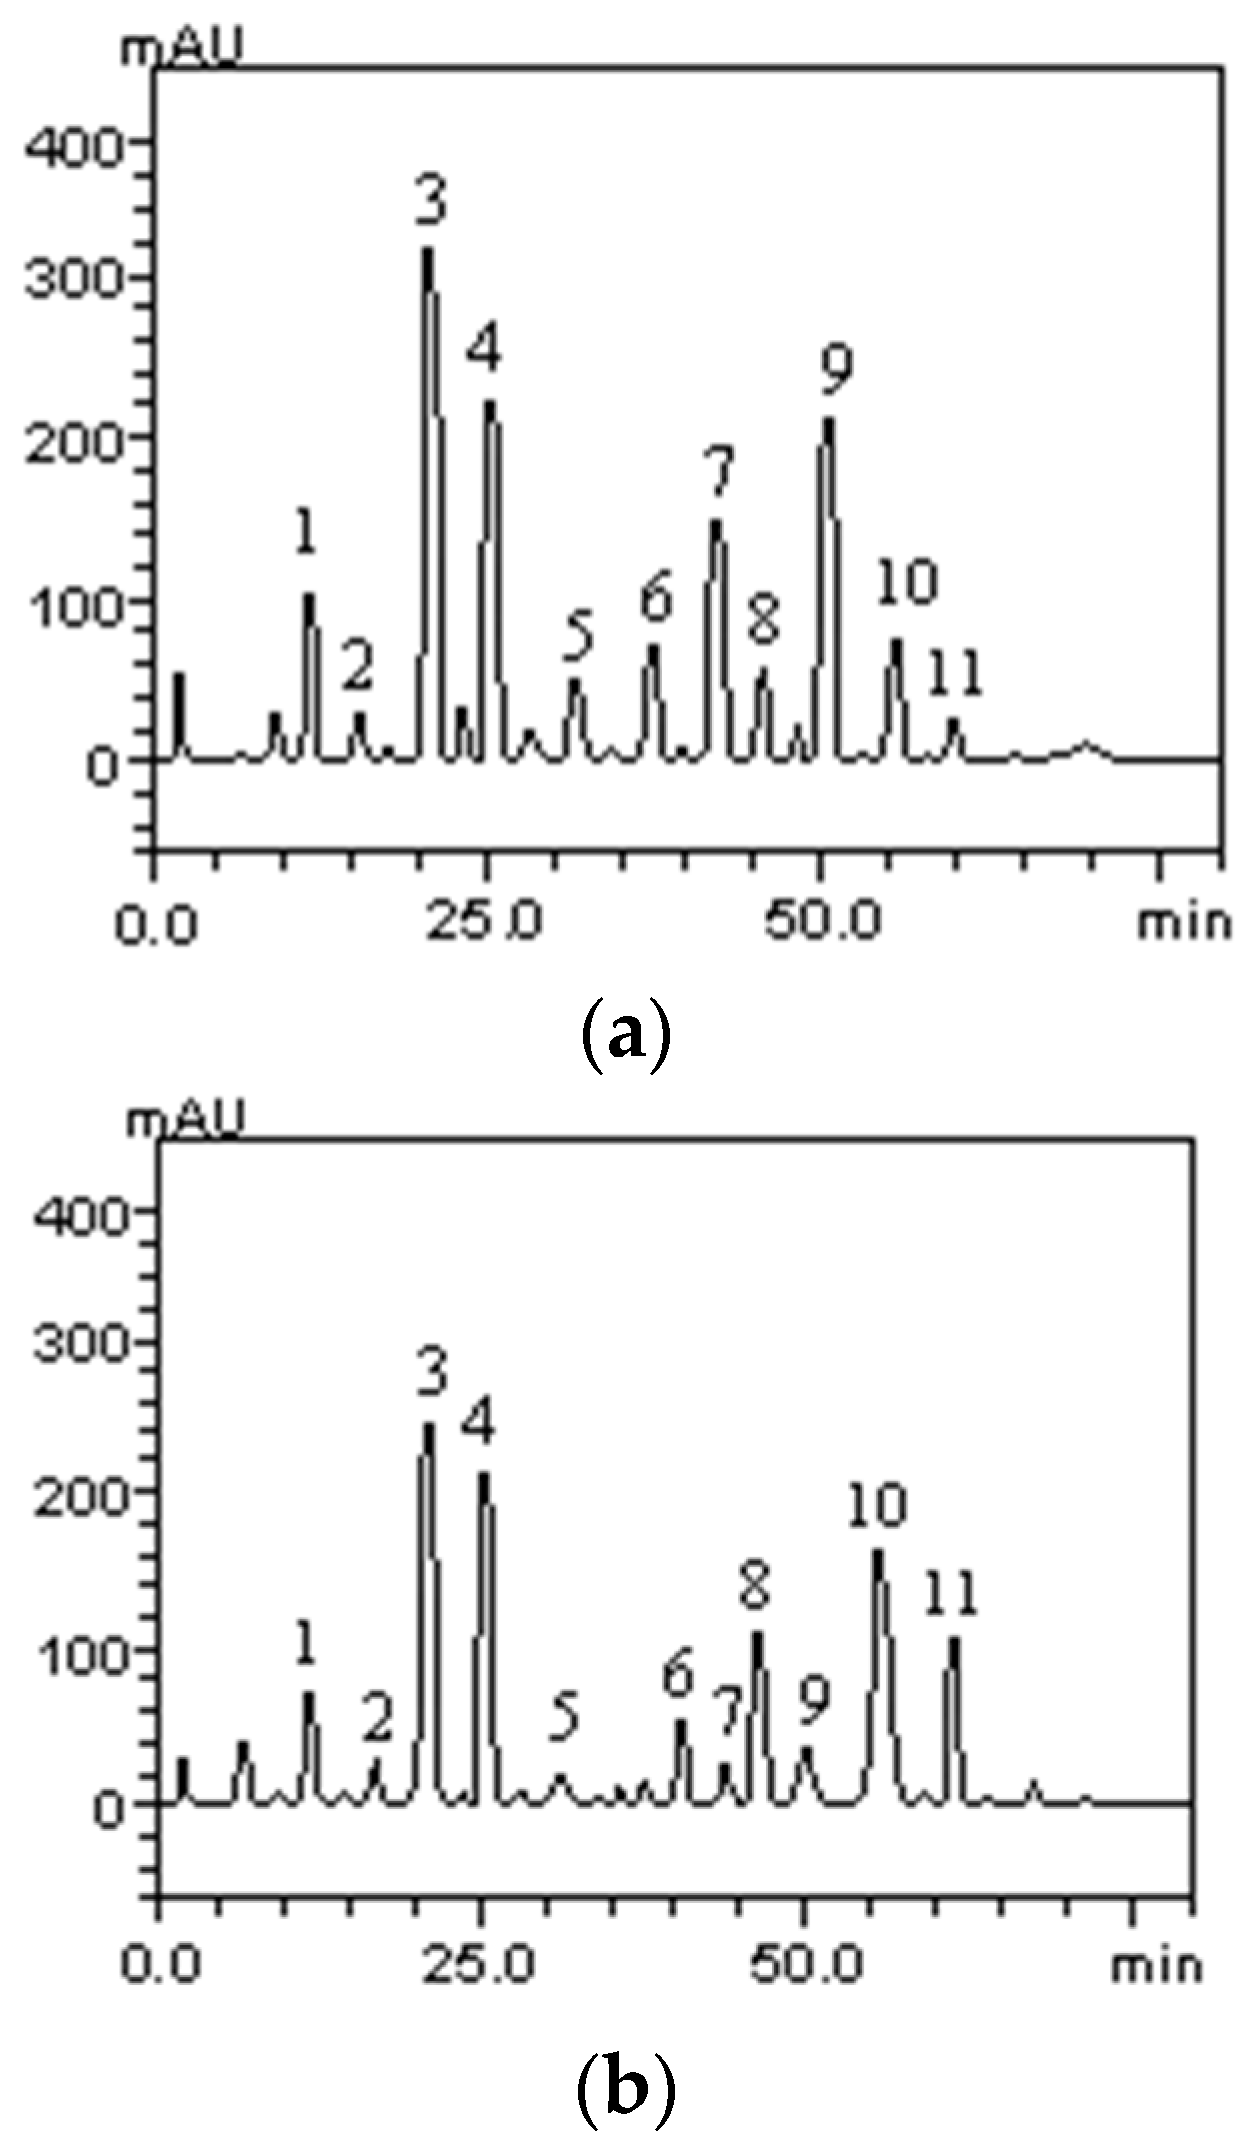
High Performance Liquid Chromatography (HPLC) analysis of the seed ethanolic extracts and their respective fractions indicated that the fractionation procedure used did not generate fractions with different compositions. Two representative chromatograms are shown in Figure 1.
Despite the similar chromatographic profile of the fractions, the constituents were present at different concentrations. For example, in the ethyl acetate fraction of both plant species all the identified phenolic acids and flavonoid compounds were present in much higher concentrations than in the other samples, as described in Table 3 and Table 4. In L. tomentosa, chlorogenic acid, rutin and quercetin were the compounds with the highest concentrations. The last two are widely known to be strong antioxidant substances. On the other hand, L. rigida showed as main compounds in all the fractions, except for LrEAF, chlorogenic acid, kaempferol and caffeic acid. In this instance, only the latter has been scientifically recognized as having remarkable antioxidant potential [15,16,17,18]. There are reports of other plants of the same genus, such as Licania licaniaeflora, which has been described as having strong antioxidant activity due to the presence of quercetin derivatives whereas for the kaempferol derivatives the opposite pattern is observed [19]. As a matter of fact, the flavonoids quercetin and kaempferol have been used as chemotaxonomic markers in the Chrysobalanaceae family and it has been noted that they are of wide-spread occurrence in the genus Licania [20].

2.2. Total Antioxidant Capacity

In general, the results showed a wide range of values for antioxidant activities when considering both methods (DPPH and TBARS, the latter with or without iron stress), as described in Table 5. In addition, the LrEAF had an outstanding performance in the DPPH test with values similar to those of ascorbic acid (SC50 9.15 and 10.17 µg/mL, respectively). It is noteworthy that some of these samples could inhibit lipid peroxidation as well as scavenge directly free radicals. If the results were analyzed by considering only the TBARS assay, it could be said that LrAF and LtMF had the best results, without and with iron, respectively (IC50 60.80 and 8.55 µg/mL). As a matter of fact, is the result shown by LrAF is remarkable considering that in most studies, water is rarely used as solvent for extraction or fractionation. Focusing on the DPPH results, the LtEE, LtMF, LtAF, LrEAF and LrAF showed excellent results (SC50 ranging from 9.15 to 42.68 µg/mL) compared to ascorbic acid (SC50 = 10.17 µg/mL) and the SC50 observed for these samples were much lower than that observed in leaves of L. tomentosa described elsewhere (SC50 73.33 µg/mL) [21]. The “total antioxidant capacity” (TAC) of a particular sample cannot be accurately measured by any isolated assay because of the chemical complexity of the antioxidant compounds. For instance, the methodologies should be able to evaluate both lipophilic and hydrophilic nature of the phenolic compounds, and distinguish hydrogen atom transfer, electron transfer, as well as transition metal chelation.
The antioxidant activity of these high phenolic-content samples (LtEAF and LrEAF) was disappointing. The former had a bad performance in boths tests whereas the latter had a bad result only in the DPPH assay. This strongly contradicts the literature that normally states that phenolic compounds correlate well with antioxidant activity [22]. It is, however, possible that ethyl acetate solvent must have extracted other compounds that could act antagonistically on antioxidant activity [23]. It is also important to stress that some phenolic antioxidants can auto-oxidize and behave like prooxidants under certain circumstances. Instead of breaking the free radical chain reaction, the phenoxy radical may also interact with oxygen and produce quinones and superoxide anion ( O 2 ) [24]. Simple phenolics which are easily oxidized, such as quercetin and gallic acid, possess prooxidant activity [25]. These arguments could partially explain why the samples with high concentration of simple phenolic compounds had poor antioxidant activity.
In the present study, the results on antioxidant activities of the different samples were crossed with the phenolic compounds composition data, so that a correlation could be established. The antioxidant activity measured by the DPPH correlated very well with quercetin (r = 0.788) and quercitrin (r = 0.744). As for the results of TBARS assay without iron-induced stress, catechin (r = 0.690) and quercetin (r = 0.514) presented the best correlations. In general, flavonoids showed better correlation values than the phenolic acids in the results of these two assays. The data are presented in Table 6.
In fact, the flavonoids are recognized for exceptional antioxidant activity [26], and quercetin is very frequently chosen as a positive control in antioxidant assays [27]. Catechin has an analogous chemical structure, but it lacks the oxo group in the carbon 4 and a double bond in the carbons 2 and 3, which confers a less potent antioxidant activity when used alone [28]. When the TBARS was performed with iron-induced stress, a different outcome was observed: the highest correlation values were those of chlorogenic acid (r = 0.465) and rutin (r = 0.346), a flavonoid derived from quercetin. Phenolic acids showed a low positive correlation in this assay (r = 0.246) and flavonoids no correlation at all. In the case of phenolic acids, the interaction with the egg phospholipids and the ability to form stable complexes with iron may have been more important than the mere ability to neutralize free radicals. For the iron chelating property, it is of utmost importance to have one or both two groups: catechol and galloyl. In addition, to give greater protection to the phospholipids, polyphenols must have hydrophilic groups in their chemical structure, such as hydroxyls and carbohydrates that can interact with the polar part of the micelles formed by them [29]. These characteristics are presented by rutin and chlorogenic acid chemical structure [30].

2.3. Chelating Capacity
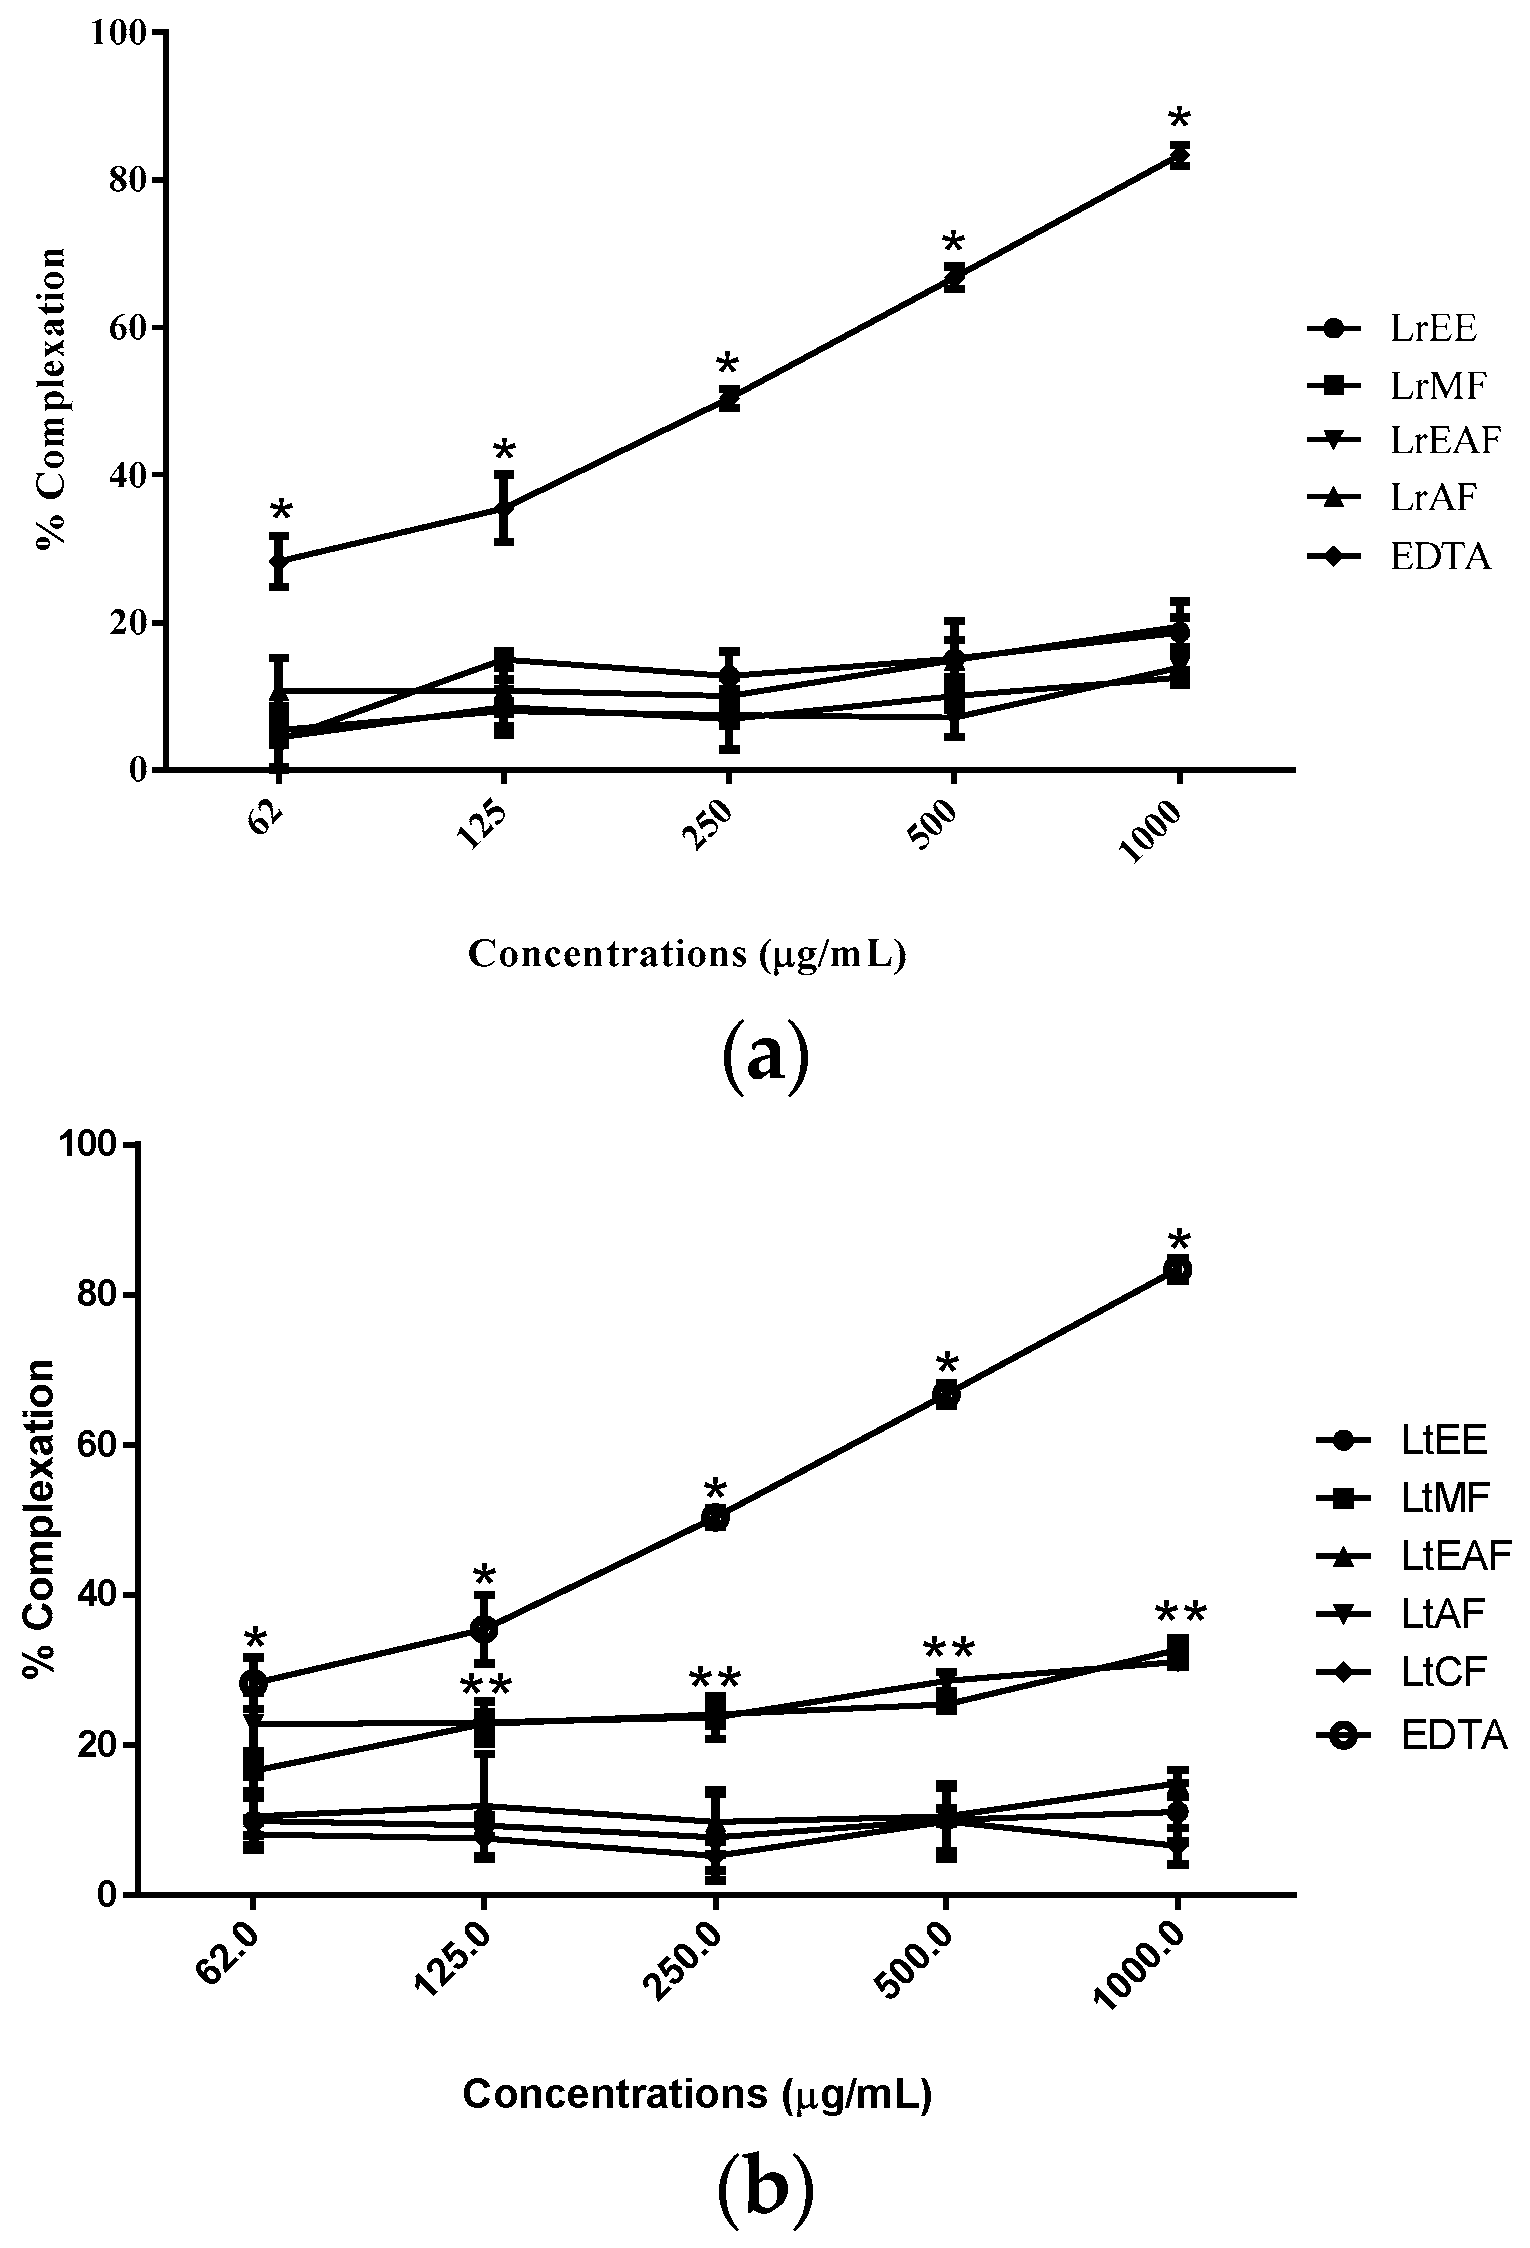
As for the o-phenanthroline assay, no sample was able to chelate free iron as the positive control EDTA, at least when tested in vitro (Figure 2). However, LtMF and LtAF showed chelating activity higher than the other fractions of L. tomentosa. This result is not necessarily negative in what concerns antioxidant potential since chelating capacity is just one among many mechanisms of action to help prevent oxidative stress in living beings [31,32].
In fact, many studies with plant extracts have shown that beyond the capacity to neutralize free radicals, plant compounds show also the ability to chelate transition metals. Indeed, the intracellular redox state is related to the iron (or copper) redox couple and the maintenance of its levels is under strict physiological control [33]. It has been inferred that iron regulation guarantees no free iron is present in the cell. Nevertheless, under stress circumstances, iron levels may surpass the capacity of transferrin to bind it. The released Fe(II) can participate in the Fenton reaction, generating hydroxyl radical [Fe(II) + H2O2 → Fe(III) + OH + OH], which is extremely reactive and might impair various cellular components [34]. Thus, it is useful to measure the iron chelating capacity of a sample. The results for this test helped us to abandon the hypothesis that lipid peroxidation protection was only due to the ability to trap iron, turning it less available for the Fenton reaction (Figure 2). It is more plausible to believe that there is more than one mechanism involved in the lipid peroxidation inhibition. Antioxidants are compounds that can delay autoxidation by inhibiting formation or interrupting propagation of free radicals in different ways: (1) scavenging species that initiate peroxidation; (2) chelating metal ions so that they are unable to generate reactive species or decompose lipid peroxides; (3) quenching O2− preventing formation of peroxides; (4) breaking the autoxidative chain reaction; and/or (5) reducing localized O2 concentrations [35].

2.4. Cytotoxicity to Cancer Cell Lines

Since several studies have demonstrated the cytotoxic effects of flavonoids [36,37,38] and phenolic acids [39,
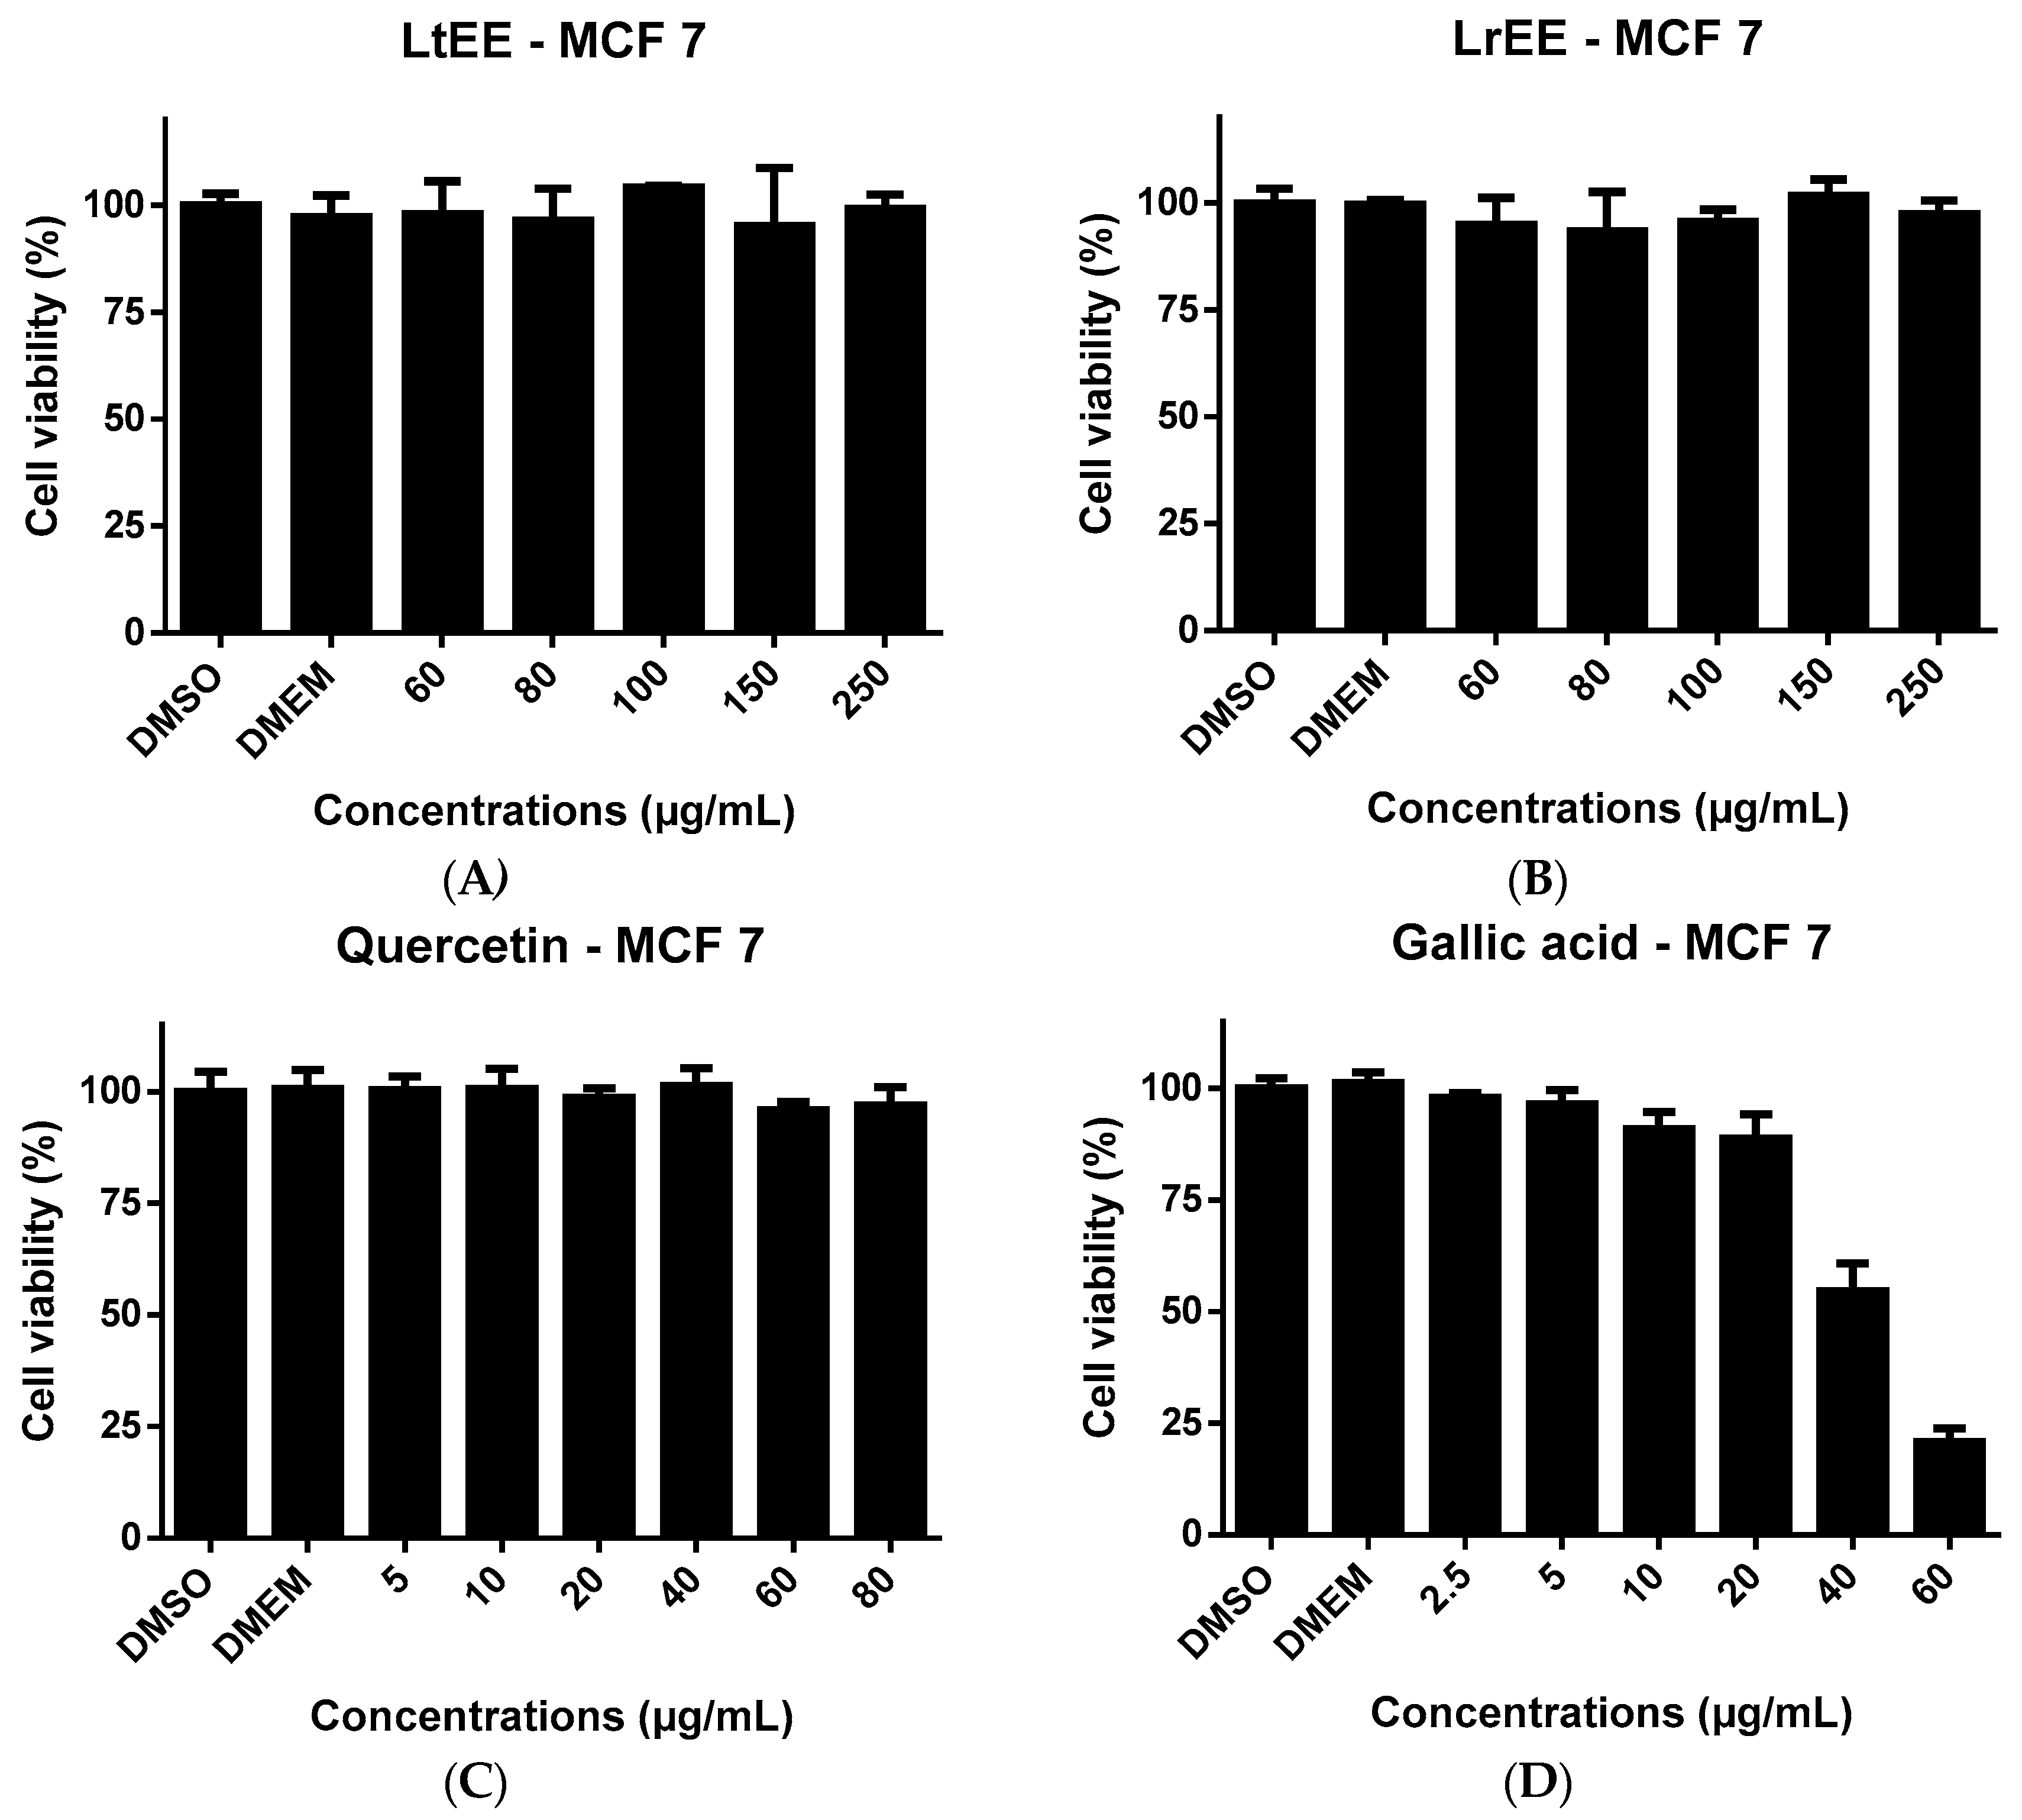
40] to human cancer cells, in the present study LrEE and LtEE were tested for possible cytotoxicity towards the human MCF-7 breast cancer and Caco-2 colorectal adenocarcinoma cell lines. Also the flavonoid quercetin and phenolic acid galic acid, which both are constituents of the ethanolic extracts, were included in the cytotoxicity experiments for comparison. After treatment of both cell lines for 24 h with increasing concentrations of LrEE, LtEE, quercetin and gallic acid, cell viability was determined using the ATPlite assay. It was not possible to test the ethanol extracts at concentrations exceeding 250 µg/mL, due to the formation of precipitates in the culture medium. The same was true for quercetin at concentrations higher than 80 µg/mL medium. Flavonoids are known to easily precipitate in aqueous medium [41]. LrEE and LtEE concentrations up to 250 µg/mL culture medium did not show any toxicity to MCF-7 cells (
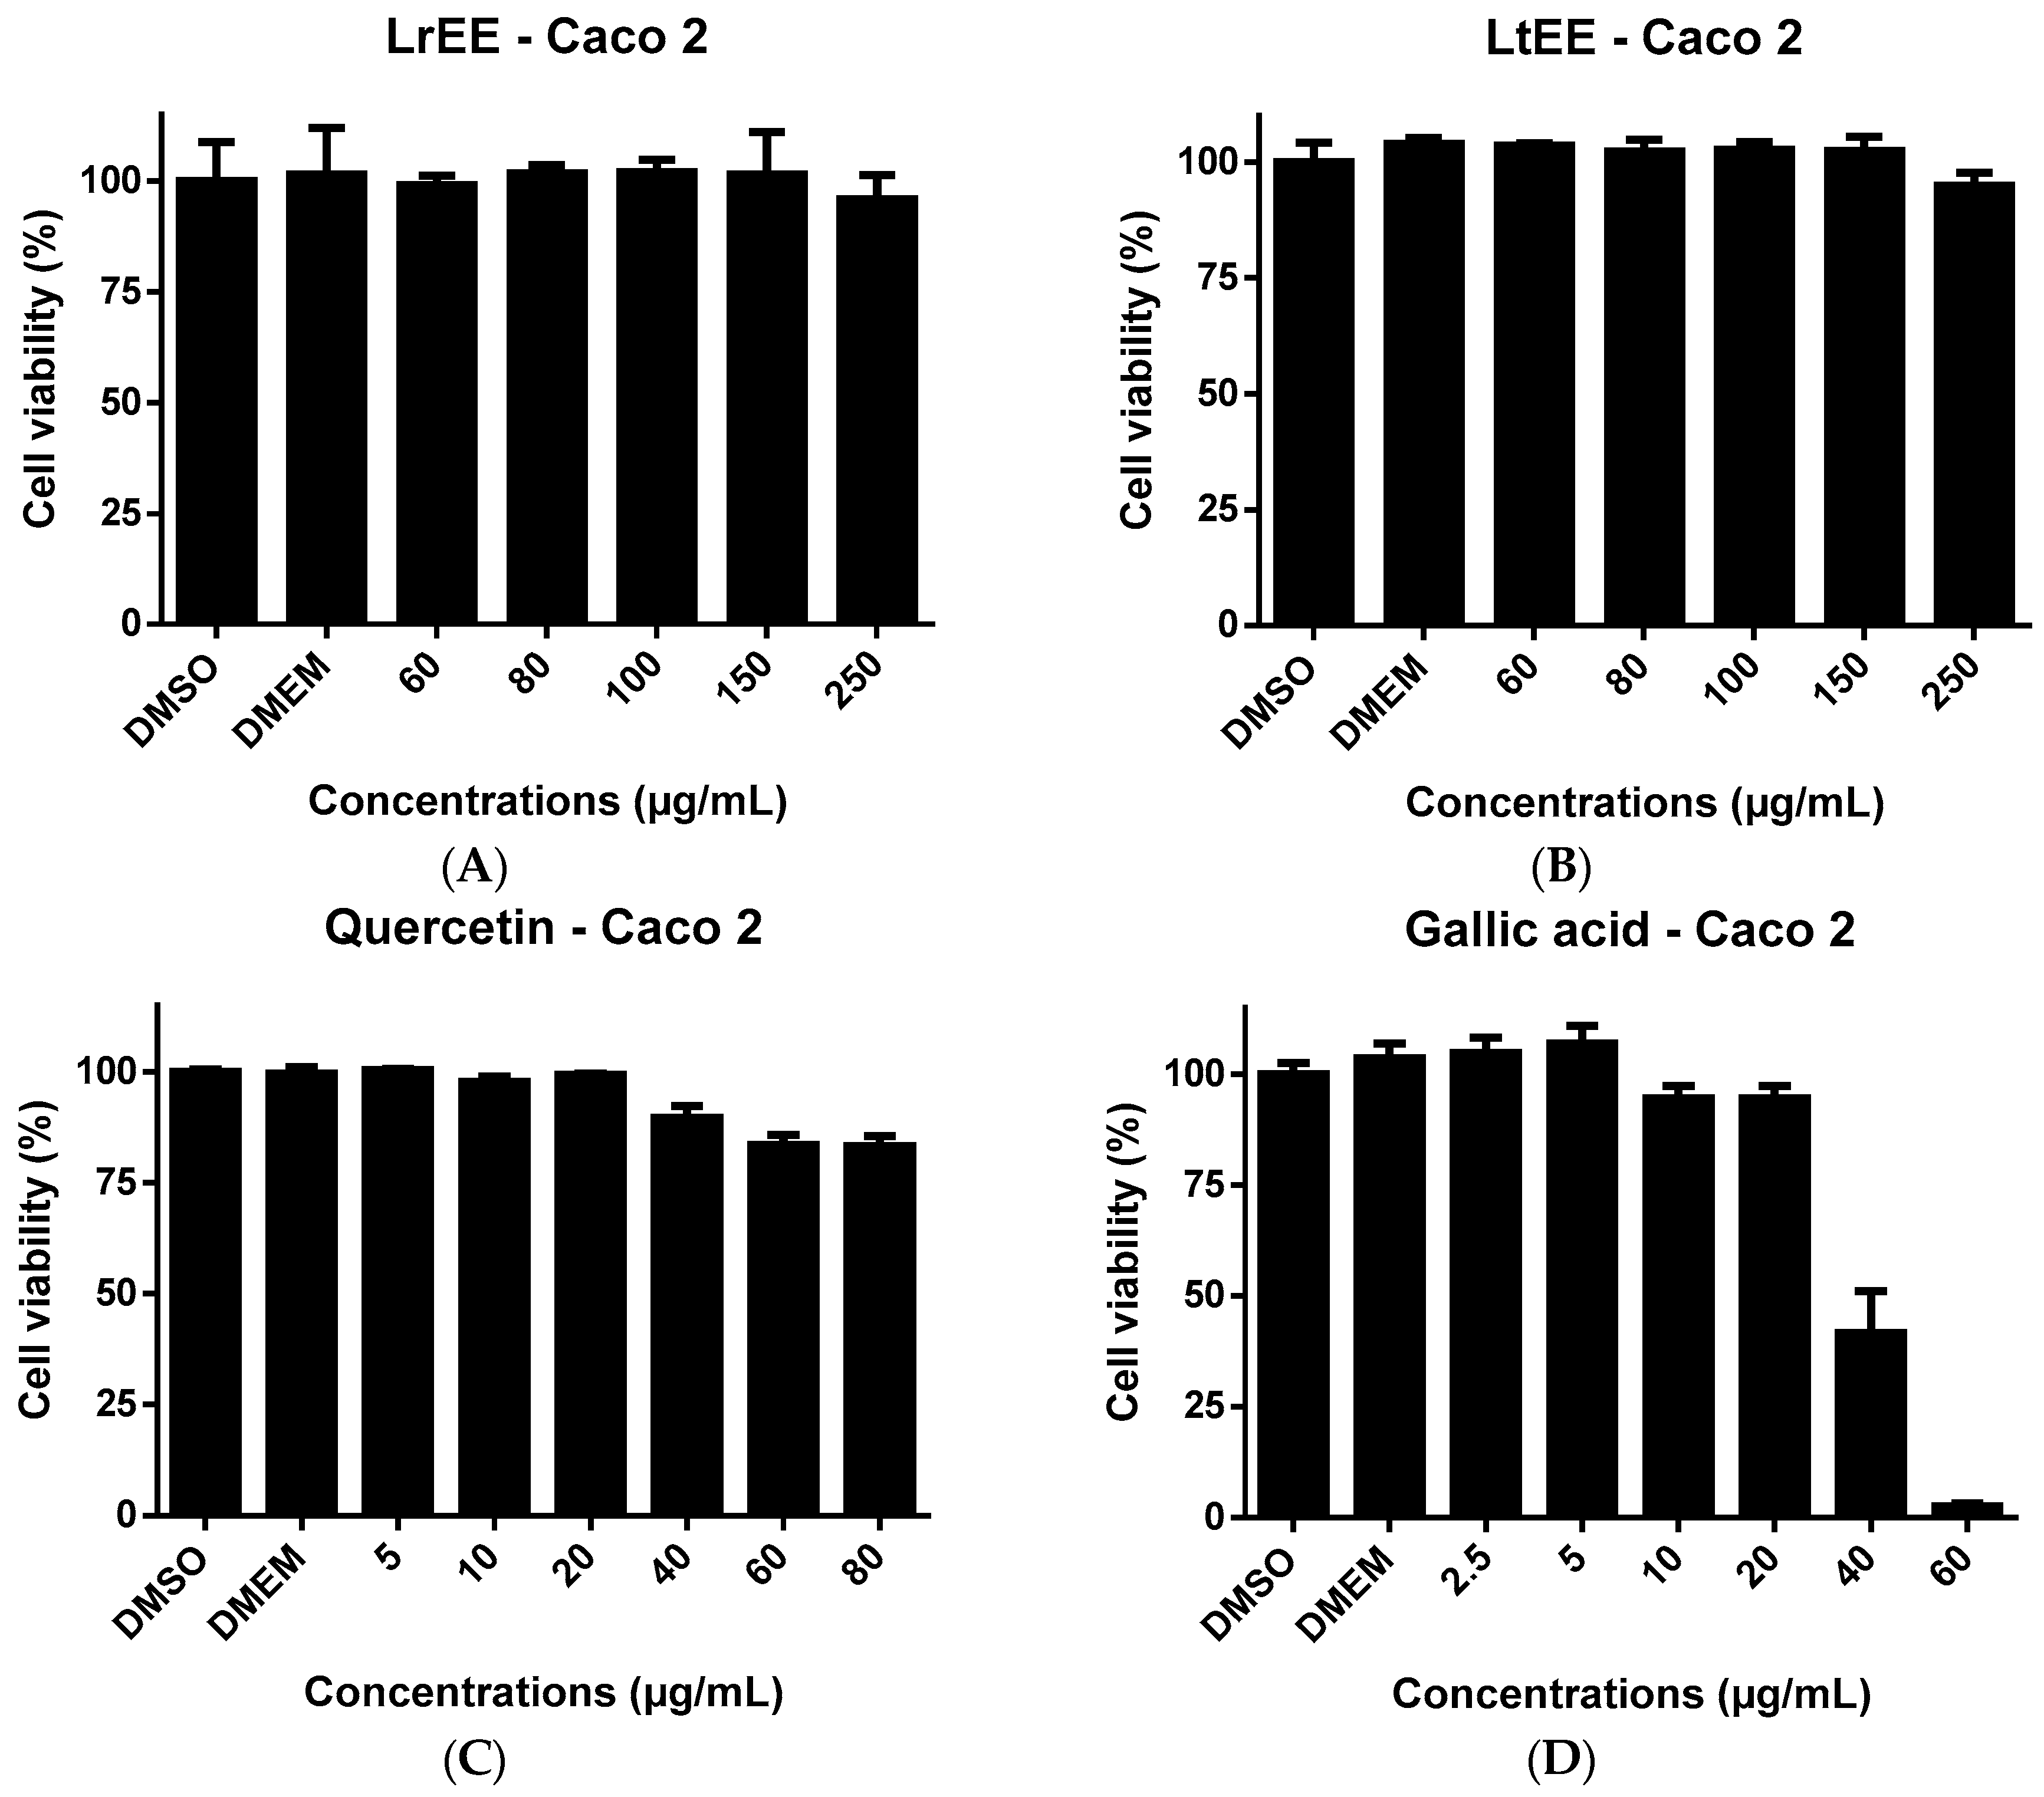
Figure 3) and Caco-2 cells (Figure 4). The higher concentrations of quercetin were slightly cytotoxic to Caco-2 (Figure 4) but not to MCF-7 (Figure 3).
Gallic acid at 40 and 60 µg/mL resulted in clear cytotoxicity to both cell lines. The lack of cytotoxicity of LrEE and LtEE is in contrast with previous finding by ohers. Extracts of several plants from the Licania genius have been reported to exert in vitro cytotoxic effects towards cancer cell lines, for example extracts of L. heteromorpha [42] and L. michauxii in human hepatoma HepG2 cells and Caco-2 cells [43]. This discrepancy might be related to differences in extract preparation and type of viability assay used, e.g., ATPlite versus MTT assays.

3. Materials and Methods

3.1. Plant Material

Fruits from L. rigida and L. tomentosa were harvested (at least 3 kg each) in January, 2013, within an area of 0.384 km² in the Pici Campus at Federal University of Ceará (3°43’54.7032’’ S, 38°31’36.0084’’ W), in the city of Fortaleza, Northeastern Brazil. Plants were identified by the taxonomist Dr. Edson de Paula Nunes and voucher specimens of L. rigida and L. tomentosa (EAC 40216 and EAC 40215, respectively) were deposited at Herbarium Prisco Bezerra (EAC) at the same University. The seeds from freshly harvested plant material were separated from other plant materials, air-dried, and ground in a laboratory mill to a fine powder (particle size < 0.5 mm).

3.2. Chemicals

Gallic acid, chlorogenic acid, ellagic acid, ascorbic acid, ferrous sulfate, tannic acid, phenantroline and caffeic acid were purchased from Merck (Darmstadt, Germany). 2,2-Diphenyl-1-picrylhydrazyl (DPPH), thiobarbituric acid (TBA), 1,1,3,3-tetraethoxypropane (MDA), bovine serum albumin (BSA), agarose type I, sodium azide, aluminium chloride, potassium acetate, quercetin, quercitrin, isoquercitrin, rutin, kaempferol, catechin, epicatechin and Folin–Ciocalteu’s phenolic reagent were acquired from Sigma Aldrich Co. (St. Louis, MO, USA). All other chemicals used were of analytical grade.

3.3. Extract Preparation and Fractioning

The grounded seeds were submitted to extended extraction for 9 days with solvent (95% ethanol) being changed every 72 h (1:2, w/v) at room temperature, them the extracts were filtered and distilled in the rotary evaporator (40–50 °C), under low pressure to obtain the LtEE and LrEE [44]. Part of these extracts were used for fractioning described as follows. First, 25 g of each ethanolic seed extract were mixed with silica until the obtainment of a homogeneous mixture. Then, using paper filter and Büchner funnels, the mixture was eluted with solvents in crescent polarity (hexane, chloroform, ethyl acetate, methanol and water). This process was repeated until the eluate of each solvent used was totally transparent. Finally, the solvents were evaporated in the rotary evaporator (in the same conditions used to ethanolic extract), producing five fractions from L. tomentosa (LtHF, L. tomentosa hexanic fraction; LtCF, L. tomentosa chloroformic fraction; LtEAF, L. tomentosa ethyl acetate fraction; LtMF, L. tomentosa methanolic fraction; LtAF, L. tomentosa aqueous fraction) and other five from L. rigida (LrHF, L. rigida hexanic fraction; LrCF, L. rigida chloroformic fraction; LrEAF, L. rigida ethyl acetate fraction; LrMF, L. rigida methanolic fraction; LrAF, L. rigida aqueous fraction). The hexanic and chloroformic fractions were discarded because of insignificant antioxidant activity (previously detected). The extracts and fractions were stored under −4 °C until use for the analyses.

3.4. Chemical Characterization

3.4.1. Phytochemical Screening

LtEE and LrEE were subjected to preliminary phytochemical screening for the detection of major classes of secondary metabolites by chemical reactions that result in the development of color and/or precipitate distinctive for each class of substances. Residues from both extracts were resuspended with suitable solvents for testing phenols and tannins (reaction with ferric chloride); saponins (foam test); triterpenoids and steroids (Liberman-Buchard test); different subclasses of flavonoids (tests of pH variation with sodium hydroxide and sulfuric acid) and alkaloids (reaction with Dragendorff reagent) [44].

3.4.2. Total Phenolic Compounds Determination

The total phenol content of L. tomentosa and L. rigida extracts and respective fractions was determined by the Folin-Ciocalteu method [45], with some modifications. In a 96-well microplate, 50 µL of the samples were mixed with 50 µL of Folin-Ciocalteu’s reagent (33% v/v) and after 3 min, 100 µL of distilled water and 100 µL of sodium carbonate (7.5%) were, then, added. The reaction mixture was incubated for 30 min in the dark and the absorbance was measured at 700 nm in a spectrophotometer (Epoch, Biotek Intruments Inc., Winooski, VT, USA). Gallic acid (GA) was used as standard for phenolic compounds. The average of the readings was used and the total phenolic content was expressed as mg of gallic acid equivalent pergram of sample. Traditionally, gallic acid is used as standard [31]. All samples were processed in triplicates.

3.4.3. Total Flavonoid Content Determination

The aluminum chloride colorimetric method was used to determine flavonoids content in the samples. Traditionally, quercetin is used to make the calibration curve [46]. Briefly, 10 mg of quercetin was dissolved in 80% ethanol, this stock solution was diluted to concentrations of 25, 50 and 100 µg/mL. The diluted standard solutions (0.5 mL) were separately mixed with 1.5 mL of 95% ethanol, 0.1 mL of 10% aluminum chloride, 0.1 mL of 1 M potassium acetate and 2.8 mL of distilled water. After incubation at room temperature for 30 min, the absorbance of the reaction mixture was measured at 415 nm using a spectrophotometer (Biospectro SP-220, Curitiba, Brasil). The amount of 10% aluminum chloride was substituted by the same amount of distilled water as a blank. Similarly, 0.5 mL of ethanol extracts were reacted with aluminum chloride for determination of flavonoid content as described above. The results were expressed as mg of quercetin equivalent per gram of sample. All samples were processed in triplicates.

3.4.4. Tannin by Radial Diffusion Method

The determination of tannins of the ethanolic extract and the ethyl acetate, metanolic and aqueous fractions was performed by the radial diffusion method [47]. This method consists in the reaction between tannins and proteins in agarose gel forming a visible and measurable ring. First, a buffer of 50 mM acetic acid, 60 μM ascorbic acid and 0.04% sodium azide was prepared and adjusted to pH 5.0. This buffer was then used to prepare the gel by adding 1% agarose. Briefly, the solution was heated until complete agarose homogenization and, then, it was cooled down to 45 °C. At this point, 0.1% BSA was added. Quickly, the gel was distributed in aliquots of 15 mL in 9.0 cm in diameter Petri plates, placed into cooling to form gel for 10 min under refrigeration. Four-millimeter diameter wells were made on the gel 2.0 cm apart from each other and from the plate edges. By using a micropipette, four successive aliquots of 10 μL of each extract were added inside the wells. To obtain the calibration curve, the same protocol was performed along with serial dilutions made out from an ethanolic solution (70%) of tannic acid as a standard (proposed by the method) at a concentration of 25 mg/mL. All samples were processed in triplicates and the results were expressed as mg of tannic acid equivalent per gram of the sample.

3.4.5. HPLC-DAD

Apparatus

High performance liquid chromatography (HPLC-DAD) was performed with a Shimadzu Prominence Auto Sampler (SIL-20A) HPLC system (Shimadzu, Kyoto, Japan), equipped with Shimadzu LC-20AT reciprocating pumps connected to a DGU 20A5 degasser with a CBM 20A integrator, SPD-M20A diode array detector and LC solution 1.22 SP1 software (Shimadzu, Kyoto, Japan).

Procedures

Reverse phase chromatographic analyses were carried out under gradient conditions using a C18 column (4.6 mm × 250 mm) packed with 5 μm diameter particles; the mobile phase consisted of water containing 2% acetic acid (A) and methanol (B), and the composition gradient was: 5% (B) for 2 min; 25% (B) until 10 min; 40%, 50%, 60%, 70% and 80% (B) every 10 min; following the method [48] with slight modifications. The samples of L. tomentosa and L. rigida (ethanolic extract, and methanolic, ethyl acetate, chloroform and aqueous fractions) and mobile phase were filtered through 0.45 μm membrane filter (Millipore, Darmstadt, Germany) and then degassed by ultrasonic bath prior to use, the samples were analyzed at a concentration of 20 mg/mL. The flow rate was 0.7 mL/min and the injection volume was 40 μL. The sample and mobile phase were filtered through 0.45 μm membrane filter (Millipore) and then degassed by ultrasonic bath prior to use. Stock solutions of standard references were prepared in the HPLC mobile phase at a concentration range of 0.030–0.250 mg/mL catechin, epicatechin, quercetin, quercitrin, isoquercitrin, kaempferol and rutin, and 0.045–0.500 mg/mL for gallic, chlorogenic, ellagic and caffeic acids. Quantification was carried out by integration of the peaks using the external standard method, at 257 nm for gallic acid, 280 nm for catechin and epicatechin, 325 nm for chlorogenic, ellagic and caffeic acids, and 365 for quercetin, quercitrin, isoquercitrin, rutin kaempferol and kaempferol glycoside. The results were expressed as mg of each compound per gram of sample. The chromatography peaks were confirmed by comparing its retention time with those of reference standards and by DAD spectra (200 to 600 nm). All chromatography operations were carried out at room temperature and in triplicate. LOD and LOQ (“Limit of Detection” and “Limit of Quantification”) were calculated based on the standard deviation of the responses and the slope using three independent analytical curves [49]. LOD and LOQ were calculated as 3.3 and 10 σ/S, respectively, where σ is the standard deviation of the response and S is the slope of the calibration curve.

3.5. In Vitro Assessment of Antioxidant Activity

3.5.1. DPPH Radical Scavenging

The antioxidant activity was evaluated using the in vitro photocolorimetric method based on the DPPH scavenging capacity [50]. Shortly, it was prepared a solution of 60 µmol/L DPPH in ethanol. In a 96-well microplate, 100 µL of DPPH solution was added to 100 µL of the test sample dissolved in ethanol at different concentrations ranging from 0.5 to 512 μg/mL, in nine replicates. As negative control, it was used 100 μL DPPH solution and 100 μL of ethanol. The reaction was incubated in the dark at room temperature for 30 min and the readings were executed in a spectrophotometer at 518 nm (Biotek Instruments Inc. Epoch, Winooski, VT, USA). The DPPH-scavenging activity was calculated by the following formula:
%SA = 100 × (Abscontrol − Abssample)/Abscontrol
where SA is the scavenging activity; Abscontrol is the absorbance of control; and Abssample is the absorbance of the samples. The concentration of the sample needed to scavenge 50% of DPPH radical (SC50), was obtained by logistic regression plotting the DPPH-scavenging percentage of each sample against the logarithm of sample concentration. Ascorbic acid was used as positive control in this experiment at the same concentrations used for the samples. All samples were processed in triplicates.

3.5.2. TBARS Assay

Due to the fact Reactive Oxygen Species (ROS) have an extremely short half-life, they are difficults to measure directly. Instead, several products of the damage produced by oxidative stress can be measured such as thiobarbituric acid reactive substances (TBARS). These substances are formed as a byproduct of lipid peroxidation, which can be detected using thiobarbituric acid as a reagent. MDA is one of several low-molecular-weight final products formed via the decomposition of lipid peroxidation products. The TBARS formation was determined using egg yolk phospholipids [51]. Concisely, the phospholipids, obtained from homogenate of egg yolk membrane, were added to the reaction mixture containing various concentrations of the extracts (LrEE and LtEE) and their respective ethyl acetate, methanol and aqueous fractions (8 to 250 µg/mL) with deionized water to complement the total volume of 500 µL. Then, the reaction mixture was pre-incubated at 37 °C for 1 h in the presence or absence of iron (75 µM) as a lipid peroxidation stress inducer. The reaction’s color was observed by adding 500 µL of acetate buffer (20%) and 500 µL of TBA (0.6%) water solution and, then, incubated at 97 °C in water bath for 1 h. In the meantime, a series of dilutions of 0.03 mM MDA standard were incubated in the same manner. The absorbance was measured at wavelength of 532 nm (Biospectro SP-220). All samples were processed in triplicates. The concentration of the sample needed to cause 50% inhibition of lipid peroxidation (IC50) was obtained by logistic regression plotting the lipid peroxidation per cent inhibition of each sample against the logarithm of sample concentration.

3.5.3. Iron chelating Activity

To examine the iron chelating properties of the extracts (LrEE and LtEE) and their respective ethyl acetate, methanol and aqueous fractions, it was used the o-phenanthroline method with slight modifications [52]. Briefly, the mixture, containing 40 µL of Fe2+ (120 µM Fe2SO4) and 20 µL of the samples at concentrations from 62.5 to 1000 µg/mL, was added to 591 µL of water plus 376 µL of Tris-HCl buffer (0.1 M; pH 7.2), followed by 5 min wait to form complex(es) between Fe2+ and the related compounds. After that, 13 µL of o-phenanthroline (0.25%) solution was added to determine the colored complex(es) formation between o-phenanthroline and free Fe2+. The absorbance was recorded at 510 nm (Biospectro SP-220). The values are expressed in percentage of control determined in the absence of the samples. Solutions of Fe2SO4 were made in distilled water just before use. EDTA (Ethylenediamine tetraacetic acid) was used as positive control for its acknowledged chelating capacity, in the same concentration of the samples. All samples were processed in triplicate.

3.6. Cell Culture and Cell Viability Assay

The human MCF-7 breast cancer and Caco-2 colorectal adenocarcinoma cell lines were purchased from ATCC (Manassas, VA, USA). Cells were routinely grown in Dulbecco’s Modified Eagle’s Medium (DMEM, Lonza, Verviers, Belgium), supplemented with 10% (v/v) fetal calf serum (FCS, Gibco, Carlsbad, CA, USA), 0.6% (v/v) penicillin-streptomycin (10,000 units penicillin and streptomycin 10 mg/mL (Sigma-Aldrich Co.), and 1% (v/v) non-essential amino acids (NEAA, Lonza, Verviers, Belgium) at 37 °C in a humidified atmosphere containing 5% CO2.
MCF-7 cells and Caco-2 cells were cultured to 80% confluency, trypsinized, counted, and resuspended in culture medium to a final cell suspension density of 100,000 cells/mL. Afterwards, 100 µL of cell suspension were seeded into each well of 96-well flat bottom microtiter plates. Upon culturing cells for 48 h, cells were exposed for 24 h to extracts and compounds at final concentrations rangingfrom 60–250 µg/mL for LrEE and LtEE; 5–80 µg/mL for quercetin and 2.5–60 µg/mL for gallic acid. The highest concentrations were chosen based on characteristics of each sample, i.e., larger amounts of the extracts and quercetin induced precipitation in the culture medium, and caffeic acid and gallic acid changed the pH of the medium. DMSO, added to the medium at a final concentration of 0.05% (v/v), was used as the solvent control.
The ATPlite assay (PerkinElmer, Groningen, The Netherlands) was performed to evaluate cell viability according to the manufacturer’s instructions. After 24 h exposure of the cells to the extracts and compounds, the culture medium (100 µL) in each well was refreshed, 50 µL of the mammalian cell lysis solution (ATPlite kit) was added and the plate was shaken for 2 min using a microtiter plate shaker. Then, 50 µL of substrate solution (ATPlite kit) was added to each well followed by shaking for 10 min. Thereafter, the luminescence was measured using a multi-mode microplate reader (BioTek Synergy HT). Cell viability was calculated using the equation: luminescencetreated/luminescencesolventcontrol × 100%. The assay was performed in triplicate. A cytotoxic concentration is a concentration resulting in <80%–100% viability [53,54].

3.7. Statistical Analysis

The results are given as means ± standard deviation (SD). Student’s t-test was used for comparison between two means and one-way analysis of variance (ANOVA) was used for comparison of more than two means. A difference was considered statistically significant when p < 0.05. The excessively high degree of colinearity among the chemical compounds concentration hindered the use of regression analysis, even resorting to orthogonalization techniques such as principal components analysis. Strong collinearity among the independent variables of a regressions leads either to imprecise estimates of the coefficients, or even to failure to determine them in a unique manner. In this case collinearity was of the second type. Thus, to define the effects of the chemical compounds on antioxidant activity, partial correlation analysis, which isolates the effect of other variables on the pair of variables being analyzed, was performed [55].

4. Conclusions

The seed extracts of L. tomentosa and L. rigida showed promising phenolic profiles with high concentrations of compounds having antioxidant activity, but no cytotoxicity towards the tested cancer cell lines. When considering the scavenging of free radicals, flavonoids compounds such as quercetin, quercitrin and catechin were the preponderant antioxidant molecules, whereas phenolic acids showed greater importance when stressed conditions were used (presence of iron). The compounds may be exploited in a near future in the pharmaceutical or nutraceutical industries and this consequently extendeds their well-known use as folk remedies, adding value to these wild plants. Although there are no reports on any hazards based on the history of use of these fruit seeds, further toxicological and antioxidant in vivo tests must be run in order to guarantee their safe use and efficacy of these species in the combat against oxidation in biological systems.

Acknowledgments

Thanks to Fundação Coordenação de Aperfeiçoamento de Pessoal de Nível Superior (CAPES) for supporting grants (PVE-A006_2013). In memoriam of Margareth Linde Athayde who made a significant scientific contribution to this manuscript.

Author Contributions

This article was generated with data of a master dissertation by the student I.P.P., supervised by A.F.U.C. with effective contributions of another eight persons. The contributions were as follows: T.S.d.A., D.F.F., A.P. and A.F.U.C. conceived and designed the experiments; I.P.P., L.R.V., J.L.d.M. and A.A.B. performed the experiments; I.P.P., T.S.d.A., D.F.F., J.J.L.N., A.A.B., A.P., I.C. and A.F.U.C. analyzed the data; T.S.d.A., D.F.F., J.J.L.N., A.P. and A.F.U.C. wrote the paper.”

Conflicts of Interest

The authors declare no potential conflicts of interest.

References

  1. Giampieri, F.; Alvarez-Suarez, J.M.; Battino, M. Strawberry and human health: Effects beyond antioxidant activity. J. Agric. Food Chem. 2014, 62, 3867–3876. [Google Scholar] [CrossRef] [PubMed]
  2. Pratheeshkumar, P.; Sreekala, C.; Zhang, Z.; Budhraja, A.; Ding, S.; Son, Y.; Hitron, A.; Hyun-Jung, K.; Wang, L.; Lee, J.C.; et al. Cancer prevention with promising natural products: Mechanisms of action and molecular targets. Anticancer Agents Med. Chem. 2012, 12, 1159–1184. [Google Scholar] [CrossRef] [PubMed]
  3. Lesjak, M.M.; Beara, I.N.; Orčić, D.Z.; Petar, K.N.; Simin, N.Đ.; Emilija, S.Đ.; Mimica-Dukić, N.M. Phytochemical composition and antioxidant, anti-inflammatory and antimicrobial activities of Juniperus macrocarpa Sibth. Sm. J. Funct. Foods 2014, 7, 257–268. [Google Scholar] [CrossRef]
  4. Pistollato, F.; Giampieri, F.; Battino, M. The use of plant-derived bioactive compounds to target cancer stem cells and modulate tumor microenvironment. Food Chem. Toxicol. 2015, 75, 58–70. [Google Scholar] [CrossRef] [PubMed]
  5. Mashabela, M.N.; Selahle, K.M.; Soundy, P.; Crosby, K.M.; Sivakumar, D. Bioactive compounds and fruit quality of green sweet pepper grown under different colored shade netting during postharvest storage. J. Food Sci. 2015, 80, H2612–H2618. [Google Scholar] [CrossRef] [PubMed]
  6. Castilho, R.O. Constituintes químicos de Licania tomentosa Benth. (Chrysobalanaceae). Quim. Nova 2008, 31, 66–69. [Google Scholar] [CrossRef]
  7. Leal, I.R.; Tabarelli, M.; Da Silva, J.M.C. Ecologia e Conservação da Caatinga, 1st ed.; Editora Universitária da UFPE: Recife, Brazil, 2003; pp. 1–822. [Google Scholar]
  8. Agra, M.F.; Baracho, G.S.; Nurit, K.; Basílio, I.J.L.D.; Coelho, V.P.M. Medicinal and poisonous diversity of the flora of “Cariri Paraibano”, Brazil. J. Ethnopharmacol. 2007, 111, 383–395. [Google Scholar] [CrossRef] [PubMed]
  9. Fernandes, J.; Castilho, R.O.; da Costa, M.R.; Wagner-Souza, K.; Kaplan, M.A.C.; Gattass, C.R. Pentacyclic triterpenes from Chrysobalanaceae species: Cytotoxicity on multidrug resistant and sensitive leukemia cell lines. Cancer Lett. 2003, 190, 165–169. [Google Scholar] [CrossRef]
  10. Miranda, M.M.F.S.; Gonçalves, J.L.S.; Romanos, M.T.V.; Silva, F.P.; Pinto, L.; Silva, M.H.; Ejzemberg, R.; Granja, L.F.Z.; Wigg, M.D. Anti-herpes simplex virus effect of a seed extract from the tropical plant Licania tomentosa (Benth.) Fritsch (Chrysobalanaceae). Phytomedicine 2002, 9, 641–645. [Google Scholar] [CrossRef] [PubMed]
  11. Castilho, R.O.; de Oliveira, R.R.; Kaplan, M.A.C. Licanolide, a new triterpene lactone from Licania tomentosa. Fitoterapia 2005, 76, 562–566. [Google Scholar] [CrossRef] [PubMed]
  12. Castilho, R.O.; de Souza, I.; Guimarães, Ú.P.; Kaplan, M.A.C. A survey of chemistry and biological activities of Chrysobalanaceae. An. Acad. Bras. Cienc. 2000, 72, 292–293. [Google Scholar] [CrossRef]
  13. Farias, D.F.; Souza, T.M.; Viana, M.P.; Soares, B.M.; Cunha, A.P.; Vasconcelos, I.M.; Ricardo, N.M.P.S.; Ferreira, P.M.P.; Melo, V.M.M.; Carvalho, A.F.U. Antibacterial, antioxidant, and anticholinesterase activities of plant seed extracts from Brazilian semiarid region. BioMed Res. Int. 2013, 2013, 1–9. [Google Scholar] [CrossRef] [PubMed]
  14. Liu, C.; Zhao, Y.; Li, X.; Jia, J.; Chen, Y.; Hua, Z. Antioxidant capacities and main reducing substance contents in 110 fruits and vegetables eaten in China. Food Nutr. Sci. 2014, 5, 293–307. [Google Scholar] [CrossRef]
  15. Piazzon, A.; Vrhovsek, U.; Masuero, D.; Mattivi, F.; Mandoj, F.; Nardini, M. Antioxidant activity of phenolic acids and their metabolites: Synthesis and antioxidant properties of the sulfate derivatives of ferulic and caffeic acids and of the acyl glucuronide of ferulic acid. J. Agric. Food Chem. 2012, 60, 12312–12323. [Google Scholar] [CrossRef] [PubMed]
  16. Pietta, P.G. Flavonoids as antioxidants. J. Nat. Prod. 2000, 63, 1035–1042. [Google Scholar] [CrossRef] [PubMed]
  17. Yang, J.; Guo, J.; Yuan, J. In vitro antioxidant properties of rutin. LWT Food Sci. Technol. 2008, 41, 1060–1066. [Google Scholar] [CrossRef]
  18. Zhang, M.; Swarts, S.G.; Yin, L.; Liu, C.; Tian, Y.; Cao, Y.; Swarts, M.; Yang, S.; Zhang, S.B.; Zhang, K.; et al. Antioxidant properties of quercetin. Adv. Exp. Med. Biol. 2011, 701, 283–289. [Google Scholar] [PubMed]
  19. Braca, A.; Sortino, C.; Politi, M.; Morelli, I.; Mendez, J. Antioxidant activity of flavonoids from Licania licaniaeflora. J. Ethnopharmacol. 2002, 79, 379–381. [Google Scholar] [CrossRef]
  20. Braca, A.; Luna, D.; Mendez, J.; Morelli, I. Flavonoids from Licania apetala and Licania licaniaeflora (Chrysobalanaceae). Biochem. Syst. Ecol. 2002, 30, 271–273. [Google Scholar] [CrossRef]
  21. Silva, J.B.N.F.; Menezes, I.R.A.; Coutinho, H.D.M.; Rodrigues, F.F.G.; Costa, J.G.M.; Felipe, C.F.B. Antibacterial and antioxidant activities of Licania tomentosa (Benth.) Fritsch (Chrysobalanaceae). Arch. Biol. Sci. Belgrade 2012, 64, 459–464. [Google Scholar] [CrossRef]
  22. Sreeramulu, D.; Reddy, C.V.K.; Chauhan, A.; Balakrishna, N.; Raghunath, M. Natural antioxidant activity of commonly consumed plant foods in India: Effect of domestic processing. Oxid. Med. Cell. Longev. 2013, 2013, 1–12. [Google Scholar] [CrossRef] [PubMed]
  23. Pérez-Jiménez, J.; Saura-Calixto, F. Effect of solvent and certain food constituents on different antioxidant capacity assays. Food Res. Int. 2006, 39, 791–800. [Google Scholar] [CrossRef]
  24. Hendrich, A.B. Flavonoid-membrane interactions: Possible consequences for biological effects of some polyphenolic compounds. Acta Pharmacol. Sin. 2006, 27, 27–40. [Google Scholar] [CrossRef] [PubMed]
  25. Hagerman, A.E.; Riedl, K.M.; Jones, G.A.; Sovik, K.N.; Ritchard, N.T.; Hartzfeld, P.W.; Riechel, T.L. High molecular weight plant polyphenolics (tannins) as biological antioxidants. J. Agric. Food Chem. 1998, 46, 1887–1892. [Google Scholar] [CrossRef]
  26. Kumar, S.; Pandey, A.K. Chemistry and biological activities of flavonoids: An overview. Sci. World J. 2013, 2013, 1–16. [Google Scholar] [CrossRef] [PubMed]
  27. Lu, Y.; Shipton, F.N.; Khoo, T.J.; Wiart, C. Antioxidant activity determination of citronellal and crude extracts of Cymbopogon citratus by 3 different methods. Pharmacol. Pharm. 2014, 5, 395–400. [Google Scholar] [CrossRef]
  28. Heim, K.E.; Tagliaferro, A.R.; Bobilya, D.J. Flavonoid antioxidants: Chemistry, metabolism and structure-activity relationships. J. Nutr. Biochem. 2002, 13, 572–584. [Google Scholar] [CrossRef]
  29. Phan, H.T.T.; Yoda, T.; Chahal, B.; Morita, M.; Takagi, M.; Vestergaard, M.C. Structure-dependent interactions of polyphenols with a biomimetic membrane system. Biochim. Biophys. Acta Biomembr. 2014, 1838, 2670–2677. [Google Scholar] [CrossRef] [PubMed]
  30. Hunyadi, A.; Martins, A.; Hsieh, T.J.; Seres, A.; Zupkó, I. Chlorogenic acid and rutin play a major role in the in vivo anti-diabetic activity of Morus alba leaf extract on type II diabetic rats. PLoS ONE 2012, 7, e50619. [Google Scholar] [CrossRef] [PubMed]
  31. Craft, B.D.; Kerrihard, A.L.; Amarowicz, R.; Pegg, R.B. Phenol-based antioxidants and the in vitro methods used for their assessment. Compr. Rev. Food Sci. Food Saf. 2012, 11, 148–173. [Google Scholar] [CrossRef]
  32. Lü, J.M.; Lin, P.H.; Yao, Q.; Chen, C. Chemical and molecular mechanisms of antioxidants: Experimental approaches and model systems. J. Cell. Mol. Med. 2010, 14, 840–860. [Google Scholar] [CrossRef] [PubMed]
  33. Perron, N.R.; Brumaghim, J.L. A review of the antioxidant mechanisms of polyphenol compounds related to iron binding. Cell Biochem. Biophys. 2009, 53, 75–100. [Google Scholar] [CrossRef] [PubMed]
  34. Valko, M.; Rhodes, C.J.; Moncol, J.; Izakovic, M.; Mazur, M. Free radicals, metals and antioxidants in oxidative stress-induced cancer. Chem. Biol. Interact. 2006, 160, 1–40. [Google Scholar] [CrossRef] [PubMed]
  35. Brewer, M.S. Natural antioxidants: Sources, compounds, mechanisms of action, and potential applications. Compr. Rev. Food Sci. Food Saf. 2011, 10, 221–247. [Google Scholar] [CrossRef]
  36. Chang, H.; MI, M.; Ling, W.; Zhu, J.; Zhang, Q.; Wei, N.; Zhou, Y.; Tang, Y.; Yuan, J. Structurally related cytotoxic effects of flavonoids on human cancer cells in vitro. Arch. Pharm. Res. 2008, 31, 1137–1144. [Google Scholar] [CrossRef] [PubMed]
  37. Ahmed, S.I.; Hayat, M.Q.; Tahir, M.; Mansoor, Q.; Ismail, M.; Keck, K.; Bates, R.B. Pharmacologically active flavonoids from the anticancer, antioxidant and antimicrobial extracts of Cassia angustifolia Vahl. BMC Complement. Altern. Med. 2016, 16, 460. [Google Scholar] [CrossRef] [PubMed]
  38. Sak, K. Cytotoxicity of dietary flavonoids on different human cancer types. Pharmacogn. Rev. 2014, 8, 122–146. [Google Scholar] [CrossRef] [PubMed]
  39. Sanderson, J.T.; Clabault, H.; Patton, C.; Lassalle-Claux, G.; Jean-François, J.; Paré, A.F.; Hébert, M.J.; Surette, M.E.; Touaibia, M. Antiproliferative, antiandrogenic and cytotoxic effects of novel caffeic acid derivatives in LNCaP human androgen-dependent prostate cancer cells. Bioorg. Med. Chem. 2013, 21, 7182–7193. [Google Scholar] [CrossRef] [PubMed]
  40. Schuck, A.; Weisburg, J.H.; Esan, H.; Babich, H. Cytotoxic and proapoptotic activities of gallic acid to human oral cancer HSC-2 cells. Oxid. Antiox. Med. Sci. 2013, 2, 265–274. [Google Scholar] [CrossRef]
  41. Löf, D.; Schillén, K.; Nilsson, L. Flavonoids: Precipitation kinetics and interaction with surfactant micelles. J. Food Sci. 2011, 76, N35–N39. [Google Scholar] [CrossRef] [PubMed]
  42. Atta-ur-Rahman, F.R.S. Studies in Natural Products Chemistry, 1st ed.; Elsevier: Cambridge, MA, USA, 2016; pp. 1–535. [Google Scholar]
  43. Badisa, R.B.; Chaudhuri, S.K.; Pilarinou, E.; Rutkoski, N.J.; Hare, J.; Levenson, C.W. Licania michauxii Prance root extract induces HSP 70 mRNA and necrotic cell death in cultured human hepatoma and colon carcinoma cell lines. Cancer Lett. 2000, 149, 61–68. [Google Scholar] [CrossRef]
  44. Matos, F.J.A. Introdução à Fitoquímica Experimental, 2nd ed.; UFC Edições: Fortaleza, Brazil, 1998; pp. 1–220. [Google Scholar]
  45. Singleton, V.L.; Orthofer, R.; Lamuela-Raventos, R.M. Analysis of total phenols and other oxidation substrates and antioxidants by means of Folin-Ciocalteu reagent. Methods Enzymol. 1998, 299, 152–178. [Google Scholar]
  46. Chang, C.; Yang, M.; Wen, H.; Chern, J. Estimation of total flavonoid content in propolis by two complementary colorimetric methods. J. Food Drug Anal. 2002, 10, 178–182. [Google Scholar]
  47. Hagerman, E. Radial diffusion method for determining tannin in plant extracts. J. Chem. Ecol. 1987, 13, 437–449. [Google Scholar] [CrossRef] [PubMed]
  48. Boligon, A.A.; Sagrillo, M.R.; Machado, L.F.; de Souza Filho, O.; Machado, M.M.; da Cruz, I.B.M.; Athayde, M.L. Protective effects of extracts and flavonoids isolated from Scutia buxifolia Reissek against chromosome damage in human lymphocytes exposed to hydrogen peroxide. Molecules 2012, 17, 5757–5769. [Google Scholar] [CrossRef] [PubMed]
  49. Boligon, A.A.; Kubiça, T.F.; Mario, D.N.; Brum, T.F.; Piana, M.; Weiblen, R.; Lovato, L.; Alves, S.H.; Santos, R.C.V.; Santos Alves, C.F.; et al. Antimicrobial and antiviral activity-guided fractionation from Scutia buxifolia Reissek extracts. Acta Physiol. Plant. 2013, 35, 2229–2239. [Google Scholar] [CrossRef]
  50. Zhang, X.L.; Guo, Y.S.; Wang, C.H.; Li, G.Q.; Xu, J.J.; Chung, H.Y.; Ye, W.C.; Li, Y.L.; Wang, G.C. Phenolic compounds from Origanum vulgare and their antioxidant and antiviral activities. Food Chem. 2014, 152, 300–306. [Google Scholar] [CrossRef] [PubMed]
  51. Sabir, S.M.; Rocha, J.B.T. Antioxidant and hepatoprotective activity of aqueous extract of Solanum fastigiatum (false “Jurubeba”) against paracetamol-induced liver damage in mice. J. Ethnopharmacol. 2008, 120, 226–232. [Google Scholar] [CrossRef] [PubMed]
  52. Puntel, R.L.; Nogueira, C.W.; Rocha, J.B.T. Krebs cycle intermediates modulate thiobarbituric acid reactive species (TBARS) production in rat brain in vitro. Neurochem. Res. 2005, 30, 225–235. [Google Scholar] [CrossRef] [PubMed]
  53. Van der Zande, M.; Undas, A.K.; Kramer, E.; Monopoli, M.P.; Peters, R.J.; Garry, D.; Fernandes, E.C.A.; Hendriksen, P.J.; Marvin, H.J.P.; Peijnenburg, A.A.; et al. Different responses of Caco-2 and MCF-7 cells to silver nanoparticles are based on highly similar mechanisms of action. Nanotoxicology 2015, 10, 1431–1441. [Google Scholar] [CrossRef] [PubMed]
  54. Mandimika, T.; Baykus, H.; Poortman, J.; Garza, C.; Kuiper, H.; Peijnenburg, A. Induction of the cholesterol biosynthesis pathway in differentiated Caco-2 cells by the potato glycoalkaloid alpha-chaconine. Food Chem. Toxicol. 2007, 45, 1918–1927. [Google Scholar] [CrossRef] [PubMed]
  55. Anderson, T.W. An Introduction to Multivariate Statistical Analysis, 3rd ed.; Wiley: New York, NY, USA, 2003; pp. 1–752. [Google Scholar]
  • Sample Availability: Not applicable.
Figure 1. High performance liquid chromatography phenolics and flavonoids profile of L. tomentosa ethanolic extract (a) and L. rigida ethanolic extract (b). Gallic acid (peak 1), catechin (peak 2), chlorogenic acid (peak 3), caffeic acid (peak 4), epicatechin (peak 5), ellagic acid (peak 6), rutin (peak 7), quercitrin (peak 8), quercetin (peak 9), kaempferol (peak 10) and kaempferol glycoside (peak 11).
Molecules 21 01755 g001
Figure 2. Iron chelating activity of Licania rigida (a) and L. tomentosa (b) seeds ethanolic extract and their fractions based on o-phenantroline method. Absorbance was recorded at 510 nm and percent complexation was calculated with respect to control (determined in the absence of samples and EDTA). LrEE = L. rigida ethanolic extract; LrMF = L. rigida methanolic fraction; LrEAF = L. rigida ethyl acetate fraction; LrAF = L. rigida aqueous fraction LtEE = L. tomentosa ethanolic extract; LtMF = L. tomentosa methanolic fraction; LtEAF = L. tomentosa ethyl acetate fraction; LtAF = L. tomentosa aqueous fraction; LtCF = L. tomentosa chloroform fraction; EDTA = Ethylenediamine tetraacetic acid. * Significant difference between EDTA control and all the samples in A and B (p < 0.05). ** Significant difference between LtMF/LtAF and other samples in B (p < 0.05).
Molecules 21 01755 g002
Figure 3. Cell viability of the human breast adenocarcinoma cell line MCF-7 upon 24 h exposure to ethanolic seeds extracts of Licania tomentosa (A); L. rigida (B); quercetin (C) and gallic acid (D). DMSO, dimethyl sulfoxide; DMEM: Dulbecco's Modified Eagle's Medium; LrEE: L. rigida ethanolic extract; LtEE: L. tomentosa ethanolic extract.
Molecules 21 01755 g003
Figure 4. Cell viability of the human colon adenocarcinoma cell line Caco-2 upon 24 h exposure to ethanolic seeds extracts of Licania rigida (A); L. tomentosa (B); quercetin (C) and gallic acid (D). DMSO, dimethyl sulfoxide; DMEM, Dulbecco's Modified Eagle's Medium; LrEE, L. rigida ethanolic extract; LtEE, L. tomentosa ethanolic extract.
Molecules 21 01755 g004
Table 1. Phytochemical screening of chemical compound classes in the ethanolic extracts of Licania rigida and L. tomentosa seeds.
Chemical Compound ClassesExtract
LrEELtEE
Hydrolysable tannins++
Anthocyanins/anthocyanidins
Flavonols/xanthones++
Chalcones/auronas
Flavononols++
Leucoanthocyanidins
Flavones++
Catechins++
Steroids/triterpenoids
Flavonones++
Saponins++
+, −: indicates presence and absence, respectively; LrEE: L. rigida ethanolic extract; LtEE: L. tomentosa ethanolic extract.
Table 2. Total phenolics, flavonoid and tannin content of Licania tomentosa and L. rigida seed extracts.
SamplesChemical Characterization
Total Phenolics *Flavonoids **Tannins ***
LtEE108.47 ± 6.90 a10.91 ± 2.24 a0.059 ± 0.017 a
LtMF96.95 ± 0.51 a35.56 ± 1.88 b0.039 ± 0.017 a
LtEAF201.83 ± 4.27 c90.61 ± 8.87 c-
LtAF111.15 ± 0.64 aND0.182 ± 0.007 b
LrEE206.98 ± 5.18 c26.94 ± 1.13 b0.147 ± 0.011 b
LrMF200.52 ± 2.93 c14.57 ± 0.29 a0.159 ± 0.037 b
LrEAF166.95 ± 3.58 bND-
LrAF119.21 ± 1.15 a1.91 ± 0.19 d0.294 ± 0.027 c
LtEE: L. tomentosa ethanolic extract; LtMF: L. tomentosa methanolic fraction; LtEAF: L. tomentosa ethyl acetate fraction; LtAF: L. tomentosa aqueous fraction; LrEE: L. rigida ethanolic extract; LrMF: L. rigida methanolic fraction; LrEAF: L. rigida ethyl acetate fraction; LrAF: L. rigida aqueous fraction. ND: not determined. -: not detected. Values are means ± SEM of three measurements. Similar superscript letters in the same column do not differ significantly (p > 0.05; ANOVA). * Gallic acid equivalent in mg per g of the sample. ** Quercetin equivalent in mg per g of the sample. *** Tannic acid equivalent in mg per g of the sample.
Table 3. Phenolics composition of Licania rigida by HPLC-DAD analysis.
CompoundsLrEELrMFLrEAFLrCFLrAFCalibration CurveRTLOQLOD
mg/g%mg/g%mg/g%mg/g%mg/g%minμg/mLμg/mL
Gallic acid3.41 ± 0.02 a0.345.98 ± 0.01 a0.598.05 ± 0.01 a0.802.81 ± 0.03 a0.281.57 ± 0.01 a0.15Y = 14,063x + 1187.9 (r = 0.9997)12.530.0180.059
Catechin1.57 ± 0.01 b0.153.15 ± 0.03 b0.317.84 ± 0.02 a0.781.35 ± 0.02 b0.132.74 ± 0.01 b0.27Y = 11,964x + 1387.6 (r = 0.9999)15.960.0230.075
Chlorogenic acid15.68 ± 0.01 c1.5614.08 ± 0.02 c1.4039.25 ± 0.02 b3.9217.46 ± 0.01 c1.741.61 ± 0.02 a0.16Y = 12,850x + 1372.5 (r = 0.9993)21.090.0070.023
Caffeic acid13.95 ± 0.01 d1.3916.19 ± 0.01 d1.6131.19 ± 0.01 c3.116.95 ± 0.01 d0.694.83 ± 0.03 c0.48Y = 12,748x + 1240.8 (r = 0.9991)25.010.0340.112
Epicatechin1.30 ± 0.02 b0.132.73 ± 0.01 b0.2714.27 ± 0.03 d1.423.11 ± 0.01 a0.310.92 ± 0.02 d0.09Y = 12,678x + 1329.7 (r = 0.9990)30.760.0150.049
Rutin2.97 ± 0.03 a0.297.39 ± 0.03 e0.7314.63 ± 0.01 d1.46--2.95 ± 0.02 b0.29Y = 12,756x + 1367.1 (r = 0.9996)41.150.0290.095
Quercitrin1.25 ± 0.01 b0.124.52 ± 0.01 f0.4538.94 ± 0.01 b3.894.62 ± 0.01 e0.461.68 ± 0.03 a0.16Y = 12,694x + 1357.4 (r = 0.9993)44.230.0420.138
Isoquercitrin6.13 ± 0.01 e0.617.06 ± 0.02 e0.7013.85 ± 0.02 d1.38--2.53 ± 0.01 b0.25Y = 12,571x + 1358.5 (r = 0.9997)46.370.0310.102
Quercetin3.28 ± 0.02 a0.328.91 ± 0.01 f0.8947.02± 0.01 e4.70--8.37 ± 0.01 e0.83Y = 14,274x + 1341.5 (r = 0.9995)50.020.0080.029
Kaempferol12.65 ± 0.01 f1.2614.57 ± 0.02 c1.3438.61 ± 0.01 b3.86--4.19 ± 0.02 f0.41Y = 13,657x + 1293.8 (r = 0.9999)55.190.0210.069
Kaempferol glycoside5.49 ± 0.01 e0.543.38 ± 0.01 b0.3314.95 ± 0.01 d1.49--1.07 ± 0.01 d0.10-60.27--
Results are expressed as mean ± S.E. of three determinations. Concentrations are expressed as mg of each compound per g of sample and in % (g of each compound per 100 g of sample). LrEE: Licania rigida ethanolic extract; LrMF: L. rigida methanolic fraction; LrEAF: L. rigida ethyl acetate fraction; LrAF, LrCF: L. rigida chloroformic fraction and L. rigida aqueous fraction; LOD: Limit of detection; LOQ: limit of quantification; RT: retention time. Values with different letters differ by Tukey test at p < 0.05.
Table 4. Phenolics composition of Licania tomentosa by HPLC-DAD analysis.
CompoundsLtEELtMFLtEAFLtCFLtAFCalibration CurveRTLOQLOD
mg/g%mg/g%mg/g%mg/g%mg/g%minμg/mLμg/mL
Gallic acid5.17 ± 0.03 a0.516.81 ± 0.01 a0.6824.35 ± 0.01 a2.433.67 ± 0.01 a0.366.93 ± 0.02 a0.69Y = 14,063x + 1187.9 (r = 0.9997)12.530.0180.059
Catechin1.43 ± 0.02 b0.141.54 ± 0.01 b0.157.81 ± 0.03 b0.783.51 ± 0.02 a0.351.34 ± 0.01 b0.13Y = 11,964x + 1387.6 (r = 0.9999)15.960.0230.075
Chlorogenic acid22.38 ± 0.01 c2.2314.63 ± 0.02 c1.4646.59 ± 0.02 c4.6514.38 ± 0.02 b1.433.81 ± 0.02 c0.38Y = 12,850x + 1372.5 (r = 0.9993)21.090.0070.023
Caffeic acid14.90 ± 0.01 d1.495.57 ± 0.03 d0.5542.63 ± 0.01 d4.263.82 ± 0.02 a0.332.67 ± 0.03 d0.26Y = 12,748x + 1240.8 (r = 0.9991)25.010.0340.112
Epicatechin3.25 ± 0.03 e0.321.30 ± 0.01 b0.139.21 ± 0.03 b0.920.59 ± 0.01 c0.052.72 ± 0.02 d0.27Y = 12,678x + 1329.7 (r = 0.9990)31.870.0150.049
Ellagic acid4.61 ± 0.04 a0.462.14 ± 0.02 b0.2131.98 ± 0.01 e3.193.16 ± 0.03 a0.316.83 ± 0.01 a0.68Y = 12,756x + 1367.1 (r = 0.9996)37.260.0110.034
Rutin8.73 ± 0.01 f0.8714.09 ± 0.03 c1.4020.14 ± 0.01 f2.01--7.40 ± 0.02 a0.74Y = 12,694x + 1357.4 (r = 0.9993)43.150.0290.095
Quercitrin3.56 ± 0.01 e0.355.32 ± 0.01 d0.5324.17 ± 0.04 a2.410.24 ± 0.01 c0.025.01 ± 0.03 e0.50Y = 12,571x + 1358.5 (r = 0.9997)45.160.0420.138
Quercetin14.27 ± 0.02 d1.429.76 ± 0.01 e0.9717.54 ± 0.01 a2.75--14.27 ± 0.01 f1.42Y = 14,274x + 1341.5 (r = 0.9995)50.020.0080.029
Kaempferol4.83 ± 0.01 a0.485.41 ± 0.02 d0.542.68 ± 0.01 g0.263.47 ± 0.02 a0.340.89 ± 0.02 g0.08Y = 13,657x + 1293.8 (r = 0.9999)55.190.0210.069
Kaempferol glycoside1.56 ± 0.01 b0.151.70 ± 0.01 b0.178.39 ± 0.01 b0.830.73 ± 0.01 c0.073.15 ± 0.01 d0.31-59.83--
Results are expressed as means ± S.E. of three determinations. Concentrations are expressed as mg of each compound per g of sample and in % (g of each compound per 100 g of sample). LtMF: L. tomentosa methanolic fraction; LtEAF: L. tomentosa ethyl acetate fraction; LtCF: L. tomentosa chloroformic fraction and LtAF: L. tomentosa aqueous fraction; LOD: Limit of detection; LOQ: limit of quantification; RT: retention time. Values with different letters differ by Tukey test with p < 0.05.
Table 5. Antioxidant activities of Licania tomentosa and L. rigida seed extracts and fractions. The scavenging activities were expressed as 50% scavenging concentration (SC50) for the DPPH assay, and as 50% inhibiting concentration (IC50) for the TBARS assay.
SamplesDPPH Assay SC50 (µg/mL)TBARS Assay IC50 (µg/mL)
Without Iron StressWith Iron Stress
LtEE27.14 ± 1.96 b236.07 ± 23.76 d20.71 ± 2.89 b
LtMF26.30 ± 1.86 b105.72 ± 32.53 c8.55 ± 3.97 a
LtEAF248.8 ± 2.95 f86.57 ± 15.97 b1,163.33 ± 115.1 e
LtAF42.68 ± 1.22 cNDND
LrEE174.63 ± 11.40 e144.33 ± 20.36 c286.57 ± 15.05 d
LrMF84.70 ± 4.30 d445.17 ± 46.80 eND
LrEAF9.15 ± 0.03 aND244.17 ± 67.15 d
LrAF38.00 ± 0.883 c60.80 ± 8.94 a153.13 ± 17.65 c
Positive control
Ascorbic Acid10.17 ± 0.74 a
LtEE: L. tomentosa ethanolic extract; LtMF: L. tomentosa methanolic fraction; LtEAF: L. tomentosa ethyl acetate fraction; LtAF: L. tomentosa aqueous fraction; LrEE: L. rigida ethanolic extract; LrMF: L. rigida methanolic fraction; LrEAF: L. rigida ethyl acetate fraction; LrAF: L. rigida aqueous fraction. ND: not determined. a−f Values with different letters at the same column differ significantly (p < 0.05).
Table 6. Partial correlation coefficients between phenolic compounds composition (HPLC) versus antioxidant activities.
Phenolic CompoundsAntioxidant Activities
DPPHTBARS Without IronTBARS With Iron
Phenolic acids−0.410−0.3710.246
Caffeic acid−0.6540.023−0.117
Chlorogenic acid−0.268−0.5520.465
Ellagic acid0.1120.013−0.074
Gallic acid0.001−0.1540.180
Flavonoids0.4100.371−0.246
Catechin0.1090.690−0.664
Epicatechin0.517−0.0680.033
Isoquercitrin−0.5200.262−0.226
Kaempferol−0.4150.0020.027
Kaempferol glucoside−0.5460.235−0.256
Quercetin0.7880.514−0.336
Quercitrin0.745−0.2140.043
Rutin0.436−0.2650.346

