
A Review of Mid-Infrared and Near-Infrared Imaging: Principles, Concepts and Applications in Plant Tissue Analysis


Abstract
:1. Introduction
2. Principles of Mid-IR and Near-IR Imaging/Microspectroscopy
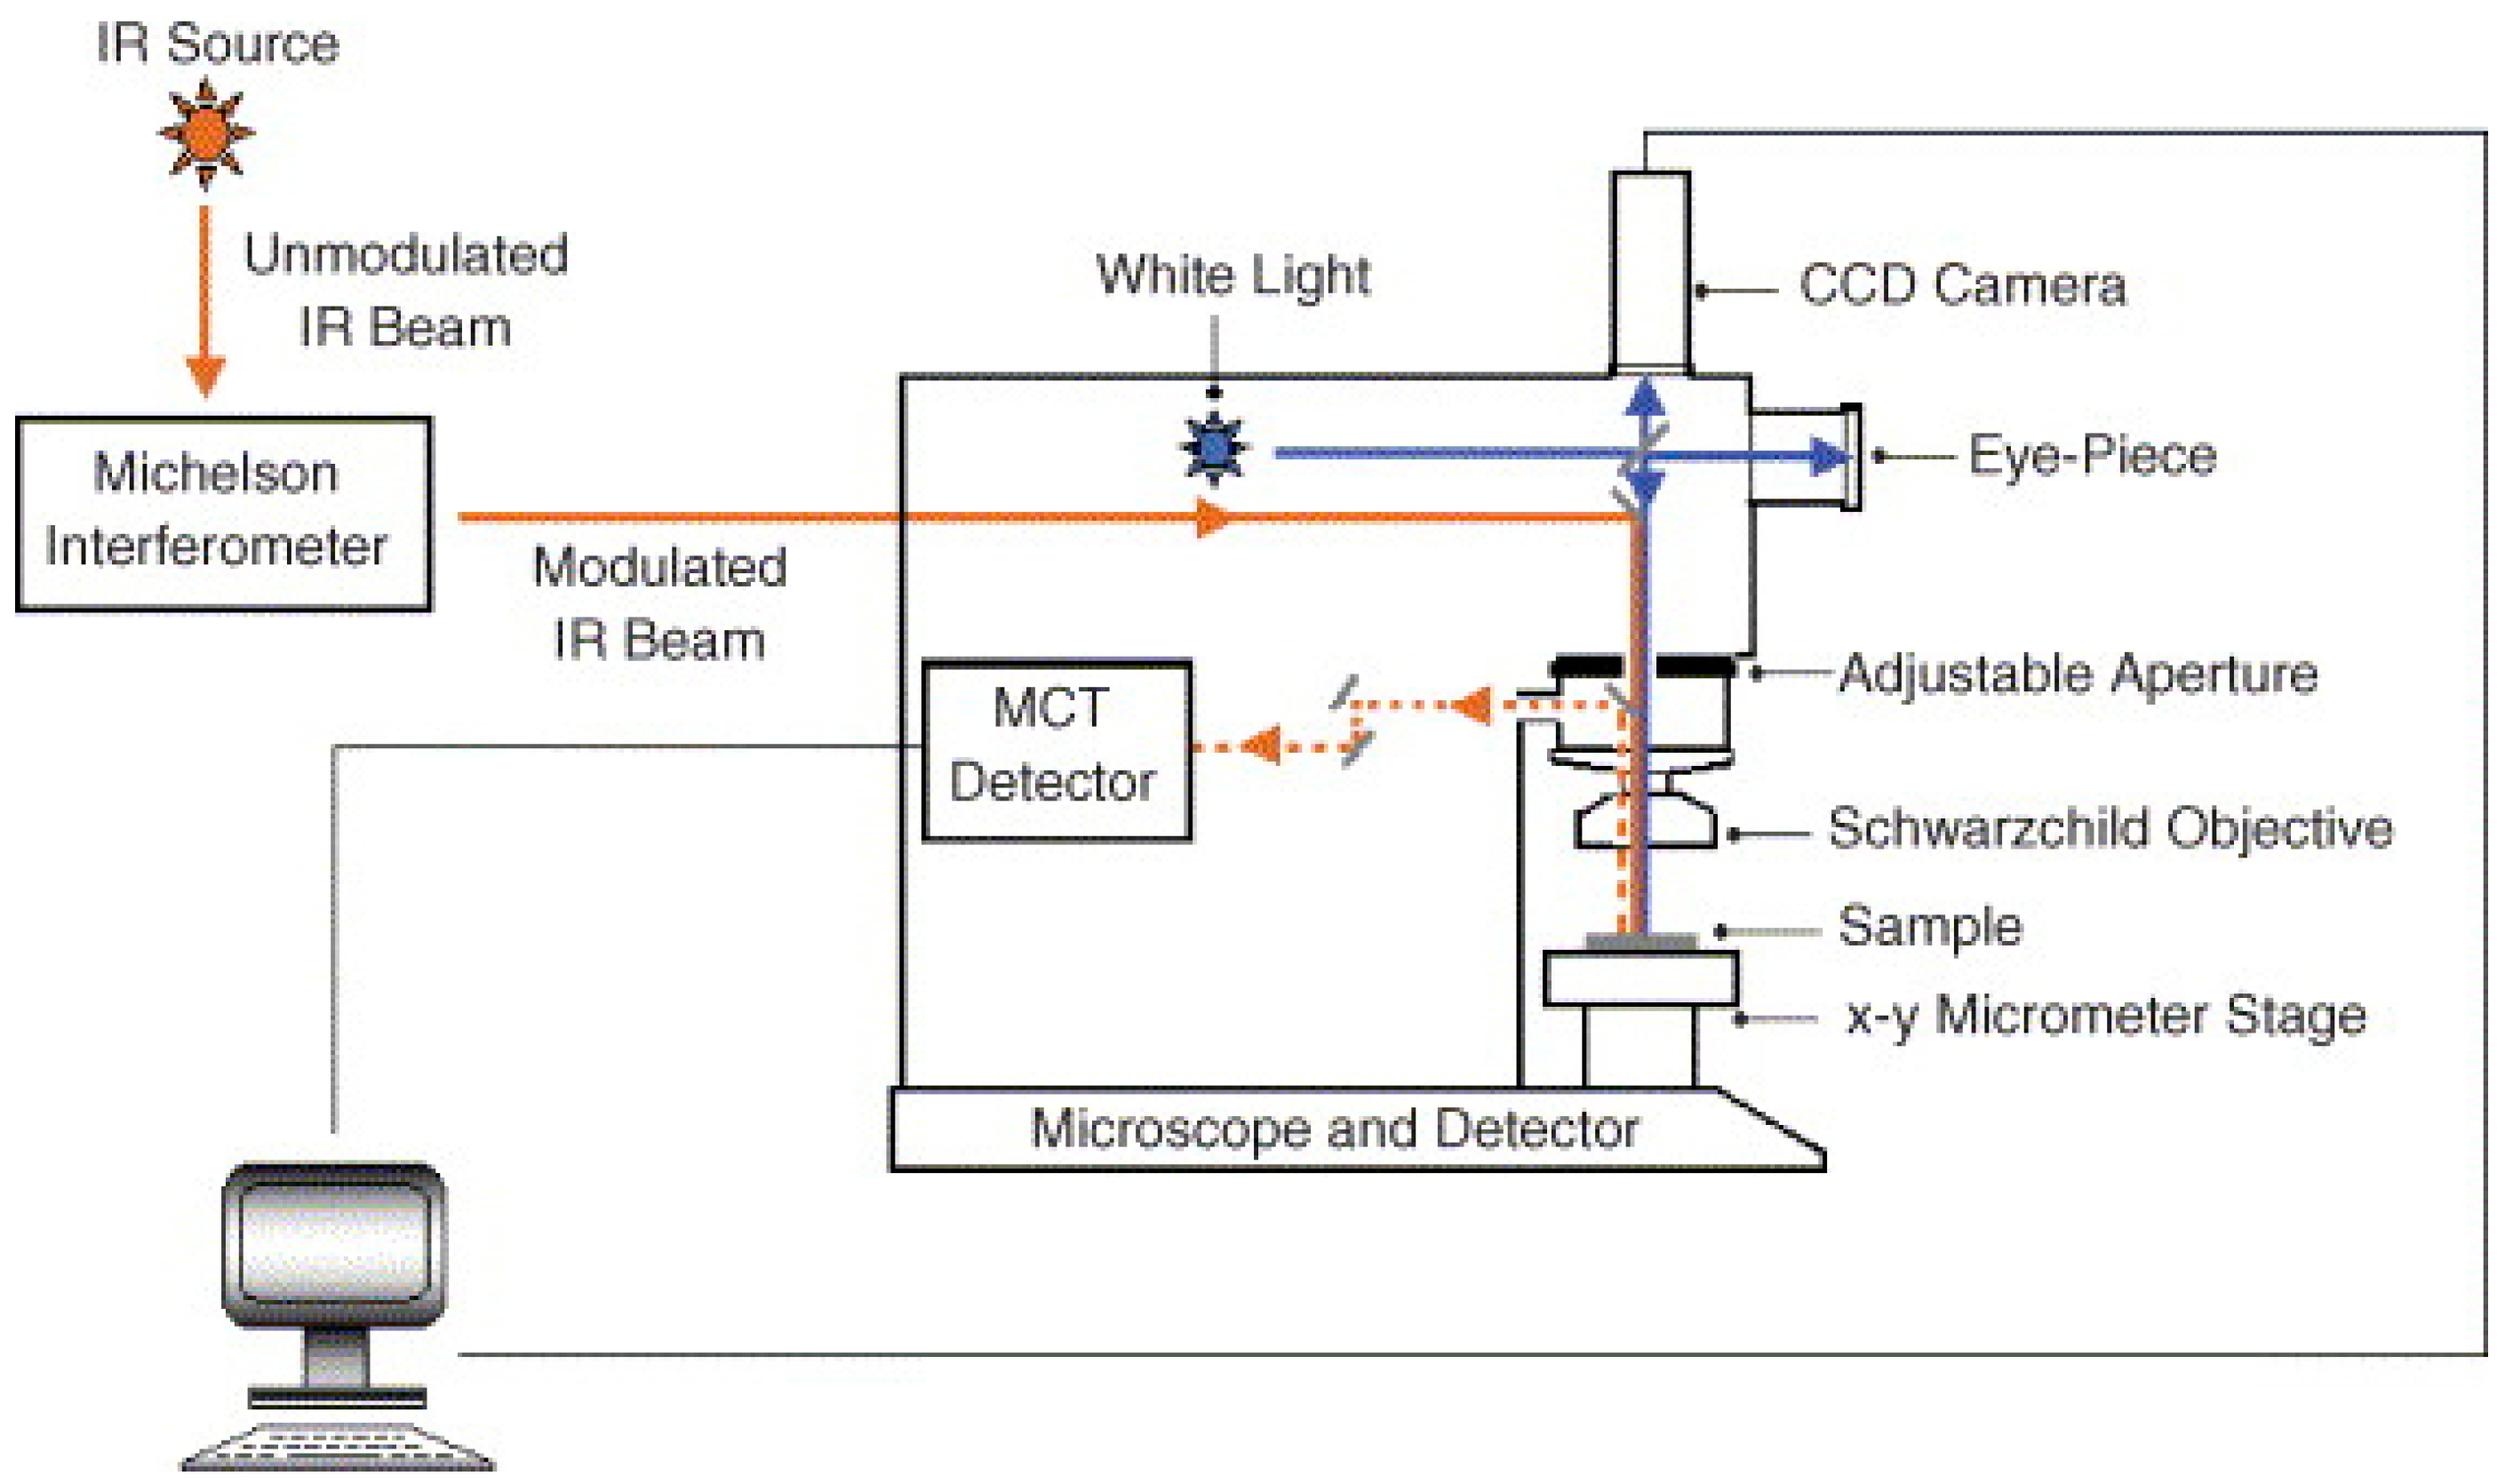
2.1. Instrumentation
- Light source. A single polychromatic thermal source is heated to 1500–2200 K as light source. Silicon-carbide is used in mid-IR and a tungsten filament in near-IR. Here, it should be mentioned that conventional IR thermal sources only provides a spatial resolution of many tens of micrometers, thus restricting the analysis to tissue level [35,36]. In the case of requiring a resolution of better than 10 micrometers, a synchrotron IR source can be implemented due to emitting 100 to 1000 times brighter IR radiation than conventional sources [37]. Hence, an enhanced spatial resolution and a high signal-to-noise ratio by synchrotron imaging bring greater contrast between adjacent pixels as well as the refinement of having smaller pixel size [13,22].
- Splitter. Fourier transforms (FT) interferometers, tunable filters, and diffraction grating spectrometers are three main types used in IR imaging. FT interferometers record information from several wavelengths simultaneously [38] and offer rapid spectral acquisition at high resolution. Filters are used to focus on specific wavelengths and dispense with moving parts in the spectrometer. Tunable filter, as an alternative filter, electronically controls spectral transmission by applying a voltage [39]. The liquid crystal tunable filter is the popular tool for global imaging and mainly used in near-IR hyperspectral imaging. A diffraction grating has a large number of parallel slits separated by a distance comparable to the wavelength of light. Line detectors enable several wavelengths to be acquired at the same time [40]. Narrow slits can reduce the amount of signal reaching the detector whereas large slits might decrease the spectral resolution of the spectrometer. High detector sensitivity and high source intensity in the near-IR range render it suitable for near-IR applications [41].
- Optics. Typically, 6×, 15×, and 32× objectives are implemented in mid-IR or near-IR microscope [43].
2.2. Sampling Techniques
2.3. Sample Preparation
2.4. Measurement
- Point mapping. A regular grid of spatial positions on the sample surface is defined and a spectrum is measured at one position; and as the sample moves to the next measurement point on the grid, the next spectrum is recorded, and this continues for all positions in the area defining the image. Thus, different areas of the sample are consecutively analyzed.
- Line mapping. Spectra are acquired according to predefined spatial positions and the line is moved right to left and up to down to cover the whole area. Subsequently, a series of spectra along one dimension is obtained.
- Area mapping. Depending on the overall mapping size, the sizes of the individually analyzed areas, the spectral resolution and the number of repeated scans, mappings with single element detectors can be time-consuming. With Focal Plane Array (FPA), detectors which enable obtaining a series of spectra collected in two dimensions [54], the required measurement time is reduced. These detectors consist of several thousands of single detector elements which record all spectra at once without the need for moving the sample [55,56].
- Hyperspectral imaging. The images are acquired at wavelengths in the near-IR region. For this measurement, a huge amount of data is collected in a hyper spectral cube where the three axes include two spatial axes and one spectral axis. This can be generated in one of the four ways: a point-to-point spectral scan in a spatial grid pattern; FT imaging; a line-by-line spatial scan (i.e., the push-broom method); and wavelength tuning with filters. In this cube, the sample is compartmented into small surface or volume areas (referred to as pixels) each of them representing a full spectrum. These cubes are mostly displayed as a three-dimensional matrix or data cube spanning two spatial dimensions, x and y. The third dimension z corresponds to the individual wavelength/wavenumber (Figure 4) [57]. The main disadvantages of hyperspectral imaging include it being costly. Data collection and analysis requires sensitive detectors and fast computers, respectively, and substantial data storage capacity is required due to the size of the hyperspectral images [15].
2.5. Quantum Chemical Methods
2.6. Spectral Pre-Processing and Chemometrics
3. Selected Applications of Mid-Infrared and Near-Infrared Imaging on Plant Studies
3.1. Mid-IR Imaging Applications
3.1.1. Identification of Cell Wall Components
3.1.2. Protein Structure Analysis
3.1.3. Tissue and Taxa Differentiation
3.2. Near-IR Imaging Applications
3.2.1. Discrimination of Different Plant Samples
3.2.2. Measurement of Biomolecule Related Parameters
3.2.3. Detection of Bruises and Tissue Damages
3.2.4. Analysis of Firmness of Fruits
3.2.5. Endosperm Texture Determination
3.2.6. Assessment of Plant Development
3.3. Combined Studies
4. Summary and Future Outlook
Acknowledgments
Author Contributions
Conflicts of Interest
References
- Carpita, N.C.; Defernez, M.; Findlay, K.; Wells, B.; Shoue, D.A.; Catchpole, G.; Wilson, R.H.; McCann, M.C. Cell wall architecture of the elongating maize coleoptile. Plant Physiol. 2001, 127, 551–565. [Google Scholar] [CrossRef] [PubMed]
- Barron, C. Prediction of relative tissue proportions in wheat mill streams by Fourier transform mid-infrared spectroscopy. J. Agric. Food Chem. 2011, 59, 10442–10447. [Google Scholar] [CrossRef] [PubMed]
- Li, L.; Zhang, Q.; Huang, D. Review of imaging techniques for plant phenotyping. Sensors 2014, 14, 20078–20111. [Google Scholar] [CrossRef] [PubMed]
- Chen, J.; Sun, S.; Zhou, Q. Chemical morphology of Areca nut characterized directly by Fourier transform near-infrared and mid-infrared microspectroscopic imaging in reflection modes. Food Chem. 2016, 42, 469–475. [Google Scholar] [CrossRef] [PubMed]
- Vijayan, P.; Willick, R.; Lahlali, R.; Karunakaran, C.; Tanino, K.K. Synchrotron radiation sheds fresh light on plant research: The use of powerful techniques to probe structure and composition of plants. Plant Cell Physiol. 2015, 56, 1252–1263. [Google Scholar] [CrossRef] [PubMed]
- Heredia-Guerrero, J.; Benitez, J.; Dominguez, E.; Bayer, I.; Cingolani, R.; Heredia, A. Infrared and raman spectroscopic features of plant cuticles: A review. Front. Plant Sci. 2014, 5, 305–310. [Google Scholar] [CrossRef] [PubMed]
- Chen, J.B.; Sun, S.Q.; Ma, F.; Zhou, Q. Vibrational microspectroscopic identification of powdered traditional medicines: Chemical micromorphology of Poria observed by infrared and Raman microspectroscopy. Spectrochim. Acta Part A Mol. Biomol. Spectrosc. 2014, 128, 629–637. [Google Scholar] [CrossRef] [PubMed]
- Yu, K.; Zhao, Y.; Li, L.; Shao, Y.; Liu, F.; He, Y. Hyperspectral imaging for mapping of total nitrogen spatial distribution in pepper plant. PLoS ONE 2014, 9, e116205. [Google Scholar] [CrossRef] [PubMed]
- Chen, J.B.; Sun, S.Q.; Zhou, Q. Direct observation of bulk and surface chemical morphologies of Ginkgo biloba leaves by Fourier transform mid- and near-infrared microspectroscopic imaging. Anal. Bioanal. Chem. 2013, 405, 9385–9400. [Google Scholar] [CrossRef] [PubMed]
- Huck-Pezzei, V.A.; Pallua, J.D.; Pezzei, C.; Bittner, L.K.; Schoenbichler, S.A.; Abel, G. Fourier transform infrared imaging analysis in discrimination studies of St. John’s wort (Hypericum perforatum). Anal. Bioanal. Chem. 2012, 404, 1771–1778. [Google Scholar] [CrossRef] [PubMed]
- Manley, M.; Williams, P.; Nilsson, D.; Geladi, P. Near infrared hyperspectral imaging for the evaluation of endosperm texture in whole yellow maize. J. Agric. Food Chem. 2009, 57, 8761–8769. [Google Scholar] [CrossRef] [PubMed]
- Williams, P.; Geladi, P.; Fox, G.; Manley, M. Maize kernel hardness classification by near infrared (NIR) hyperspectral imaging and multivariate data analysis. Anal. Chim. Acta 2009, 27, 121–130. [Google Scholar] [CrossRef] [PubMed]
- Dokken, K.; Davis, M. Infrared imaging of sunflower and maize root anatomy. J. Agric. Food Chem. 2007, 55, 10517–10530. [Google Scholar] [CrossRef] [PubMed]
- ElMasry, G.; Wang, N.; ElSayed, A.; Ngadi, M. Hyperspectral imaging for nondestructive determination of some quality attributes for strawberry. J. Food Eng. 2007, 81, 98–103. [Google Scholar] [CrossRef]
- Manley, M. Near-infrared spectroscopy and hyperspectral imaging: Non-destructive analysis of biological materials. Chem. Soc. Rev. 2014, 43, 8200–8205. [Google Scholar] [CrossRef] [PubMed]
- Lin, M.; Al-Holy, M.; Al-Qadiri, H.; Kang, D.H.; Cavinato, A.G.; Huang, Y. Discrimination of intact and injured Listeria monocytogenes by Fourier Transform Infrared Spectroscopy and Principal Component Analysis. J. Agric. Food Chem. 2004, 52, 5769–5772. [Google Scholar] [CrossRef] [PubMed]
- Huck, C.W.; Ozaki, Y.; Verena, A.; Huck, P. Critical Review Upon the Role and Potential of Fluorescence and Near-Infrared Imaging and Absorption Spectroscopy in Cancer Related Cells, Serum, Saliva, Urine and Tissue Analysis. Curr. Med. Chem. 2016, 23, 1–24. [Google Scholar] [CrossRef]
- Cozzolino, D.; Roberts, J. Applications and developments on the use of vibrational spectroscopy imaging for the analysis, monitoring and characterisation of crops and plants. Molecules 2016, 21, 755. [Google Scholar] [CrossRef] [PubMed]
- Huck, C.W. Advances of infrared spectroscopy in natural product research. Phytochem. Lett. 2015, 11, 384–393. [Google Scholar] [CrossRef]
- Esteve Agelet, L.; Hurburgh, C.R., Jr. Limitations and current applications of Near Infrared Spectroscopy for single seed analysis. Talanta 2013, 121, 288–299. [Google Scholar] [CrossRef] [PubMed]
- Sowa, M.; Friesen, J.R.; Levasseur, M.; Schattka, B.; Sigurdsun, L.; Hayakawa, T. The utility of near infrared imaging in intra-operative prediction of flap outcome: A reverse McFarlane skin flap model study. J. Near Infrared Spectrosc. 2012, 20, 601–615. [Google Scholar] [CrossRef]
- Wetzel, D.L. Mid-IR and near-IR chemical imaging: Complementary for biological materials. Vib. Spectrosc. 2012, 60, 29–33. [Google Scholar] [CrossRef]
- Gendrin, C.; Roggo, Y.; Collet, C. Pharmaceutical applications of vibrational chemical imaging and chemometrics: A review. J. Pharm. Biomed. Anal. 2008, 48, 533–553. [Google Scholar] [CrossRef] [PubMed]
- Stuart, B. Infrared Spectroscopy: Fundamentals and Applications; Wiley Press: London, UK, 2004; pp. 29–36. [Google Scholar]
- Theodoridou, K.; Vail, S.; Yu, P. Explore protein molecular structure in endosperm tissues in newly developed black and yellow type canola seeds by using synchrotron-based Fourier transform infrared microspectroscopy. Spectrochim. Acta Part A Mol. Biomol. Spectrosc. 2014, 120, 421–427. [Google Scholar] [CrossRef] [PubMed]
- Kumar, S.; Lahlali, R.; Liu, X.; Karunakaran, C. Infrared spectroscopy combined with imaging: A new developing analytical tool in health and plant science. J Appl. Spectrosc. Rev. 2016, 51, 466–473. [Google Scholar] [CrossRef]
- Xin, H.; Zhang, X.; Yu, P. Using synchroton radiation-based infrared microspectroscopy to reveal microchemical structure characterization: Frost damaged wheat vs. normal wheat. Int. J. Mol. Sci. 2013, 14, 16706–16718. [Google Scholar] [CrossRef] [PubMed]
- Turker, S.; Ilbay, G.; Severcan, M.; Severcan, F. Investigation of compositional, structural, and dynamical changes of pentylenetetrazol-induced seizures on a rat brain by FT-IR spectroscopy. Anal. Chem. 2014, 86, 1395–1403. [Google Scholar] [CrossRef] [PubMed]
- Smith-Moritz, A.M.; Chern, M.; Lao, J.; Sze-To, W.H.; Heazlewood, J.L.; Ronald, P.C. Combining multivariate analysis and monosaccharide composition modeling to identify plant cell wall variations by Fourier transform near infrared spectroscopy. Plant Methods 2011, 7, 26–32. [Google Scholar] [CrossRef] [PubMed]
- Aenugu, H.P.R.; Kumar, D.S.; Parthiban, S.N.; Ghosh, S.; Banji, D. Near Infra-Red Spectroscopy—An Overview. Int. J ChemTech Res. 2011, 3, 825–836. [Google Scholar]
- Siesler, H.W.; Ozaki, Y.; Kawata, S.; Heise, H.M. Near-Infrared Spectroscopy: Principles, Instruments, Applications; Wiley: London, UK, 2008. [Google Scholar]
- Marqués, A.; Martínez-García, M.; Garrigues, M.; Cervera, L.; Guardia, M. Green direct determination of mineral elements in artichokes by infrared spectroscopy and X-ray fluorescence. Food Chem. 2016, 196, 1023–1030. [Google Scholar] [CrossRef] [PubMed]
- Krahmer, A. Analytical methods: Fast and neat-Determination of biochemical quality parameters in cocoa using near infrared spectroscopy. Food Chem. 2015, 181, 152–159. [Google Scholar] [CrossRef] [PubMed]
- Roggo, Y.; Chalus, P.; Maurer, L.; Carmen, L.M.; Edmond, A.; Jent, N. A review of near infrared spectroscopy and chemometrics in pharmaceutical technologies. J. Pharm. Biomed. Anal. 2007, 44, 683–700. [Google Scholar] [CrossRef] [PubMed]
- Bertrand, D.; Dufour, E. La Spectroscopie Infrarouge et Ses Applications Analytiques; Lavoisier: Paris, France, 2006; pp. 247–301. [Google Scholar]
- Carr, G.L. High resolution microspectroscopy and sub-nanosecond time resolved spectroscopy with the synchrotron infrared source. Vib. Spectrosc. 1999, 19, 53–60. [Google Scholar] [CrossRef]
- Duncan, W.D.; Williams, G.P. Infrared synchrotron radiation from electron storage rings. Appl. Opt. 1983, 22, 2914–2923. [Google Scholar] [CrossRef] [PubMed]
- Kidder, L.H.; Haka, A.S.; Lewis, E.N. Instrumentation for FT-IR imaging. In Handbook of Vibrational Spectroscopy; Chalmers, J.M., Griffiths, P.R., Eds.; John Wiley & Sons, Ltd.: Chichester, UK, 2002; pp. 1386–1404. [Google Scholar]
- Wetzel, D.L.; Eilert, A.J.; Sweat, J.A. Tunable filter and discrete filter near-IR spectrometers. In Handbook of Vibrational Spectroscopy; Chalmers, J.M., Griffiths, P.R., Eds.; John Wiley & Sons, Ltd.: Chichester, UK, 2002; pp. 436–452. [Google Scholar]
- Ford, M.; Chalmers, J.M.; Griffiths, P.R. Instrumentation for mid- and far-infrared spectroscopy. In Handbook of Vibrational Spectroscopy; Chalmers, J.M., Griffiths, P.R., Eds.; John Wiley & Sons, Ltd.: Chichester, UK, 2002; pp. 249–253. [Google Scholar]
- De Thomas, F.A.; Brimmer, P.J. Monochromators for near-infrared spectroscopy. In Handbook of Vibrational Spectroscopy; Chalmers, J.M., Griffiths, P.R., Eds.; John Wiley & Sons, Ltd.: Chichester, UK, 2002; pp. 383–392. [Google Scholar]
- Tran, C.D. Infrared multispectral imaging: Principle and instrumentation. Appl. Spectrosc. Rev. 2003, 38, 133–153. [Google Scholar] [CrossRef]
- Sommer, A.J.; Chalmers, J.M. Mid infrared transmission microspectroscopy. In Handbook of Vibrational Spectroscopy; Chalmers, J.M., Griffiths, P.R., Eds.; John Wiley & Sons, Ltd.: Chichester, UK, 2002; pp. 1369–1385. [Google Scholar]
- Fourier Transform Infrared Spectroscopy. Available online: http://students.ycp.edu/~nbirth/Fourier%20Transform%20Infared%20Spectroscopy.htm (accessed on 18 January 2017).
- Mazurek, S.; Mucciolo, A.; Humbel, B.M.; Nawrath, C. Transmission Fourier transform infrared microspectroscopy allows simultaneous assessment of cutin and cell-wall polysaccharides of Arabidopsis petals. Plant J. 2013, 74, 880–891. [Google Scholar] [CrossRef] [PubMed]
- Kazarian, S.G.; Chan, K.L. ATR-FTIR spectroscopic imaging: Recent advances and applications to biological systems. Analyst 2013, 138, 1940–1951. [Google Scholar] [CrossRef] [PubMed]
- Tanino, K.K.; Kobayashi, S.; Hyett, C.; Hamilton, K.; Liu, J.; Li, B. Allium fistulosum as a novel system to investigate mechanisms of freezing resistance. Physiol. Plant. 2013, 147, 101–111. [Google Scholar] [CrossRef] [PubMed]
- Withana-Gamage, T.; Hegedus, D.D.; Qiu, X.; Yu, P.; May, T.; Lydiate, D.; Wanasundara, P.D. Characterization of Arabidopsis thaliana lines with altered seed storage protein profiles using synchrotron-powered FT-IR spectromicroscopy. J. Agric. Food Chem. 2013, 5, 22–29. [Google Scholar] [CrossRef] [PubMed]
- Akhter, M.F.; Omelon, C.; Gordon, R.A.; Moser, D.; Macfie, S.M. Localization and chemical speciation of cadmium in the roots of barley and lettuce. Environ. Exp. Bot. 2014, 100, 10–19. [Google Scholar] [CrossRef]
- Tappero, R.; Peltier, E.; Grafe, M.; Heidel, K.; Ginder-Vogel, M.; Livi, K.J.T. Hyperaccumulator Alyssum murale relies on a different metal storage mechanism for cobalt than for nickel. New Phytol. 2007, 175, 641–654. [Google Scholar] [CrossRef] [PubMed]
- Naftel, S.J.; Martin, R.R.; Macfie, S.M.; Courchesne, F.; Séguin, V. An investigation of metals at the soil/root interface using synchrotron radiation analysis. Can. J. Anal. Sci. Spectrosc. 2007, 52, 18–24. [Google Scholar]
- Pallua, J.D.; Recheis, W.; Pöder, R.; Pfaller, K.; Pezzei, C.; Hahn, H.; Huck-Pezzei, V.; Bittner, L.L.; Schaefer, G.; Steiner, E.; et al. Morphological and tissue characterization of the medicinal fungus Hericium coralloides by a structural and molecular imaging platform. Analyst 2012, 137, 1584–1595. [Google Scholar] [CrossRef] [PubMed]
- Miller, L.M.; Dumas, P. Chemical imaging of biological tissue with synchrotron infrared light. Biochim. Biophys. Acta 2006, 1758, 846–857. [Google Scholar] [CrossRef] [PubMed]
- Heraud, P.; Beardall, J.; McNaughton, D.; Bayden, R. In vivo prediction of the nutrient status of individual microalgal cells using Raman microspectroscopy. FEMS Microbiol. Lett. 2007, 275, 24–30. [Google Scholar] [CrossRef] [PubMed]
- Treado, P.J.; Nelson, M.P.; Chalmers, J.M.; Griffiths, P.R. Mid and Near Infrared Transmission Spectroscopy. In Handbook of Vibrational Spectroscopy; Chalmers, J.M., Griffiths, P.R., Eds.; John Wiley & Sons: Chichester, UK, 2002; pp. 1429–1459. [Google Scholar]
- Huck, C.; Huck-Pezzei, V. Infrared Spectroscopic Technologies for the Quality Control of Medicinal Herbs. In Recent Progress in Medicinal Plants; LLC: Memphis, TN, USA, 2014; Volume 41, Analytical and Processing Techniques; pp. 1–19. [Google Scholar]
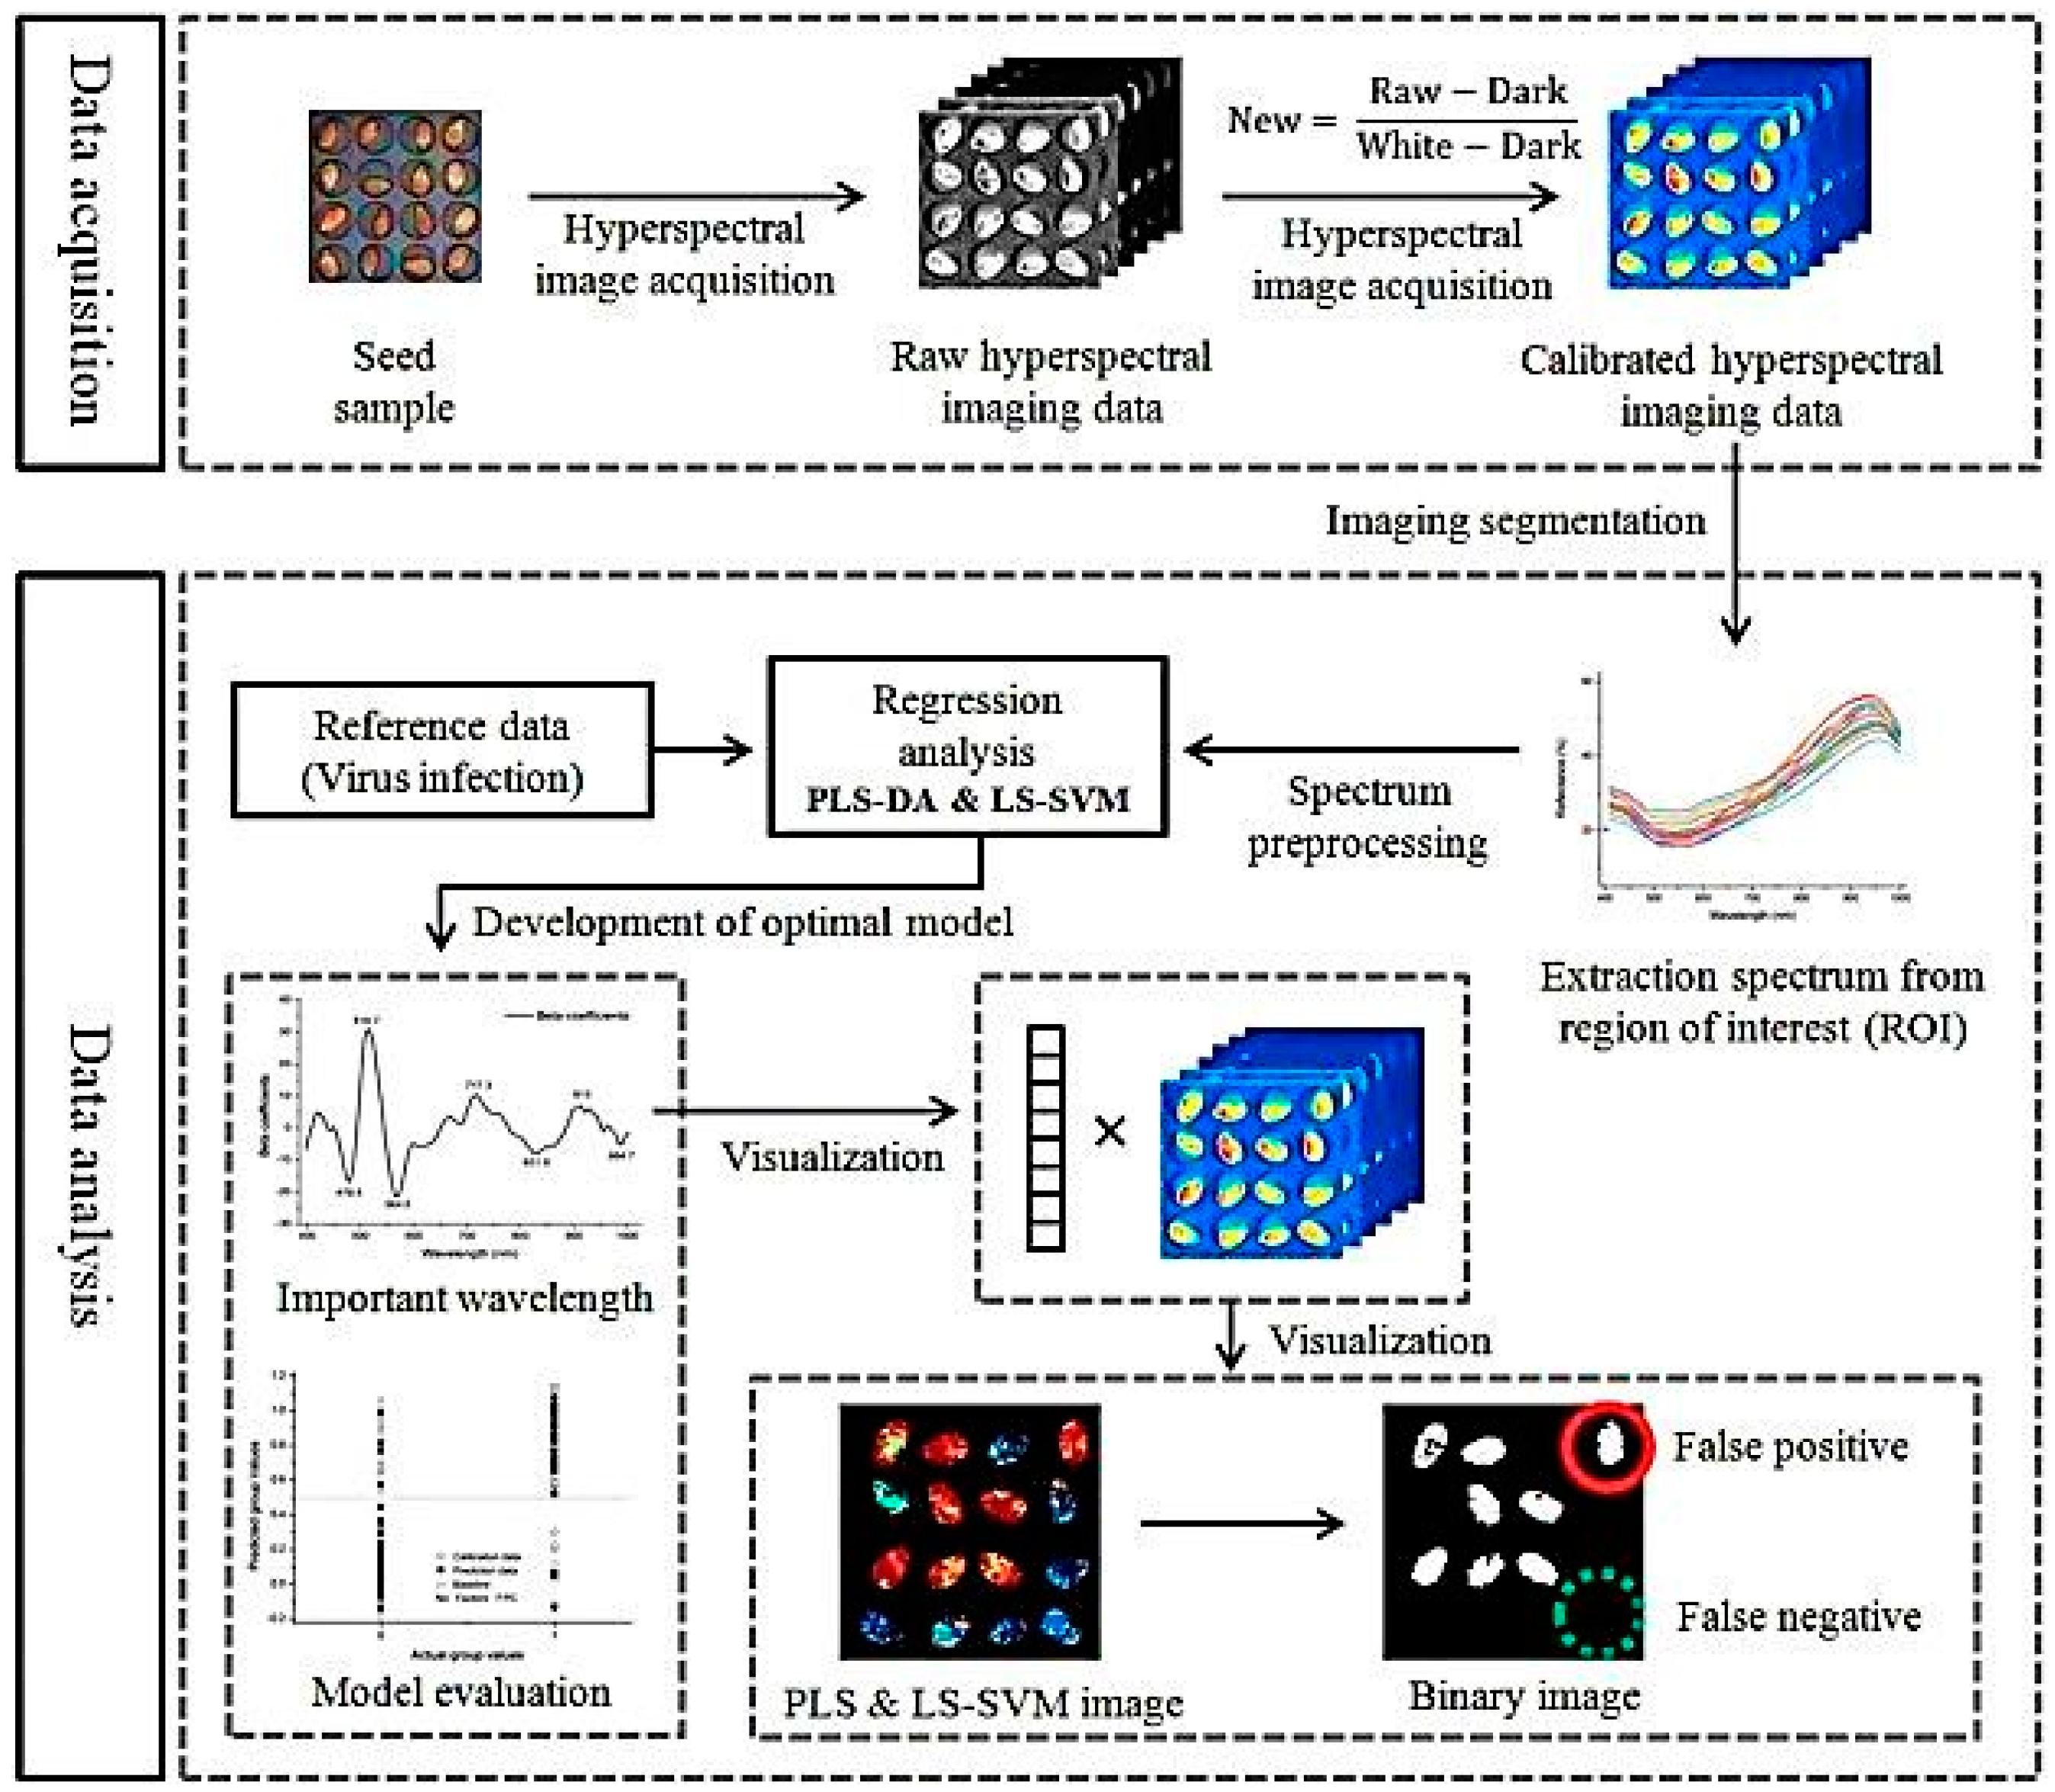
- Lee, M.; Kim, M.S.; Lim, H.; Park, E.; Lee, W.; Cho, B. Detection of cucumber green mottle mosaic virus-infected watermelon seeds using a near-infrared (NIR) hyperspectral imaging system: Application to seeds of the “Sambok Honey” cultivars. Biosyst. Eng. 2016, 148, 138–147. [Google Scholar] [CrossRef]
- Krzysztof, B.; Grabska, J.; Huck, C.; Ozaki, Y.; Hawranek, J.P. Computational and quantum chemical study on high-frequency dielectric function of tert-butylmethyl ether in mid-infrared and near-infrared regions. J Mol. Lipids 2016, 224, 1189–1198. [Google Scholar]
- Barone, V. Anharmonic vibrational properties by a fully automated second-order perturbative approach. J. Chem. Phys. 2005, 122, 014108. [Google Scholar] [CrossRef] [PubMed]
- Bloino, J.; Biczysko, M.; Barone, V. General perturbative approach for spectroscopy, thermodynamics, and kinetics: Methodological background and benchmark studies. J. Chem. Theory Comput. 2012, 8, 1015–1036. [Google Scholar] [CrossRef] [PubMed]
- Lutz, M.; Rode, B.; Bonn, G.; Huck, C. Largely reduced grid densities in a vibrational self-consistent field treatment do not significantly impact the resulting wavenumbers. Molecules 2014, 19, 21253–21275. [Google Scholar] [CrossRef] [PubMed]
- Lutz, M.; Messner, C.; Hofer, T.; Canaval, L.; Bonn, G.; Huck, C. Computational vibrational spectroscopy of glycine in aqueous solution—Fundamental considerations towards feasible methodolies. Chem. Phys. 2014, 435, 21–28. [Google Scholar] [CrossRef]
- Kirchler, C.; Pezzei, C.; Beć, K.; Mayr, S.; Ishigaki, M.; Ozaki, Y.; Huck, C. Critical evaluation of spectral information of benchtop vs. portable near-infrared spectrometers: Quantum chemistry and two dimensional correlation spectroscopy for a better understanding of PLS regression models of the rosmarinic acid content in Rosmarini folium. Analyst 2016. [Google Scholar] [CrossRef]
- Massart, D.L.; Vandeginste, B.G.M.; Smeyers-Verbeke, J. Handbook of Chemometrics and Qualimetrics: Part A; Elsevier: Amsterdam, The Netherlands, 2014. [Google Scholar]
- Norris, K.H. Extraction information from spectrophotometric curves. Predicting chemical composition from visible and near-infrared spectra. In Food Research and Data Analysis; Materns, H., Russwurm, H., Jr., Eds.; Applied Science: London, UK, 1983; pp. 95–114. [Google Scholar]
- Jiang, J.H.; Liang, Y. Principles and methodologies in self-modelling curve resolution. Chemom. Intell. Lab. Syst. 2004, 71, 1–12. [Google Scholar] [CrossRef]
- Cook, D.; Zhan, X. Algorithms for envelope estimation. J. Comput. Graph. Stat. 2014, 5, 45–81. [Google Scholar] [CrossRef]
- Brereton, R.G. Chemometrics Data Analysis for the Laboratory and Chemical Plant; John Wiley & Sons: Chichester, UK, 2003. [Google Scholar]
- McCann, M.; Chen, L.; Roberts, K.; Kemsley, E.K.; Sene, C.; Carpita, C.; Stacey, N.J.; Wilson, R. Infrared microspectroscopy: Sampling heterogeneity in plant cell wall composition and architecture. Physiol. Plant. 1997, 100, 729–738. [Google Scholar] [CrossRef]
- Stewart, D. Fourier transform infrared microspectroscopy of plant tissues. Appl. Spectrosc. 1996, 50, 357–365. [Google Scholar] [CrossRef]
- Barron, C.; Parker, M.L.; Mills, E.N.C. FTIR imaging of wheat endosperm cell walls in situ reveals compositional and architectural heterogeneity related to grain hardness. Planta 2005, 220, 667–673. [Google Scholar] [CrossRef] [PubMed]
- Saulnier, L.; Robert, P.; Grintchenko, M.; Jamme, F.; Bouchet, B.; Guillon, F. Wheat endosperm cell walls: Spatial heterogeneity of polysaccharide structure and composition using micro-scale enzymatic fingerprinting and FT-IR microspectroscopy. J. Cereal Sci. 2009, 50, 312–317. [Google Scholar] [CrossRef]
- Zhong, R.; Lee, C.; McCarthy, R.L.; Reeves, C.K.; Jones, E.G.; Ye, Z.H. Transcriptional activation of secondary wall biosynthesis by rice and maize NAC and MYB transcription factors. Plant Cell Physiol. 2011, 52, 1856–1871. [Google Scholar] [CrossRef] [PubMed]
- Jiang, B.; Shen, Z.; Shen, J.; Yu, D.; Sheng, X.; Lu, H. Germination and growth of spong grourd (Luffa cylindrica). Sci. Hortic. 2009, 122, 638–644. [Google Scholar] [CrossRef]
- Pesquet, E.; Zhang, B.; Gorzsás, A.; Puhakainen, T.; Serk, H.; Escamez, S. Non-cell-autonomous postmortem lignification of tracheary elements in Zinnia elegans. Plant Cell 2013, 2, 1314–1328. [Google Scholar] [CrossRef] [PubMed]
- Gorzsas, A.; Stenlund, H.; Persson, P.; Trygg, J.; Sundberg, B. Cell-specific chemotyping and multivariate imaging by combined FT-IR microspectroscopy and orthogonal projections to latent structures analysis reveals the chemical landscape of secondary xylem. Plant J. 2011, 66, 903–914. [Google Scholar] [CrossRef] [PubMed]
- Gou, J.Y.; Park, S.; Yu, X.H. Compositional characterization and imaging of “wall-bound” acylesters of Populus trichocarpa reveal differential accumulation of acyl molecules in normal and reactive woods. Planta 2008, 229, 15–21. [Google Scholar] [CrossRef] [PubMed]
- Monti, F.; Dell’Anna, R.; Sanson, A.; Fasoli, M.; Pezzotti, M.; Zenoni, S. A multivariate statistical analysis approach to highlight molecular processes in plant cell walls through ATR FT-IR microspectroscopy: The role of the α-expansin PhEXPA1 in Petunia hybrid. Vib. Spectrosc. 2013, 65, 36–43. [Google Scholar] [CrossRef]
- Fackler, K.; Stevanic, J.; Ters, T.; Hinterstoisser, B.; Schwanninger, M.; Salmen, L. Localization and characterisation of incipient brown-rot decay within spruce wood cell walls using FT-IR imaging microscopy. Enzym. Microb. Technol. 2010, 8, 257–267. [Google Scholar] [CrossRef] [PubMed]
- Yu, P.; Jonker, A.; Gruber, M. Molecular basis of protein structure in proanthocyanidin and anthocyanin-enhanced Lc-transgenic alfalfa in relation to nutritive value using synchrotron-radiation FTIR microspectroscopy: A novel approach. Spectrochim. Acta A Mol. Biomol. Spectrosc. 2009, 73, 846–853. [Google Scholar] [CrossRef] [PubMed]
- Emily, S.; Bonwell, E.; Fisher, T.; Fritz, A.; Wetzel, D. Determination of endosperm protein secondary structure in hard wheat breeding lines using synchrotron infrared microspectroscopy. Vib. Spectrosc. 2008, 48, 76–81. [Google Scholar]
- Yu, P. Molecular chemical structure of barley proteins revealed by ultra-spatially resolved synchrotron light sourced FTIR microspectroscopy: Comparison of barley varieties. Biopolymers 2006, 85, 308–317. [Google Scholar] [CrossRef] [PubMed]
- Yu, P. Application of advanced synchrotron radiation-based Fourier transform infrared (SR-FTIR) microspectroscopy to animal nutrition and feed science: A novel approach. Br. J. Nutr. 2004, 92, 869–885. [Google Scholar] [CrossRef] [PubMed]
- Yu, P.; Block, H.C.; Doiron, K. Understanding the differences in molecular conformation of carbohydrate and protein in endosperm tissues of grains with different biodegradation kinetics using advanced synchrotron technology. Spectrochim. Acta A Mol. Biomol. Spectrosc. 2009, 71, 1837–1849. [Google Scholar] [CrossRef] [PubMed]
- Dell’Anna, R.; Lazzeri, P.; Frisanco, M.; Monti, F.; Malvezzi, C.; Gottardini, E.; Bersani, S. Pollen discrimination and classification by Fourier transform infrared (FT-IR) microspectroscopy and machine learning. Anal. Bioanal. Chem. 2009, 394, 1443–1452. [Google Scholar] [CrossRef] [PubMed]
- Vermaak, I.; Viljoen, A.; Lindström, S.W. Hyperspectral imaging in the quality control of herbal medicines—The case of neurotoxic Japanese star anise. J. Pharm. Biomed. Anal. 2013, 5, 207–213. [Google Scholar] [CrossRef] [PubMed]
- Kong, W.; Zhang, C.; Liu, F.; Nie, P.; He, Y. Rice seed cultivar identification using near-infrared hyperspectral imaging and multivariate data analysis. Sensors 2013, 13, 8916–8927. [Google Scholar] [CrossRef] [PubMed]
- Liu, D.; Guo, W. Identification of kiwifruits treated with exogenous Plant Growth Regulator Using Near-Infrared Hyperspectral Reflectance Imaging. Food Anal. Methods 2015, 8, 164–172. [Google Scholar] [CrossRef]
- Wang, W.; Ni, X.; Lawrence, K.C.; Yoon, S.; Heitschmidt, G.; Feldner, P. Feasibility of detecting Aflatoxin B1 in single maize kernels using hyperspectral imaging. J. Food Eng. 2015, 166, 182–192. [Google Scholar] [CrossRef]
- Schmilovitch, Z.; Ignat, T.; Alchanatis, V.; Gatker, J.; Ostrovsky, V.; Felfo, J. Hyperspectral imaging of intact bell peppers. Biosyst. Eng. 2014, 83, 93–100. [Google Scholar] [CrossRef]
- Hernández-Hierro, J.M.; Esquerre, C.; Valverde, J.; Villacreces, S.; Reilly, K.; Gaffney, M.; Lourdes, M.; Miret, G.; Heredia, F.; O’Donnell, P.; et al. Preliminary study on the use of near infrared hyperspectral imaging for quantitation and localisation of total glucosinolates in freeze-dried Broccoli. J. Food Eng. 2014, 126, 107–112. [Google Scholar] [CrossRef] [Green Version]
- Shi, J.-Y.; Zou, X.-B.; Zhao, J.-W.; Wang, K.-L.; Chen, Z.-W.; Huang, X.-W.; Zhang, D.-T.; Mel, H. Nondestructive diagnostics of nitrogen deficiency by cucumber leaf chlorophyll distribution map based on near infrared hyperspectral imaging. Sci. Hortic. 2012, 138, 190–197. [Google Scholar]
- Liu, C.; Liu, W.; Chen, W.; Yang, J.; Zheng, L. Feasibility in multispectral imaging for predicting the content of bioactive compounds in intact tomato fruit. Food Chem. 2015, 173, 482–488. [Google Scholar] [CrossRef] [PubMed]
- Lee, W.; Kim, W.; Lee, H.; Delwiche, S.R.; Bae, H.; Kim, D.; Cho, K. Hyperspectral near-infrared imaging for the detection of physical damages of pear. J. Food Eng. 2014, 130, 1–7. [Google Scholar] [CrossRef]
- Namyan, Y.; Choudhary, R.; Gupta, L.; Paliwal, J. A decision-fusion strategy for fruit quality inspection using hyperspectral imaging. Biosyst. Eng. 2012, 111, 118–125. [Google Scholar] [CrossRef]
- Singh, C.B.; Jayas, D.S.; Paliwal, J.; White, N.D.G. Detection of sprouted and midge-damaged wheat kernels using near-infrared hyperspectral imaging. Cereal Chem. 2009, 86, 256–260. [Google Scholar] [CrossRef]
- Nicolai, B.; Lotze, E.; Peirs, A.; Scheerlink, N.; Theron, K. Non-destructive measurement of bitter pit in apple fruit using NIR hyperspectral imaging. Postharvest Biol. Technol. 2006, 40, 1–6. [Google Scholar] [CrossRef]
- Li, J.; Huang, W.; Tian, X.; Wang, C.; Fan, S.; Zhao, C. Fast detection and visualization of early decay in citrus using Vis-NIR hyperspectral imaging. Comput. Electron. Agric. 2016, 127, 582–592. [Google Scholar] [CrossRef]
- Lu, R.; Peng, Y. Assessing peach firmness by multi-spectral scattering. J. Near Infrared Spectrosc. 2005, 13, 27–36. [Google Scholar] [CrossRef]
- Sun, R.; Künnemeyer, R.; McGlone, A.; Rowe, P. Multispectral scattering imaging and NIR interactance for apple firmness predictions. Postharvest Biol. Technol. 2016, 119, 58–68. [Google Scholar] [CrossRef]
- Kandpala, M.; Lohumia, S.; Kimb, M.S.; Kang, S.; Choa, B. Near-infrared hyperspectral imaging system coupled with multivariate methods to predict viability and vigor in muskmelon seeds. Sens. Actuators B 2016, 229, 534–544. [Google Scholar] [CrossRef]


| Frequency (cm−1) | Definition of the Spectral Assignments |
|---|---|
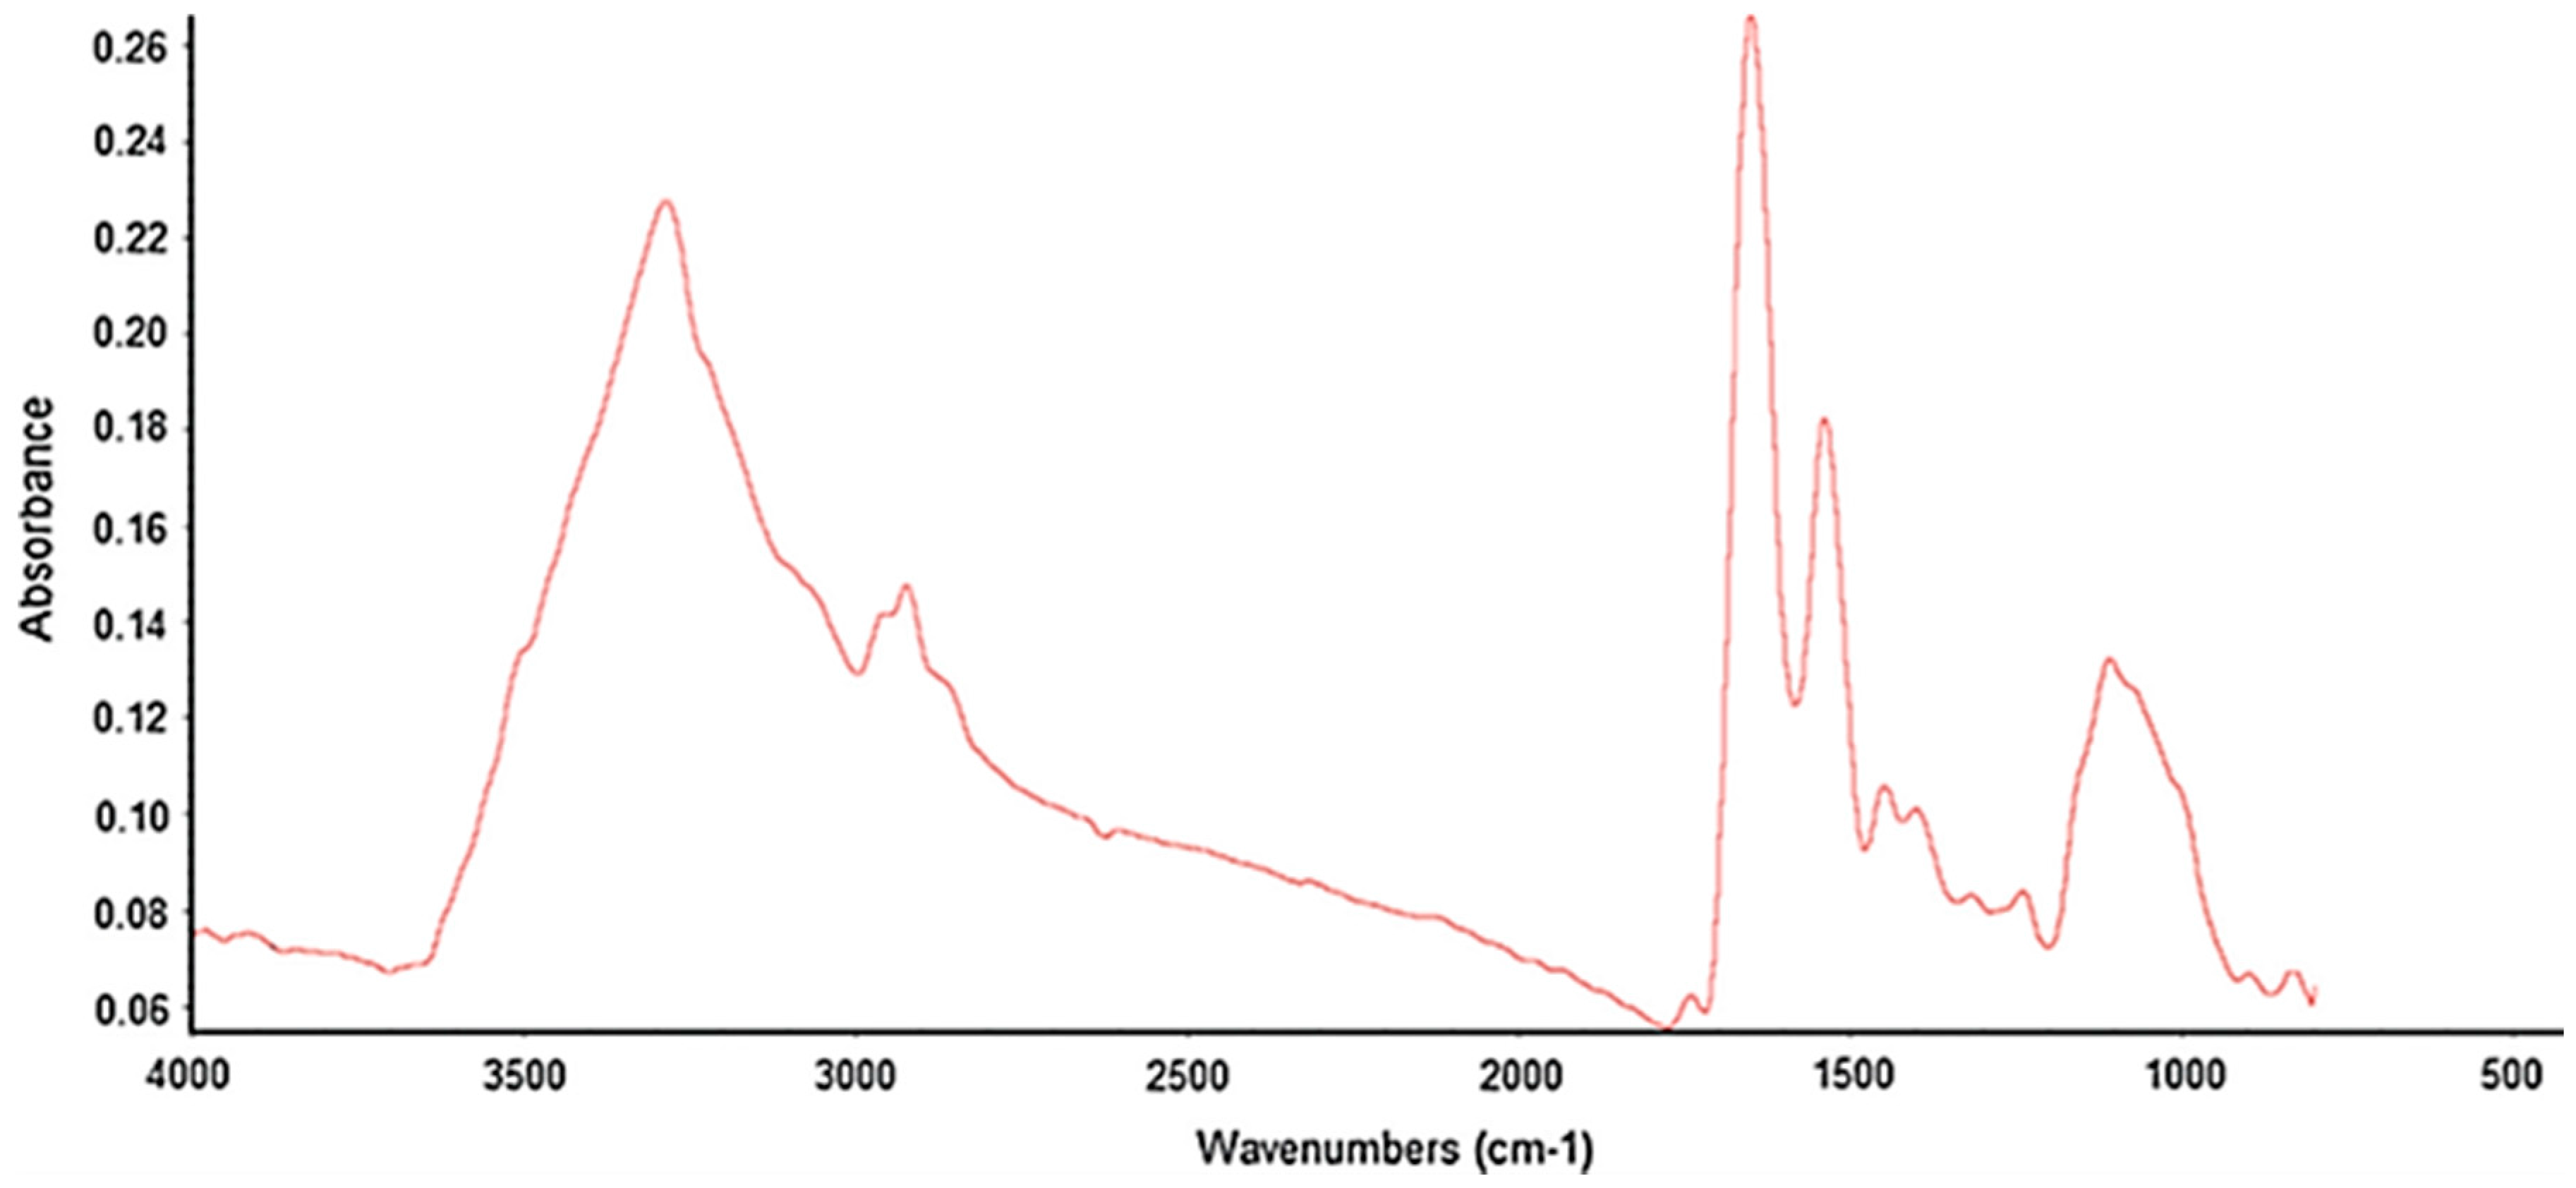
| 3500−3200 | O-H and N-H stretch: carbohydrates, proteins, alcohols and phenolic compounds |
| 2960−2950 | CH3 asymmetric stretching: mainly lipid with a little contribution from protein, carbohydrate, and nucleic acid |
| 2930−2920 | CH2 asymmetric stretch: mainly lipid with a little contribution from protein, carbohydrate, and nucleic acid |
| 2875−2870 | CH3 symmetric stretch: mainly protein with a little contribution from lipid, carbohydrate, and nucleic acid |
| 2860−2840 | CH2 symmetric stretch: mainly lipids with a little contribution from protein, carbohydrate, and nucleic acid |
| 1745−1730 | Saturated ester C=O stretch: phospholipid, cholesterol ester, hemicellulose, pectin, lignin, suberin/cutin esters |
| 1650−1630 | Amide I (C=O stretch): protein, pectin, water associated cellulose or lignin, alkaloids |
| 1630−1620 | C=C stretch: phenolic compound |
| 1610−1590 | C=O aromatic stretch: lignin, alkaloid |
| 1560−1540 | Amide II (C=N and N–H stretch): mainly protein |
| 1515−1505 | C=C aromatic stretch: lignin |
| 1460−1455 | Amide III (aromatic hydrocarbons): mainly protein |
| 1455−1440 | C–H asym bending of CH2 and CH3: cell wall polysaccharide, lipid and protein |
| 1430−1420 | O–H bend: cell wall polysaccaride, alcohol, and carboxylic acid |
| 1380−1370 | C–H sym bending of CH2 and CH3: cell wall polysaccharide, lipid and protein |
| 1375−1365 | C–H bend: cellulose and hemicellulose |
| 1250−1240 | C=O stretch: pectic substances, lignin, hemicellulose, suberin/cutin esters |
| 1235 | Amide IV (C=N and N–H stretching): mainly protein |
| 1235−1230 | C–O stretch: lignin, xylan |
| 1205−1200 | O–H in plane bend: cellulose |
| 1170−1160 | C–O–C asym stretch: cutin |
| 1160−1150 | Symmetric bonding of aliphatic CH2, OH, or C–O stretch of various groups: cell wall polysaccaride |
| 1145−1140 | C–O–C asym stretch: cellulose (β-1.4 glucan) |
| 1110−1105 | C–O–C sym stretch: cutin |
| 1105−1100 | Antisymmetric in-phase: pectic substance |
| 1085−1075 | C–O deformation: secondary alcohol, aliphatic ester |
| 1075−1070 | C–O ring stretch: rhamnogalactorunan, b-galactan |
| 1065−1060 | C–O stretch: cell wall polysaccarides (glucomannan) |
| 1045−1030 | O–H and C–OH stretch: cell wall polysaccarides (arabinan, cellulose) |
| 990−980 | C–O stretch: cutin |
| 900−890 | C–H deformation: arabinan |
| 895−890 | C–O valence vibration: galactan |
| 875−870 | C–O stretch: β–d-fructose |
| Wavenumber (cm−1) | Wavelengths (nm) | Definition of the Spectral Assignments |
|---|---|---|
| 8403 | 1190 | C–H str. first overtone: carbohydrates |
| 8251 | 1212 | C–H str. second overtone: carbohydrates |
| 7375 | 1356 | 2 C–H str. + C–H def.: carbohydrates |
| 7168 | 1395 | 2 C–H str. + C–H def.: carbohydrates |
| 6983 | 1432 | N–H str. second overtone: proteins |
| 6748 | 1482 | O–H str. first overtone: carbohydrates |
| 6662 | 1501 | N–H str. first overtone: carbohydrates |
| 6494 | 1540 | O–H str. first overtone (intermol. H-bond): starch |
| 6394 | 1564 | N–H str. first overtone: proteins |
| 6196 | 1614 | C–H str. first overtone: carbohydrates |
| 6053 | 1652 | C–H str. first overtone: carbohydrates |
| 5896 | 1696 | C–H str. first overtone: carbohydrates |
| 5627 | 1777 | C–H str. first overtone: plant fiber composed of cellulose, lignin and other carbohydrates |
| 5507 | 1816 | O–H str. + 2 C–O str.: plant fiber composed of cellulose, lignin and other carbohydrates |
| 5120 | 1953 | C–O str. second overtone: carbohydrates |
| 4878 | 2050 | N–H sym. str. + amide II: proteins |
| 4824 | 2073 | O–H str. + O–H def.: alcohols |
| 4643 | 2154 | Amide I + amide III: proteins |
| 4439 | 2253 | O–H str. + O–H def.: starch |
| 4363 | 2292 | N–H str. + CO str.: proteins |
© 2017 by the authors. Licensee MDPI, Basel, Switzerland. This article is an open access article distributed under the terms and conditions of the Creative Commons Attribution (CC BY) license ( http://creativecommons.org/licenses/by/4.0/).
Share and Cite
Türker-Kaya, S.; Huck, C.W. A Review of Mid-Infrared and Near-Infrared Imaging: Principles, Concepts and Applications in Plant Tissue Analysis. Molecules 2017, 22, 168. https://0-doi-org.brum.beds.ac.uk/10.3390/molecules22010168
Türker-Kaya S, Huck CW. A Review of Mid-Infrared and Near-Infrared Imaging: Principles, Concepts and Applications in Plant Tissue Analysis. Molecules. 2017; 22(1):168. https://0-doi-org.brum.beds.ac.uk/10.3390/molecules22010168
Chicago/Turabian StyleTürker-Kaya, Sevgi, and Christian W. Huck. 2017. "A Review of Mid-Infrared and Near-Infrared Imaging: Principles, Concepts and Applications in Plant Tissue Analysis" Molecules 22, no. 1: 168. https://0-doi-org.brum.beds.ac.uk/10.3390/molecules22010168