Complex Enzyme-Assisted Extraction Releases Antioxidative Phenolic Compositions from Guava Leaves

School of Biology and Biological Engineering, South China University of Technology, Guangzhou 510006, China
*
Author to whom correspondence should be addressed.
Molecules 2017, 22(10), 1648; https://0-doi-org.brum.beds.ac.uk/10.3390/molecules22101648
Submission received: 13 September 2017
/
Revised: 26 September 2017
/
Accepted: 26 September 2017
/
Published: 30 September 2017
(This article belongs to the Special Issue Green Extraction of Natural Product: Innovative Techniques, Alternative Solvents and Original Procedures)
Abstract
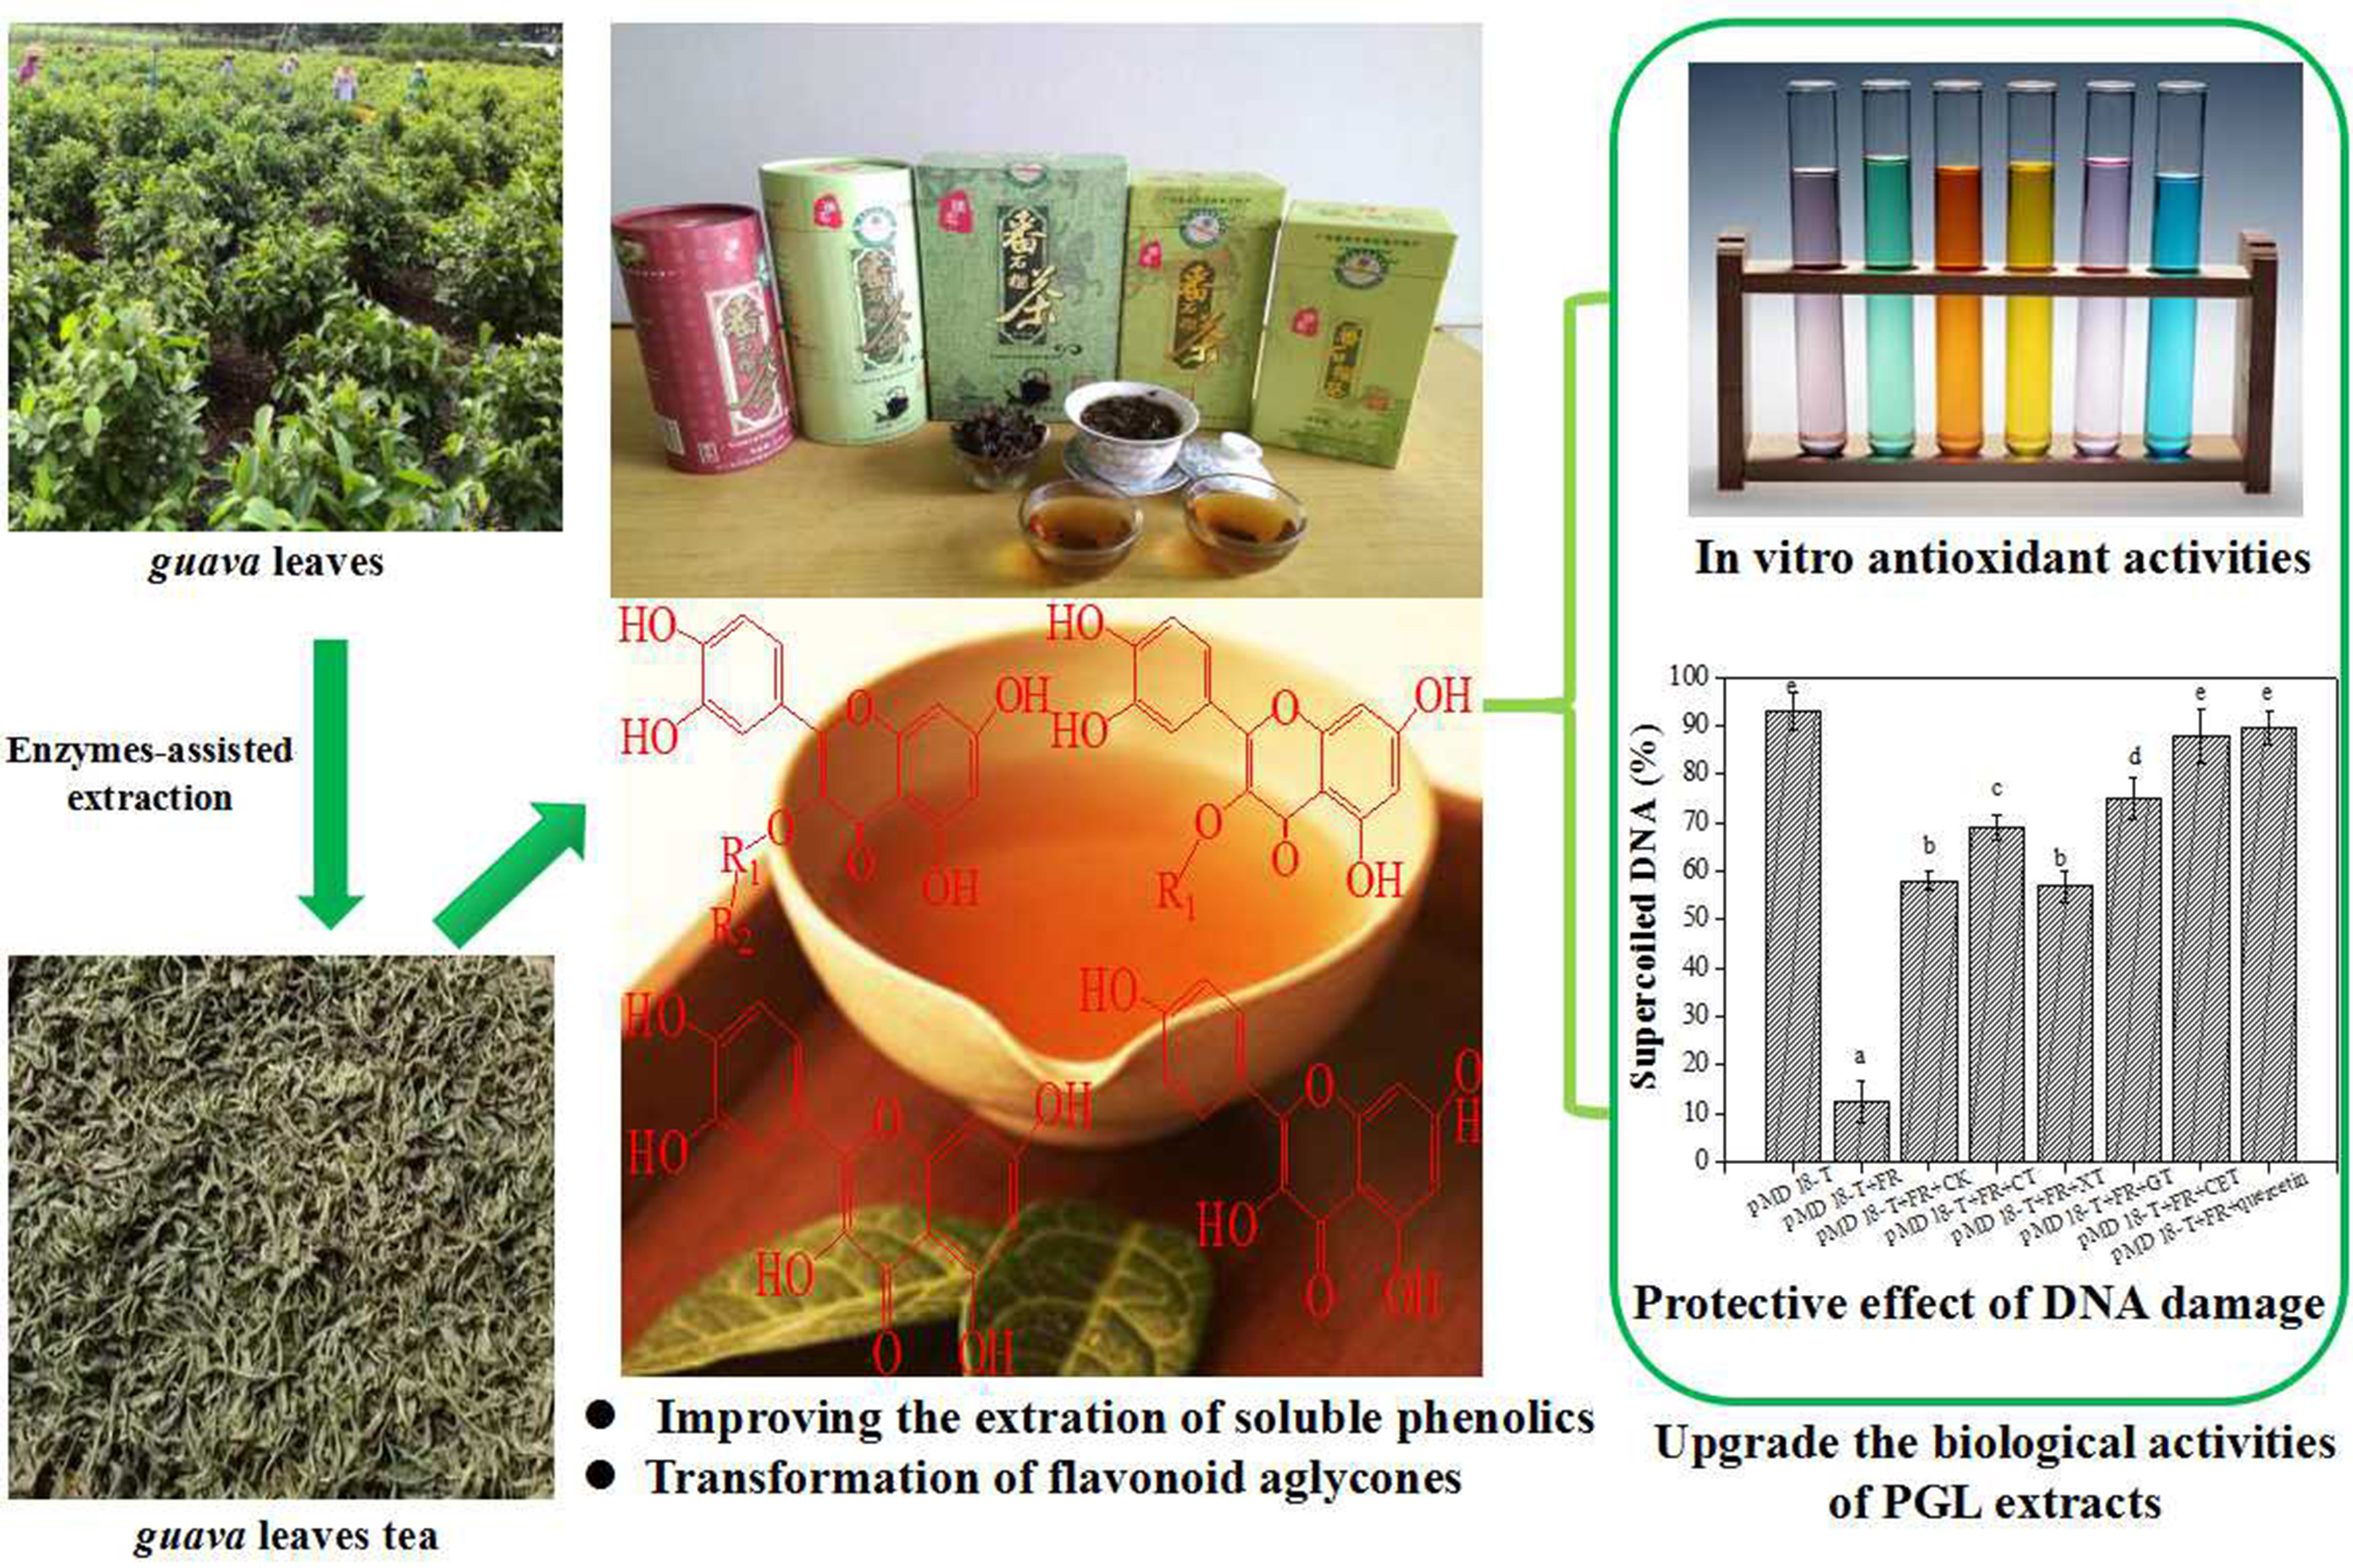
:Phenolics in food and fruit tree leaves exist in free, soluble-conjugate, and insoluble-bound forms. In this study, in order to enhance the bioavailability of insoluble-bound phenolics from guava leaves (GL), the ability of enzyme-assisted extraction in improving the release of insoluble-bound phenolics was investigated. Compared to untreated GL, single xylanase-assisted extraction did not change the composition and yield of soluble phenolics, whereas single cellulase or β-glucosidase-assisted extraction significantly enhanced the soluble phenolics content of PGL. However, complex enzyme-assisted extraction (CEAE) greatly improved the soluble phenolics content, flavonoids content, ABTS, DPPH, and FRAP by 103.2%, 81.6%, 104.4%, 126.5%, and 90.3%, respectively. Interestingly, after CEAE, a major proportion of phenolics existed in the soluble form, and rarely in the insoluble-bound form. Especially, the contents of quercetin and kaempferol with higher bio-activity were enhanced by 3.5- and 2.2-fold, respectively. More importantly, total soluble phenolics extracts of GL following CEAE exhibited the highest antioxidant activity and protective effect against supercoiled DNA damage. This enzyme-assisted extraction technology can be useful for extracting biochemical components from plant matrix, and has good potential for use in the food and pharmaceutical industries.

1. Introduction
The fruits of guava (Psidium guajava L.) are used as a source of functional beverages due to thier delicious flavor and nutritional value. Besides the fruit, the leaves also have many uses. In Brazil and China, guava leaves are widely applied as a functional herbal tea or a source of beverage and contain various bioactive compounds, including phenolic acids, flavonoids, and polysaccharides [1,2]. Among them, the strong antioxidant activity of polyphenolics may prevent reactive oxygen species (ROS) damage, DNA mutation, diabetes, cardiovascular diseases, and heart disease [3,4]. Moreover, polyphenolics are one of the most abundant bioactive ingredients in GL resources and are considered to be a natural dietary antioxidant due to their potential health benefits and the availability of their raw materials [5].
Many studies have demonstrated that the phenolic compounds of plant matrix usually exist in the soluble free, soluble-conjugated, and insoluble-bound forms [6,7]. Madhujith and Shahidi (2009) confirmed that there are higher amounts of insoluble-bound and soluble-conjugated phenolics than free phenolics in barley [8]. Adom and Liu, (2002) reported that insoluble-bound phenolics made up over 65% of the total phenolics that exist in corn, wheat, rice bran, and tea products [9]. Researches have also confirmed insoluble-bound phenolics are notably difficult to extract due to their interaction with polysaccharides or proteins through O-glycosidic or C-glycosidic bonds in the cell wall. Naczk and Shahidi, (1989) reported that extraction solvents have no significant influence on promoting the release of insoluble-bound phenolics [10]. Many approaches have been used to improve the release of phenolic components from agricultural and sideline products, such as pressurized liquid extraction, supercritical fluid extraction, microwave- or ultrasound-assisted extraction [11,12,13,14], hydrothermal extraction [7], and far-infrared radiation [15]. The advantages of these extraction methods could increase the extraction yield and decrease the extraction time. However, the disadvantages of these methods, including expensive equipment, small scale, and environmental pollution, seriously hindered their application in agricultural byproducts. Consequently, along with the increasing market demand for phenolic extracts, this has prompted the search for new, eco-friendly, and efficient methods of extraction to improve their recovery and bioavailability. Enzyme-assisted extraction has the advantages of large scale, high efficiency, and environmental protection in improving the contents of phenolics from plant matrix. Landbo and Mayer, (2001) confirmed that specific Grindamyl pectinase-assisted extraction have been successfully used to enhance the recovery of polyphenols from blackcurrants [16]. Mathew and Abraham, (2004) also reported that cellulases and feruloyl esterases remarkably promoted the release of phenolic compounds from wheat bran [17]. Zheng et al. (2009) reported cellulases, pectinases, amaylases, hemicellulases, and glucanases can effectively release phenolic compounds from unripe apples [18]. Although the enzyme-assisted approach has largely improved the extraction yield of bioactive compounds of the aforementioned species, there are no reports on the application of this procedure on GL.
The aims of the present work were to: (1) investigate the ability of different enzyme-assisted extraction methods on improving the release of insoluble-bound phenolics from GL; (2) characterize the changes in the compositions and contents of individual phenolics among the free, soluble-conjugate, and insoluble-bound forms from GL after enzyme-assisted extraction; and (3) evaluate the antioxidant activities and protective effect against DNA damage of soluble phenolic extracts from GL after enzyme-assisted extraction.
2. Results
2.1. Changes of Total Phenolic and Flavonoid Contents with Enzyme-Assisted Extraction
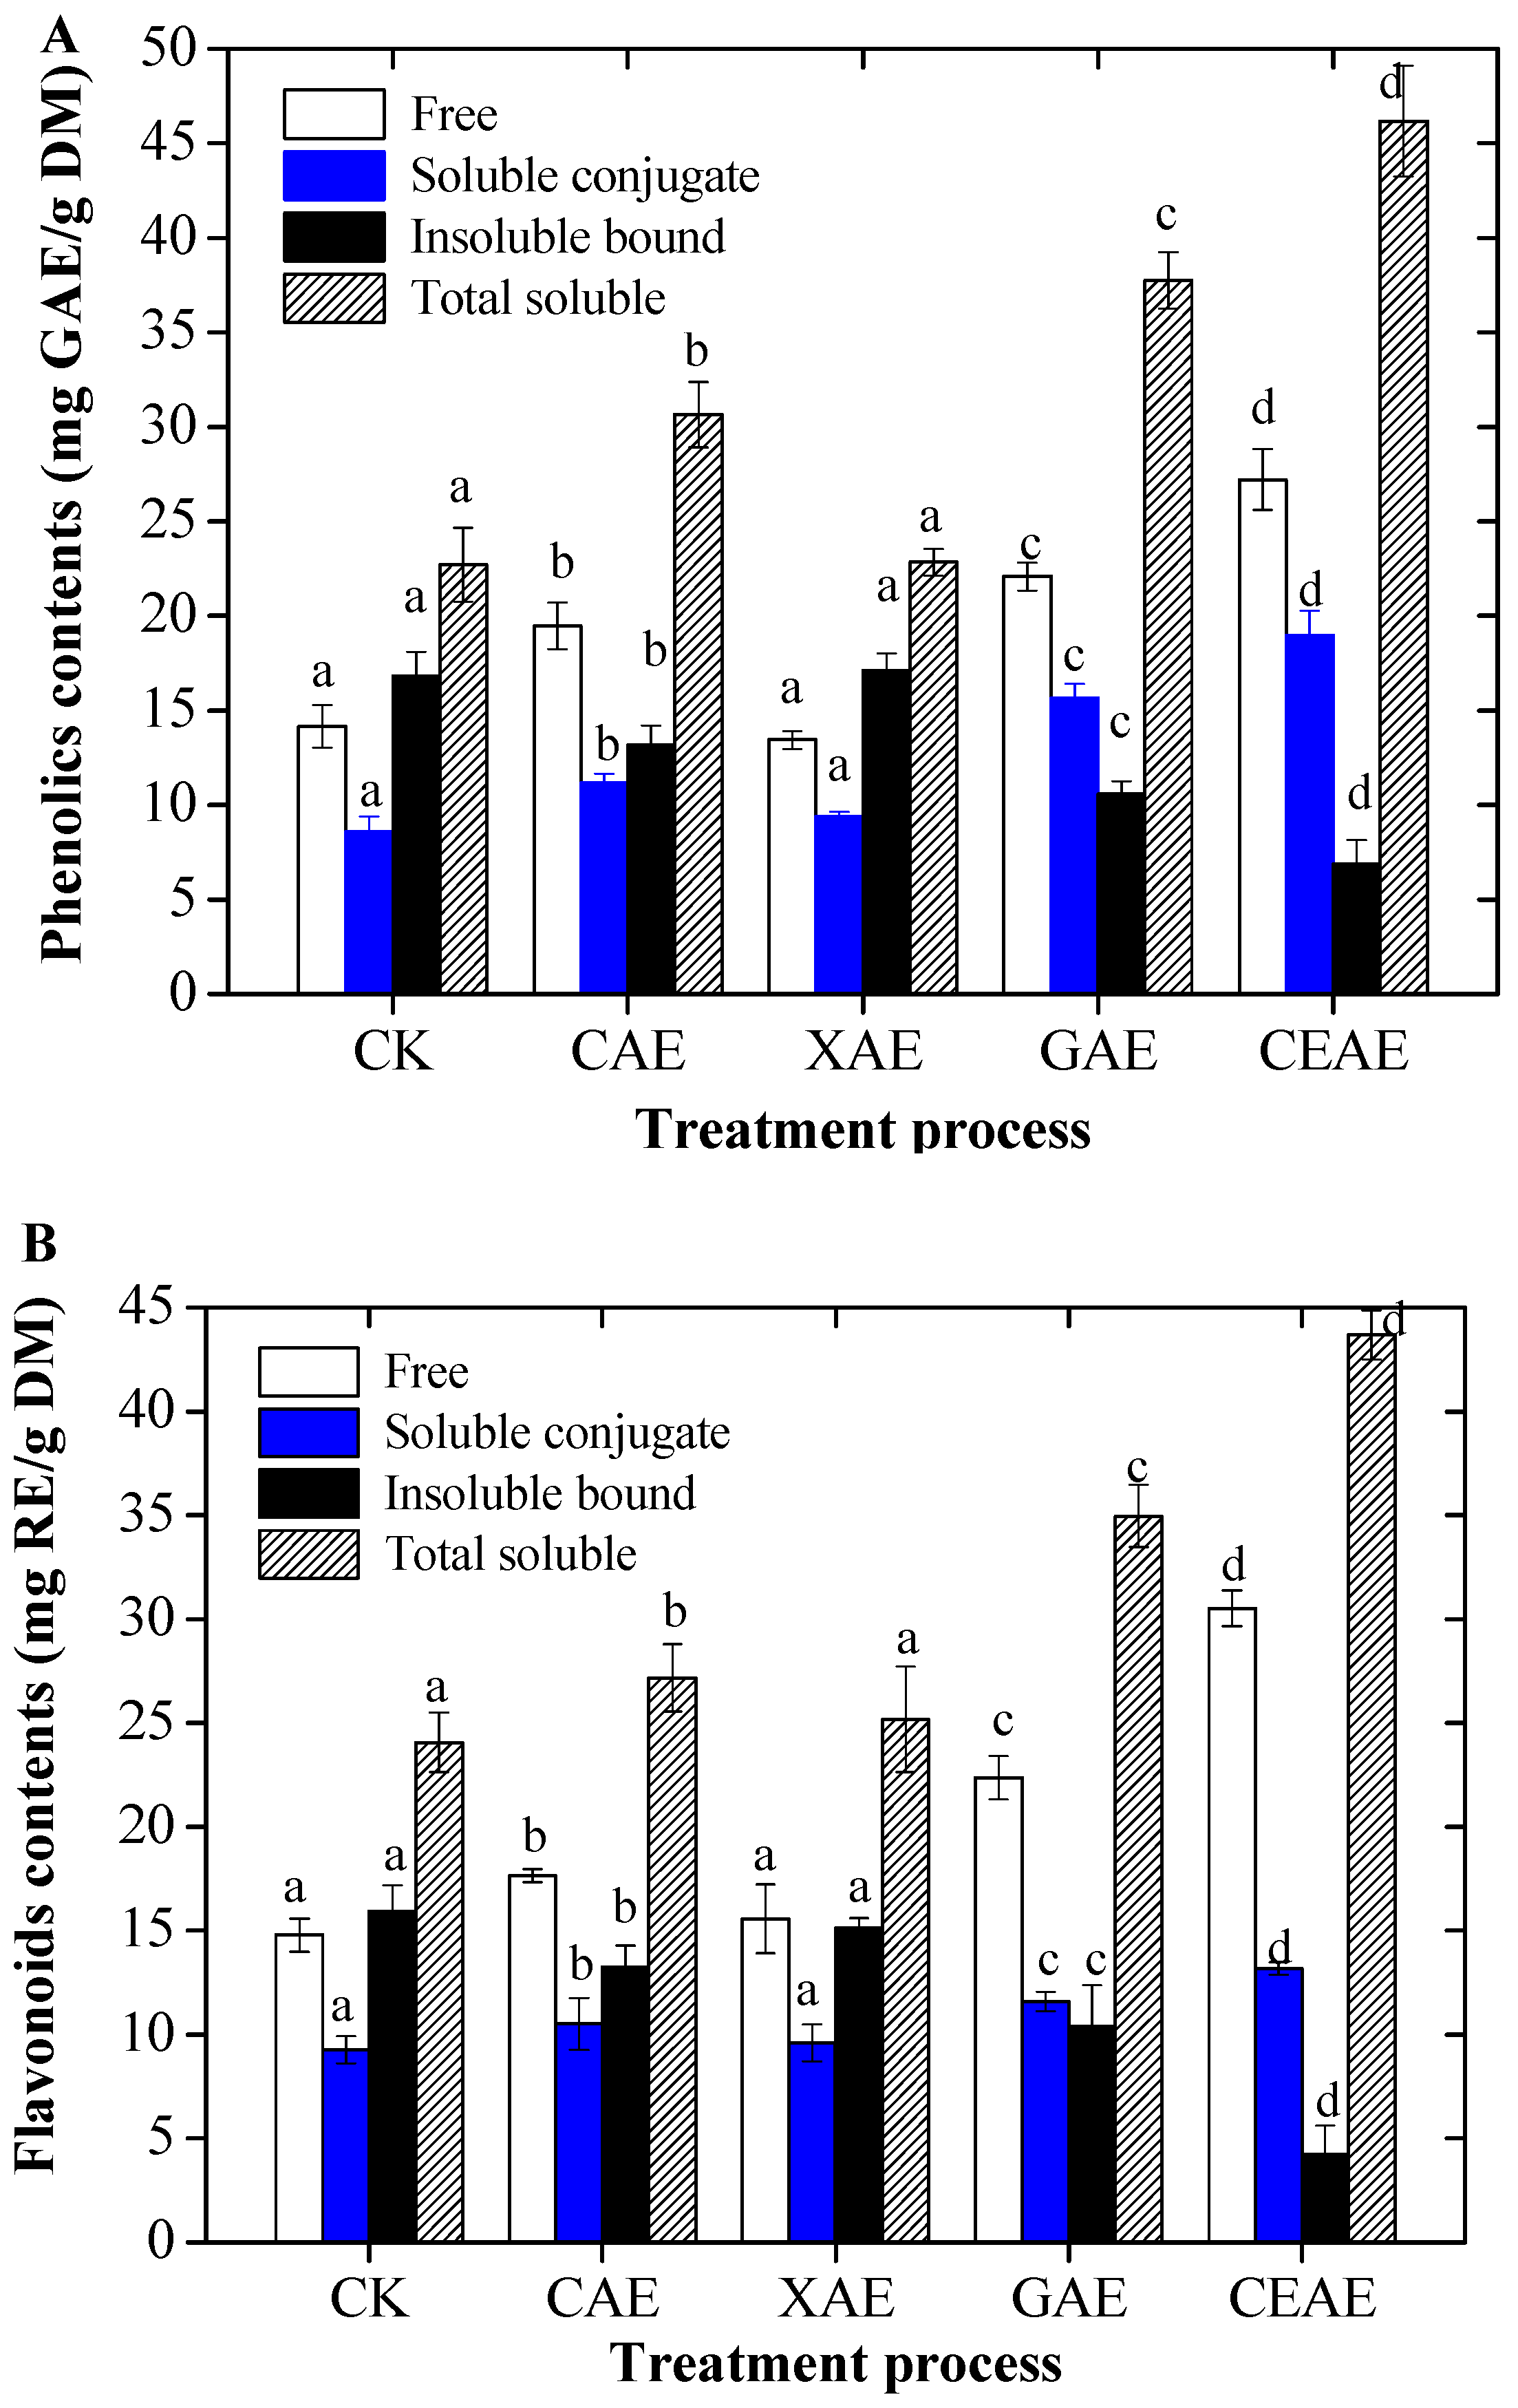
The contents of FP, SCP, IBP, and TSP in GL extracts with different enzyme-assisted extraction methods are shown in Figure 1A. After single cellulase-assisted extraction (CAE), the yields of FP, SCP, IBP, and TSP were 19.5, 13.5, 22.1, and 27.2 mg GAE/g DM, respectively. The FP, SCP, and TSP contents were enhanced by 37.7%, 30.2%, and 34.9% compared to the untreated (CK), respectively. Single xylanase-assisted extraction (XAE) had no significant influence on the phenolic content (p = 0.134). Single β-glucosidase-assisted extraction (GAE) also significantly increased the contents of FP, SCP, and TSP by 1.6-, 1.8-, and 1.7-fold more than the CK (p = 0.000). In addition, complex enzyme-assisted extraction (CEAE) evidently increased the contents of FP, SCP, and TSP by 1.9-, 2.2-, and 2.0-fold compared to the control, and decreased the content of IBP by 59.18%. The ratio of FP to TP was only 35.8% in the CK. However, the ratio increased to 51.4% after CEAE. Importantly, the corresponding IBP decreased from 42.6% in the CK group to 13.0% in the CEAE group.
Figure 1B presents the contents of FF, SCF, IBF, and TSF in the GL extract. After CAE, the amounts of FF, SCF, IBF, and TSF were 17.7, 15.6, 22.4, and 30.5 mg RE/g DM, respectively. The FF, SCF, and TSF were increased by 19.3, 13.4, and 12.9% compared to the CK, respectively. XAE had no significant influence on the TSF content (p = 0.211), but GAE significantly increased the contents of FF, SCF, and TSF by 1.5-, 1.3-, and 1.5-fold more than in the untreated group (p = 0.001). In addition, CEAE evidently increased the contents of FF, SCF, and TSF by 2.1-, 1.4-, and 1.8-fold more than in the untreated group and decreased the content of IBP by 73.5%. The contribution of FF to the total phenolics increased from 37.0% in the CK group to 63.7% in the CEAE group, while the corresponding IBF decreased from 39.9% in the CK group to 8.8% in the CEAE group.
2.2. Changes of Phenolic Compounds with Enzyme-Assisted Extraction
The 15 phenolic compounds including gallic acid, p-coumaric acid, chlorogenic acid, p-hydroxybenzoic acid, sinapic acid, caffeic acid, ferulic acid, rutin, isoquercitrin, quercetin-3-O-β-d-xylopyranoside, quercetin-3-O-α-l-arabinoside, avicularin, quercitrin, quercetin, and kaempferol in free, soluble-conjugate and insoluble-bound fractions from GL after enzyme-assisted extraction were analyzed (Figure 2A–D). Based on the HPLC analysis, the compositions of three form phenolic fractions were similar after enzyme-assisted extraction, while their contents were evidently different (p < 0.05). From Figure 2B,C and Table 1, it can be found that quercetin-3-O-β-d-xylopyranoside and kaempferol were present only in the soluble free form, while chlorogenic acid, rutin, sinapic acid, avicularin, and quercitrin rarely exist as the soluble-conjugate form. Most of the determined phenolics were present in free, soluble-conjugate, and insoluble-bound forms (Figure 2B–D). After CAE, individual phenolics contents from GL extracts were slightly increased with the exception of syringic acid and ferric acid, which did not change significantly (p = 0.39). Individual phenolics contents from the GL extracts following XAE did not evidently change (p = 0.43). Treatment with β-glucosidase can also distinctly increase the total soluble contents of individual phenolics, especially for gallic acid and quercetin, which were enhanced by 36.4% and 156.1%, respectively, while exceptions included rutin, avicularin, and quercetin-3-O-α-l-arabinoside, which decreased by 72.2%, 72.4%, and 21.8%, respectively. The increases in the total amount of each phenolic compound from GL extracts after CEAE were as follows: gallic acid, 57.0%; chlorogenic acid, 37.7%; p-hydroxybenzoic acid, 87.2%; caffeic acid, 86.7%; p-coumaric acid, 74.4%; quercetin-3-O-β-d-xylopyranoside, 35.9%; quercitrin, 25.4%; quercetin, 250.8%; and kaempferol, 119.0%, while the four phenolics that showed declines in total contents were syringic acid, 67.5%, rutin, 90.0%, quercetin-3-O-α-l-arabinoside, 82.4%, and avicularin, 92.3%.
2.3. Changes of Bioactivity with Enzyme-Assisted Extraction
2.3.1. Antioxidant Activity
The antioxidant capacity of FP, SCP, IBP, and TSP extracts from GL following enzyme-assisted extraction were evaluated by three antioxidant modes, including scavenging activity of ABTS+, DPPH radical, and FRAP assays. The results are shown in Table 2.
After CAE, the ABTS values of FP, SCP, IBP, and TSP were 23.5, 9.5, 16.8, and 33.0 mmol TE/g DM, respectively. CAE increased the FP, SCP, and TSP ABTS values, by 13.9%, 46.3%, and 21.7%, respectively (p < 0.05). However, XAE did not significantly increase the soluble phenolics (p = 0.45). In contrast, there is a slight decline in the soluble phenolic ABTS value which may be because several phenolics have been hydrolyzed into other chemicals due to high temperature treatment, such as with syringic acid [19]. After treatment with β-glucosidase, the ABTS values of FP, SCP, and TSP were fortified by 40.8%, 66.3%, and 46.9%, respectively. In addition, CEAE evidently increased the ABTS values of FP, SCP, and TSP by 1.8-, 2.7-, and 2.0-fold more than with the CK.
After CAE, the DPPH values of FP, SCP, IBP, and TSP were 17.6, 11.5, 18.2, and 29.1 mmol TE/g DM, respectively. FP, SCP, and TSP DPPH values were significantly increased by 14.6%, 43.3%, and 24.4%, respectively (p < 0.05). However, XAE showed no significant change in the soluble phenolics (p > 0.05). GAE fortified the DPPH values of FP, SCP, and TSP by 70.2%, 69.4%, and 69.9%, respectively. Interestingly, CEAE evidently enhanced the DPPH values of FP, SCP, and TSP by 2.3-, 2.2-, and 2.3-fold more than with the CK.
Antioxidant activity of GL after enzyme-assisted extraction was also evaluated by FRAP assays. After CAE, the FRAP values of FP, SCP, IBP, and TSP were 94.8, 49.7, 50.5, and 144.4 μmol Fe(II)SE/g DM, respectively. CAE significantly promoted the FP, SCP, and TSP FRAP values by 13.2%, 14.0%, and 13.5%, respectively (p < 0.05). However, XAE did not significantly increase the soluble phenolics (p = 0.61). Through treatment with β-glucosidase, the FRAP values of FP, SCP, and TSP were enhanced by 33.6%, 37.7%, and 35.0%, respectively. Importantly, CEAE evidently increased the FRAP values of FP, SCP, and TSP by 1.9-, 1.8-, and 1.9-fold more than with the CK. The FRAP assays were consistent with the above tested results of ABTS and DPPH.
2.3.2. Protection Effect against DNA Damage
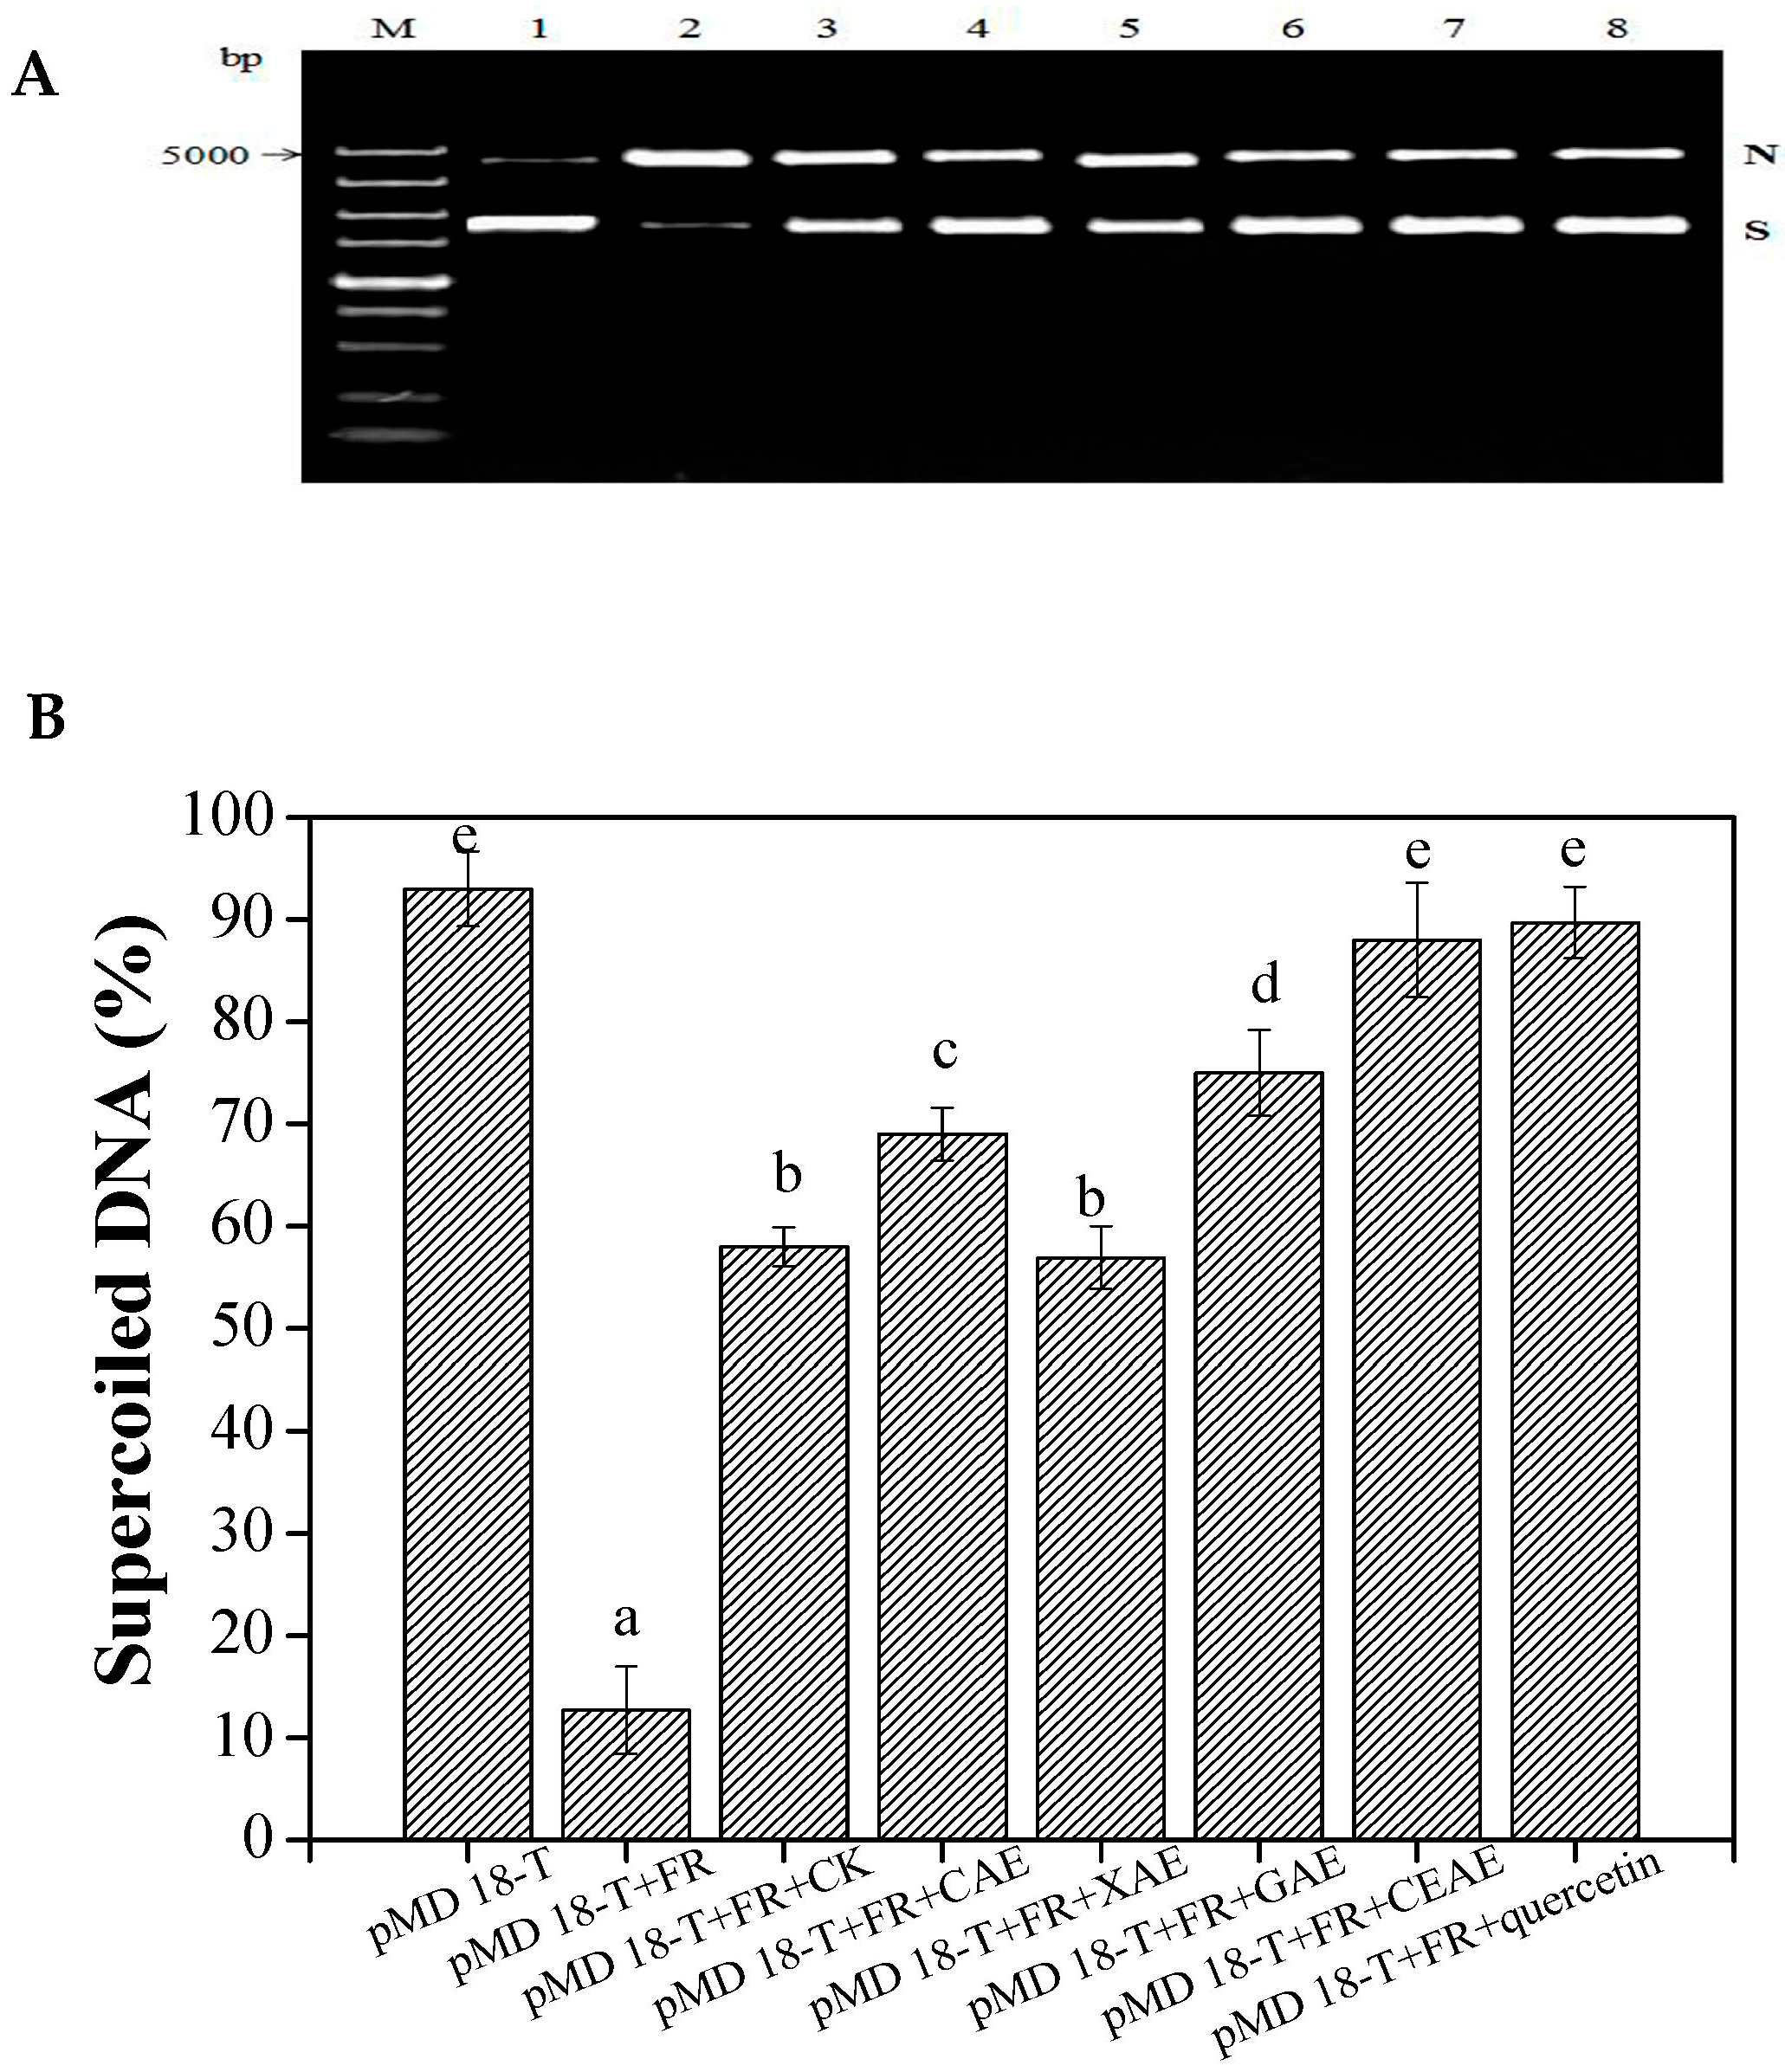
From Figure 3A, the soluble phenolic extracts from GL following different enzyme-assisted extraction methods had significant preventative effects on supercoiled DNA strand scission (p < 0.05). In particular, the supercoiled DNA had been almost completely split into the nicked DNA form when mixed with only the plasmids pMD-18T and Fenton’s reagent. The positive control, quercetin, showed a good protective effect against hydroxyl radical-induced DNA supercoiled strain breakage. From Figure 3B, the SP extracts of GL following CAE showed 59.0 ± 0.3% supercoiled DNA, while treatment with β-glucosidase exhibited a greater protection of supercoiled DNA (75.7 ± 1.4%) than in the phenolics group without any additions (p < 0.01). Treatment with xylanase exhibited no significant improvement on the protection of supercoiled DNA compared to the phenolics group without additions (p = 0.27). However, CEAE resulted in the supercoiled DNA of 89.0 ± 2.2%, which displayed no evident differences in comparison with the blank (only plasmid pMD-18T with PBS buffer) and quercetin treatment groups (the positive control). Moreover, SP extracts of GL treated with the complex enzymatic extraction were obviously stronger than those of GL treated with a single enzymatic extraction for protective effects against DNA damage (p < 0.05).
3. Discussion
3.1. Enzyme-Assisted Extraction Action on Total Soluble Phenolics and Soluble Flavonoids Contents
Soluble phenolics can easily be released from the plant matrix, while the extraction of insoluble-bound phenolic compounds is difficult. Phenolic compounds in the insoluble-bound form are covalently bound to plant cell wall structural elements such as cellulose, hemicellulose, and structural protein or polysaccharides [20]. The present study confirmed that xylanase-assisted extraction has no significant effect on improving the yields of the soluble phenolics and flavonoids (free and conjugate form). However, cellulase- or β-glucosidase-assisted extraction increases the release of insoluble-bound phenolics and flavonoids. In addition, complex enzyme-assisted extraction is a higher-efficiency method to improve the release of the insoluble-bound phenolics and obtain the highest content of quercetin and kaempferol than a single enzyme-assisted extraction. As we all know, the absorption efficiency in human intestines and the bioactivities of quercetin were much higher than with its glycoside derivatives [21,22,23]. Treatment with β-glucosidase, cellulase, and complex enzymes caused the disruption of the bonds between the phenolics and the cell wall components of the GL matrix; thus, the insoluble-bound phenolics were released into soluble forms (Table 2). The results were consistent with the report of Liu et al. (2017) [19]. Similarly, the enzymatic release of phenolic compounds from currant pomace using commercial protease and pectinase yielded higher contents of phenolics. In our study, complex enzyme-assisted extraction is more effective than use of a single enzyme-assisted extraction, which is consistent with previous studies [19,24]. This may be observed because GL is comprised of many flavonoids in the glycosidic bond or OH ground form attached to the cell wall, polysaccharides, or proteins. Many reports have confirmed that β-glucosidase and cellulase can more efficiently disrupt the bonds (glycosidic bonds or –OH) [18,19]. However, xylanase may play a few roles in the rupture of the bonds between the phenolics and the cell walls of the plant matrix. Wang et al. (2016) have confirmed that the phenolic contents of GL were enhanced by solid-state co-fermentation with Monascus anka and Saccharomyces cerevisiae, but the relationship was not clear between the change of free, conjugated, and insoluble-bound phenolics and the release of insoluble-bound phenolics and the enzymatic action during fermentation [5]. Therefore, it is important to perform a comprehensive evaluation of the phenolic profile in GL, including the change of the free, conjugated, and insoluble-bound phenolics under specific enzyme-assisted extraction.
3.2. Enzyme-Assisted Extraction Action on the Phenolic Compositions
Generally, CAE increased the soluble contents of individual phenolics compounds from GL, with the exception of syringic acid, which significantly declined, possibly due to degradation upon exposure to high temperatures [19]. GAE may not only promote the release of phenolic compounds, but it can also convert flavonoid glycosides into aglycones [5,25]. GAE released 199.1 mg/100 g DM of quercetin from GL, while CEAE released 258.9 mg/100 g DM, which was 3.5 times that of the control. The great enhancement of quercetin contents was due to the interaction between the enzymatic effects from plant cell wall damage and the biotransformation of quercetin-3-O-α-l-arabinoside and avicularin. Interestingly, CEAE brought about a larger release of individual phenolics than treatment with a single enzyme, and the soluble free phenolics were greater than the soluble-conjugate and insoluble-bound forms in GL extract, which differs from the reports of Liu et al. (2017) [19]. Based on the result from Table 2, it can be concluded that the increases in the phenolic compounds are mainly due to the release of the insoluble-bound phenolics, such as gallic acid, p-hydroxybenzoic acid, caffeic acid, rutin, p-coumaric acid, isoquercitrin, quercetin-3-O-β-d-xylopyranoside, quercitrin, and quercetin. Alrahmany et al. (2013) found that both cellulase and α-amylase treatment released more soluble-conjugate than free phenolic acids from oat bran, including ferulic, coumaric, caffeic and vanillic acids, and the amount released significantly differed between the tested enzymes [26]. To summarize, the manner in which some individual phenolics were released differed, as they were differently subjected to the attachments of cell wall components, as well as the specificity of the enzymes.
3.3. Enzyme-Assisted Extraction Action on Bioactivity
The potential health benefits of phenolic compounds from tea products or natural cereals are mainly attributed to their strong antioxidant activity. Due to the limitations of a single antioxidant property test to reflect the antioxidant capacity of the samples, it was necessary to implement multiple antioxidant activity assays [27]. The antioxidant activities of different forms of phenolics in the GL extracts were measured. These confirmed that single enzymatic treatment with cellulase or β-glucosidase significantly increased the scavenging activity of ABTS+, DPPH radical, and FRAP activity. Moreover, the three methods of measuring antioxidant activity gave similar results and were consistent with the change in phenolic contents of GL after enzyme-assisted extraction. Several researchers have reported that there is a positive correlation between antioxidant activity and the contents of phenolics and flavonoids [19,28]. Alrahmany and Tsopmo, (2012) found that the free ORAC activity of oat bran following three different enzymatic treatments can be increased, due to the promoted release of the phenolic contents [29]. Liu et al. (2017) also confirmed that the FRAP and ORAC activities of rice bran were enhanced by complex enzymatic treatment [19]. However, little information has been available on the ability of enzyme-assisted extraction methods to improve the antioxidant activity of soluble phenolics from GL. The present work has confirmed CEAE can significantly enhance the antioxidant activity of GL extracts.
Free radicals are known for damaging DNA strands, which might ultimately lead to cytotoxicity, mutagenesis, and carcinogenesis [30,31]. Hydroxyl radicals generated by the Fenton’s reagent reaction can cause breakage of supercoiled DNA strands and an increase in the formation of the nicked DNA [32]. In the present work, due to the increase of soluble phenolic/flavonoids compounds from GL following cellulase or β-glucosidase processing, the SP extracts showed higher protective effects for supercoiled DNA than the phenolics group without additions. However, the SP extracts of GL following complex enzymatic treatment showed the highest inhibition of peroxyl and hydroxyl radical-induced DNA supercoiled strand breakage. According to the HPLC analysis, the contents of quercetin and TSP of GL extracts following complex enzymatic processing were quite evidently enhanced (p < 0.01). Chandrasekara and Shahidi, (2011) have confirmed phenolics can significantly prevent supercoiled DNA strand scission [33]. Kim et al. (2010) have reported that flavonoid aglycones possessed an evidently higher protective capacity for supercoiled DNA than flavonoid glycosides [34]. Singh et al. (2010) also verified that fermented legume extracts showed higher DNA damage protection than unfermented legume extracts due to the higher contents of phenolics and flavonoids. Thus, the higher accumulation of soluble phenolics and quercetin were conducive in enhancing the protection of supercoiled DNA [35].
4. Materials and Methods
4.1. Chemicals and Reagents
All of phenolics standards, Folin–Ciocalteu’s phenol reagent, potassium persulfate, FeCl3, Trolox, ABTS, 2,4,6-tripyridyl-Striazine (TPTZ), and DPPH were all purchased from Sigma-Aldrich (St. Louis, MO, USA, >99.5%). Formic acid and acetonitrile solvents were purchased from Fisher Scientific (HPLC grade, 99.9%, Waltham, MA, USA). The Takara MiniBEST Plasmid Purification Kit and the pMD-18T plasmid DNA were also purchased from Takara Biotechnology Co., Ltd. (Dalian, China). Cellulase (E.C. 3.2.1.4, 8000 U/g) and xylanase (E.C. 3.2.1.8, 8000 U/g) both from Aspergillus niger, β-glucosidase (E.C. 3.2.1.21, 8000 U/g) from Trichoderma reesei, and complex enzymes (including cellulase, xylanase, and β-glucosidase) were purchased from Youtell Biochemical Co., Ltd. (Shanghai, China).
4.2. Enzyme Pre-Treatment
The enzymatic reaction system including 5 g of dried and ground GL substrate and 20 mL H2O (adjusted to pH = 5.0 using 0.02 M citric acid), was incubated for 12 h at 50 °C with 0.5 g of single enzyme (cellulase, xylanase, or β-glucosidase) or 1.5 g of complex enzymes mixture (cellulase:xylanase:β-glucosidase; 1:1:1), respectively. Enzymatic treatment was performed in triplicate. After completion of the reaction, all samples were maintained at oven for 20 min at 80 °C to inactivate these enzymes. GL samples treated with different enzymes were collected and dried for 15 h at 60 °C to remove the water.
4.3. Extraction of Free Phenolic Fractions
The free phenolic fraction was extracted according to the method with slight modifications [36]. In brief, 1 g of the above treated GL powder was extracted three times with 70% methanol at a ratio of 1:10 (w/v). For each extraction, the mixture was kept in a 40 °C water bath for 1 h. The filtrate was extracted three times with 70 mL of ethyl acetate via liquid-liquid stratification [19]. After removal of the ethyl acetate, the extract was redissolved in 5 mL of 50% methanol (v/v).
4.4. Extraction of Soluble-Conjugate Phenolics
The soluble-conjugated phenolic fraction was extracted from all GL samples according to the methods described by Bei et al. (2017) with modifications [36]. The conjugated phenolic fraction was extracted from the water phase after the ethyl acetate extraction of the free phenolic fraction. The water phase was hydrolyzed with 40 mL of 2 M NaOH for 4 h and acidified with 12 M HCl to pH 2.0. The hydrolysate was extracted three times with 70 mL of ethyl acetate via liquid-liquid stratification [5,37]. The ethyl acetate fractions were evaporated under vacuum at 45 °C until dry, the extract was redissolved in 5 mL of 50% methanol (v/v).
4.5. Extraction of Insoluble-Bound Phenolics
Insoluble-bound phenolic fraction was extracted according to the methods described by Wang et al. (2017) [38]. The dried leaf residue (0.5 g) from the above free phenolics extraction was hydrolyzed directly with 50 mL of 2 M NaOH at room temperature for 4 h. The mixture was then acidified with 12 N·HCl to pH 2.0. The remaining mixture was then extracted three times with 70 mL of ethyl acetate [19,20]. The ethyl acetate fractions were evaporated under vacuum at 45 °C until dry. The insoluble-bound phenolics were dissolved by adding 5 mL of 50% methanol (v/v). All phenolics extracts were stored at −20 °C before analysis.
4.6. Determination of Phenolic Content
The free, soluble-conjugated, and insoluble-bound phenolics from GL extracts were determined according to the reported method with a minor modification [38]. Briefly, 100 μL of phenolics extracts were mixed with 30 μL of Folin–Ciocalteu reagent and 150 μL of 20% Na2CO3 solution. After incubation for 30 min at 30 °C in the dark, the absorbance was measured using a SpectraMax Gemini microtiter plate reader (Molecular Devices, Sunnyvale, CA, USA) at 760 nm. Gallic acid (10–100 μg/mL) was used as the reference standard (R2 = 0.9995). Phenolics contents were expressed as mg gallic acid equivalents (GAE)/g sample in dry mass (DM) (mg GAE/g DM). Samples were determined in triplicate.
4.7. Determination of Flavonoids Content
The flavonoid content was determined using the by the AlCl3 colorimetric method [39]. Briefly, 0.1 mL of the above extract was placed in a 2-mL Eppendorf tube. A 70% methanol solution was added to make a 0.5 mL solution, and then, 30 μL of 5% NaNO2 solution (w/v, Tianjin, China) was added. After being kept at room temperature for 5 min, 30 μL of 10% AlCl3 solution was added, and the mixture was allowed to stand for another 6 min. Next, a total of 0.2 mL of 1 M NaOH was added, and the total volume was increased up to 1 mL using 70% methanol solution. The solution was thoroughly mixed again and allowed to stand for 30 min at 35 °C. The absorbance was read at 510 nm. Rutin (10–100 μg/mL) was used as a reference standard (R2 = 0.9995). The flavonoid content was expressed as mg rutin equivalents (RE)/g sample in dry mass (DM) (mg RE/g DM). All of samples were measured in triplicate.
4.8. HPLC Analysis
The HPLC system was comprised of a Waters e2695 HPLC system equipped with a Waters SunFireTM C18 column (250 mm × 4.6 mm, 5 μm, Waters, Milford, MA, USA) as well as a Diode Array Detector (DAD, Waters 2998, Milford, MA, USA). The mobile phase consisted of 0.1% formic acid aqueous solution (v/v, solution A) and acetonitrile solution (solution B) in the gradient elution at 0.8 mL/min with time-course increasing of solution B to 15% B for 0–5 min, 15–20% B for 5–10 min, 20–25% B for 10–20 min, 25–35% B for 20–30 min, 35–50% B for 30–40 min, 80% B for 40–50 min, and 15% B for 50–55 min. The column temperature was set at 30 °C. The detected wavelength was set at 280 nm. Before HPLC analysis, the samples were filtered through a 0.25-μm membrane filter (Millipore, Billerica, MA, USA). Accurate amounts of standard phenolics were added to GL extracts after enzymatic hydrolysis, and they were extracted as described in Section 4.3, Section 4.4 and Section 4.5. As calculated according to the amount found and amount added, the recovery rate of these phenolics ranged from 95.31% to 101.07% (Table 3). The contents of individual phenolics were expressed as milligram per 100 g DM of GL samples.
4.9. Evaluation of Antioxidant Activity
4.9.1. ABTS Radical Cation (ABTS+) Scavenging Activity
The ABTS assay was performed according to the procedure described by Sasipriya & Siddhuraju, (2012) [40]. ABTS+ was formed by oxidation of ABTS (7 mM) with K2S2O8 (2.45 mM) after incubation in the dark at room temperature for 16 h. Then, it was diluted with ethanol to obtain an absorbance of 0.70 at 734 nm before use. 100 μL dilution of the above sample extracts were added to 400 μL of the diluted ABTS+ solution and mixed thoroughly. The reactive mixture was kept in the dark at room temperature for 30 min, and the absorbance was subsequently recorded at 734 nm. The ABTS+ scavenging activity values were expressed in mmol Trolox equivalents (TE)/g sample in DM and were derived from a standard curve.
4.9.2. DPPH Radical Scavenging Activity
The DPPH assay was conducted based on the method described by Hammi, Jdey, Abdelly, Majdoub, & Ksouri, (2015), with slight modifications [41]. Briefly, 50 μL of dilution of the above extracts was mixed with 400 μL of a DPPH-methanol solution (100 μM). The reaction was conducted at 25 °C for 30 min in the dark. The absorbance was measured at 517 nm (A517). The DPPH radical scavenging activity values, expressed in mmol Trolox equivalents (TE)/g sample in DM (mmol TE/g DM), were derived from a standard curve.
4.9.3. Ferric Reducing Antioxidant Power (FRAP) Assay
The FRAP assay was measured according to the method reported by Liu et al. (2017) [19]. The fresh FRAP reagent was prepared using 50 mL of 0.3 M acetate buffer (5.1 g sodium acetate in 20 mL CH3COOH, pH 3.6), 5 mL of 20 mM FeCl3 solution and 5 mL of TPTZ solution (10 mM TPTZ in 40 mM HCl), which was warmed to 35 °C before use. The above extract was diluted with distilled water, and then 30 μL of diluted extracts were mixed with 900 μL of FRAP reagent (freshly prepared). After incubation for 30 min in the dark at room temperature, the absorbance of the reaction mixture was read at 593 nm. The FRAP values, expressed in μmol ferrous sulfate equivalents Fe(II)SE/g sample in DM (μmol Fe(II)SE/g DM), were derived from a standard curve.
4.10. Inhibition of Supercoiled DNA Strand Breakage
The inhibitory activity of soluble phenolic extracts from GL following different enzymatic hydrolysis against supercoiled form DNA scission induced by Fenton’s reagent was evaluated based on the method of Liyana-Pathirana and Shahidi, (2006), with slight modifications [42]. Briefly, 10 μL of soluble phenolics extracts (2 mg/mL) was mixed with 5 μL of pMD 18-T plasmid DNA (200 ng/μL) and 10 μL of Fenton’s reagent (50 mM ascorbic acid, 80 mM FeCl3, and 30 mM H2O2). The mixture was later incubated in the dark for 30 min at 37 °C. Quercetin was used as a positive control, and phosphate buffer saline (PBS) instead of the sample as the blank control. The DNA samples were electrophoresed using 0.8% agarose gel with 10% (v/v, μL/mL) GoldView stain (Solaibio Science and Technology, Co., Ltd., Beijing, China), and the DNA bands were visualized under transillumination of UV light using the Gel Doc XR system (Bio-Rad, Hercules, CA, USA). The intensity of the DNA bands was analyzed using Quantity One software (Version 4.6.2, Bio-Rad, Hercules, CA, USA). The relative percentage of the supercoiled DNA was used to evaluate the DNA protective effect of soluble phenolics extracts of GL on the basis of the following Equation (1) [33]:
where Is is the intensity of the supercoiled DNA, and IN is the intensity of the nicked DNA.
4.11. Statistical Analysis
All experiments were repeated three times, and data are expressed as the mean ± standard deviation (SD). Data were analyzed by the SPSS statistics 13.0 software (StatSoft, Tulsa, OK, USA). A one-way analyses of variance (ANOVA) method was applied to evaluate the significance of the differences among the mean values of the test levels. Differences with p < 0.05 and <0.01 were considered to be significant and highly significant, respectively.
5. Conclusions
Overall, single xylanase-assisted extraction did not change the composition and yield of soluble phenolics from GL. Single cellulase or β-glucosidase-assisted extraction significantly increased the soluble phenolics content of GL. Meanwhile, not only did complex enzyme-assisted extraction enhance the yield of soluble phenolics from GL, but also it can convert the flavonoid glycosides into flavonoid aglycones (quercetin and kaempferol) with stronger antioxidant activity. Additionally, soluble phenolic extracts of GL after complex enzyme-assisted extraction exhibited the highest antioxidant activity and protective effect against oxidative damage of DNA induced by Fenton’s reagent. The results of this study provide useful information for processing GL into polyphenol-based food sources or tea products with increased health benefits.
Acknowledgments
This work was supported by the Science and Technology Project of Guangdong Province, China (2016A020210011 and 2017B020207003) and the Special Fund for Agricultural Science and Technology Research Project of Jiangmen City, China (20150160008347). The authors gratefully acknowledge the financial support of the key project on the Collaborative Innovation of Industry, Education and Research of Guangzhou, China (201508010012).
Author Contributions
L.W. and Z.W. designed the experiments. L.W. and Y.W. performed the experiments. L.W. and Y.L. analyzed the data. L.W. composed the paper.
Conflicts of Interest
The authors declare no conflict of interest.
Abbreviations
GL, Guava leaves; DM, Dried mass; CK, untreated; CAE, Cellulase-assisted extraction; XAE, Xylanase-assisted extraction; GAE, β-glucosidase-assisted extraction; CEAE, Complex enzyme-assisted extraction. TP, Total phenolics, TF, Total flavonoids, FP, Free phenolics; SCP, Soluble-conjugate phenolics; IBP, Insoluble-bound phenolics; FF, Free flavonoids; SCF, Soluble-conjugate flavonoids; IBF, Insoluble-bound phenolics; TSP, Total soluble phenolics; TSF, Total soluble flavonoids; DPPH, 1,1-Diphenyl-2-picrylhydrazyl; ABTS, 2,2-Azino-bis (3-ethylbenzothiazoline-6-sulfonic acid) diammonium salt; FRAP, Ferric reducing antioxidant power; LOD, Limit of detection; LOQ, Limit of quantification; N, Nicked DNA; S, Supercoiled DNA.
References
- Vadivel, V.; Biesalski, H.K. Contribution of phenolic compounds to the antioxidant potential and type II diabetes related enzyme inhibition properties of Pongamia pinnata L. Pierre seeds. Process Biochem. 2011, 46, 1973–1980. [Google Scholar] [CrossRef]
- Gutiérrez, R.M.P.; Mitchell, S.; Solis, R.V. Psidium guajava: A review of its traditional uses, phytochemistry and pharmacology. J. Ethnopharmacol. 2008, 117, 1–27. [Google Scholar] [CrossRef] [PubMed]
- Bljajić, K.; Petlevski, R.; Vujić, L.; Čačić, A.; Šoštarić, N.; Jablan, J.; Zovko Končić, M. Chemical composition, antioxidant and α-glucosidase-inhibiting activities of the aqueous and hydroethanolic extracts of Vaccinium myrtillus leaves. Molecules 2017, 22, 703. [Google Scholar] [CrossRef] [PubMed]
- Ranilla, L.G.; Kwon, Y.I.; Apostolidis, E.; Shetty, K. Phenolic compounds, antioxidant activity and in vitro inhibitory potential against key enzymes relevant for hyperglycemia and hypertension of commonly used medicinal plants, herbs and spices in Latin America. Bioresour. Technol. 2010, 101, 4676–4689. [Google Scholar] [CrossRef] [PubMed]
- Wang, L.; Wei, W.; Tian, X.; Shi, K.; Wu, Z. Improving bioactivities of polyphenol extracts from Psidium guajava L. leaves through co-fermentation of Monascus anka GIM 3.592 and Saccharomyces cerevisiae GIM 2.139. Ind. Crop. Prod. 2016, 94, 206–215. [Google Scholar] [CrossRef]
- Ahmad, N.; Zuo, Y.; Lu, X.; Anwar, F.; Hameed, S. Characterization of free and conjugated phenolic compounds in fruits of selected wild plants. Food Chem. 2016, 190, 80–89. [Google Scholar] [CrossRef] [PubMed]
- Yeo, J.; Shahidi, F. Effect of hydrothermal processing on changes of insoluble-bound phenolics of lentils. J. Funct. Foods 2017. [Google Scholar] [CrossRef]
- Madhujith, T.; Shahidi, F. Antioxidant potential of barley as affected by alkaline hydrolysis and release of insoluble-bound phenolics. Food Chem. 2009, 117, 615–620. [Google Scholar] [CrossRef]
- Adom, K.K.; Liu, R.H. Antioxidant activity of grains. J. Agric. Food Chem. 2002, 50, 6182–6187. [Google Scholar] [CrossRef] [PubMed]
- Naczk, M.; Shahidi, F. The effect of methanol-ammonia-water treatment on the content of phenolic acids of canola. Food Chem. 1989, 31, 159–164. [Google Scholar] [CrossRef]
- Li, F.; Mao, Y.D.; Wang, Y.F.; Raza, A.; Qiu, L.P.; Xu, X.Q. Optimization of ultrasonic-assisted enzymatic extraction conditions for improving total phenolic content, antioxidant and antitumor activities in vitro from Trapa quadrispinosa Roxb. residues. Molecules 2017, 22, 396. [Google Scholar] [CrossRef] [PubMed]
- Altemimi, A.; Choudhary, R.; Watson, D.G.; Lightfoot, D.A. Effects of ultrasonic treatments on the polyphenol and antioxidant content of spinach extracts. Ultrason. Sonochem. 2015, 24, 247–255. [Google Scholar] [CrossRef] [PubMed]
- Dranca, F.; Oroian, M. Optimization of ultrasound-assisted extraction of total monomeric anthocyanin (TMA) and total phenolic content (TPC) from eggplant (Solanum melongena L.) peel. Ultrason. Sonochem. 2016, 31, 637–646. [Google Scholar] [CrossRef] [PubMed]
- Vinatoru, M.; Mason, T.J.; Calinescu, I. Ultrasonically assisted extraction (UAE) and microwave assisted extraction (MAE) of functional compounds from plant materials. TrAC Trends Anal. Chem. 2017. [Google Scholar] [CrossRef]
- Wanyo, P.; Meeso, N.; Siriamornpun, S. Effects of different treatments on the antioxidant properties and phenolic compounds of rice bran and rice husk. Food Chem. 2014, 157, 457–463. [Google Scholar] [CrossRef] [PubMed]
- Landbo, A.K.; Meyer, A.S. Enzyme-assisted extraction of antioxidative phenols from black currant juice press residues (Ribes nigrum). J. Agric. Food Chem. 2001, 49, 3169–3177. [Google Scholar] [CrossRef] [PubMed]
- Mathew, S.; Abraham, T.E. Ferulic acid: An antioxidant found naturally in plant cell walls and feruloyl esterases involved in its release and their applications. Crit. Rev. Biotechnol. 2004, 24, 59–83. [Google Scholar] [CrossRef] [PubMed]
- Zheng, H.Z.; Hwang, I.W.; Chung, S.K. Enhancing polyphenol extraction from unripe apples by carbohydrate-hydrolyzing enzymes. J. Zhejiang Univ. Sci. B 2009, 10, 912–919. [Google Scholar] [CrossRef] [PubMed]
- Liu, L.; Wen, W.; Zhang, R.; Wei, Z.; Deng, Y.; Xiao, J.; Zhang, M. Complex enzyme hydrolysis releases antioxidative phenolics from rice bran. Food Chem. 2017, 214, 1–8. [Google Scholar] [CrossRef] [PubMed]
- Alshikh, N.; de Camargo, A.C.; Shahidi, F. Phenolics of selected lentil cultivars: Antioxidant activities and inhibition of low-density lipoprotein and DNA damage. J. Funct. Foods 2015, 18, 1022–1038. [Google Scholar] [CrossRef]
- Manach, C.; Morand, C.; Demigné, C.; Texier, O.; Régérat, F.; Rémésy, C. Bioavailability of rutin and quercetin in rats. FEBS Lett. 1997, 409, 12–16. [Google Scholar] [CrossRef]
- Wein, S.; Wolffram, S. Concomitant intake of quercetin with a grain-based diet acutely lowers postprandial plasma glucose and lipid concentrations in pigs. Biomed. Res. Int. 2014, 2014. [Google Scholar] [CrossRef] [PubMed]
- Wiczkowski, W.; Romaszko, J.; Bucinski, A.; Szawara-Nowak, D.; Honke, J.; Zielinski, H.; Piskula, M.K. Quercetin from shallots (Allium cepa L. var. aggregatum) is more bioavailable than its glucosides. J. Nutr. 2008, 138, 885–888. [Google Scholar] [PubMed]
- Boulila, A.; Hassen, I.; Haouari, L.; Mejri, F.; Amor, I.B.; Casabianca, H.; Hosni, K. Enzyme-assisted extraction of bioactive compounds from bay leaves (Laurus nobilis L.). Ind. Crop Prod. 2015, 74, 485–493. [Google Scholar] [CrossRef]
- Bhanja, T.; Kumari, A.; Banerjee, R. Enrichment of phenolics and free radical scavenging property of wheat koji prepared with two filamentous fungi. Bioresour. Technol. 2009, 100, 2861–2866. [Google Scholar] [CrossRef] [PubMed]
- Alrahmany, R.; Avis, T.J.; Tsopmo, A. Treatment of oat bran with carbohydrases increases soluble phenolic acid content and influences antioxidant and antimicrobial activities. Food Res. Int. 2013, 52, 568–574. [Google Scholar] [CrossRef]
- Shahidi, F.; Zhong, Y. Measurement of antioxidant activity. J. Funct. Foods 2015, 18, 757–781. [Google Scholar] [CrossRef]
- Ti, H.; Li, Q.; Zhang, R.; Zhang, M.; Deng, Y.; Wei, Z.; Zhang, Y. Free and bound phenolic profiles and antioxidant activity of milled fractions of different indica rice varieties cultivated in southern China. Food Chem. 2014, 159, 166–174. [Google Scholar] [CrossRef] [PubMed]
- Alrahmany, R.; Tsopmo, A. Role of carbohydrases on the release of reducing sugar, total phenolics and on antioxidant properties of oat bran. Food Chem. 2012, 132, 413–418. [Google Scholar] [CrossRef] [PubMed]
- Hiramoto, K.; Ojima, N.; Sako, K.I.; Kikugawa, K. Effect of plant phenolics on the formation of the spin-adduct of hydroxyl radical and the DNA strand breaking by hydroxyl radical. Biol. Pharm. Bull. 1996, 19, 558–563. [Google Scholar] [CrossRef] [PubMed]
- Kumar, V.; Lemos, M.; Sharma, M.; Shriram, V. Antioxidant and DNA damage protecting activities of Eulophia nuda Lindl. Free Radic. Antioxid. 2013, 3, 55–60. [Google Scholar] [CrossRef]
- Zhang, L.; Yang, X.; Zhang, Y.; Wang, L.; Zhang, R. In vitro antioxidant properties of different parts of pomegranate flowers. Food Bioprod. Process. 2011, 89, 234–240. [Google Scholar] [CrossRef]
- Chandrasekara, A.; Shahidi, F. Antiproliferative potential and DNA scission inhibitory activity of phenolics from whole millet grains. J. Funct. Foods 2011, 3, 159–170. [Google Scholar] [CrossRef]
- Kim, J.K.; Kim, M.; Cho, S.G.; Kim, M.K.; Kim, S.W.; Lim, Y.H. Biotransformation of mulberroside A from Morus alba results in enhancement of tyrosinase inhibition. J. Ind. Microbiol. Biotechnol. 2010, 37, 631–637. [Google Scholar] [CrossRef] [PubMed]
- Singh, H.B.; Singh, B.N.; Singh, S.P.; Nautiyal, C.S. Solid-state cultivation of Trichoderma harzianum NBRI-1055 for modulating natural antioxidants in soybean seed matrix. Bioresour. Technol. 2010, 101, 6444–6453. [Google Scholar] [CrossRef] [PubMed]
- Bei, Q.; Liu, Y.; Wang, L.; Chen, G.; Wu, Z. Improving free, conjugated, and bound phenolic fractions in fermented oats (Avena sativa L.) with Monascus anka and their antioxidant activity. J. Funct. Foods 2017, 32, 185–194. [Google Scholar] [CrossRef]
- Kumar, G.S.; Nayaka, H.; Dharmesh, S.M.; Salimath, P.V. Free and bound phenolic antioxidants in amla (Emblica officinalis) and turmeric (Curcuma longa). J. Food Compos. Anal. 2006, 19, 446–452. [Google Scholar] [CrossRef]
- Wang, L.; Bei, Q.; Wu, Y.; Liao, W.; Wu, Z. Characterization of soluble and insoluble-bound polyphenols from Psidium guajava L. leaves co-fermented with Monascus anka and Bacillus sp. and their bio-activities. J. Funct. Foods 2017, 32, 149–159. [Google Scholar] [CrossRef]
- Cai, S.; Wang, O.; Wu, W.; Zhu, S.; Zhou, F.; Ji, B.; Cheng, Q. Comparative study of the effects of solid-state fermentation with three filamentous fungi on the total phenolics content (TPC), flavonoids, and antioxidant activities of subfractions from oats (Avena sativa L.). J. Agric. Food Chem. 2011, 60, 507–513. [Google Scholar] [CrossRef] [PubMed]
- Sasipriya, G.; Siddhuraju, P. Effect of different processing methods on antioxidant activity of underutilized legumes, Entada scandens seed kernel and Canavalia gladiata seeds. Food Chem. Toxicol. 2012, 50, 2864–2872. [Google Scholar] [CrossRef] [PubMed]
- Hammi, K.M.; Jdey, A.; Abdelly, C.; Majdoub, H.; Ksouri, R. Optimization of ultrasound-assisted extraction of antioxidant compounds from Tunisian Zizyphus lotus fruits using response surface methodology. Food Chem. 2015, 184, 80–89. [Google Scholar] [CrossRef] [PubMed]
- Liyana-Pathirana, C.M.; Shahidi, F. Importance of insoluble-bound phenolics to antioxidant properties of wheat. J. Agric. Food Chem. 2006, 54, 1256–1264. [Google Scholar] [CrossRef] [PubMed]
Sample Availability: Samples of guava leaves are available from the authors. |
Figure 1.
Contents of phenolics (A) and flavonoids (B), including free, soluble-conjugate, insoluble-bound, and total soluble extracts from guava leaves after different enzyme-assisted extraction. CK, untreated; CAE, cellulase-assisted extraction; XAE, xylanase-assisted extraction; GAE, β-glucosidase-assisted extraction; CEAE, complex enzyme-assisted extraction. Values with different letters in each column are significantly different following enzyme-assisted extraction. All experiments were repeated three times and data are expressed as the mean ± standard deviation (SD).

Figure 2.
High performance liquid chromatography (HPLC) chromatogram of standard phenolics (A); free (B); soluble-conjugate (C); and insoluble-bound phenolics extracts (D) from guava leaves following different enzyme-assisted extraction methods. SM-1, standard mixtures of flavonoids; SM-2, standard mixtures of phenolic acids; CK, untreated; CAE, cellulase-assisted extraction; XAE, xylanase-assisted extraction; GAE, β-glucosidase-assisted extraction; CEAE, complex enzyme-assisted extraction. Peaks: 1, Gallic acid, 2, chlorogenic acid, 3, p-hydroxybenzoic acid, 4, caffeic acid, 5, rutin, 6, isoquercitrin, 7, p-coumaric acid, 8, sinapic acid, 9, ferulic acid, 10, Quercetin-3-O-β-d-xylopyranoside, 11, Quercetin-3-O-α-l-arabinoside, 12, Avicularin, 13, quercitrin, 14, quercetin, 15, kaempferol.

Figure 3.
Protective effects (A,B) of soluble phenolic extracts following different enzyme-assisted extraction methods against DNA oxidation inducted by Fenton’s reagent (FR). The gel was visualized under UV-transilluminator using the Gel Doc XR system (Bio-Rad, Hercules, CA, USA). M: 5000 bp DNA marker; Lane 1: pMD 18-T+ PBS solution; lane 2: pMD 18-T+FR; lane 3: pMD 18-T+FR + CK; lane 4: pMD 18-T + FR + CAE; lane 5: pMD 18-T+ FR + XAE; lane 6: pMD 18-T+ FR + GAE; lane 7: pMD 18-T+ FR + CEAE; lane 8: pMD 18-T+ FR + quercetin. Values are mean ± standard deviation (n = 3). N, Nicked DNA; S, supercoiled DNA; FR, Fenton’s reagent; CK, untreated; CAE, cellulase-assisted extraction; XAE, xylanase-assisted extraction; GAE, β-glucosidase-assisted extraction; CEAE, complex enzyme-assisted extraction. Different letters (a–e) mean statistically significant differences at p < 0.05.


Table 1.
Changes in individual phenolics in GL extract following enzymatic treatment of the free, soluble-conjugate, insoluble bound, and total soluble phenolics fractions.
Table 1.
Changes in individual phenolics in GL extract following enzymatic treatment of the free, soluble-conjugate, insoluble bound, and total soluble phenolics fractions.
| Analytes | Stage | Free (mg/100 g DM) | Soluble-Conjugate (mg/100 g DM) | Insoluble-Bound (mg/100 g DM) | Total Soluble (mg/100 g DM) |
|---|---|---|---|---|---|
| Gallic acid | CK | 161.1 ± 1.11a | 118.3 ± 1.32a | 351.5 ± 2.63a | 279.5 ± 2.33a |
| CAE | 173.0 ± 1.31b | 131.4 ± 1.81b | 259.6 ± 1.53b | 304.4 ± 3.12b | |
| XAE | 163.4 ± 2.21a | 117.5 ± 2.12a | 348.8 ± 2.01a | 280.9 ± 4.33a | |
| GAE | 235.3 ± 1.90c | 145.7 ± 1.31c | 245.7 ± 1.41c | 381.1 ± 3.21c | |
| CEAE | 276.6 ± 2.62d | 162.2 ± 1.71d | 71.36 ± 1.45d | 438.8 ± 4.33d | |
| Chlorogenic acid | CK | 25.8 ± 0.31a | 26.3 ± 0.40a | N.D. | 52.1 ± 0.71a |
| CAE | 31.1 ± 0.25b | 29.4 ± 0.31b | N.D. | 60.5 ± 0.56b | |
| XAE | 23.7 ± 0.61b | 27.4 ± 1.22b | N.D. | 51.8 ± 1.83a | |
| GAE | 36.5 ± 0.37b | 30.7 ± 0.42b | N.D. | 67.2 ± 0.73b | |
| CEAE | 41.4 ± 0.22b | 30.3 ± 0.21a | N.D. | 71.7 ± 0.43a | |
| p-hydroxybenzoic acid | CK | 1.1 ± 0.05a | 2.6 ± 0.04b | 13.4 ± 0.1e | 3.66 ± 0.09b |
| CAE | 2.0 ± 0.01b | 2.2 ± 0.01c | 9.0 ± 0.1c | 4.2 ± 0.02c | |
| XAE | 1.0 ± 0.02a | 2.7 ± 0.02a | 11.8 ± 0.07d | 3.7 ± 0.04a | |
| GAE | 2.6 ± 0.05c | 3.1 ± 0.01d | 6.0 ± 0.01b | 5.7 ± 0.11d | |
| CEAE | 2.9 ± 0.03d | 4.0 ± 0.03e | 0.3 ± 0.01a | 6.9 ± 0.06e | |
| Caffeic acid | CK | N.D. | 4.9 ± 0.07a | 12.1 ± 0.11b | 4.9 ± 0.07a |
| CAE | N.D. | 5.8 ± 0.31a | 11.1 ± 0.05b | 5.8 ± 0.31a | |
| XAE | N.D. | 5.0 ± 0.07a | 14.5 ± 0.13b | 5.0 ± 0.07a | |
| GAE | N.D. | 8.3 ± 0.01b | 8.3 ± 0.07a | 8.3 ± 0.01b | |
| CEAE | N.D. | 9.1 ± 0.03b | 7.7 ± 0.05a | 9.1 ± 0.03b | |
| Rutin | CK | 1.8 ± 0.02a | N.D. | 5.8 ± 0.11d | 1.8 ± 0.02a |
| CAE | 2.0 ± 0.07b | N.D. | 3.5 ± 0.08b | 2.0 ± 0.07b | |
| XAE | 1.8 ± 0.04a | N.D. | 4.3 ± 0.02c | 1.8 ± 0.04a | |
| GAE | 0.5 ± 0.01b | N.D. | 3.3 ± 0.11b | 0.5 ± 0.01b | |
| CEAE | 0.2 ± 0.02c | N.D. | 2.7 ± 0.06a | 0.2 ± 0.02c | |
| p-Coumaric acid | CK | 15.8 ± 0.21a | 9.4 ± 0.29a | 136.8 ± 0.89d | 25.2 ± 0.50a |
| CAE | 21.4 ± 0.09a | 11.6 ± 0.17b | 124.4 ± 1.61c | 32.9 ± 0.31b | |
| XAE | 14.4 ± 0.07a | 9.3 ± 1.21a | 148.3 ± 2.35d | 23.7 ± 1.28a | |
| GAE | 27.7 ± 0.05b | 15.2 ± 0.67c | 82.7 ± 2.01b | 42.8 ± 1.01c | |
| CEAE | 29.6 ± 0.08b | 17.7 ± 0.18d | 34.9 ± 1.01a | 47.6 ± 0.63d | |
| Isoquercitrin | CK | 37.1 ± 0.43b | 26.5 ± 0.53a | 19.6 ± 0.23d | 63.6 ± 0.56a |
| CAE | 41.2 ± 0.91c | 27.7 ± 0.15b | 10.3 ± 1.01c | 68.9 ± 0.78b | |
| XAE | 35.5 ± 0.16a | 27.7 ± 0.45a | 12.3 ± 0.97e | 62.9 ± 0.08a | |
| GAE | 20.8 ± 0.34d | 31.2 ± 0.21b | 6.7 ± 0.26b | 52.0 ± 2.01c | |
| CEAE | 18.6 ± 0.79e | 32.3 ± 0.19b | 5.6 ± 0.31a | 51.0 ± 1.23d | |
| Sinapic acid | CK | 4.7 ± 0.09a | N.D. | 5.6 ± 0.23d | 4.7 ± 0.09a |
| CAE | 2.3 ± 0.03b | N.D. | 8.3 ± 1.01c | 2.3 ± 0.03b | |
| XAE | 2.1 ± 0.01a | N.D. | 6.2 ± 0.97e | 2.1 ± 0.01a | |
| GAE | 3.4 ± 0.02a | N.D. | 8.5 ± 0.26b | 3.4 ± 0.02a | |
| CEAE | 1.5 ± 0.02d | N.D. | 7.3 ± 0.31a | 1.5 ± 0.02d | |
| Ferulic acid | CK | N.D. | N.D. | 10.5 ± 0.19d | N.D. |
| CAE | N.D. | N.D. | 8.8 ± 0.13c | N.D. | |
| XAE | N.D. | N.D. | 9.9 ± 0.31c | N.D. | |
| GAE | N.D. | 5.6 ± 0.19a | 6.4 ± 0.08b | 5.6 ± 0.19a | |
| CEAE | N.D. | 7.5 ± 0.31b | 5.6 ± 0.11a | 7.5 ± 0.31b | |
| Quercetin-3-O-β-d-xylopyranoside | CK | 53.6 ± 1.21a | N.D. | N.D. | 53.6 ± 1.21a |
| CAE | 59.5 ± 0.61b | N.D. | N.D. | 59.5 ± 0.61b | |
| XAE | 48.2 ± 0.34a | N.D. | N.D. | 48.2 ± 0.34a | |
| GAE | 61.3 ± 0.48c | N.D. | N.D. | 61.3 ± 0.48c | |
| CEAE | 72.9 ± 1.05d | N.D. | N.D. | 72.9 ± 1.05d | |
| Quercetin-3-O-α-l-arabinoside | CK | 87.2 ± 2.67b | N.D. | 11.4 ± 0.41c | 87.2 ± 2.67b |
| CAE | 113.2 ± 3.01c | N.D. | 17.4 ± 0.26d | 113.2 ± 3.01c | |
| XAE | 89.6 ± 0.29b | N.D. | 10.5 ± 1.11c | 89.6 ± 0.29b | |
| GAE | 68.2 ± 2.31d | 15.1 ± 1.01b | 10.2 ± 0.07b | 83.2 ± 3.32d | |
| CEAE | 11.1 ± 1.61a | 4.2 ± 0.08a | 7.1 ± 0.03a | 15.3 ± 1.57a | |
| Avicularin | CK | 258.1 ± 1.79b | N.D. | 16.4 ± 0.11c | 258.1 ± 1.79b |
| CAE | 245.6 ± 1.94c | N.D. | 14.2 ± 0.14c | 245.6 ± 1.94c | |
| XAE | 249.4 ± 3.27b | N.D. | 15.7 ± 0.23c | 249.4 ± 3.27b | |
| GAE | 71.2 ± 2.29c | 1.0 ± 0.08a | 10.3 ± 0.31b | 72.3 ± 2.29c | |
| CEAE | 17.8 ± 0.21a | 1.2 ± 0.02a | 6.3 ± 0.05a | 18.9 ± 0.23a | |
| Quercitrin | CK | 107.1 ± 1.68b | N.D. | 11.3 ± 0.01b | 107.1 ± 1.68b |
| CAE | 118.1 ± 1.17c | N.D. | 9.6 ± 0.02b | 118.1 ± 1.17c | |
| XAE | 97.1 ± 1.45a | N.D. | 10.4 ± 0.03b | 97.1 ± 1.45a | |
| GAE | 123.8 ± 2.64d | N.D. | 5.2 ± 0.01a | 123.8 ± 2.64d | |
| CEAE | 112.9 ± 2.15b | 21.4 ± 0.37b | 4.9 ± 0.01a | 134.3 ± 2.52b | |
| Quercetin | CK | 34.8 ± 0.57a | 39.0 ± 1.61a | 113.1 ± 0.31e | 73.8 ± 2.14a |
| CAE | 59.5 ± 0.21b | 47.2 ± 1.00b | 98.4 ± 2.19c | 106.7 ± 1.21b | |
| XAE | 37.6 ± 1.21a | 35.2 ± 0.29a | 109.3 ± 1.45d | 72.8 ± 1.36a | |
| GAE | 134.1 ± 0.21c | 65.0 ± 1.15c | 25.4 ± 1.23b | 199.0 ± 1.36c | |
| CEAE | 177.0 ± 2.03d | 81.9 ± 1.29d | 10.3 ± 0.07a | 258.9 ± 3.32d | |
| Kaempferol | CK | 5.1 ± 0.02b | N.D. | N.D. | 5.1 ± 0.02b |
| CAE | 6.0 ± 0.07c | N.D. | N.D. | 6.0 ± 0.07c | |
| XAE | 5.0 ± 0.02a | N.D. | N.D. | 5.0 ± 0.02a | |
| GAE | 7.0 ± 0.03c | N.D. | N.D. | 7.0 ± 0.03c | |
| CEAE | 11.2 ± 0.01d | N.D. | N.D. | 11.2 ± 0.01d |
CK, untreated; CAE, cellulase-assisted extraction; XAE, xylanase-assisted extraction; GAE, β-glucosidase-assisted extraction; CEAE, complex enzyme-assisted extraction. Values with different letters in each column are significant following different enzymatic treatment (p < 0.05). N.D. Not detected.
Table 2.
Antioxidant activity of the free, soluble-conjugate, insoluble bound, and total phenolics fractions of guava leaves following different enzyme-assisted extraction.
Table 2.
Antioxidant activity of the free, soluble-conjugate, insoluble bound, and total phenolics fractions of guava leaves following different enzyme-assisted extraction.
| Stage | Antioxidant Activity | |||
|---|---|---|---|---|
| Free | Soluble-Conjugate | Insoluble-Bound | Total Soluble | |
| ABTS value | (mmol TE/g DM) | |||
| CK | 20.6 ± 1.1Aa | 6.5 ± 0.4Ba | 20.2 ± 0.2Aa | 27.1 ± 1.4a |
| CAE | 23.5 ± 0.5Ab | 9.5 ± 1.6Cb | 16.8 ± 0.9Bb | 33.0 ± 2.0b |
| XAE | 18.7 ± 1.0Aa | 7.2 ± 0.4Ba | 20.6 ± 1.5Aa | 25.9 ± 1.4a |
| GAE | 29.0 ± 0.78Ac | 10.8 ± 0.4Bc | 12.2 ± 0.5Bc | 39.9 ± 1.1c |
| CEAE | 36.8 ± 0.4Ad | 17.7 ± 0.1Bd | 7.4 ± 1.2Cd | 55.5 ± 0.5d |
| DPPH value | (mmol TE/g DM) | |||
| CK | 15.4 ± 0.2Ba | 8.0 ± 0.1Ca | 21.3 ± 0.2Aa | 23.4 ± 0.3a |
| CAE | 17.6 ± 0.4Ab | 11.5 ± 0.3Bb | 18.2 ± 1.1Ab | 29.1 ± 0.7b |
| XAE | 15.5 ± 1.09Ba | 7.3 ± 0.9Ca | 22.5 ± 0.5Aa | 22.8 ± 1.9a |
| GAE | 26.2 ± 0.7Ac | 13.6 ± 1.1Cc | 18.4 ± 1.3Bc | 39.7 ± 1.8c |
| CEAE | 35.1 ± 0.04Ad | 17.9 ± 1.2Bd | 11.1 ± 1.0Cd | 53.0 ± 1.3d |
| FARP value | (μmol Fe(II)SE/g DM) | |||
| CK | 83.7 ± 2.0Aa | 43.6 ± 1.0Ca | 56.5 ± 1.4Ba | 127.3 ± 5.5a |
| CAE | 94.8 ± 4.2Ab | 49.7 ± 2.3Bb | 50.5 ± 2.8Bb | 144.4 ± 3.8b |
| XAE | 79.5 ± 1.37Aa | 41.6 ± 3.4Ca | 54.2 ± 1.4Ba | 121.0 ± 6.5a |
| GAE | 111.8 ± 4.7Ac | 60.0 ± 2.1Bc | 37.9 ± 0.9Cc | 171.8 ± 6.1c |
| CEAE | 162.6 ± 2.5Ad | 79.7 ± 3.8Bd | 22.7 ± 1.3Cd | 242.3 ± 7.6d |
CK, untreated; CAE, cellulase-assisted extraction; XAE, xylanase-assisted extraction; GAE, β-glucosidase-assisted extraction; CEAE, complex enzyme-assisted extraction. Each value was expressed as mean ± standard deviation (n = 3). Values with different letters (within row in uppercase letters (A–C), within columns in lowercase letters (a–d)) are significantly different (p < 0.05).
Table 3.
Regression equation, R2, LOD, LOQ, linear range, and recovery rate analysis results of all phenolics analytes.
Table 3.
Regression equation, R2, LOD, LOQ, linear range, and recovery rate analysis results of all phenolics analytes.
| Analytes | Regression Equation a | R2 | LOD b (μg/mL) | LOQ b (μg/mL) | Linear Range (μg/mL) | Recovery Rate (%, n = 4) |
|---|---|---|---|---|---|---|
| Gallic acid | Y = 3.56 × 10⁷X + 2.06 × 10⁴ | 0.9921 | 0.024 | 0.076 | 5.64–70.5 | 98.99 |
| Chlorogenic acid | Y = 2.51 × 10⁷X + 1.93 × 10⁴ | 0.9931 | 0.046 | 0.065 | 0.5–50 | 99.13 |
| p-hydroxybenzoic acid | Y = 1.67 × 10⁷X + 3.11 × 10⁴ | 0.9978 | 0.078 | 0.073 | 0.5–50 | 97.98 |
| Caffeic acid | Y = 8.53 × 10⁶X + 1.48 × 10⁴ | 0.9989 | 0.009 | 0.021 | 0.5–50 | 100.01 |
| Rutin | Y = 1.99 × 10⁷X + 5.37 × 10⁴ | 0.9989 | 0.019 | 0.053 | 6–75 | 99.02 |
| p-Coumaric acid | Y = 6.97 × 10⁷X + 1.13 × 10⁵ | 0.9981 | 0.031 | 0.024 | 0.5–50 | 98.99 |
| Isoquercitrin | Y = 1.24 × 10⁷X + 1.40 × 10³ | 0.9992 | 0.067 | 0.048 | 6–75 | 100.13 |
| Sinapic acid | Y = 1.87 × 10⁷X + 2.93 × 10⁴ | 0.9991 | 0.078 | 0.017 | 0.5–50 | 95.31 |
| Ferulic acid | Y = 4.68 × 10⁷X + 6.91 × 10⁴ | 0.9978 | 0.065 | 0.029 | 0.5–50 | 99.89 |
| Quercetin-3-O-β-d-xylopyranoside | Y = 1.78 × 10⁷X + 1.40 × 10⁴ | 0.9989 | 0.039 | 0.054 | 6–75 | 99.78 |
| Quercetin-3-O-α-l-arabinoside | Y = 1.48 × 10⁷X + 2.03 × 10³ | 0.9996 | 0.048 | 0.051 | 6–75 | 98.97 |
| Avicularin | Y = 1.45 × 10⁷X + 1.96 × 10³ | 0.9997 | 0.051 | 0.023 | 6–75 | 99.86 |
| Quercitrin | Y = 1.30 × 10⁷X + 5.98 × 10³ | 0.9978 | 0.024 | 0.018 | 6–75 | 99.13 |
| Quercetin | Y = 1.74 × 10⁷X − 1.45 × 10⁴ | 0.9992 | 0.031 | 0.010 | 2–75 | 101.07 |
| Kaempferol | Y = 8.83 × 10⁷X − 2.23 × 10⁴ | 0.9992 | 0.076 | 0.037 | 6–75 | 99.65 |
a Y representing the peak area; X representing the standard concentration; b LOD, limit of detection (S/N = 3); LOQ, limit of quantification (S/N = 10).
© 2017 by the authors. Licensee MDPI, Basel, Switzerland. This article is an open access article distributed under the terms and conditions of the Creative Commons Attribution (CC BY) license (http://creativecommons.org/licenses/by/4.0/).
Share and Cite
MDPI and ACS Style
Wang, L.; Wu, Y.; Liu, Y.; Wu, Z. Complex Enzyme-Assisted Extraction Releases Antioxidative Phenolic Compositions from Guava Leaves. Molecules 2017, 22, 1648. https://0-doi-org.brum.beds.ac.uk/10.3390/molecules22101648
AMA Style
Wang L, Wu Y, Liu Y, Wu Z. Complex Enzyme-Assisted Extraction Releases Antioxidative Phenolic Compositions from Guava Leaves. Molecules. 2017; 22(10):1648. https://0-doi-org.brum.beds.ac.uk/10.3390/molecules22101648
Chicago/Turabian StyleWang, Lu, Yanan Wu, Yan Liu, and Zhenqiang Wu. 2017. "Complex Enzyme-Assisted Extraction Releases Antioxidative Phenolic Compositions from Guava Leaves" Molecules 22, no. 10: 1648. https://0-doi-org.brum.beds.ac.uk/10.3390/molecules22101648