GPCR Modulation of Thieno[2,3-b]pyridine Anti-Proliferative Agents


 ,
,  ,
,  and
and
Abstract
:
1. Introduction
2. Results
2.1. PLC-δ1
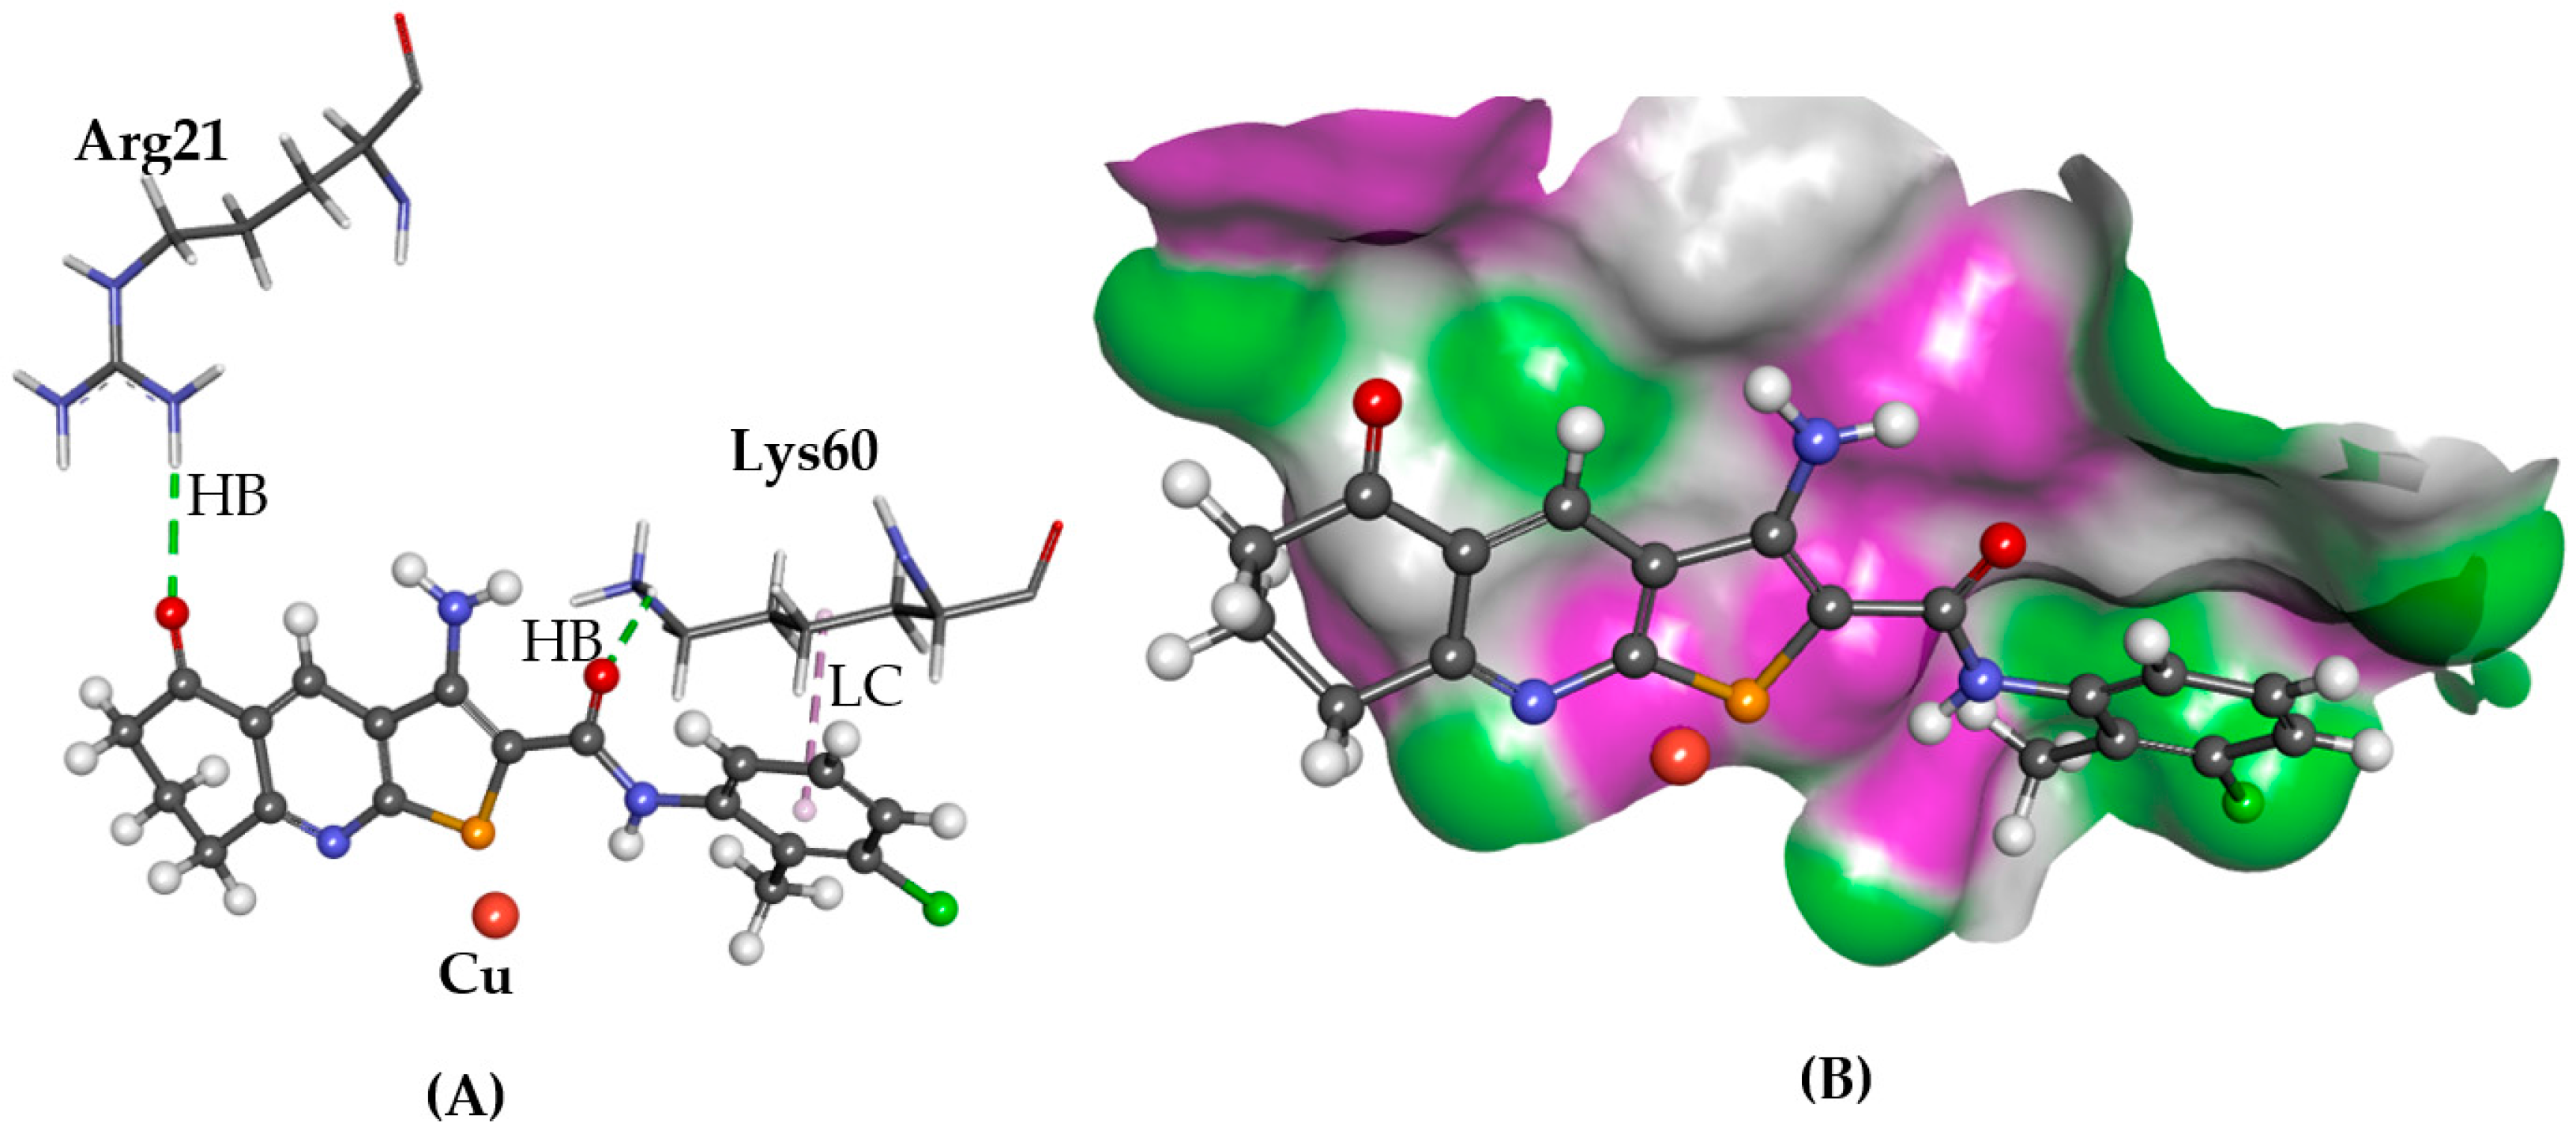
2.2. ATOX1
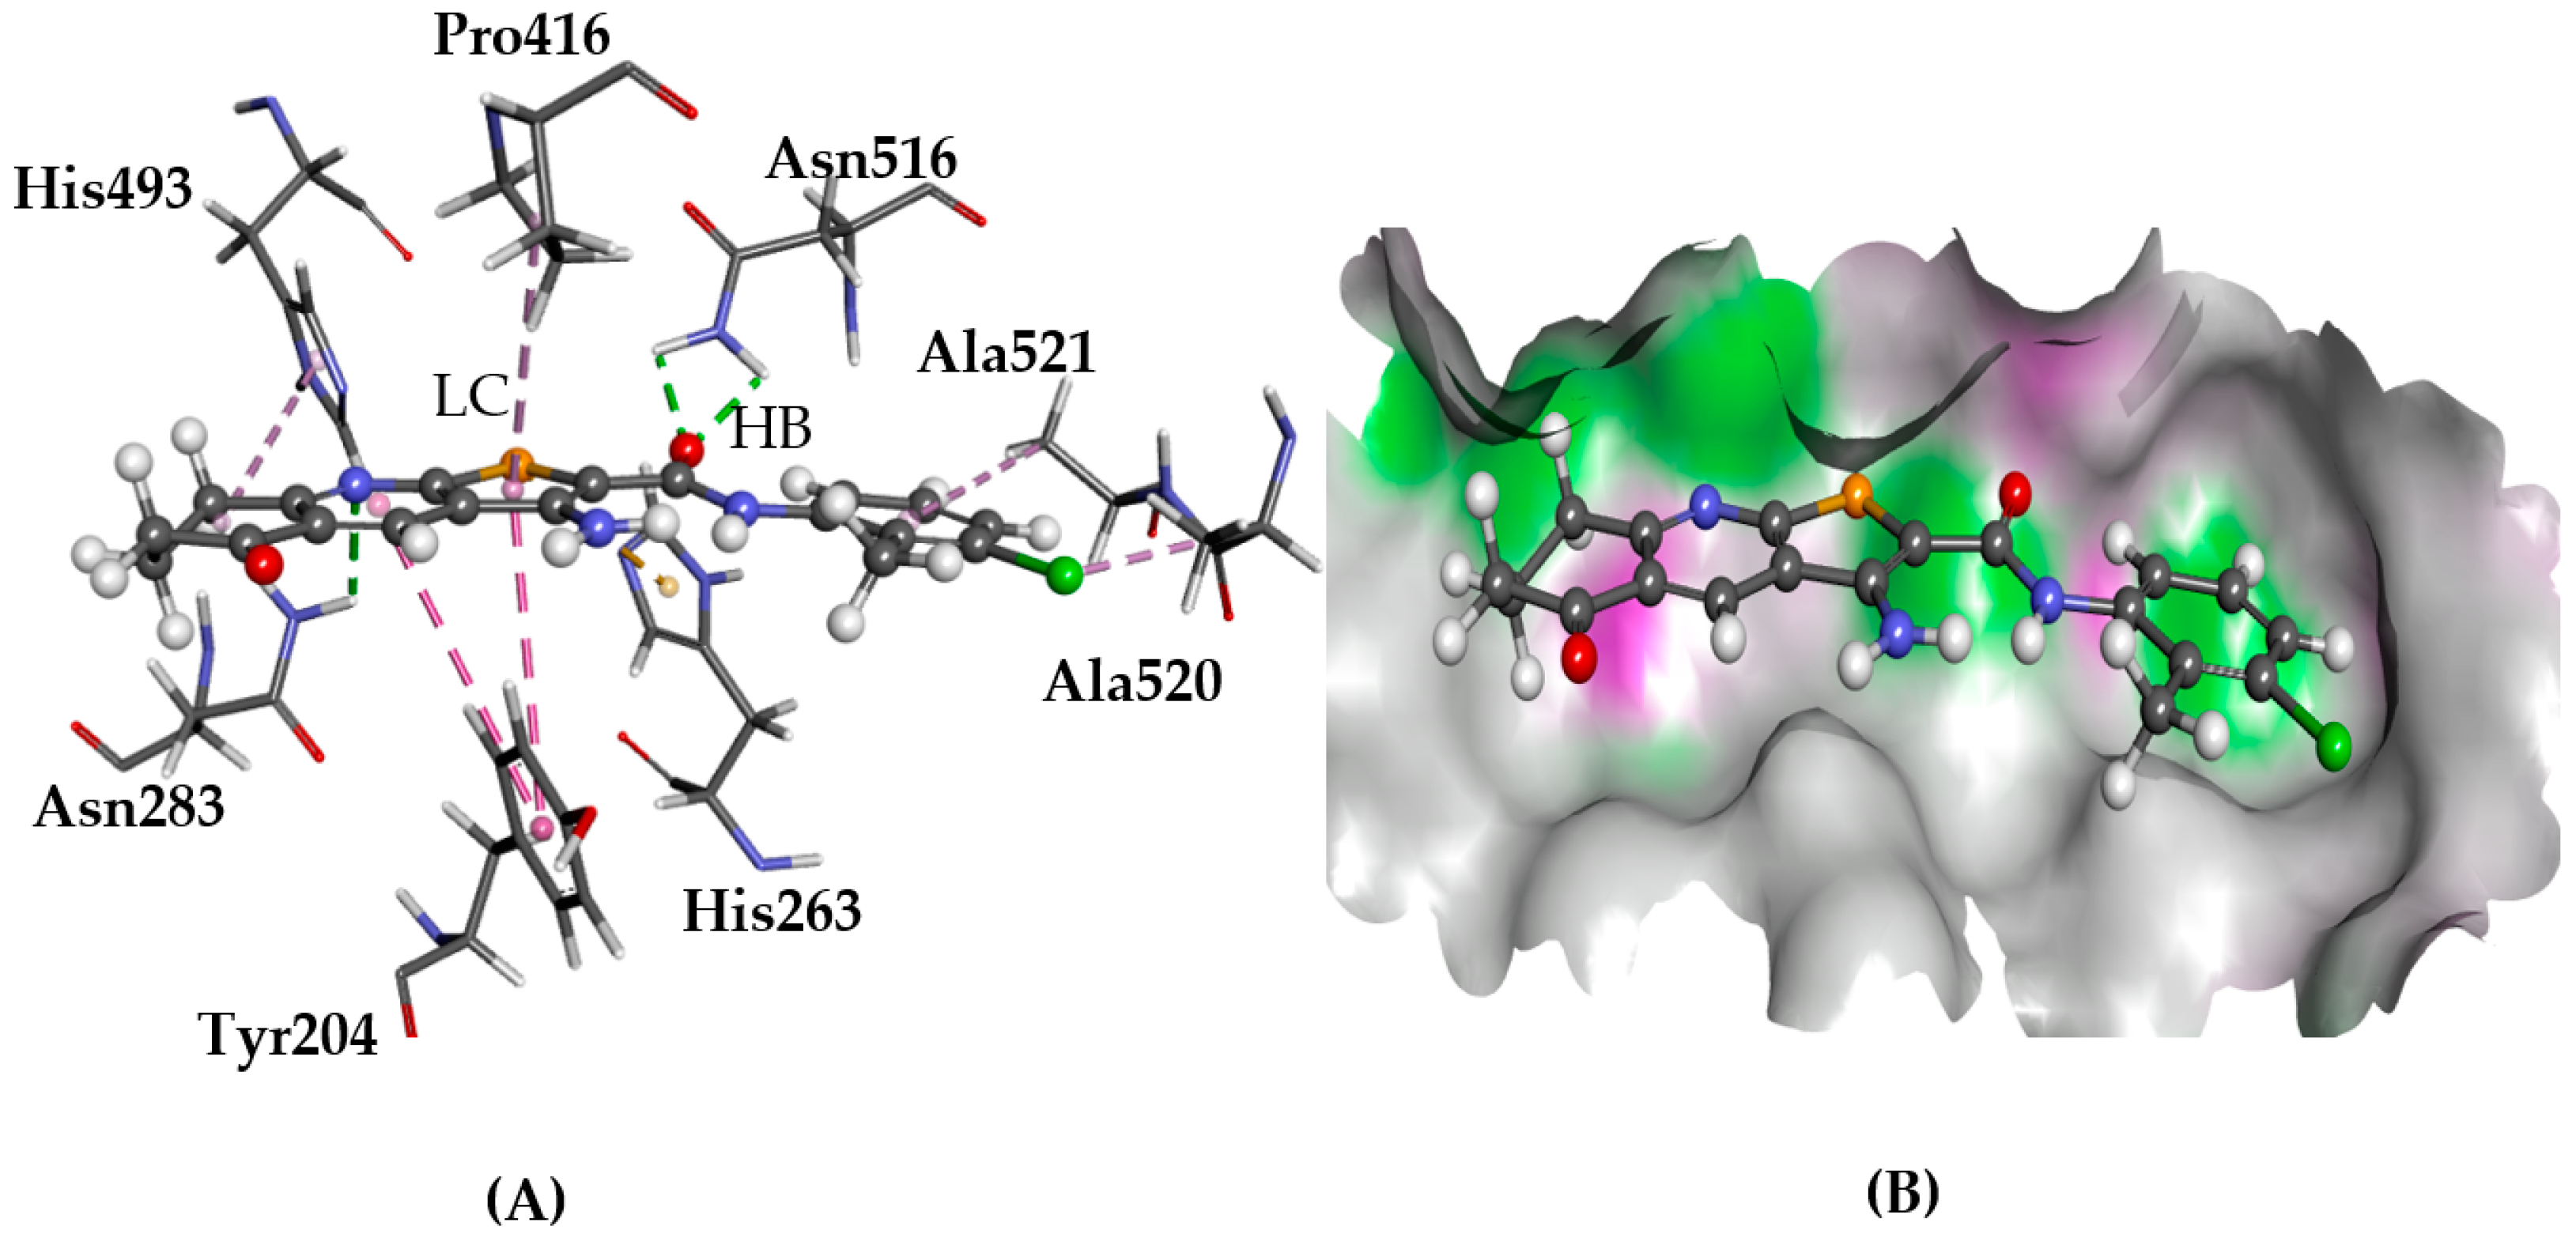
2.3. TDP1
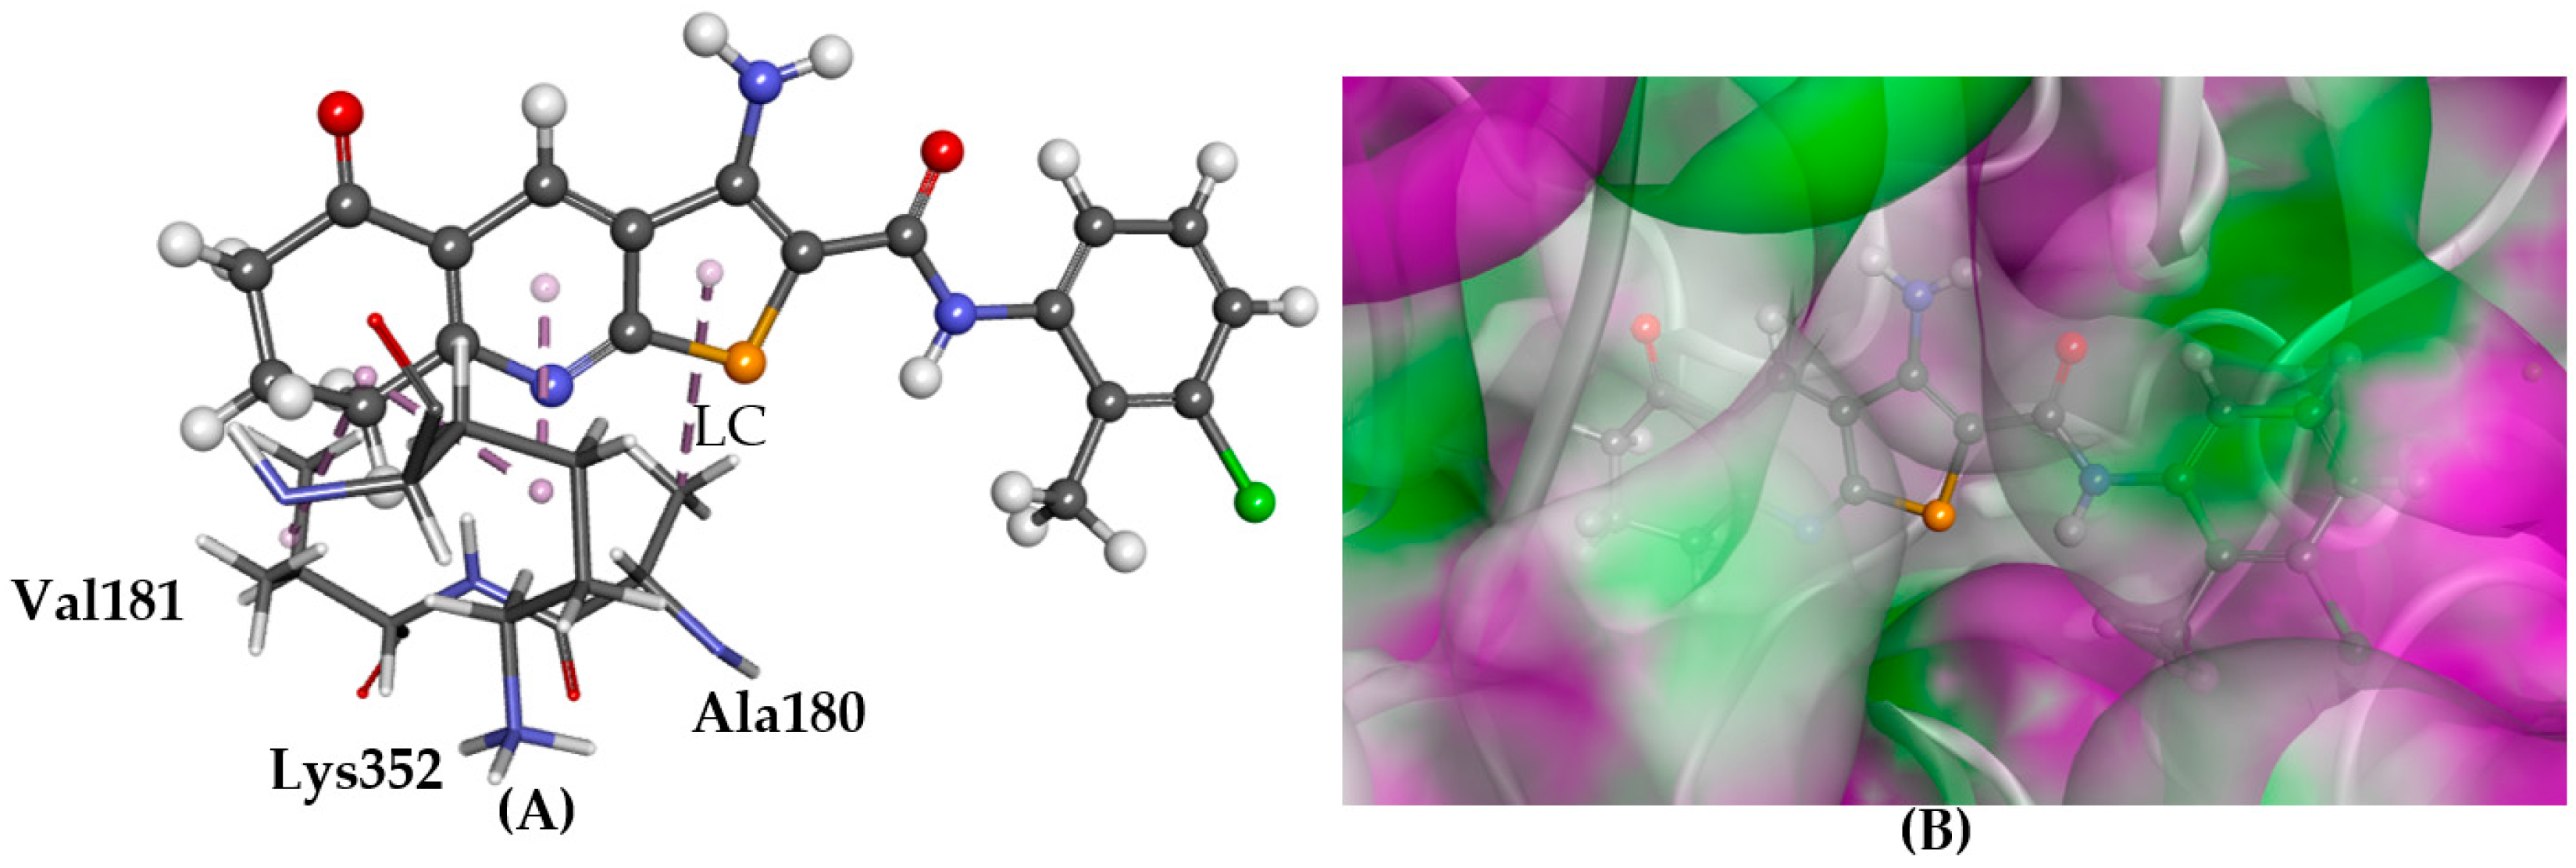
2.4. Tubulin
2.5. Testing for GPCRs Activity
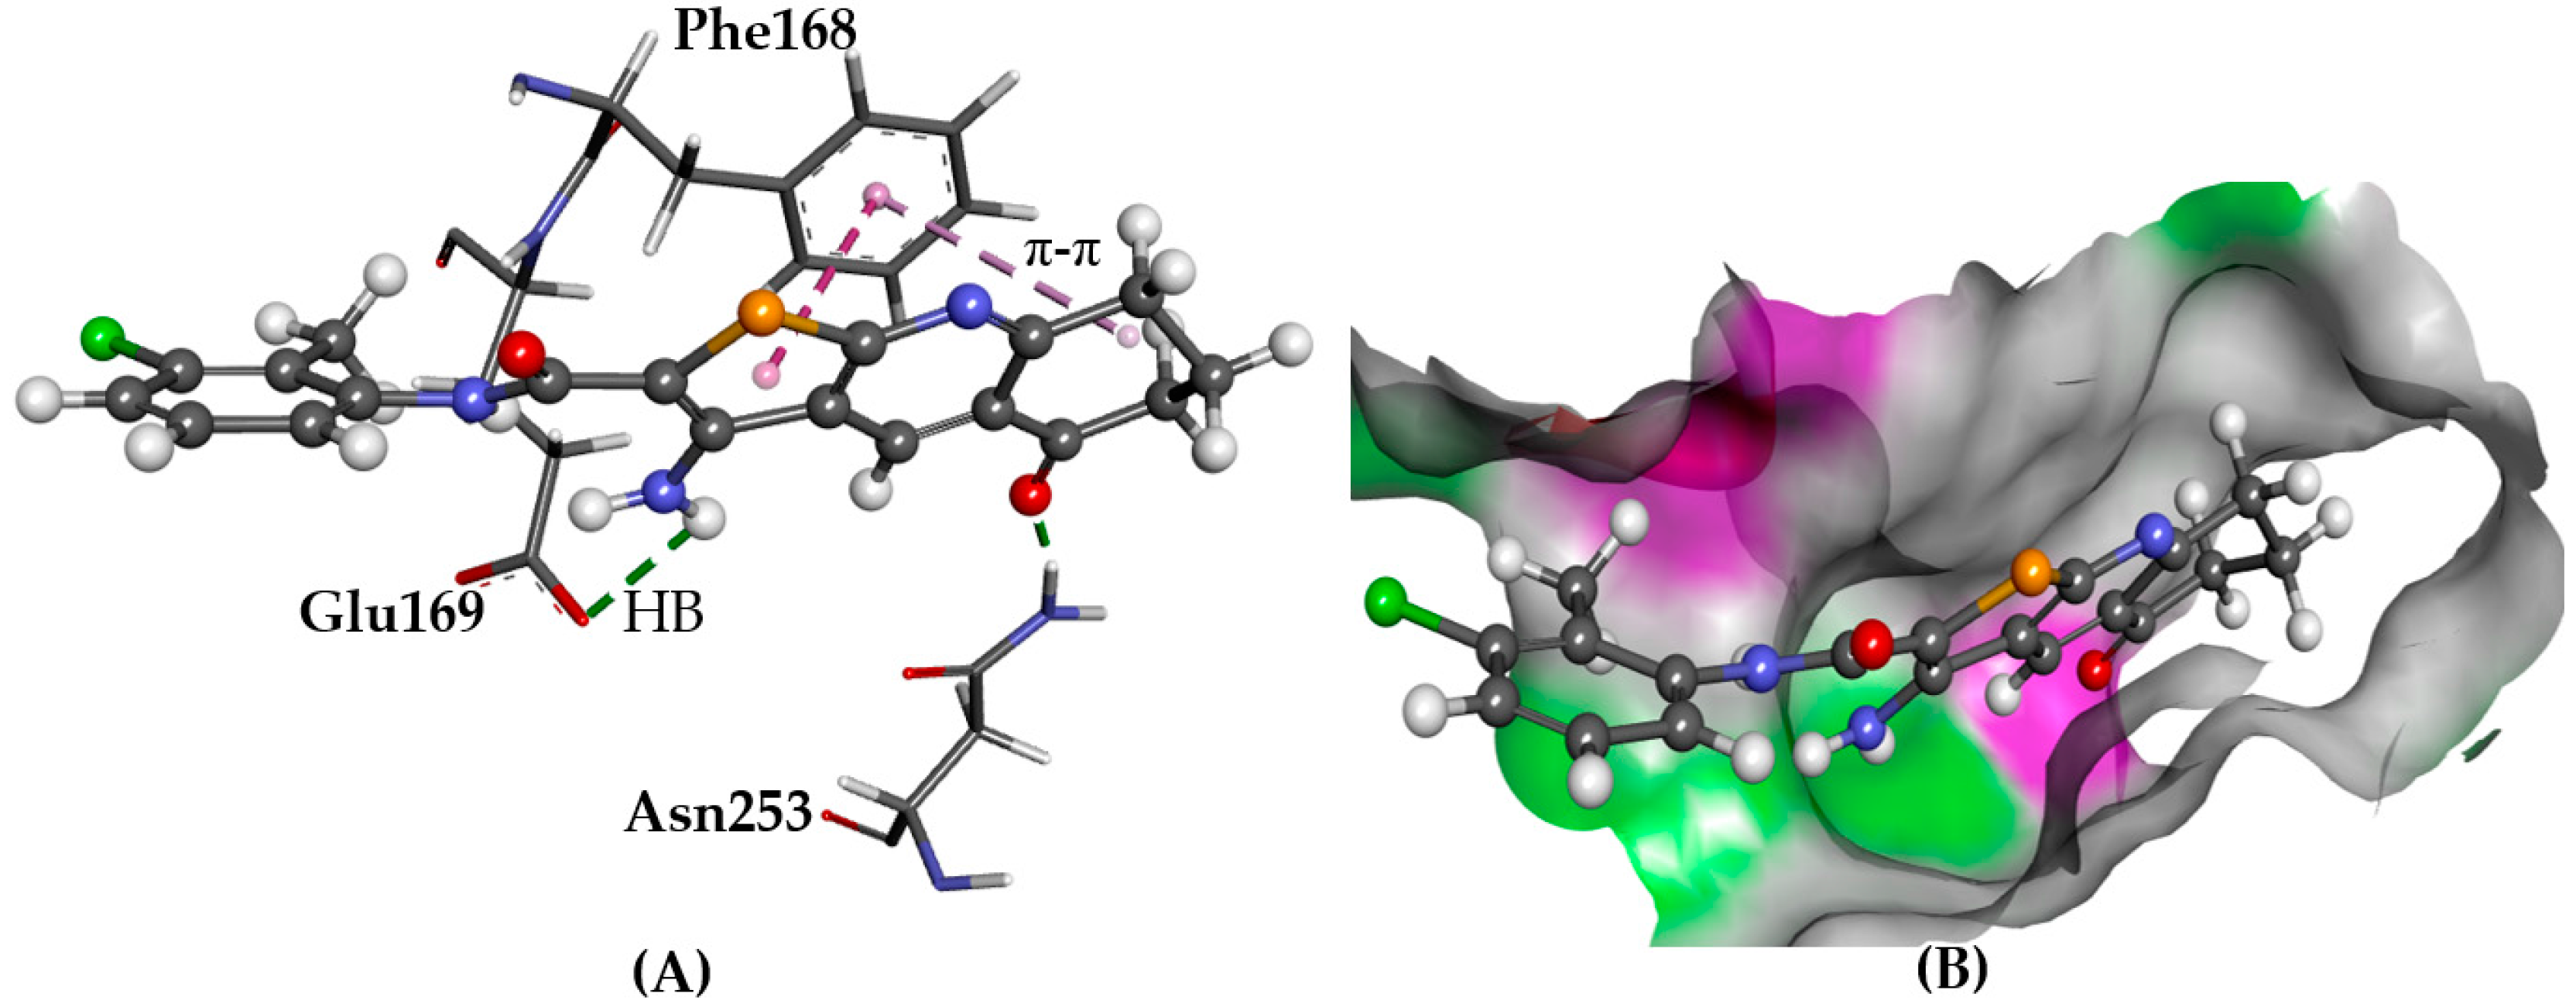
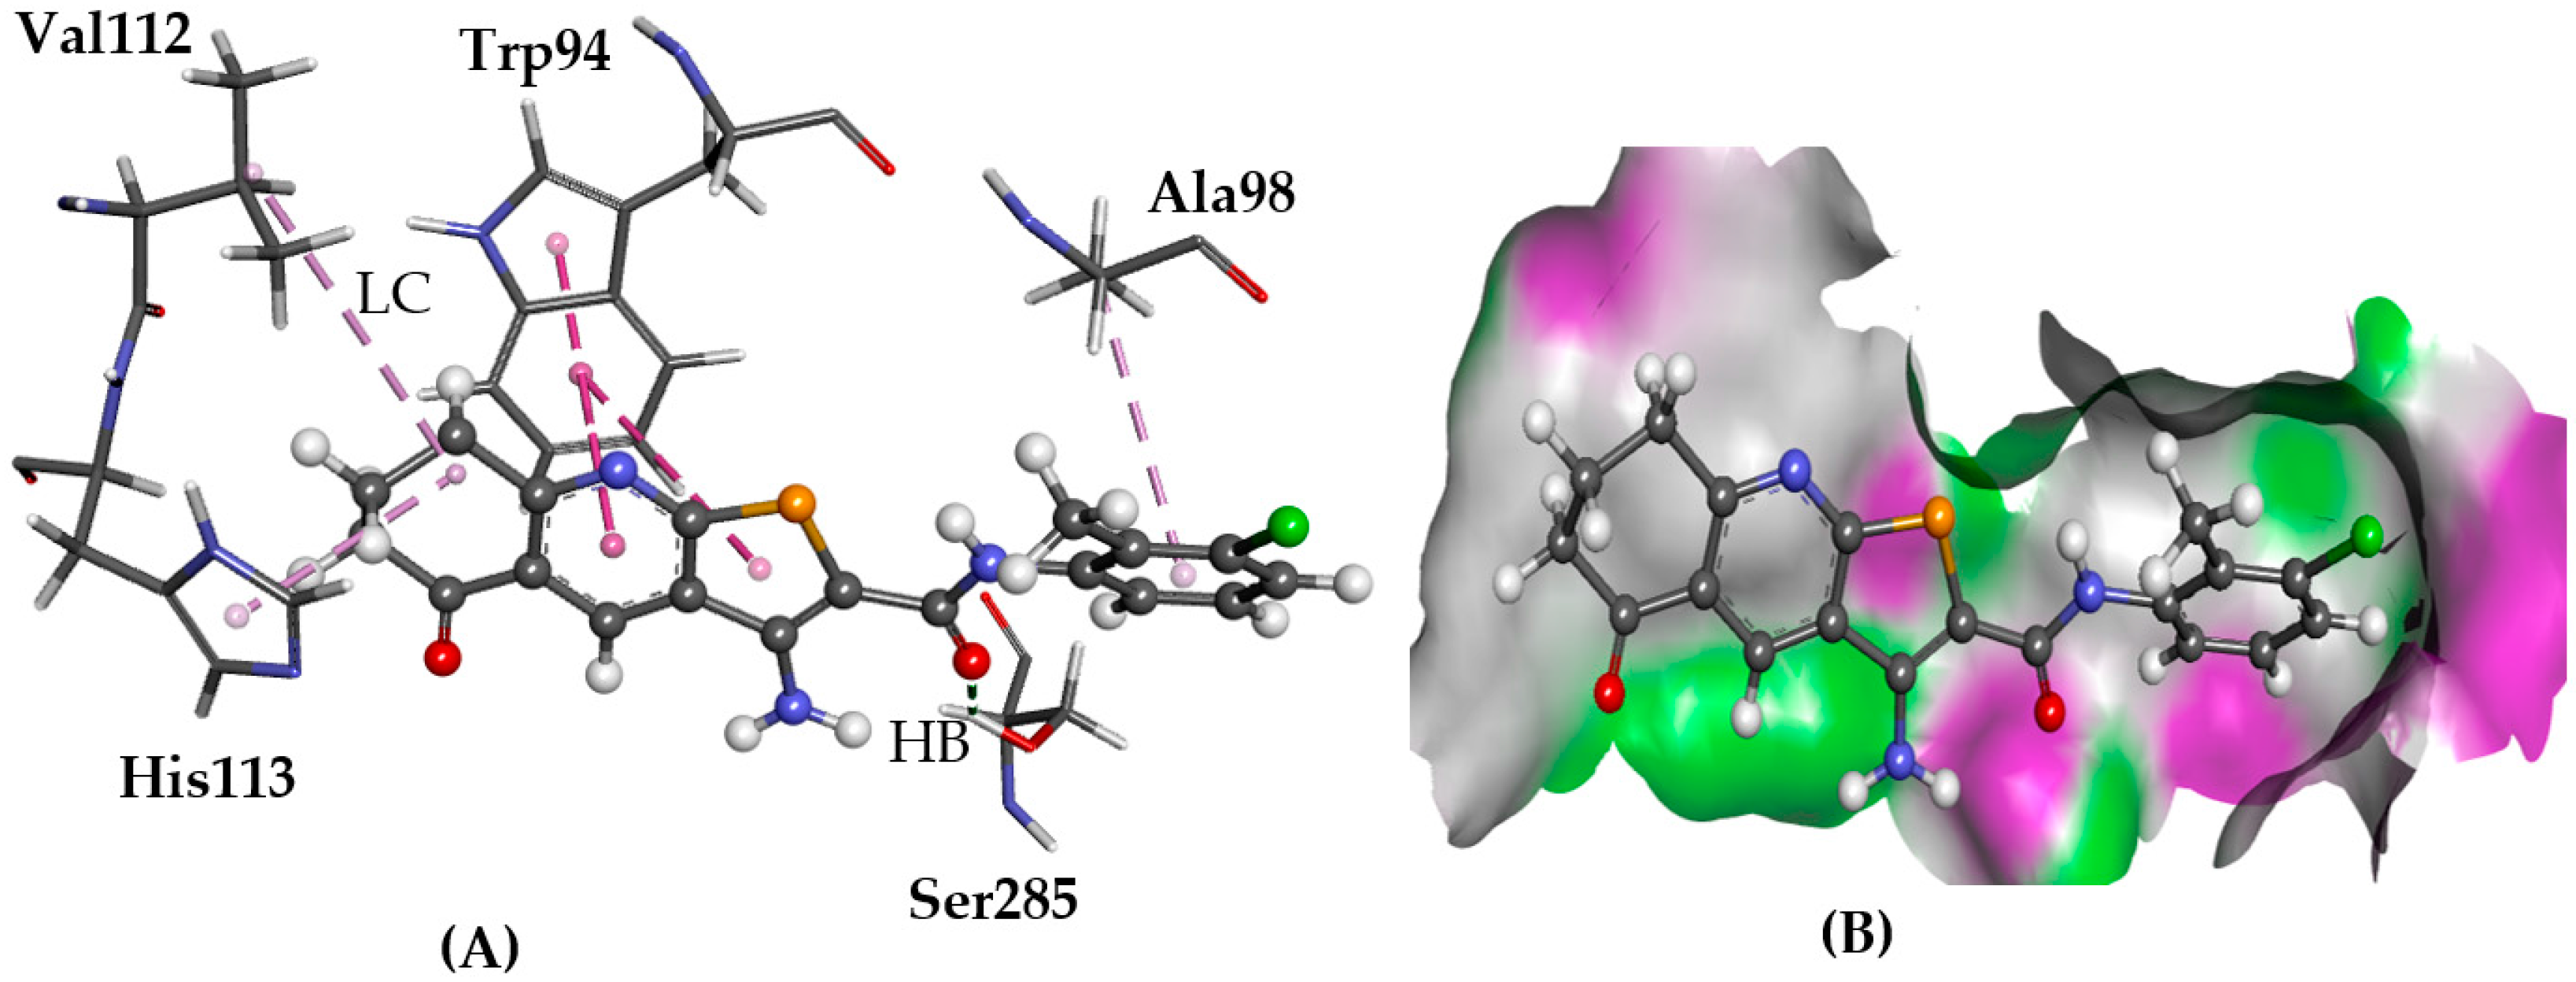
2.5.1. A2AAR
2.5.2. CXCR4
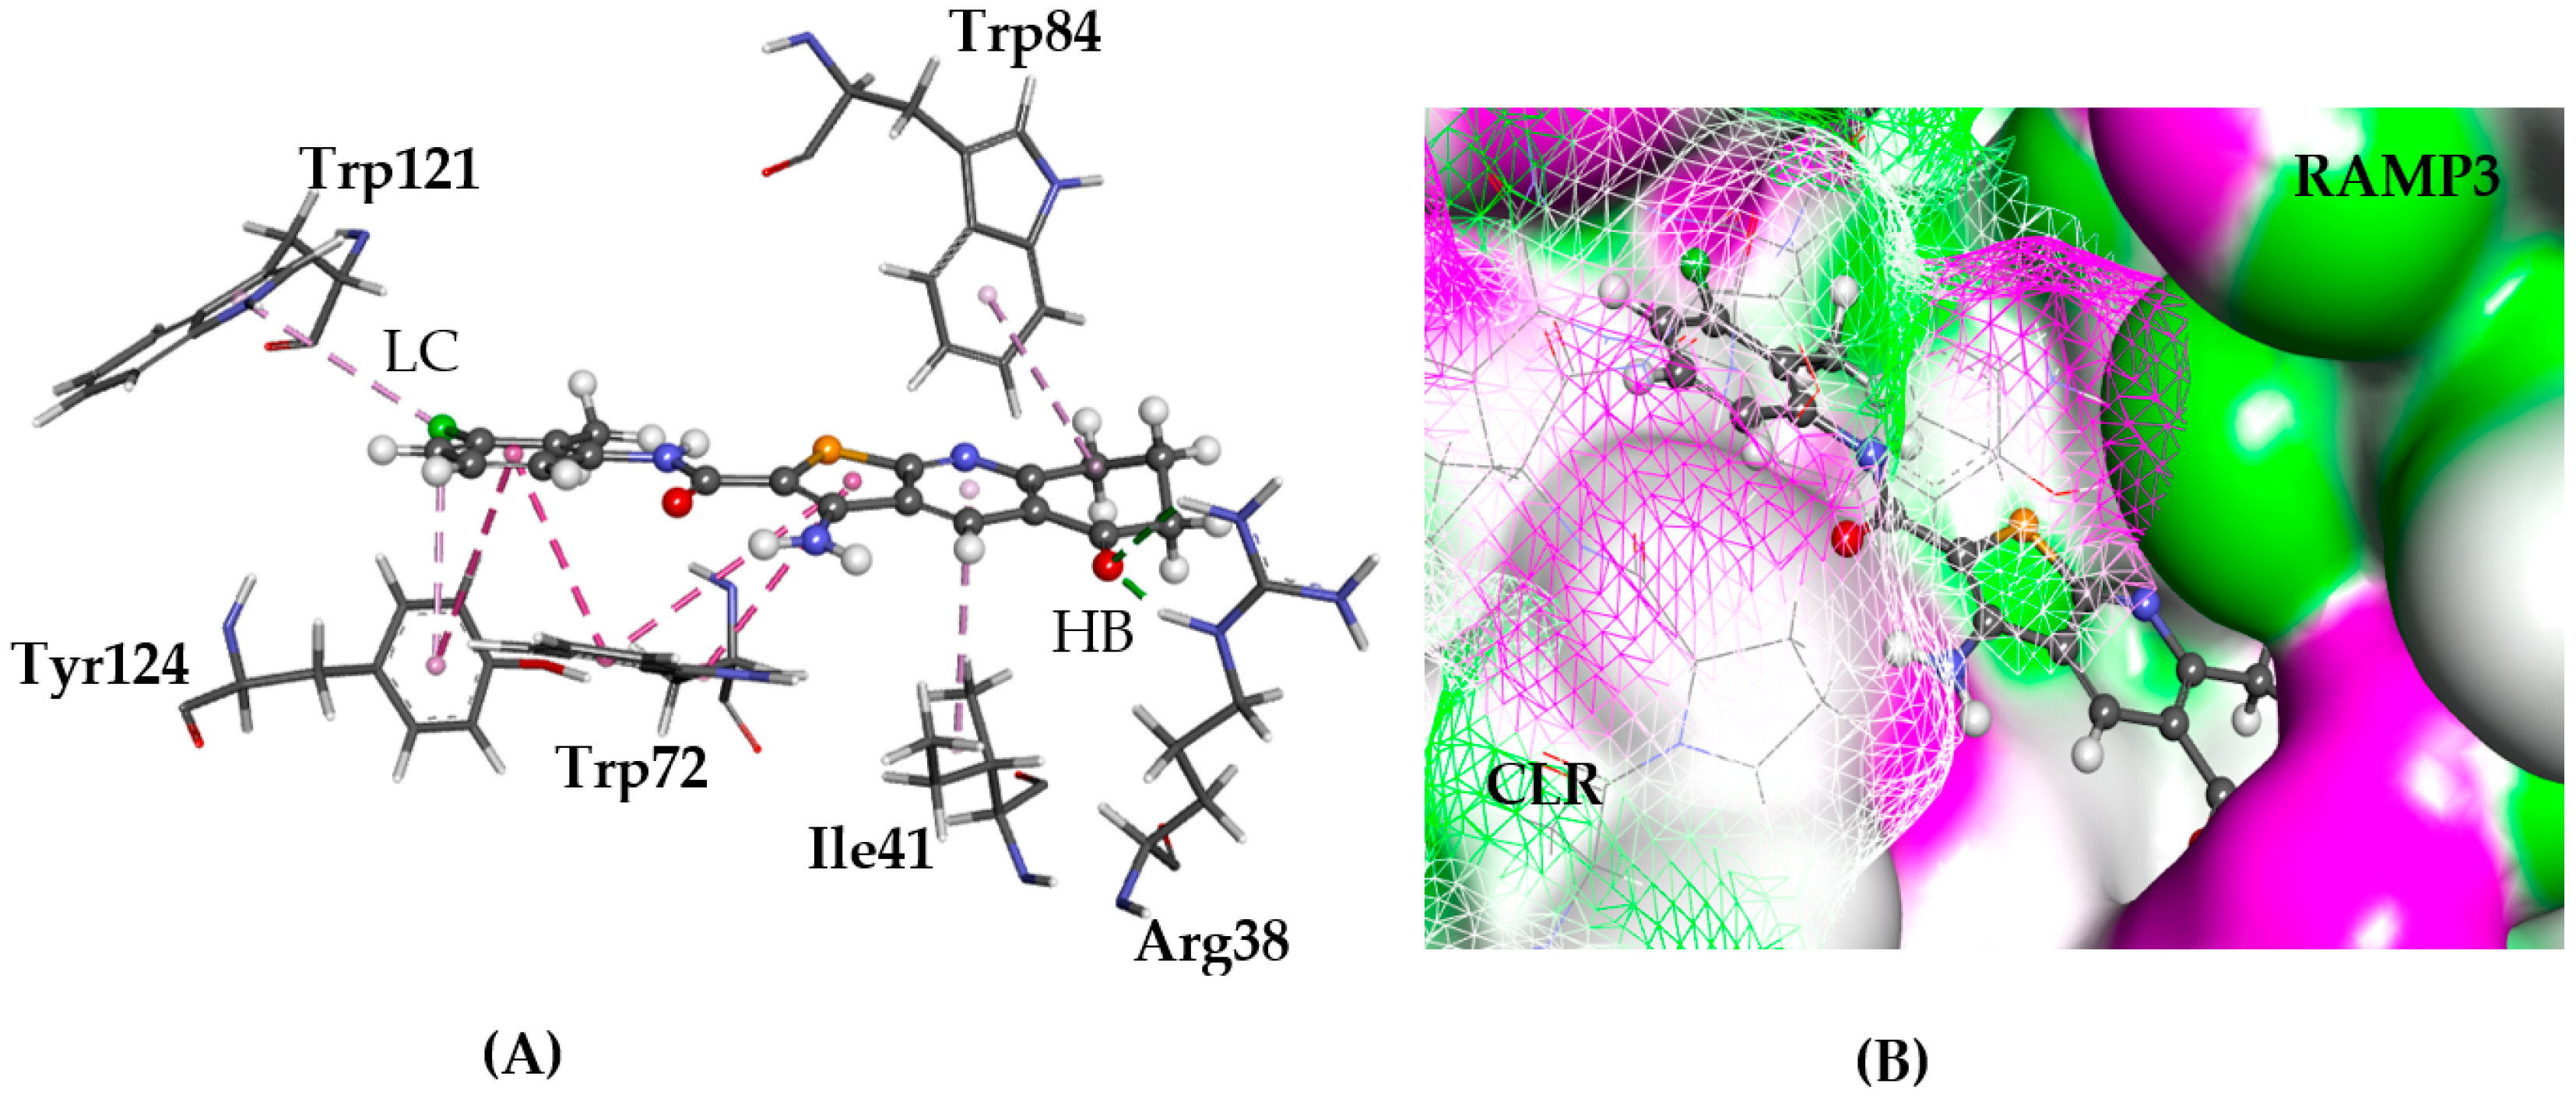
2.5.3. CRL-RAMP3
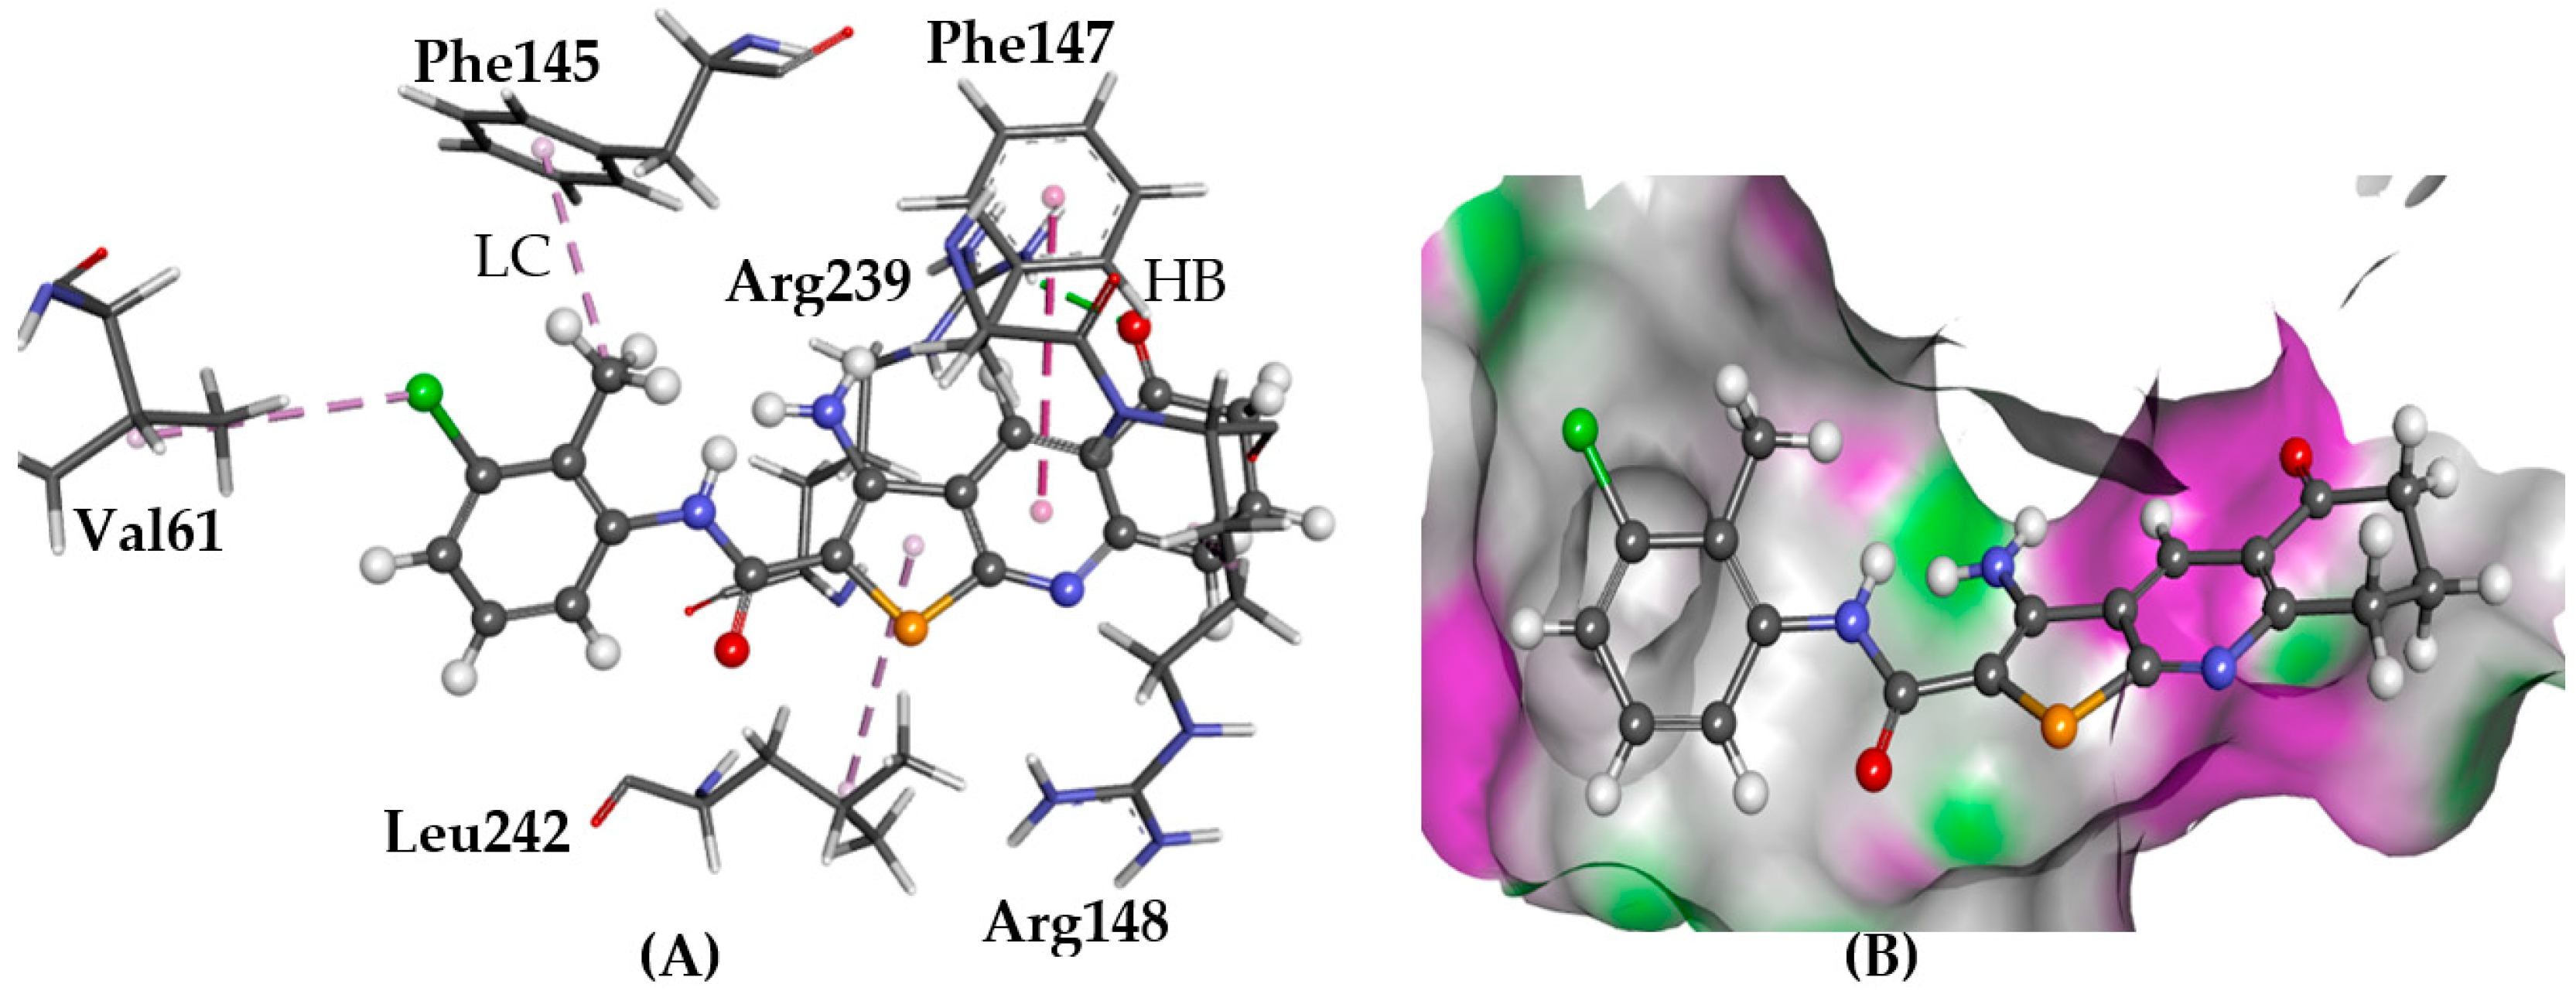
2.5.4. GPR35
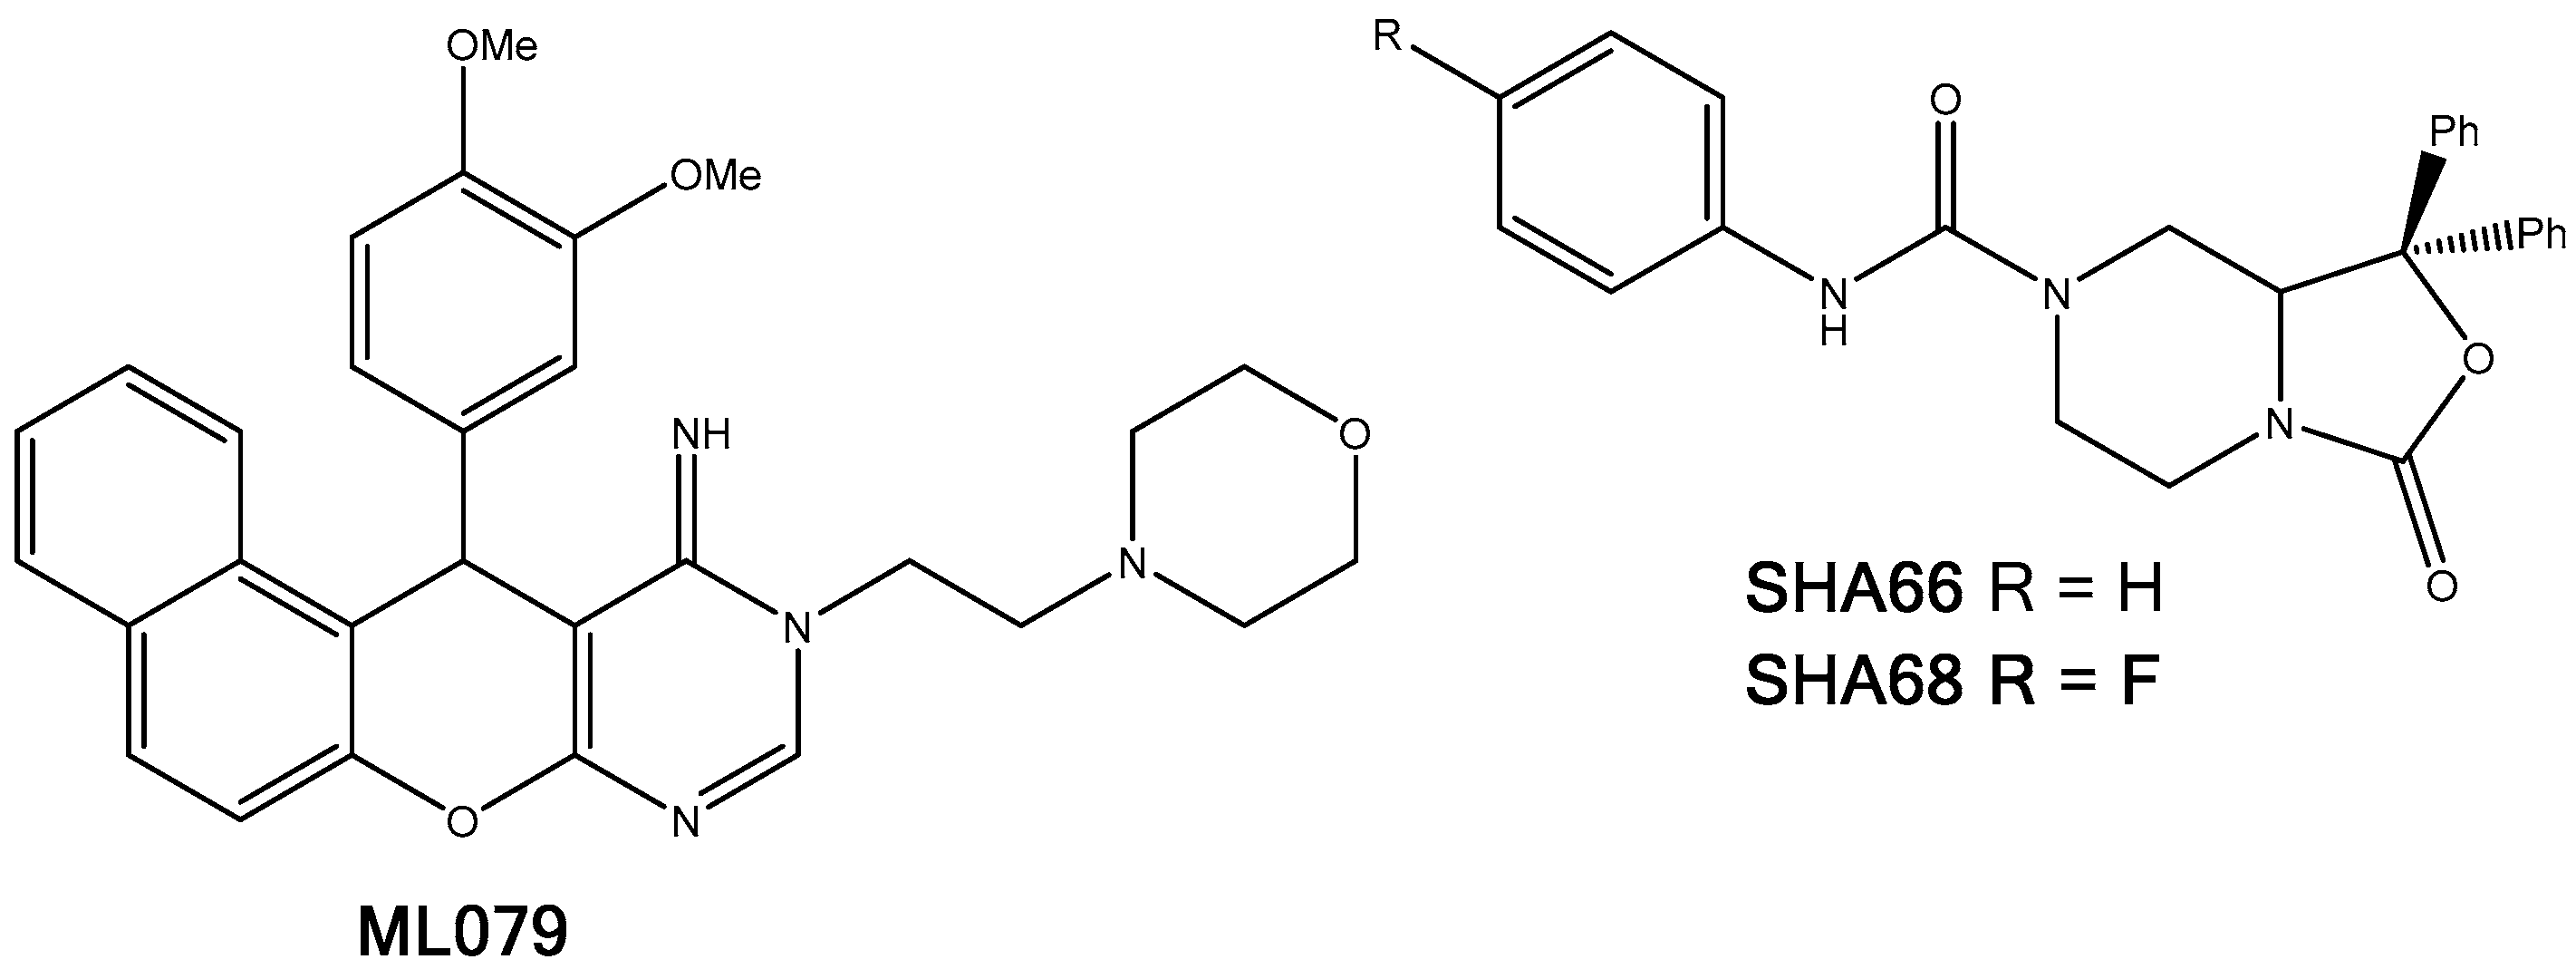
2.5.5. NPSRb1
2.5.6. PRLHR
3. Discussion
Transcript Levels in the Cancer Cells Affected by TPs
4. Materials and Methods
4.1. Molecular Modelling
4.2. Homology Modelling
4.3. Biological Testing
5. Conclusions
Supplementary Materials
Acknowledgments
Author Contributions
Conflicts of Interest
References
- Feng, L.; Reynisdóttir, I.; Reynisson, J. The effect of PLC-gamma2 inhibitors on the growth of human tumour cells. Eur. J. Med. Chem. 2012, 54, 463–469. [Google Scholar] [CrossRef] [PubMed]
- Reynisson, J.; Court, W.; O’Neill, C.; Day, J.; Patterson, L.; McDonald, E.; Workman, P.; Katan, M.; Eccles, S.A. The identification of novel PLC-c inhibitors using virtual high throughput screening. Bioorg. Med. Chem. 2009, 17, 3169–3176. [Google Scholar] [CrossRef] [PubMed]
- Shoemaker, R.H. The NCI60 Human Tumour Cell line Anticancer Drug Screen. Nat. Rev. Drug Dis. 2006, 6, 813–823. [Google Scholar] [CrossRef] [PubMed]
- Hung, J.M.; Arabshahi, H.J.; Leung, E.; Reynisson, J.; Barker, D. Synthesis and cytotoxicity of thieno[2,3-b]pyridine and furo[2,3-b]pyridine derivatives. Eur. J. Med. Chem. 2014, 86, 420–437. [Google Scholar] [CrossRef] [PubMed]
- Arabshahi, H.J.; Leung, E.; Barker, D.; Reynisson, J. The development of thieno[2,3-b]pyridine analogues as anticancer agents applying in silico methods. MedChemComm 2014, 5, 186–191. [Google Scholar] [CrossRef]
- Leung, E.; Pilkington, L.I.; van Rensburg, M.; Jeon, C.Y.; Song, M.; Arabshahi, H.J.; De Zoysa, G.H.; Sarojini, V.; Denny, W.A.; Reynisson, J.; et al. Synthesis and cytotoxicity of thieno[2,3-b]quinoline-2-carboxamide and cycloalkyl[b]thieno [3,2-e]pyridine-2-carboxamide derivatives. Bioorg. Med. Chem. 2016, 24, 1142–1154. [Google Scholar] [CrossRef] [PubMed]
- Van Rensburg, M.; Leung, E.; Haverkate, N.A.; Eurtivong, C.; Pilkington, L.I.; Reynisson, J.; Barker, D. Synthesis and antiproliferative activity of 2-chlorophenyl carboxamide thienopyridines. Bioorg. Med. Chem. Lett. 2017, 27, 135–138. [Google Scholar] [CrossRef] [PubMed]
- Leung, E.; Hung, J.M.; Barker, D.; Reynisson, J. The effect of a thieno[2,3-b]pyridine PLC-γ inhibitor on DNA synthesis, morphology, migration and cell cycle of breast cancer cells. MedChemComm 2014, 5, 99–106. [Google Scholar] [CrossRef]
- Reynisson, J.; Jaiswal, J.K.; Barker, D.; D’mello, S.A.N.; Denny, W.A.; Baguley, B.; Leung, E. Evidence that phospholipase C is involved in the antitumour action of NSC768313, a new thieno[2,3-b]pyridine derivative. Cancer Cell Int. 2016, 16, 18. [Google Scholar] [CrossRef] [PubMed]
- Wang, J.; Luo, C.; Shan, C.; You, Q.; Lu, J.; Elf, S.; Zhou, Y.; Wen, Y.; Vinkenborg, J.L.; Fan, J.; et al. Inhibition of human copper trafficking by a small molecule significantly attenuates cancer cell proliferation. Nat. Chem. 2015, 7, 968–979. [Google Scholar] [CrossRef] [PubMed]
- Arabshahi, H.J.; van Rensburg, M.; Pilkington, L.I.; Jeon, C.Y.; Song, M.; Gridel, L.-M.; Leung, E.; Barker, D.; Vuica-Ross, M.; Volcho, K.P.; et al. A synthesis, in silico, in vitro and in vivo study of thieno[2,3-b]pyridine anticancer analogues. MedChemComm 2015, 6, 1987–1997. [Google Scholar] [CrossRef]
- Romagnoli, R.; Baraldi, P.G.; Salvador, M.K.; Preti, D.; Tabrizi, M.A.; Bassetto, M.; Brancale, A.; Hamel, E.; Castagliuolo, I.; Bortolozzi, R.; et al. Synthesis and Biological Evaluation of 2-(Alkoxycarbonyl)-3-Anilinobenzo[b]thiophenes and Thieno[2,3-b]pyridines as New Potent Anticancer Agents. J. Med. Chem. 2013, 56, 2606–2618. [Google Scholar] [CrossRef] [PubMed]
- Eurtivong, C.; Semenov, V.; Semenova, M.; Konyushkin, L.; Atamanenko, O.; Reynisson, J.; Kiselyov, A. 3-Amino-thieno[2,3-b]pyridines as microtubule-destabilising agents: Molecular modelling and biological evaluation in the sea urchin embryo and human cancer cells. Bioorg. Med. Chem. 2017, 25, 658–664. [Google Scholar] [CrossRef] [PubMed]
- Katritch, V.; Jaakola, V.; Lane, J.R.; Lin, J.; IJzerman, A.P.; Yeager, M.; Kufareva, I.; Stevens, R.C.; Abagyan, R. Structure-Based Discovery of Novel Chemotypes for Adenosine A2A Receptor Antagonists. J. Med. Chem. 2010, 53, 1799–1809. [Google Scholar] [CrossRef] [PubMed]
- Fishman, P.; Bar-Yehuda, S.; Synowitz, M.; Powell, J.D.; Klotz, K.N.S.G.; Borea, P.A. Adenosine receptors and cancer. Handb. Exp. Pharmacol. 2009, 193, 399–441. [Google Scholar] [CrossRef]
- Rebecchi, M.J.; Raghubir, A.; Scarlata, S.; Hartenstine, M.J.; Brown, T.; Stallings, J.D. Expression and function of phospholipase C in breast carcinoma. Adv. Enzyme Regul. 2009, 49, 59–73. [Google Scholar] [CrossRef] [PubMed]
- Cortes Ledesma, F.; El Khamisy, S.F.; Zuma, M.C.; Osborn, K.; Caldecott, K.W. A human 5’-tyrosyl DNA phosphodiesterase that repairs topoisomerase-mediated DNA damage. Nature 2009, 461, 674–678. [Google Scholar] [CrossRef] [PubMed]
- Ben Hassine, S.B.A. Tdp1 protects against oxidative DNA damage in non-dividing fission yeast. EMBO J. 2009, 28, 632–640. [Google Scholar] [CrossRef] [PubMed]
- Dean, R.A.; Fam, H.K.; An, J.; Choi, K.; Shimizu, Y.; Jones, S.J.M.; Boerkoel, C.F.; Interthal, H.; Pfeifer, T.A. Identification of a Putative Tdp1 Inhibitor(CD00509) by in Vitro and Cell-Based Assays. J. Biomol. Screen. 2014, 19, 1372–1382. [Google Scholar] [CrossRef] [PubMed]
- Fam, H.K.; Walton, C.; Mitra, S.A.; Chowdhury, M.; Osborne, N.; Choi, K.; Sun, G.; Wong, P.C.W.; O’Sullivan, M.J.; Turashvili, G.; et al. TDP1 and PARP1 Deficiency Are Cytotoxic to Rhabdomyosarcoma Cells. Mol. Cancer Res. 2013, 11, 1179–1192. [Google Scholar] [CrossRef] [PubMed]
- Davies, D.R.; Interthal, H.; Champoux, J.J.; Hol, W.G.J. Crystal Structure of a Human Tyrosyl-DNA Phosphodiesterase (Tdp1)-Tungstate Complex. J. Mol. Biol. 2003, 324, 917–932. [Google Scholar] [CrossRef]
- Zakharenko, A.L.; Khomenko, T.M.; Zhukova, S.V.; Koval, O.A.; Zakharova, O.D.; Anarbaev, R.O.; Lebedeva, N.A.; Korchagina, D.V.; Komarova, N.I.; Vasiliev, V.G.; et al. Synthesis and Biological Evaluation of Novel Tyrosyl-DNA Phosphodiesterase 1 Inhibitors with a Benzopentathiepine Moiety. Bioorg. Med. Chem. 2015, 23, 2044–2052. [Google Scholar] [CrossRef] [PubMed]
- Khomenko, T.; Zakharenko, A.; Odarchenko, T.; Arabshahi, H.J.; Sannikova, V.; Zakharova, O.; Korchagina, D.; Reynisson, J.; Volcho, K.; Salakhutdinov, N.; et al. New inhibitors of tyrosyl-DNA phosphodiesterase I (Tdp 1) combining 7-hydroxycoumarin and monoterpenoid moieties. Bioorg. Med. Chem. 2016, 24, 5573–5581. [Google Scholar] [CrossRef] [PubMed]
- Van Vuuren, R.J.; Visagie, M.H.; Theron, A.E.; Joubert, A.M. Antimitotic drugs in the treatment of cancer. Cancer Chemother. Pharmacol. 2015, 76, 1101–1112. [Google Scholar] [CrossRef] [PubMed]
- Lappano, R.; Maggiolini, M. G protein-coupled receptors: Novel targets for drug discovery in cancer. Nat. Rev. Drug Dis. 2011, 10, 47–60. [Google Scholar] [CrossRef] [PubMed]
- Discover, X. Available online: www.discoverx.com (accessed on 16 June 2016).
- Binsaleh, N.K.; Wigley, C.A.; Whitehead, K.; van Rensburg, M.; Reynisson, J.; Pilkington, L.I.; Barker, D.; Jones, S.; Dempsey-Hibbert, N.C. Thieno[2,3-b]pyridine derivatives are potent anti-platelet drugs, inhibiting platelet activation, aggregation and showing synergy with aspirin. Eur. J. Med. Chem. 2017. [Google Scholar] [CrossRef] [PubMed]
- Jaakola, V.P.; Griffith, M.T.; Hanson, M.A.; Cherezov, V.; Chien, E.Y.; Lane, J.R.; Ijzerman, A.P.; Stevens, R.C. The 2.6 Ångström Crystal Structure of a Human A2A Adenosine Receptor Bound to an Antagonist. Science 2008, 322, 1211–1217. [Google Scholar] [CrossRef] [PubMed]
- Wu, B.; Chien, E.Y.; Mol, C.D.; Fenalti, G.; Liu, W.; Katritch, V.; Abagyan, R.; Brooun, A.; Wells, P.; Bi, F.C.; et al. Structures of the CXCR4 chemokine GPCR with small-molecule and cyclic peptide antagonists. Science 2010, 330, 1066–1071. [Google Scholar] [CrossRef] [PubMed]
- Booe, J.M.; Walker, C.S.; Barwell, J.; Kuteyi, G.; Simms, J.; Jamaluddin, M.A.; Warner, M.L.; Bill, R.M.; Harris, P.W.; Brimble, M.A.; et al. Structural Basis for Receptor Activity-Modifying Protein-Dependent Selective Peptide Recognition by a G Protein-Coupled Receptor. Mol. Cell 2015, 58, 1040–1052. [Google Scholar] [CrossRef] [PubMed]
- MacKenzie, A.E.; Caltabiano, G.; Kent, T.C.; Jenkins, L.; McCallum, J.E.; Hudson, B.D.; Nicklin, S.A.; Fawcett, L.; Markwick, R.; Charlton, S.J.; et al. The Antiallergic Mast Cell Stabilizers Lodoxamide and Bufrolin as the First High and Equipotent Agonists of Human and Rat GPR35. Mol. Pharmacol. 2014, 85, 91–104. [Google Scholar] [CrossRef] [PubMed]
- GPCRdb. Revision 26edf841. Available online: www.gpcrdb.org (accessed on 10 January 2017).
- Bai, R.; Liang, Z.; Yoon, Y.; Liu, S.; Gaines, T.; Oum, Y.; Shi, Q.; Mooring, S.R.; Shim, H. Symmetrical bis-tertiary amines as novel CXCR4 inhibitors. Eur. J. Med. Chem. 2016, 118, 340–350. [Google Scholar] [CrossRef] [PubMed]
- Wells, G.; Chernoff, J.; Gilligan, J.P.; Krause, D.S. Does salmon calcitonin cause cancer? A review and meta-analysis. Osteoporos. Int. 2016, 27, 13–19. [Google Scholar] [CrossRef] [PubMed]
- Fernandez-Sauze, S.; Delfino, C.; Mabrouk, K.; Dussert, C.; Chinot, O.; Martin, P.; Grisoli, F.; Ouafik, L.; Boudouresque, F. Effects of adrenomedullin on endothelial cells in the multistep process of angiogenesis: Involvement of CRLR/RAMP2 and CRLR/RAMP3 receptors. Int. J. Cancer 2004, 108, 797–804. [Google Scholar] [CrossRef] [PubMed]
- Watkins, H.A.; Walker, C.S.; Ly, K.N.; Bailey, R.J.; Barwell, J.; Poyner, D.R.; Hay, D.L. Receptor activity-modifying protein-dependent effects of mutations in the calcitonin receptor-like receptor: Implications for adrenomedullin and calcitonin gene-related peptide pharmacology. Br. J. Pharm. 2014, 171, 772–788. [Google Scholar] [CrossRef] [PubMed]
- Qi, T.; Christopoulos, G.; Bailey, R.J.; Christopoulos, A.; Sexton, P.M.; Hay, D.L. Identification of N-terminal receptor activity-modifying protein residues important for calcitonin gene-related peptide, adrenomedullin, and amylin receptor function. Mol. Pharm. 2008, 74, 1059–1071. [Google Scholar] [CrossRef] [PubMed]
- D’Amato, M.; Bruce, S.; Bresso, F.; Zucchelli, M.; Ezer, S.; Pulkkinen, V.; Lindgren, C.; Astegiano, M.; Rizzetto, M.; Gionchetti, P.; et al. Neuropeptide S Receptor 1 Gene Polymorphism Is Associated With Susceptibility to Inflammatory Bowel Disease. Gastroenterology 2007, 133, 808–817. [Google Scholar] [CrossRef] [PubMed]
- Nepomuceno, D.; Sutton, S.; Yu, J.; Zhu, J.; Liu, C.; Lovenberg, T.; Bonaventure, P. Mutagenesis studies of neuropeptide S identify a suitable peptide tracer for neuropeptide S receptor binding studies and peptides selectively activating the I107 variant of human neuropeptide S receptor. Eur. J. Pharm. 2010, 635, 27–33. [Google Scholar] [CrossRef] [PubMed]
- Clark, S.D.; Tran, H.T.; Zeng, J.; Reinscheid, R.K. Importance of extracellular loop one of the neuropeptide S receptor for biogenesis and function. Peptides 2010, 31, 130–138. [Google Scholar] [CrossRef] [PubMed]
- McCoy, J.G.; Marugan, J.J.; Liu, K.; Zheng, W.; Southall, N.; Huang, W.; Heilig, M.; Austin, C.P. Selective Modulation of Gq/Gs pathways by Naphtho Pyrano Pyrimidines as Antagonists of the Neuropeptide S Receptor. ACS Chem. Neurosci. 2010, 1, 559–574. [Google Scholar] [CrossRef] [PubMed]
- Okamura, N.; Habay, S.A.; Zeng, J.; Chamberlin, A.R.; Reinscheid, R.K. Synthesis and pharmacological in vitro and in vivo profile of SHA68 (3-Oxo-1,1-diphenyl-tetrahydro-oxazolo[3,4-a]pyrazine-7-carboxylic acid 4-fluoro-benzylamide), a selective antagonist of the Neuropeptide S receptor. J. Pharmacol. Exp. Ther. 2008, 325, 893–901. [Google Scholar] [CrossRef] [PubMed]
- Tworoger, S.S.; Hankinson, S.E. Prolactin and breast cancer risk. Cancer Lett. 2006, 243, 160–169. [Google Scholar] [CrossRef] [PubMed]
- Liebeschuetz, J.W.; Cole, J.C.; Korb, O. Pose prediction and virtual screening performance of GOLD scoring functions in a standardized test. J. Comput. Aided Mol. Des. 2012, 26, 737–748. [Google Scholar] [CrossRef] [PubMed]
- Li, Y.; Han, L.; Liu, Z.; Wang, R. Comparative Assessment of Scoring Functions on an Updated Benchmark: 2. Evaluation Methods and General Results. J. Chem. Inf. Model. 2014, 54, 1717–1736. [Google Scholar] [CrossRef] [PubMed]
- Reinhold, W.C.; Sunshine, M.; Liu, H.; Varma, S.; Kohn, K.W.; Morris, J.; Doroshow, J.; Pommier, Y. CellMiner: A web-based suite of genomic and pharmacologic tools to explore transcript and drug patterns in the NCI-60 cell line set. Cancer Res. 2012, 72, 3499–3511. [Google Scholar] [CrossRef] [PubMed]
- Maier, T.; Güell, M.; Serrano, L. Correlation of mRNA and protein in complex biological samples. FEBS Lett. 2009, 583, 3966–3979. [Google Scholar] [CrossRef] [PubMed]
- GOLD v5.2.2, CCDC Software Ltd.: Cambridge, UK, 2013.
- Glide v6.9, Schrödinger, LLC: New York, NY, USA, 2015.
- Essen, L.O.; Perisic, O.; Katan, M.; Wu, Y.; Roberts, M.F.; Williams, R.L. Structural mapping of the catalytic mechanism for a mammalian phosphoinositide-specific phospholipase C. Biochemistry 1997, 36, 1704–1718. [Google Scholar] [CrossRef] [PubMed]
- Wernimont, A.K.; Huffman, D.L.; Lamb, A.L.; O’Halloran, T.V.; Rosenzweig, A.C. Structural basis for copper transfer by the metallochaperone for the Menkes/Wilson disease proteins. Nat. Struct. Biol. 2000, 7, 766–771. [Google Scholar] [CrossRef] [PubMed]
- Berman, H.; Henrick, K.; Nakamura, H. Announcing the worldwide Protein Data Bank. Nat. Struct. Biol. 2003, 10, 980. [Google Scholar] [CrossRef] [PubMed]
- Berman, H.M.; Westbrook, J.; Feng, Z.; Gilliland, G.; Bhat, T.N.; Weissig, H.; Shindyalov, I.N.; Bourne, P.E. The Protein Data Bank. Nucleic Acids Res. 2000, 28, 235–242. [Google Scholar] [CrossRef] [PubMed]
- Prota, A.E.; Danel, F.; Bachmann, F.; Bargsten, K.; Buey, R.M.; Pohlmann, J.; Reinelt, S.; Lane, H.; Steinmetz, M.O. The Novel Microtubule-Destabilizing Drug BAL27862 Binds to the Colchicine Site of Tubulin with Distinct Effects on Microtubule Organization. J. Mol. Biol. 2014, 426, 1848–1860. [Google Scholar] [CrossRef] [PubMed]
- Ranaivoson, F.M.; Gigant, B.; Berritt, S.; Joullié, M.; Knossow, M. Structural plasticity of tubulin assembly probed by vinca-domain ligands. Acta Cryst. D 2012, 68, 927–934. [Google Scholar] [CrossRef] [PubMed]
- Löwe, J.; Li, H.; Downing, K.H.; Nogales, E. Refined structure of alpha beta-tubulin at 3.5 Å resolution. J. Mol. Biol. 2001, 313, 1045–1057. [Google Scholar] [CrossRef] [PubMed]
- Jones, G.; Willet, P.; Glen, R.C.; Leach, A.R.; Taylor, R. Development and Validation of a Genetic Algorithm for Flexible Docking. J. Mol. Biol. 1997, 267, 727–748. [Google Scholar] [CrossRef] [PubMed]
- Eldridge, M.D.; Murray, C.; Auton, T.R.; Paolini, G.V.; Mee, PM. Empirical scoring functions: I. The development of a fast empirical scoring function to estimate the binding affinity of ligands in receptor complexes. J. Comp. Aided Mol. Des. 1997, 11, 425–445. [Google Scholar] [CrossRef]
- Verdonk, M.L.; Cole, J.C.; Hartshorn, M.J.; Murray, C.W.; Taylor, R.D. Improved protein-ligand docking using GOLD. Proteins 2003, 52, 609–623. [Google Scholar] [CrossRef] [PubMed]
- Korb, O.; Stützle, T.; Exner, T.E. Empirical Scoring Functions for Advanced Protein−Ligand Docking with PLANTS. J. Chem. Inf. Model. 2009, 49, 84–96. [Google Scholar] [CrossRef] [PubMed]
- Mooij, W.T.M.; Verdonk, M.L. General and targeted statistical potentials for protein–ligand interactions. Proteins 2005, 61, 272–287. [Google Scholar] [CrossRef] [PubMed]
- Scigress Ultra v. F.J 2.6 Fijitsu Limited, FUJITSU: Tokyo, Japan, 2000.
- Allinger, N.L. Conformational analysis. 130. MM2. A hydrocarbon force field utilizing V1 and V2 torsional terms. J. Am. Chem. Soc. 1977, 99, 8127–8134. [Google Scholar] [CrossRef]
- Maestro v10.4, Schrödinger: New York, NY, USA, 2015.
- Duarte, C.D.; Barreiro, E.J.; Fraga, C.A. Privileged structures: A useful concept for the rational design of new lead drug candidates. Mini Rev. Med. Chem. 2007, 7, 1108–1119. [Google Scholar] [CrossRef] [PubMed]
Sample Availability: Samples of the compounds are available from the authors. |


| Colchicine | Taxol | Vinca | ||||||||||||
|---|---|---|---|---|---|---|---|---|---|---|---|---|---|---|
| No | GS | CS | PLP | ASP | Glide | GS | CS | PLP | ASP | GS | CS | PLP | ASP | Glide |
| 1 | 63.9 | 31.4 | 54.9 | 25.4 | −6.7 | 52.9 | 30.9 | 52.6 | 26.3 | 59.1 | 30.6 | 57.2 | 30.1 | −3.8 |
| 2 | 62.5 | 29.6 | 61.3 | 28.0 | −6.9 | 50.8 | 29.7 | 50.9 | 25.5 | 55.9 | 29.4 | 49.3 | 28.7 | −3.1 |
| 3 | 63.2 | 25.9 | 53.4 | 27.8 | −5.7 | 57.2 | 31.5 | 59.1 | 29.9 | 54.3 | 26.4 | 52.3 | 31.8 | −4.2 |
| 4 | 64.4 | 28.9 | 68.1 | 24.8 | −7.4 | 50.5 | 29.8 | 53.2 | 23.7 | 49.9 | 25.2 | 53.1 | 27.3 | −2.8 |
| 5 | 65.7 | 32.7 | 63.4 | 31.9 | −5.8 | 51.8 | 28.8 | 51.9 | 24.8 | 52.2 | 27.2 | 54.4 | 28.9 | −4.1 |
| 6 | 62.3 | 26.4 | 52.7 | 28.7 | −7.4 | 51.6 | 28.0 | 54.0 | 26.2 | 55.1 | 27.9 | 52.7 | 28.2 | −4.3 |
| GPCR | μM | |
|---|---|---|
| CRL-RAMP3 | IC50 | 11.9 |
| NPSR1B | IC50 | 1.0 |
| PRLHR | IC50 | 9.3 |
| CXCR4 | IC50 | 6.9 |
| GPR35 | EC50 | 7.5 |
| Targets | GS | CS | PLP | ASP | Glide | Total 1 | |
|---|---|---|---|---|---|---|---|
| 1 | PLC-δ1 | 56.9 ± 4.3 | 28.6 ± 1.8 | 63.1 ± 2.7 | 35.1 ± 1.3 | −3.7 ± 0.8 | 7.7 ± 0.6 |
| 2 | ATOX1 | 41.5 ± 1.8 | 19.9 ± 1.6 | 41.2 ± 3.7 | 16.1 ± 1.7 | −2.2 ± 0.3 | 4.8 ± 0.4 |
| 3 | TDP1 | 49.7 ± 0.9 | 26.8 ± 1.2 | 48.5 ± 3.7 | 31.2 ± 1.5 | −3.2 ± 0.9 | 6.6 ± 0.5 |
| 4 | Tubulin-Colchicine | 63.7 ± 1.3 | 29.2 ± 2.7 | 58.9 ± 6.3 | 27.8 ± 2.5 | −6.7 ± 0.7 | 8.1 ± 0.6 |
| 5 | A2AAR | 64.2 ± 2.8 | 38.6 ± 3.0 | 69.2 ± 1.9 | 40.4 ± 1.5 | −8.8 ± 0.4 | 10.0 ± 0.5 |
| 6 | CXCR4 | 62.6 ± 4.3 | 32.9 ± 1.3 | 66.4 ± 1.4 | 37.4 ± 3.0 | −6.3 ± 0.3 | 8.9 ± 0.5 |
| 7 | CRL-RAMP3 | 57.1 ± 1.5 | 31.7 ± 1.9 | 64.1 ± 4.3 | 36.7 ± 2.1 | −5.7 ± 0.1 | 8.4 ± 0.4 |
| 8 | GPR35 | 62.9 ± 1.9 | 32.2 ± 1.7 | 62.6 ± 3.9 | 38.4 ± 1.7 | −4.7 ± 0.6 | 8.4 ± 0.5 |
| 9 | NSPRb1 | 49.9 ± 2.1 | 27.1 ± 1.9 | 58.1 ± 4.6 | 31.1 ± 1.5 | −4.3 ± 0.5 | 7.2 ± 0.5 |
| 10 | PRLHR | 56.7 ± 2.9 | 32.8 ± 3.1 | 56.9 ± 3.8 | 32.9 ± 1.4 | −5.5 ± 0.8 | 8.0 ± 0.5 |
| Target | z-Score | Min. | Max. |
|---|---|---|---|
| PLC-δ1 | 0.129 | −1.088 | −4.413 |
| ATOX1 | 1.055 | −0.905 | 2.886 |
| TDP1 | −0.184 | −4.662 | 1.716 |
| Tubulin | −0.822 | −0.880 | 2.877 |
| A2AAR | −0.777 | −1.412 | 2.622 |
| CXCR4 | −0.667 | −0.687 | 3.615 |
| GPR35 | −0.483 | −0.514 | 4.056 |
| NSPRb1 | −0.284 | −0.503 | 6.804 |
© 2017 by the authors. Licensee MDPI, Basel, Switzerland. This article is an open access article distributed under the terms and conditions of the Creative Commons Attribution (CC BY) license (http://creativecommons.org/licenses/by/4.0/).
Share and Cite
Zafar, A.; Sari, S.; Leung, E.; Pilkington, L.I.; Van Rensburg, M.; Barker, D.; Reynisson, J. GPCR Modulation of Thieno[2,3-b]pyridine Anti-Proliferative Agents. Molecules 2017, 22, 2254. https://0-doi-org.brum.beds.ac.uk/10.3390/molecules22122254
Zafar A, Sari S, Leung E, Pilkington LI, Van Rensburg M, Barker D, Reynisson J. GPCR Modulation of Thieno[2,3-b]pyridine Anti-Proliferative Agents. Molecules. 2017; 22(12):2254. https://0-doi-org.brum.beds.ac.uk/10.3390/molecules22122254
Chicago/Turabian StyleZafar, Ayesha, Suat Sari, Euphemia Leung, Lisa I. Pilkington, Michelle Van Rensburg, David Barker, and Jóhannes Reynisson. 2017. "GPCR Modulation of Thieno[2,3-b]pyridine Anti-Proliferative Agents" Molecules 22, no. 12: 2254. https://0-doi-org.brum.beds.ac.uk/10.3390/molecules22122254