Article

Ultrasound-Assisted Extraction and Identification of Natural Antioxidants from the Fruit of Melastoma sanguineum Sims

1
Guangdong Provincial Key Laboratory of Food, Nutrition and Health, School of Public Health, Sun Yat-Sen University, Guangzhou 510080, China
2
Zhongshan Center for Disease Control and Prevention, Zhongshan 528403, China
3
South China Sea Bioresource Exploitation and Utilization Collaborative Innovation Center, Sun Yat-Sen University, Guangzhou 510006, China
*
Author to whom correspondence should be addressed.
Submission received: 13 January 2017 / Revised: 10 February 2017 / Accepted: 15 February 2017 / Published: 18 February 2017
(This article belongs to the Special Issue Sonochemistry and Green Chemistry Applications)

Abstract

:
The fruit of Melastoma sanguineum Sims is an edible and sweet wild fruit. In our previous study, the fruit was found to have a strong antioxidant property. In this study, an ultrasound-assisted extraction (UAE) method was developed to extract natural antioxidants from the fruit of Melastoma sanguineum Sims, and a response surface methodology was used to optimize the conditions of UAE to maximize the extraction efficiency. The influence of five independent extraction parameters (ethanol concentration, solvent/material ratio, extracting time, temperature, and ultrasound power) on the extraction efficiency were investigated using a single factor experiment, and then a central composite rotatable design was used to investigate the interaction of three key parameters. The results showed that the optimal extraction conditions were 42.98% ethanol, 28.29 mL/g solvent/material ratio, 34.29 min extracting time, 60 °C temperature, and 600 W ultrasound power. Under these conditions, the Trolox equivalent antioxidant capacity (TEAC) value of the extracts was 1074.61 ± 32.56 μmol Trolox/g dry weight (DW). Compared with conventional maceration (723.27 ± 11.61 μmol Trolox/g DW) and Soxhlet extraction methods (518.37 ± 23.23 μmol Trolox/g DW), the UAE method improved the extraction efficiency, in a shorter period of time. In addition, epicatechin gallate, epicatechin, rutin, epigallocatechin, protocatechuic acid, chlorogenic acid, and quercetin, were identified and quantified in the fruit extracts of Melastoma sanguineum Sims by UPLC-MS/MS.

1. Introduction

Free radicals include reactive oxygen species (ROS), reactive sulfur species (RSS), and reactive nitrogen species (RNS) [1]. They are generated as a part of normal cellular metabolism. However, many external factors (smoking, drugs, pesticides, environmental pollutants, radiation, and industrial solvents) can increase the production of free radicals [2]. The overproduction of free radicals can result in oxidative stress, which is involved in many chronic and degenerative diseases, such as atherosclerosis, coronary heart diseases, diabetes mellitus, neurodegenerative diseases, ageing, and cancer [3,4,5]. Several epidemiological studies have verified that a high intake of vegetables and fruits are related with a reduced risk of many chronic diseases, such as hypertension, coronary heart disease, and cancer [6,7]. These health benefits might be attributable to the presence of antioxidants in vegetables and fruits. The antioxidants from plant sources are able to scavenge excess free radicals, inhibit lipid oxidation, and reduce the hydroperoxide formation, which could protect an organism against oxidative stress [8]. Some antioxidants from plant sources have been proved to have anti-aging actions, anticancer actions, and protective actions against cardiovascular diseases, obesity, diabetes mellitus, and neurodegenerative diseases [9]. Therefore, the antioxidants from plant sources can be used as potential agents for preventing and treating oxidative stress-related diseases [10]. In addition, natural antioxidants can be used as food additives for preventing the oxidative deterioration of food in the food industry [11]. However, nowadays, the application of natural antioxidants is not widely used in the food industry because of their low production and expensive price [12]. Therefore, in order to obtain more natural antioxidants, it is necessary to develop an effective way to extract antioxidants with a strong antioxidant activity from natural products.
Melastoma sanguineum Sims is a genus of shrub in the family Melastomataceae, and widely distributed in China, India, and Malaysia [13]. It is a often used as a garden pot plant due to its attractive purple red flowers. Its fruit are cup shaped and are 1.2–1.6 cm in length, and the top of fruit is wider than its base. The fruit is covered with red, long, hard, and coarse hair. The pulp is sweet and edible [14]. This fruit is usually consumed by people, and is used to help digestion in folk medicine. In recent years, the biological activities of Melastoma sanguineum Sims have been reported. Ik-Soo et al. found that the extract of aerial parts of Melastoma sanguineum Sims could inhibit the formation of advanced glycation end-products and reduce the activity of aldose reductase, thus illustrating potential for delaying and preventing diabetic complications [15]. In addition, Melastoma sanguineum Sims, together with Embelia laeta and Paeonia ostii, could be used to treat osteomyelitis and inflammation [16]. In our previous study, the fruit of Melastoma sanguineum Sims was found to have an extremely strong antioxidant property, which indicated that the fruit of Melastoma sanguineum Sims could be a rich source of natural antioxidants [17]. In order to fully utilize the fruit of Melastoma sanguineum Sims, developing an efficient method to extract its antioxidants and identify the components of these extracts, is necessary.
At present, the methods used to extract natural antioxidants from natural products include conventional (e.g., maceration, steam distillation, and Soxhlet extraction) and non-conventional (e.g., ultrasound-assisted extraction, microwave-assisted extraction, supercritical fluid extraction, and subcritical water extraction) extraction methods [18,19]. Compared with conventional extraction methods, non-conventional extraction methods are usually time-saving and require less organic solvent [20,21]. Therefore, non-conventional extraction methods are becoming more and more popular, especially ultrasound-assisted extraction (UAE). UAE is an effective and environmentally friendly extraction method. Ultrasound possesses a mechanical effect that can promote eddy and internal diffusion, thus increasing the mass transfer and penetration of the solvent into the sample matrix [22]. Cavitation induced by ultrasound can break cell walls, accelerating the release of the contents [23,24]. Furthermore, UAE is simple and inexpensive, and can be applied to industrial production on a large scale [25]. In this study, an UAE method was developed for extracting natural antioxidants from the fruit of Melastoma sanguineum Sims.
Many extraction parameters (e.g., concentration of solvent, solvent/material ratio, temperature, extracting time, and ultrasound power) can significantly affect the extraction efficiency of UAE, and the parameters could also interact with each other [26,27,28,29]. Therefore, it is important to optimize these parameters for obtaining high extraction efficiency. Response surface methodology (RSM) is a frequently-used tool for optimizing the extraction parameters [30]. RSM is an effective mathematical and statistical tool which is based on the fit of a polynomial equation to the experimental data, which then makes statistical previsions [31]. It can not only investigate the effect of independent parameters, but also the interaction of several parameters [32]. In the present study, single-factor experiments were adopted to investigate the effects of five independent extraction parameters (ethanol concentration, solvent/material ratio, extracting time, temperature, and ultrasound power) on the extraction efficiency of natural antioxidants from the fruit of Melastoma sanguineum Sims, and a RSM with a five-level, three-variable central composite rotatable design (CCRD) was then adopted, in order to study the interaction of three key extraction parameters. In addition, the extraction efficiencies of UAE and two conventional extraction methods (maceration and Soxhlet extraction) were compared. Furthermore, the phenolic compounds in the extract, obtained under the optimal extraction conditions, were identified and quantified by liquid chromatography-tandem mass spectrometry.

2. Results and Discussion

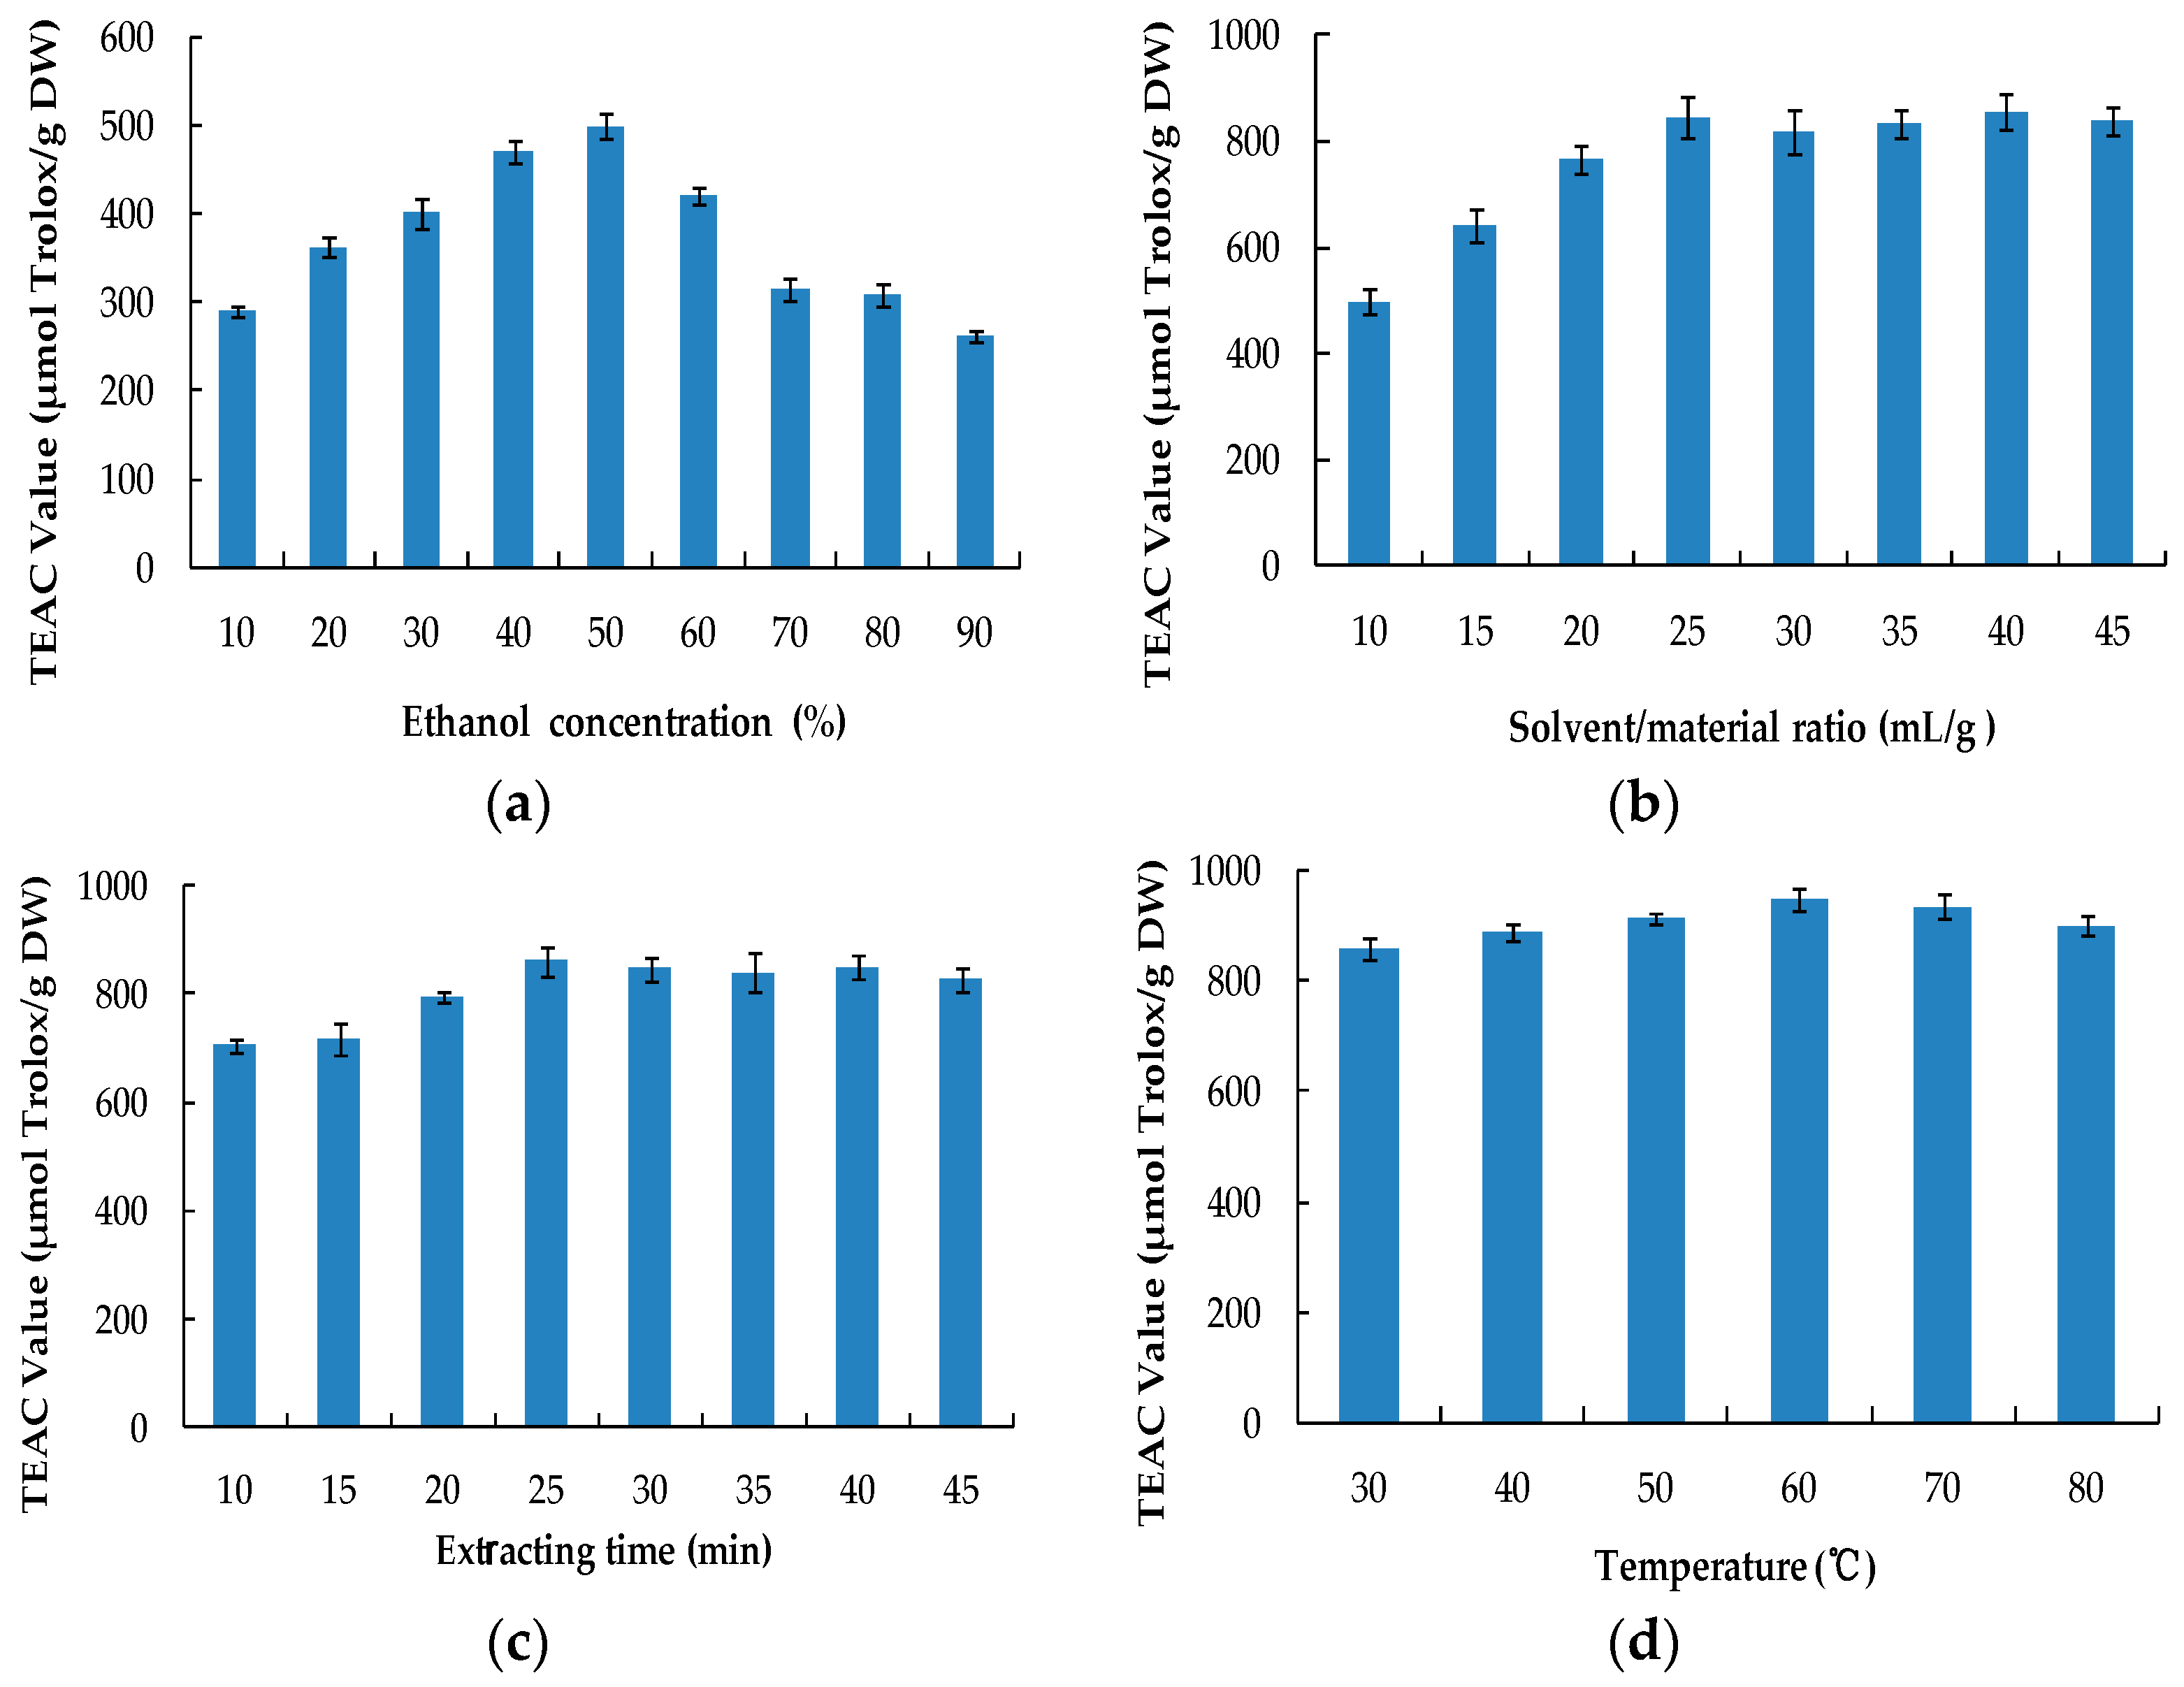
2.1. Single Factor Experiment Analysis

2.1.1. Effect of Ethanol Concentration

Due to the cheap and nontoxic characteristics of ethanol and water, aqueous ethanol is frequently applied to extract natural antioxidants from natural products [30,31]. In this study, the effect of ethanol concentration on extraction efficiency was studied under the following conditions: solvent/material ratio of 10 mL/g, extracting time of 30 min, temperature at 30 °C, and ultrasound power of 400 W. As shown in Figure 1a, when the ethanol concentration was increased from 10% to 50% (v/v), the antioxidant activity gradually increased (p < 0.05). When the ethanol concentration reached 50%, the antioxidant activity reached its peak. Following this, with the increase of ethanol concentration, the antioxidant activity gradually decreased (p < 0.05). According to the “like dissolves like” theory [33], 50% ethanol might have the most suitable polarity for antioxidant components in the fruit of Melastoma sanguineum Sims. Thus, in subsequent experiments, 50% ethanol was used as the extraction solvent.

2.1.2. Effect of Solvent/Material Ratio

The impact of the solvent/material ratio on the extraction efficiency of natural antioxidants from the fruit of Melastoma sanguineum Sims was investigated with 50% ethanol, 30 min extraction time, 30 °C temperature, and 400 W ultrasound power. The results are showed in Figure 1b. When the solvent/material ratio increased from 10 mL/g to 25 mL/g, the antioxidant activity gradually increased (p < 0.05). When the solvent/material ratio reached 25 mL/g, the antioxidant activity reached its peak. When the solvent/material ratio increased from 25 mL/g to 45 mL/g, no significant change was observed. Generally, a higher solvent/material ratio results in a greater concentration difference, that can then promote mass transfer and accelerate the dissolution of solute. However, when the dissolution process reaches its equilibrium, further increasing the solvent/material ratio doesn’t improve the extraction efficiency [34,35]. Thus, 25 mL/g solvent/material ratio was applied in the subsequent experiments.

2.1.3. Effect of Extracting Time

The effect of the extracting time on the extraction efficiency of natural antioxidants from the fruit of Melastoma sanguineum Sims was investigated with 50% ethanol, 25 mL/g solvent/material ratio, 30 °C temperature, and 400 W ultrasound power. The corresponding results are shown in Figure 1c. When the extracting time increased from 10 min to 25 min, the antioxidant activity increased (p < 0.05). However, no significant difference was observed from 25 min to 40 min. When the extracting time was prolonged to 45 min, the antioxidant activity slightly decreased (p > 0.05). The results show that ultrasound could accelerate the release of antioxidants from the material in a short period of time. However, as the ultrasound time is prolonged, ultrasound might destroy the antioxidants, resulting in the decrease of antioxidant activity [36]. Therefore, 25 min was chosen for the subsequent experiments.

2.1.4. Effect of Extracting Temperature

The effect of the extracting temperature on the extraction efficiency of antioxidants from the fruit of Melastoma sanguineum Sims was studied with 50% ethanol, 25 mL/g solvent/material ratio, 25 min extracting time, and 400 W ultrasound power. As shown in Figure 1d, when the extracting temperature increased from 30 °C to 60 °C, the antioxidant activity increased (p < 0.05). As the temperature rose from 60 °C to 80 °C, the antioxidant activity significantly decreased (p < 0.05). The reason for this might be that a higher temperature initially promotes the diffusion, but when the temperature exceeds 60 °C, some heat labile antioxidant components are destroyed [37]. Therefore, 60 °C was the optimal extracting temperature.

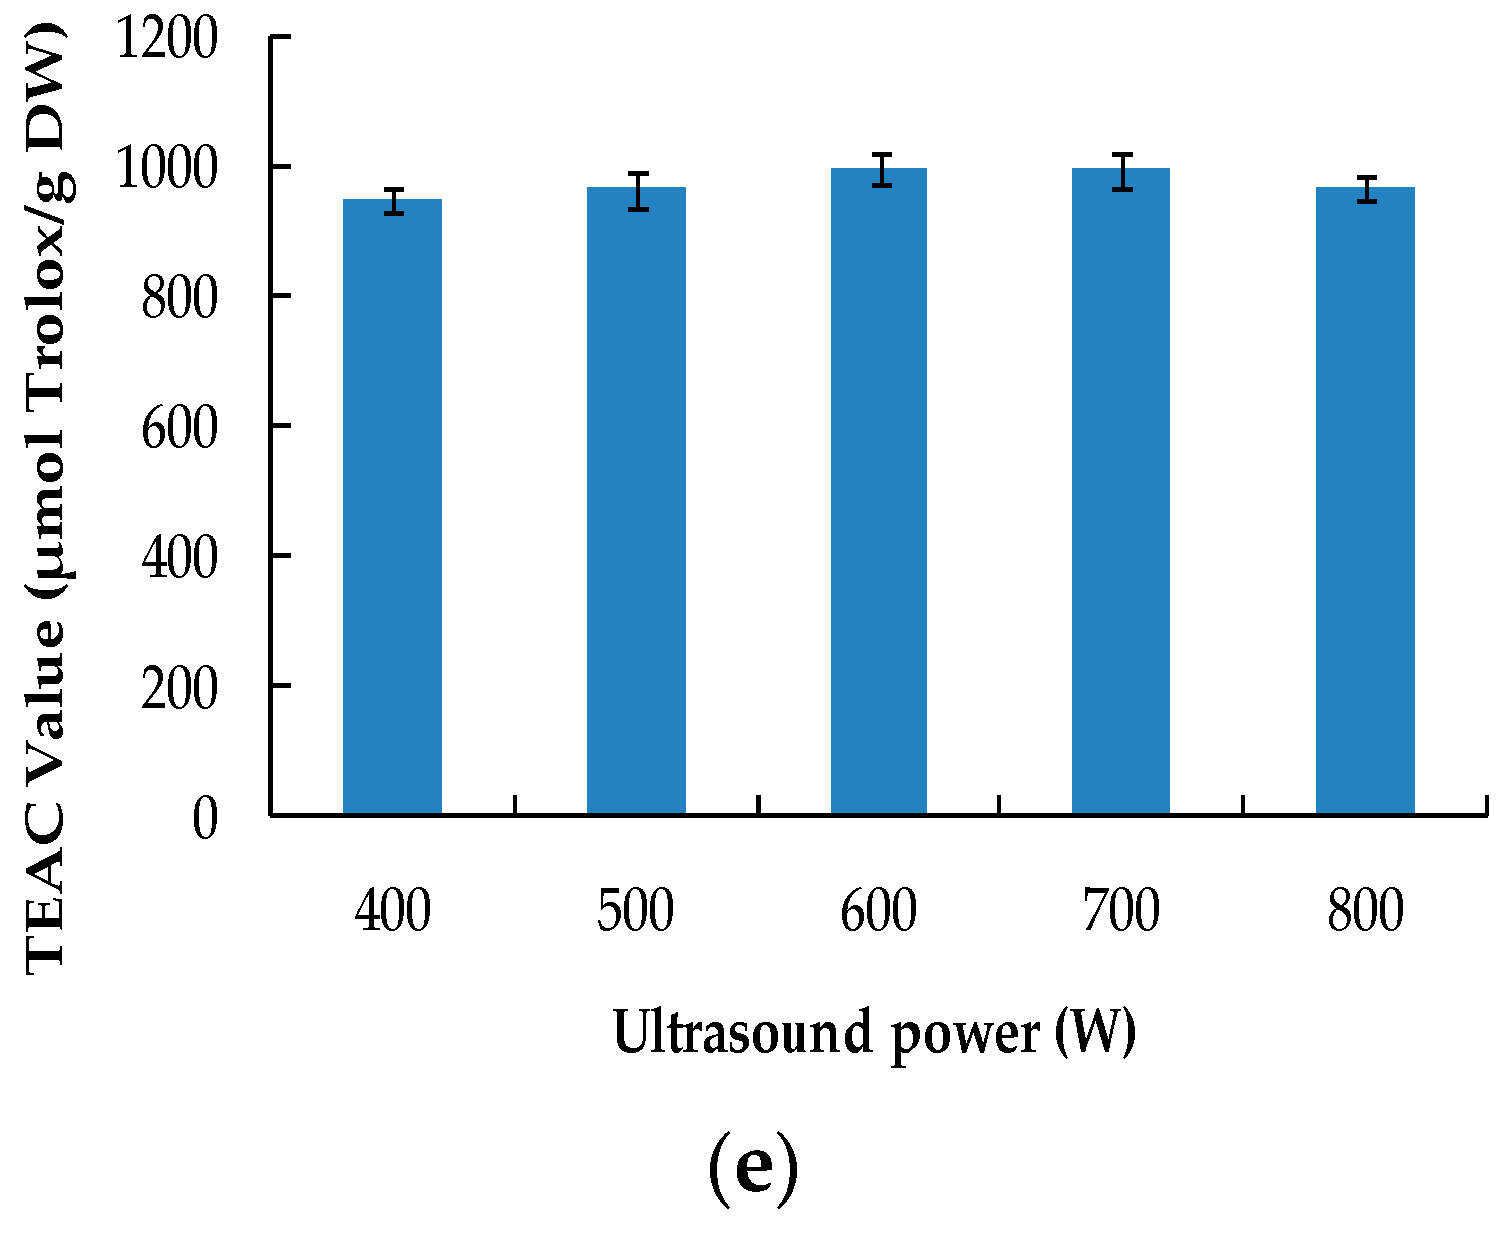
2.1.5. Effect of Ultrasound Power

The effect of ultrasound power on the extraction efficiency of antioxidants from the fruit of Melastoma sanguineum Sims was studied with 50% ethanol, 25 mL/g solvent/material ratio, 25 min extracting time, and 60 °C temperature. The corresponding results are shown in the Figure 1e. When the ultrasound power rose from 400 W to 600 W, the antioxidant activity increased significantly (p < 0.05). As the ultrasound power rose from 600 W to 800 W, the antioxidant activity slightly decreased (p > 0.05). The results indicate that the extraction efficiency was improved with the increasing ultrasound power, but when the ultrasound power exceeded 600 W, some antioxidant components were possibly degraded, which was consistent with the other report [38]. It should be pointed out that the ultrasound power was only the energy input to the generator, and that the actual ultrasonic energy introduced in the system was 12.5, 16.7, 19.6, 24.3, and 27.1 W/L, in response to the energy inputs of 400, 500, 600, 700, and 800 W, respectively.

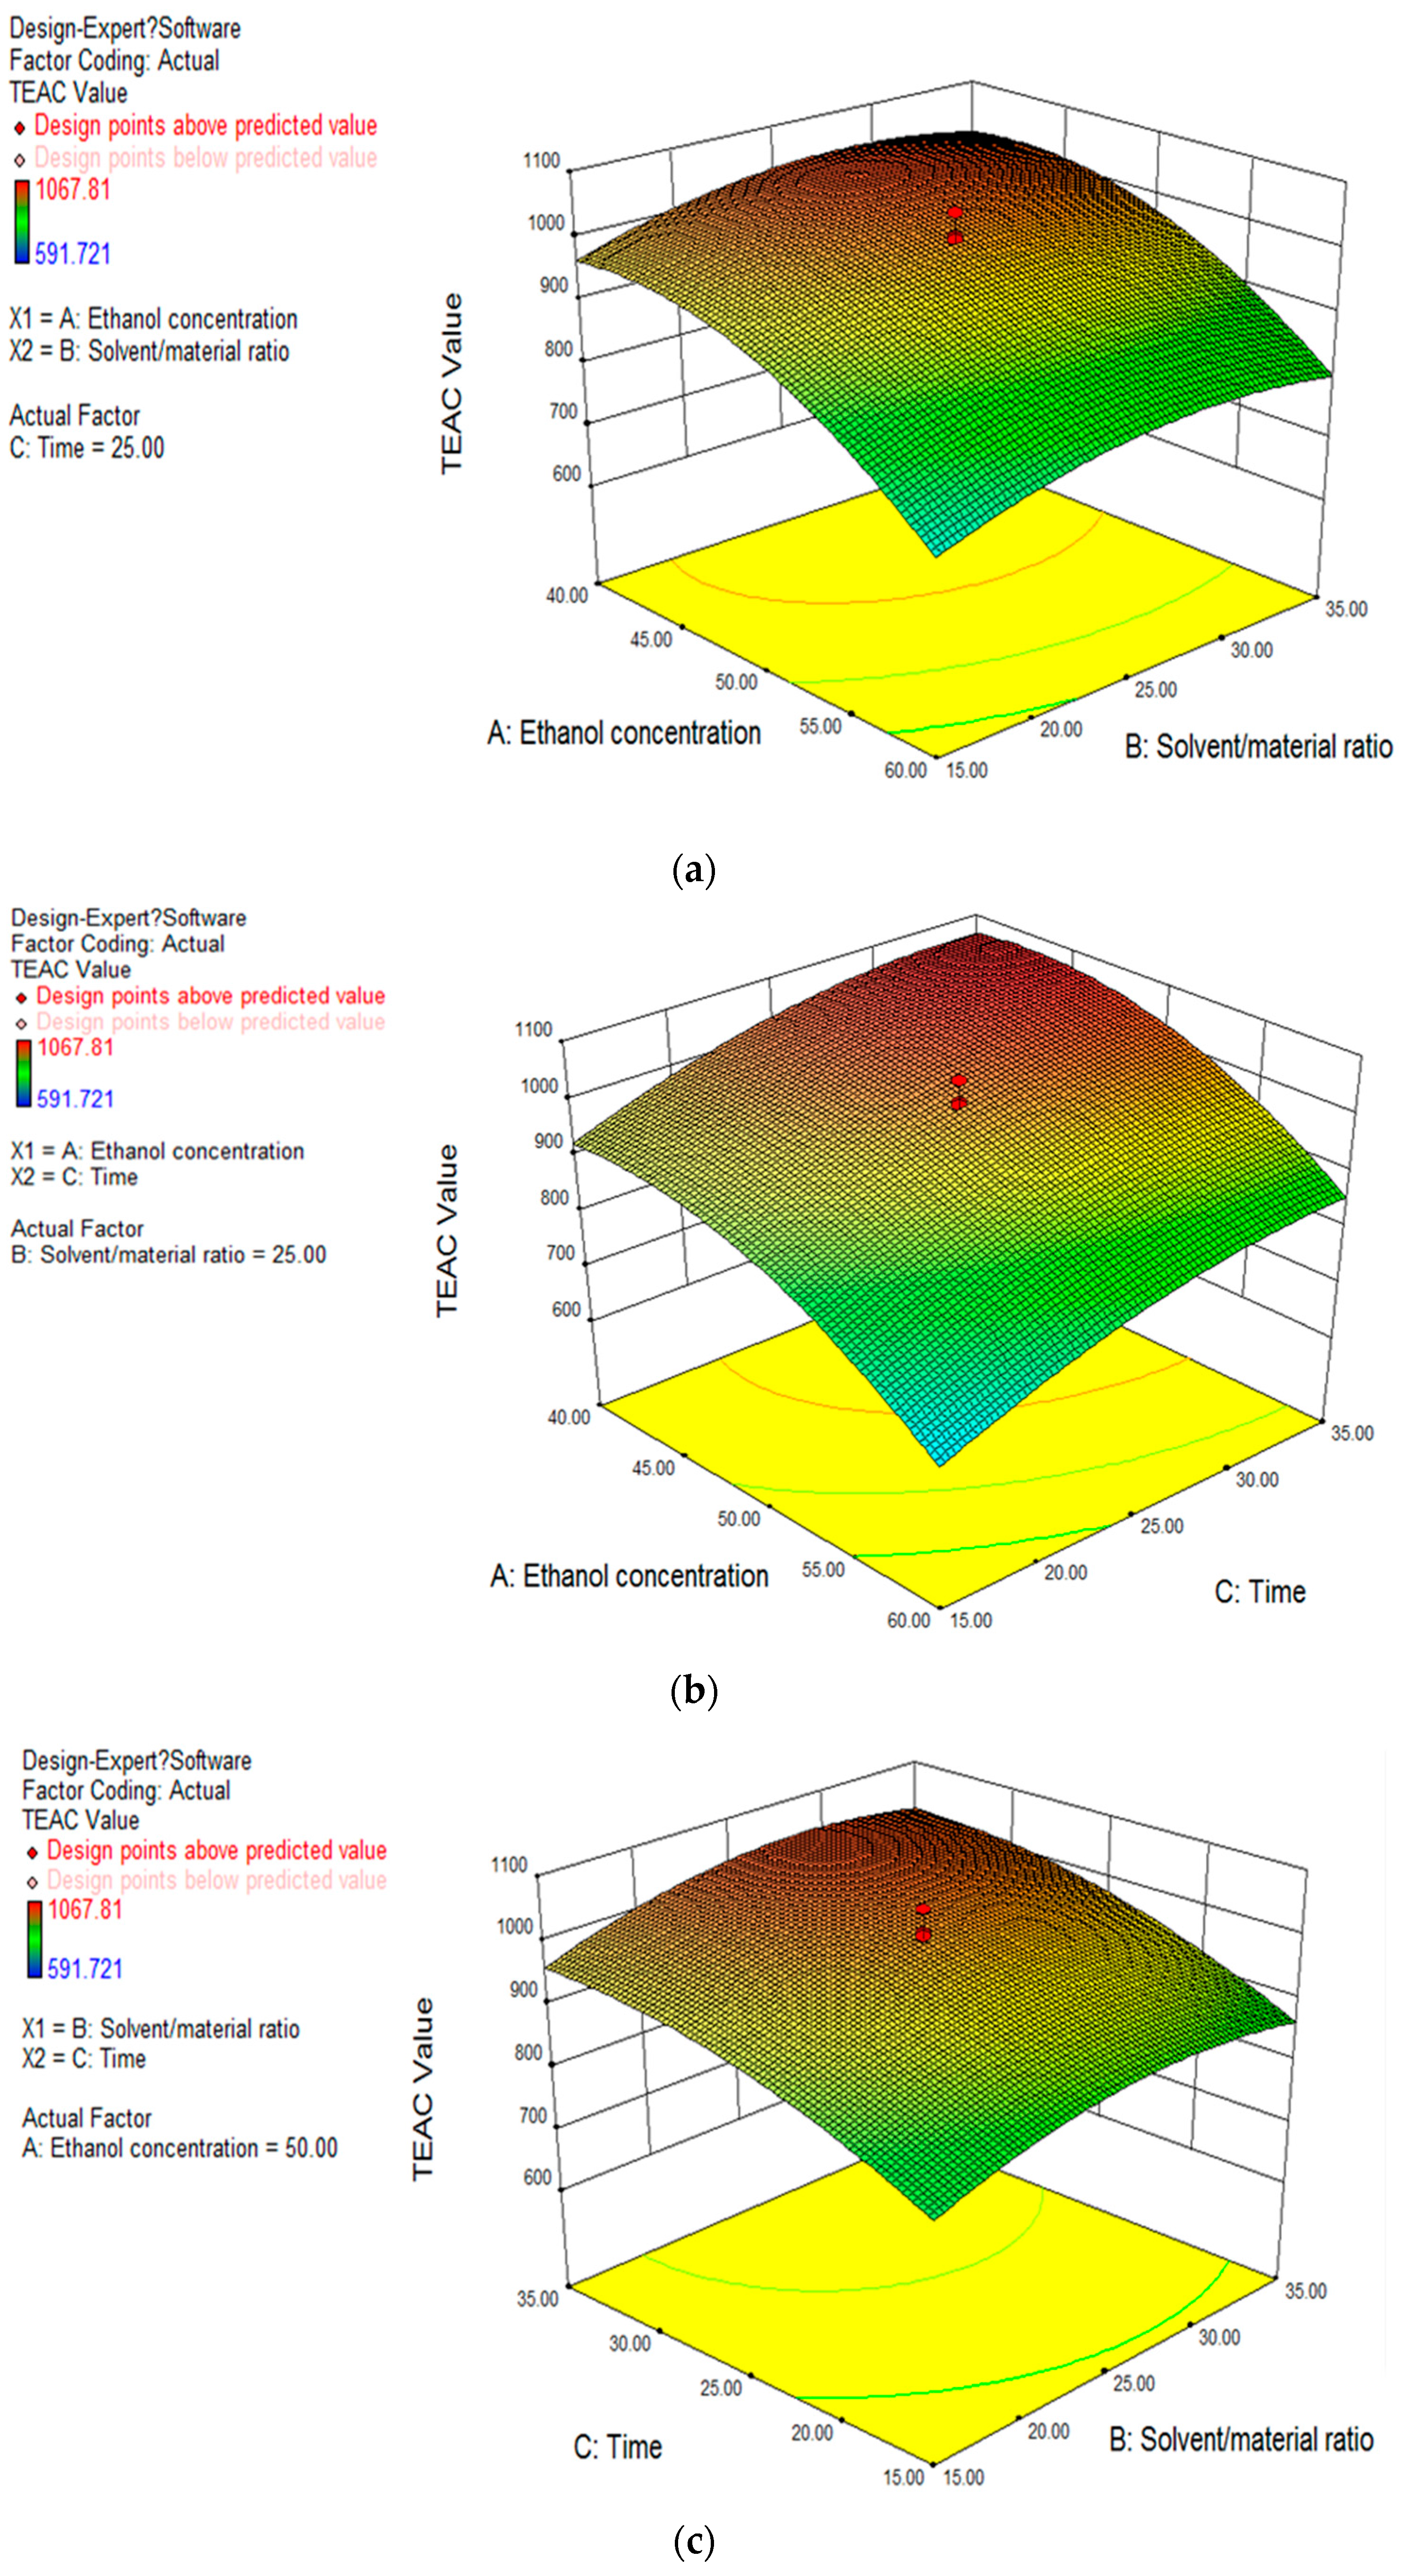
2.2. Optimization by Response Surface Methodology

2.2.1. Experimental Design and Results

According to the results of the single factor experiment, the effects of ethanol concentration, solvent/material ratio, and extracting time on the extraction efficiency, were more significant than those of the other factors. Therefore, they were further optimized by RSM under the conditions of a 60 °C extracting temperature and an ultrasound power of 600 W. A three-variable, five-level central composite rotatable design (CCRD) was adopted in RSM, and 50% ethanol, 25 mL/g solvent/material ratio, and 25 min extracting time, were selected as the middle level. The detailed experimental design, actual value, and predicted value, are shown in Table 1. The results show that the actual antioxidant activity changed from 591.72 to 1067.81 μmol Trolox/g DW.

2.2.2. Fitting the Model

The results of Table 1 were analyzed using multiple regression fitting, and a quadratic polynomial regression model equation of the TEAC value (Y) to ethanol concentration (X1), solvent/material ratio (X2) and extracting time (X3) was obtained. The regression model equation is shown in Equation (1).
Y = 998.34 − 110.31X1 + 28.74X2 + 76.47X3 + 2.4X1X2 + 6.26X1X3 + 2.35X2X3 − 73.77X12 − 44.35X22 − 39.2X32
The reliability of this quadratic polynomial model was analyzed by an analysis of variance (ANOVA), and the results of the ANOVA are shown in Table 2. The high F value (40.59) and low p value (p < 0.0001) of this model showed that the regression model was reliable. In addition, the low F value (1.32) and high p value (0.385) of “lack of fit”, indicated that the “lack of fit” was non-significant, which further confirmed the reliability of this regression model. The determination coefficient (R2) was 0.973, and the adjusted determination coefficient (Adj. R2) was 0.949, which indicated that the regression model could explain 94.9% of the response value variations.

2.2.3. Response Surfaces Analysis

According to the results of Table 1, the three dimensional response surface plots were obtained, and are shown in Figure 2. The response surface plots were able to illustrate the relationship between the independent variables and the response value. As shown in Figure 2a, when the extracting time was fixed at 25 min, the response value (TEAC value) increased with decreasing ethanol concentration over a certain range, but when the ethanol concentration was reduced to nearly 40%, the response value was no longer increased. The response value increased with an increasing solvent/material ratio over a certain range, but when the solvent/material ratio was more than about 30 mL/g, the response value was no longer increased. In Figure 2b, when the solvent/material ratio was fixed at 25 mL/g, the response value increased with increasing extracting time over a certain range, but when the extracting time was increased to nearly 35 min, the response value was no longer increased. In Figure 2c, when the ethanol concentration was fixed at 50%, the effects of the solvent/material ratio and extracting time on the response value were similar to those of Figure 2a,b. According to the three response surface plots, the effects of ethanol concentration, solvent/material ratio, and extracting time on the response value, were not just simple linear effects; there were also quadratic effects. Therefore, each independent variable had an optimal value in the range. Under the condition of the optimal value, the response value had the maximum value. Based on the ANOVA and response surface plots, the ethanol concentration and extracting time had a more significant effect on the response value than the solvent/material ratio.

2.2.4. Validation of Predicted Value

According to the response model, the optimal extraction conditions were obtained as follows: ethanol concentration of 42.98%, solvent/material ratio of 28.29 mL/g, extracting time of 34.29 min, temperature of 60 °C, and ultrasound power of 600 W. Under the optimal extraction conditions, the predicted value was 1077.37 μmol Trolox/g DW. In order to confirm the accuracy of the response model, a verification experiment with the optimal extraction conditions was performed, and the result showed that the TEAC value was 1074.61 ± 32.56 μmol Trolox/g DW. The result of the verification experiment was in agreement with the predicted value, which indicated that the response model was reliable and accurate. In addition, the TEAC value was 826.27 ± 9.07 μmol Trolox/g DW under the optimized extraction conditions without ultrasound, which indicated that ultrasound played an important role in improving the extraction efficiency.

2.3. Comparison of UAE with Conventional Extraction Methods

A comparative study was carried out between UAE and conventional extraction methods (maceration and Soxhlet extraction). The corresponding results are shown in Table 3. Compared with maceration extraction, UAE improved the extraction efficiency by 49%, and saved a lot of time. Compared with Soxhlet extraction, UAE improved the extraction efficiency by 1.07 times, and required a lower temperature and shorter time. The results were consistent with other reports on the extraction of natural antioxidants from black tea, walnut green husk, and the flower of Limonium sinuatum [39,40,41]. In addition, the total phenolic content (TPC) and total flavonoid content (TFC) of the extract obtained by UAE were significantly higher than those by maceration and Soxhlet extraction. The results indicated that UAE was the most effective method among the three extraction methods. The mechanical effect and cavitation induced by ultrasound disrupt the cell wall and increase mass transfer [42,43], which can explain the high efficiency of UAE.

2.4. Identification and Quantification of Phenolic Components

The identification of phenolic compounds helped to explain the strong antioxidant properties of the extract. So, the characterization of phenolic compounds in the extract obtained under optimal extraction conditions was performed by liquid chromatography-tandem mass spectrometry. Seven phenolic components were identified and quantified in the extract. As shown in Table 4, the highest phenolic component was epicatechin gallate, followed by epicatechin, rutin, epigallocatechin, protocatechuic acid, chlorogenic acid, and quercetin. Compared with other foods, the contents of some phenolic compounds in the Melastoma sanguineum Sims fruit were higher than those in other foods, and the contents of some phenolic compounds in the Melastoma sanguineum Sims fruit were lower than those in other foods [44,45,46]. For example, the contents of rutin and chlorogenic acid in the Melastoma sanguineum Sims fruit were 2.8 and 2.4 times higher, respectively, than those in whole grain quinoa [47], and the content of epicatechin in the Melastoma sanguineum Sims fruit was eight times higher than that in the Thelephora ganbajun mushroom [48]. However, the content of chlorogenic acid in Turkish coffee was 25 times higher than that in the Melastoma sanguineum Sims fruit [49], the content of epicatechin in Aronia melanocarpa Elliot was 1.7 times higher than that in the Melastoma sanguineum Sims fruit [50], the content of quercetin in mango was 7.8 times than that in the Melastoma sanguineum Sims fruit, and the contents of quercetin and chlorogenic acid in orange was 18.2 and 7.4 times higher, respectively, than that in the Melastoma sanguineum Sims fruit [44]. These phenolic components have a strong antioxidant activity [51,52,53], which might be part of the reason why the Melastoma sanguineum Sims fruit extract had a strong antioxidant capacity. In addition, these phenolic components have been proved to have various other biological activities, such as anti-inflammatory, antibacterial, anticancer, anti-hyperglycemia, hepatoprotective, and cardiovascular protective effects [54,55,56]. Therefore, the Melastoma sanguineum Sims fruit extract might have potential health benefits.

3. Materials and Methods

3.1. Chemicals and Reagents

2,2′-azinobis (3-ethylbenothiazoline-6-sulfonic acid) diammonium salt (ABTS), 6-hydroxy-2,5,7,8-tetramethylchromane-2-carboxylic acid (Trolox), Folin-Ciocalteu’s phenol reagent, gallic acid, and phenolic standards (chlorogenic acid, coffeic acid, daidzein, equol, epicatechin, epigallocatechin, epicatechin gallate, ferulic acid, genistein, glycitein, p-coumaric acid, protocatechuic acid, quercetin, rutin, and resveratrol) were purchased from Sigma-Aldrich (St. Louis, MO, USA). Potassium persulphate, aluminum chloride hexahydrate, potassium acetate, and sodium carbonate were purchased from Tianjin Chemical Factory (Tianjin, China). The formic acid and methanol used for chromatographic analysis were chromatographically pure. All other chemicals and reagents were analytically pure.

3.2. Sample Preparation

The mature fruits of Melastoma sanguineum Sims were manually harvested from many trees in the Lung Fu Mountain, Hong Kong, China, in October 2016. After picking, they were stored in a refrigerator at 4 °C, and used within one month. The fruits were cleaned using deionized water, and air dried in the room of a laboratory at room temperature, for about 4 h. The fruits were ground into fine particles by a special grinder with stainless steel knife (model JYL-C022E, Joyoung Co., Ltd., Jinan, Shandong, China), and stored in the dark at 4 °C.

3.3. Extraction of Natural Antioxidants

3.3.1. Ultrasound-Assisted Extraction

The powder of Melastoma sanguineum Sims fruits (0.2 g) was put into a tube with an appropriate volume of ethanol aqueous solution. Then, the tube containing the mixture was placed into the water bath of an ultrasound device (Kj1012B; Kejin Ultrasonic Instrument Factory, Guangzhou, China), and was sonicated at a preset extraction time, temperature, and power. The ultrasonic energy introduced in the system was measured and calculated according to the literature [39,57], and was 12.5, 16.7, 19.6, 24.3, and 27.1 W/L, in response to the energy inputs to the generator of 400, 500, 600, 700, and 800 W, respectively. After sonication, the sample was centrifuged at 4200× g for 30 min, and the supernatant was collected for subsequent determination of antioxidant activity by spectrophotometry. In addition, the supernatant was filtered using a 0.45 μm membrane for the determination of phenolic compounds by liquid chromatography-tandem mass spectrometry.

3.3.2. Maceration Extraction

The powder of the Melastoma sanguineum Sims fruits (0.2 g) was mixed with 5.658 mL of 42.98% ethanol, and extracted at 25 °C for 24 h in a shaking water bath. Then, the extraction solution was centrifuged at 4200× g for 30 min, and the supernatant was collected for subsequent determination.

3.3.3. Soxhlet Extraction

The Soxhlet extraction process was carried out according to the method reported by Xu et al., with slight modifications [48]. The powder of the Melastoma sanguineum Sims fruits (1.0 g) was enveloped with Whatman filter paper, which was placed in a Soxhlet extractor. Then, 200 mL of 42.98% ethanol was used as the solvent, and heated at 95 °C. After 4 h of extraction in the Soxhlet extractor, the extraction solution was collected for subsequent determination.

3.4. Experimental Design

3.4.1. Single Factor Experiment

The five factors (ethanol concentration, solvent/material ratio, extracting time, ultrasound temperature, and ultrasound power) were chosen to carry out a single factor experiment. The level gradients of each factor were: ethanol concentration 10%, 20%, 30%, 40%, 50%, 60%, 70%, 80%, 90%; solvent/material ratio 10, 15, 20, 25, 30, 35, 40, 45 mL/g; extracting time 10, 15, 20, 25, 30, 35, 40, 45 min; ultrasound temperature 30, 40, 50, 60, 70, 80 °C; ultrasound power 400, 500, 600, 700, 800 W.

3.4.2. Response Surface Methodology

According to the results of the single factor experiment, three main factors (ethanol concentration, solvent/material ratio, and extracting time) were selected for RSM design. A three-factor, five-level CCRD, with 20 experimental runs was carried out. The independent variables and their five levels are presented in Table 5. The results of CCRD were analyzed using ANOVA, and fitted to a second-order polynomial equation, as follows:
Y = β0 + ∑βiXi + ∑βiiXi2 + ∑βijXiXj,
In the equation, Y is the response value, Xi and Xj are the independent variables, β0 is the intercept, and βi, βij, and βii are the regression coefficients for the linear, interaction, and quadratic terms, respectively.
The multiple regression fitting of the experimental data and the ANOVA of the quadratic polynomial regression model were performed using Design Expert version 8.06.1 software (Stat-Ease, Minneapolis, MN, USA).

3.5. Determination of Antioxidant Capacity

Many methods have been developed to evaluate the antioxidant activity of foods and plants, and different methods could lead to a wide variation of antioxidant capacities [58]. However, the antioxidant capacities obtained using different methods usually have a very high correlationship [17,45]. Thus, the optimal extraction parameters obtained using different monitoring methods of antioxidant activity are usually the same or similar [59]. In the literature, a Trolox equivalent antioxidant capacity (TEAC) assay was usually selected for evaluating the antioxidant capacity of the extract, because it is a simple and rapid method, and can measure the antioxidant capacities of hydrophilic and lipophilic compounds in the same sample [17]. The TEAC assay was carried out based on the method previously established [60]. In brief, the ABTS•+ stock solution was prepared by mixing 2.45 mmol/L potassium persulfate solution and 7 mmol/L ABTS•+ solution with a ratio of 1:1 (v/v), and was then placed in the dark for 16 h and used within two days. The ABTS•+ working solution was obtained by diluting ABTS•+ stock solution, and the absorbance of ABTS•+ working solution was 0.70 ± 0.05 at λ734 nm. The 0.1 mL diluted sample was added to the 3.8 mL ABTS•+ working solution, and then incubated at room temperature for 6 min. After incubation, the absorbance of mixture was measured at λ734 nm, immediately. Trolox was employed as a reference standard, and the results were expressed as μmol Trolox/g DW of fruit.

3.6. Determination of Total Phenolic Content

The total phenolic content was determined on the basis of the method previously established [61]. In brief, a 0.50 mL diluted sample was added to 2.5 mL of 0.2 mol/L diluted Folin-Ciocalteu reagent. After 4 min of incubation, 2 mL saturated sodium carbonate solution was added. The absorbance of mixture was measured at λ760 nm after 2 h of incubation at room temperature. Gallic acid was employed as a reference standard, and the results were expressed as mg of gallic acid equivalent (mg GAE)/g DW of fruit.

3.7. Determination of Total Flavonoid Content

The total flavonoid content was determined on the basis of the literature reported by Kalia et al. [62]. In brief, a 0.50 mL test sample was mixed with 1.5 mL of 95% ethanol (v/v), 0.1 mL AlCl3 solution (10%, w/v), 0.1 mL of 1 mol/L potassium acetate solution, and 2.8 mL double distilled water. The absorbance of mixture was determined at λ415 nm after incubation at room temperature for 30 min. Quercetin was employed as the reference standard, and the results were expressed as mg quercetin equivalent (mg QE)/g DW of fruit.

3.8. Identification and Quantification of Phenolic Compounds

Under optimal extraction conditions, the extract of the Melastoma sanguineum Sims fruit was obtained. The identification and quantification of phenolic compounds in the extract was performed by AB Sciex 4000 Qtrap liquid chromatography-tandem mass spectrometry (SCIEX, Framingham, MA, USA). The separation was performed by Acquity UPLC® HSS T3 column (2.1 × 100 mm, 1.8 μm, Waters, Milford, MA, USA) at 40 °C. The mobile phase was composed of solution A (0.1% formic acid—water solution) and solution B (methanol), and the flow rate was 0.3 mL/min. The gradient elution was performed as follows: 15% B at 0–2 min, 15%–30% B at 2–8 min, 30%–80% B at 8–15 min, 80% B at 15–17.5 min, and 15% B at 17.5–19.5 min. The injection volume of the sample was 2 μL. The conditions of mass spectrometry were as follows: Ion source, ESI source with negative mode; Ion source temperature, 550 °C; detection mode, multiple reaction monitoring (MRM) mode; capillary voltage, −4500 V; curtain gas, 10 psig; nebulizer gas, 20 psig; auxiliary gas, 20 psig. Seven phenolic components were tentatively identified by tandem mass spectrometry. Then, they were verified by corresponding standard compounds, and quantified by peak areas.

3.9. Statistical Analysis

All of the experiments were carried out in triplicate, and the mean value ± standard deviation was reported. Statistical analysis was carried out using Design Expert 8.06.1 (Stat-Ease, Minneapolis, MN, USA) and SPSS 20.0 (IBM, Armonk, NY, USA).

4. Conclusions

An UAE method has been developed for extracting natural antioxidants from the fruit of Melastoma sanguineum Sims, and RSM was employed for optimizing the extraction parameters. The high Adj. R2 (0.949) and consistency between the predicted value and experimental value indicated that the response model was reliable and accurate. The optimal extraction conditions were as follows: ethanol concentration of 42.98%, solvent/material ratio of 28.29 mL/g, extracting time of 34.29 min, temperature of 60 °C, and ultrasound power of 600 W. Under the optimal extraction conditions, the antioxidant capacity, TPC, and TFC of the extract were 1074.61 ± 32.56 μmol Trolox/g DW, 158.61 ± 6.44 mg GAE/g DW, and 2.58 ± 0.18 mg QE/g DW, respectively. Compared with conventional extraction methods, UAE was proved to be a more effective method for extracting natural antioxidants from the fruit of Melastoma sanguineum Sims. In addition, epicatechin gallate, epicatechin, rutin, epigallocatechin, protocatechuic acid, chlorogenic acid, and quercetin were identified and quantified in the extract, which might contribute to the strong antioxidant capacity of this fruit.

Acknowledgments

This work was supported by the National Natural Science Foundation of China (No. 81372976), Key Project of Guangdong Provincial Science and Technology Program (No. 2014B020205002), and the Hundred-Talents Scheme of Sun Yat-Sen University.

Author Contributions

Tong Zhou and Hua-Bin Li conceived and designed the experiments; Tong Zhou, Dong-Ping Xu, Sheng-Jun Lin, Ya Li, Jie Zheng, Yue Zhou and Jiao-Jiao Zhang performed the experiments; Tong Zhou analyzed the data and wrote the paper; Hua-Bin Li revised the paper.

Conflicts of Interest

The authors declare no conflict of interest.

References

  1. Lue, J.M.; Lin, P.H.; Yao, Q.Z.; Chen, C.Y. Chemical and molecular mechanisms of antioxidants: Experimental approaches and model systems. J. Cell. Mol. Med. 2010, 14, 840–860. [Google Scholar] [CrossRef] [PubMed]
  2. Lobo, V.; Patil, A.; Phatak, A.; Chandra, N. Free radicals, antioxidants and functional foods: Impact on human health. Pharmacogn. Rev. 2010, 4, 118–126. [Google Scholar] [CrossRef] [PubMed]
  3. Azizova, O.A. Role of free radical processes in the development of atherosclerosis. Biol. Membr. 2002, 19, 451–471. [Google Scholar]
  4. Santilli, F.; D’Ardes, D.; Davi, G. Oxidative stress in chronic vascular disease: From prediction to prevention. Vasc. Pharmacol. 2015, 74, 23–37. [Google Scholar] [CrossRef] [PubMed]
  5. Valko, M.; Leibfritz, D.; Moncol, J.; Cronin, M.T.D.; Mazur, M.; Telser, J. Free radicals and antioxidants in normal physiological functions and human disease. Int. J. Biochem. Cell Biol. 2007, 39, 44–84. [Google Scholar] [CrossRef] [PubMed]
  6. Nicklett, E.J.; Semba, R.D.; Xue, Q.L.; Tian, J.; Sun, K.; Cappola, A.R.; Simonsick, E.M.; Ferrucci, L.; Fried, L.P. Fruit and vegetable intake, physical activity, and mortality in older community-dwelling women. J. Am. Geriatr. Soc. 2012, 60, 862–868. [Google Scholar] [CrossRef] [PubMed]
  7. Boeing, H.; Bechthold, A.; Bub, A.; Ellinger, S.; Haller, D.; Kroke, A.; Leschik-Bonnet, E.; Muller, M.J.; Oberritter, H.; Schulze, M.; et al. Critical review: Vegetables and fruit in the prevention of chronic diseases. Eur. J. Nutr. 2012, 51, 637–663. [Google Scholar] [CrossRef] [PubMed]
  8. Li, A.N.; Li, S.; Zhang, Y.J.; Xu, X.R.; Chen, Y.M.; Li, H.B. Resources and biological activities of natural polyphenols. Nutrients 2014, 6, 6020–6047. [Google Scholar] [CrossRef] [PubMed]
  9. Zhang, Y.J.; Gan, R.Y.; Li, S.; Zhou, Y.; Li, A.N.; Xu, D.P.; Li, H.B. Antioxidant phytochemicals for the prevention and treatment of chronic diseases. Molecules 2015, 20, 21138–21156. [Google Scholar] [CrossRef] [PubMed]
  10. Guo, Y.J.; Deng, G.F.; Xu, X.R.; Wu, S.; Li, S.; Xia, E.Q.; Li, F.; Chen, F.; Ling, W.H.; Li, H.B. Antioxidant capacities, phenolic compounds and polysaccharide contents of 49 edible macro-fungi. Food Funct. 2012, 3, 1195–1205. [Google Scholar] [CrossRef] [PubMed]
  11. Moure, A.; Cruz, J.M.; Franco, D.; Dominguez, J.M.; Sineiro, J.; Dominguez, H.; Nunez, M.J.; Parajo, J.C. Natural antioxidants from residual sources. Food Chem. 2001, 72, 145–171. [Google Scholar] [CrossRef]
  12. Song, F.L.; Gan, R.Y.; Zhang, Y.; Xiao, Q.; Kuang, L.; Li, H.B. Total phenolic contents and antioxidant capacities of selected Chinese medicinal plants. Int. J. Mol. Sci. 2010, 11, 2362–2372. [Google Scholar] [CrossRef] [PubMed]
  13. Liu, T.; Chen, Y.Y.; Chao, L.F.; Wang, S.Q.; Wu, W.; Dai, S.P.; Wang, F.; Fan, Q.; Zhou, R.C. Extensive hybridization and introgression between Melastoma candidum and M-sanguineum. PLoS ONE 2014, 9, e96680. [Google Scholar] [CrossRef] [PubMed]
  14. Chen, J. Melastomataceae. In Flora Reipublicae Popularis Sinicae; Chen, C., Chang, H., Miau, R., Hsu, T., Eds.; Science Press: Beijing, China, 1984; Volume 53, pp. 152–162. [Google Scholar]
  15. Lee, I.; Kim, I.S.; Lee, Y.M.; Lee, Y.; Kim, J.; Kim, J.S. 2″,4″-o-diacetylquercitrin, a novel advanced glycation end-product formation and aldose reductase inhibitor from Melastoma sanguineum. Chem. Pharm. Bull. 2013, 61, 662–665. [Google Scholar] [CrossRef] [PubMed]
  16. Xie, F. Chinese Medicine Useful for Treating Osteomyelitis and Inflammation, Comprises Embelia laeta, Melastoma sanguineum and Paeonia ostii. CN101919897-A; CN101919897-B. 22 December 2010. [Google Scholar]
  17. Fu, L.; Xu, B.T.; Xu, X.R.; Qin, X.S.; Gan, R.Y.; Li, H.B. Antioxidant capacities and total phenolic contents of 56 wild fruits from south china. Molecules 2010, 15, 8602–8617. [Google Scholar] [CrossRef] [PubMed]
  18. Chandrapala, J.; Oliver, C.M.; Kentish, S.; Ashokkumar, M. Use of power ultrasound to improve extraction and modify phase transitions in food processing. Food Rev. Int. 2013, 29, 67–91. [Google Scholar] [CrossRef]
  19. Chemat, F.; Zill-e-Huma; Khan, M.K. Applications of ultrasound in food technology: Processing, preservation and extraction. Ultrason. Sonochem. 2011, 18, 813–835. [Google Scholar] [CrossRef] [PubMed]
  20. Oroian, M.; Escriche, I. Antioxidants: Characterization, natural sources, extraction and analysis. Food Res. Int. 2015, 74, 10–36. [Google Scholar] [CrossRef]
  21. Dai, J.; Mumper, R.J. Plant phenolics: Extraction, analysis and their antioxidant and anticancer properties. Molecules 2010, 15, 7313–7352. [Google Scholar] [CrossRef] [PubMed]
  22. Ji, J.B.; Lu, X.H.; Cai, M.Q.; Xu, Z.C. Improvement of leaching process of geniposide with ultrasound. Ultrason. Sonochem. 2006, 13, 455–462. [Google Scholar] [CrossRef] [PubMed]
  23. Xia, E.-Q.; Ai, X.-X.; Zang, S.-Y.; Guan, T.-T.; Xu, X.-R.; Li, H.-B. Ultrasound-assisted extraction of phillyrin from Forsythia suspensa. Ultrason. Sonochem. 2011, 18, 549–552. [Google Scholar] [CrossRef] [PubMed]
  24. Soria, A.C.; Villamiel, M. Effect of ultrasound on the technological properties and bioactivity of food: A review. Trends Food Sci. Technol. 2010, 21, 323–331. [Google Scholar] [CrossRef]
  25. Pico, Y. Ultrasound-assisted extraction for food and environmental samples. TrAC Trend Anal. Chem. 2013, 43, 84–99. [Google Scholar] [CrossRef]
  26. Gan, C.Y.; Latiff, A.A. Optimization of the solvent extraction of bioactive compounds from Parkia speciosa pod using response surface methodology. Food Chem. 2011, 124, 1277–1283. [Google Scholar] [CrossRef]
  27. Esclapez, M.D.; Garcia-Perez, J.V.; Mulet, A.; Carcel, J.A. Ultrasound-assisted extraction of natural products. Food Eng. Rev. 2011, 3, 108–120. [Google Scholar] [CrossRef]
  28. Carciochi, R.A.; Manrique, G.D.; Dimitrov, K. Optimization of antioxidant phenolic compounds extraction from quinoa (Chenopodium quinoa) seeds. J. Food Sci. Technol. 2015, 52, 4396–4404. [Google Scholar] [CrossRef] [PubMed]
  29. D’Alessandro, L.G.; Dimitrov, K.; Vauchel, P.; Nikov, I. Kinetics of ultrasound assisted extraction of anthocyanins from Aronia melanocarpa (black chokeberry) wastes. Chem. Eng. Res. Des. 2014, 92, 1818–1826. [Google Scholar] [CrossRef]
  30. Saikia, S.; Mahnot, N.K.; Mahanta, C.L. Optimization of phenolic extraction from Averrhoa carambola pomace by response surface methodology and its microencapsulation by spray and freeze drying. Food Chem. 2015, 171, 144–152. [Google Scholar] [CrossRef] [PubMed]
  31. Bezerra, M.A.; Santelli, R.E.; Oliveira, E.P.; Villar, L.S.; Escaleira, L.A. Response surface methodology (RSM) as a tool for optimization in analytical chemistry. Talanta 2008, 76, 965–977. [Google Scholar] [CrossRef] [PubMed]
  32. Belwal, T.; Dhyani, P.; Bhatt, I.D.; Rawal, R.S.; Pande, V. Optimization extraction conditions for improving phenolic content and antioxidant activity in Berberis asiatica fruits using response surface methodology (RSM). Food Chem. 2016, 207, 115–124. [Google Scholar] [CrossRef] [PubMed]
  33. Ozdemir, C.; Guener, A. Solubility profiles of poly(ethylene glycol)/solvent systems, I: Qualitative comparison of solubility parameter approaches. Eur. Polym. J. 2007, 43, 3068–3093. [Google Scholar] [CrossRef]
  34. Xu, Y.; Pan, S.Y. Effects of various factors of ultrasonic treatment on the extraction yield of all-trans-lycopene from red grapefruit (Citrus paradise Macf.). Ultrason. Sonochem. 2013, 20, 1026–1032. [Google Scholar] [CrossRef] [PubMed]
  35. Ying, Z.; Han, X.; Li, J. Ultrasound-assisted extraction of polysaccharides from mulberry leaves. Food Chem. 2011, 127, 1273–1279. [Google Scholar] [CrossRef] [PubMed]
  36. Xu, D.P.; Zhou, Y.; Zheng, J.; Li, S.; Li, A.N.; Li, H.B. Optimization of ultrasound-assisted extraction of natural antioxidants from the flower of Jatropha integerrima by response surface methodology. Molecules 2016, 21, 18. [Google Scholar] [CrossRef] [PubMed]
  37. Galanakis, C.M.; Tornberg, E.; Gekas, V. Clarification of high-added value products from olive mill wastewater. J. Food Eng. 2010, 99, 190–197. [Google Scholar] [CrossRef]
  38. Yue, T.L.; Shao, D.Y.; Yuan, Y.H.; Wang, Z.L.; Qiang, C.Y. Ultrasound-assisted extraction, HPLC analysis, and antioxidant activity of polyphenols from unripe apple. J. Sep. Sci. 2012, 35, 2138–2145. [Google Scholar] [CrossRef] [PubMed]
  39. Both, S.; Chemat, F.; Strube, J. Extraction of polyphenols from black tea—Conventional and ultrasound assisted extraction. Ultrason. Sonochem. 2014, 21, 1030–1034. [Google Scholar] [CrossRef] [PubMed]
  40. Tabaraki, R.; Rastgoo, S. Comparison between conventional and ultrasound-assisted extractions of natural antioxidants from walnut green husk. Korean J. Chem. Eng. 2014, 31, 676–683. [Google Scholar] [CrossRef]
  41. Xu, D.P.; Zheng, J.; Zhou, Y.; Li, Y.; Li, S.; Li, H.B. Ultrasound-assisted extraction of natural antioxidants from the flower of Limonium sinuatum: Optimization and comparison with conventional methods. Food Chem. 2017, 217, 552–559. [Google Scholar] [CrossRef] [PubMed]
  42. Ma, Y.Q.; Ye, X.Q.; Fang, Z.X.; Chen, J.C.; Xu, G.H.; Liu, D.H. Phenolic compounds and antioxidant activity of extracts from ultrasonic treatment of satsuma mandarin (Citrus unshiu Marc.) peels. J. Agric. Food Chem. 2008, 56, 5682–5690. [Google Scholar] [CrossRef] [PubMed]
  43. Wang, J.; Sun, B.G.; Cao, Y.P.; Tian, Y.A.; Li, X.H. Optimization of ultrasound-assisted extraction of phenolic compounds from wheat bran. Food Chem. 2008, 106, 804–810. [Google Scholar] [CrossRef]
  44. Fu, L.; Xu, B.T.; Xu, X.R.; Gan, R.Y.; Zhang, Y.; Xia, E.Q.; Li, H.B. Antioxidant capacities and total phenolic contents of 62 fruits. Food Chem. 2011, 129, 345–350. [Google Scholar] [CrossRef]
  45. Deng, G.F.; Lin, X.; Xu, X.R.; Gao, L.L.; Xie, J.F.; Li, H.B. Antioxidant capacities and total phenolic contents of 56 vegetables. J. Funct. Food. 2013, 5, 260–266. [Google Scholar] [CrossRef]
  46. Sakakibara, H.; Honda, Y.; Nakagawa, S.; Ashida, H.; Kanazawa, K. Simultaneous determination of all polyphenols in vegetables, fruits, and teas. J. Agric. Food Chem. 2003, 51, 571–581. [Google Scholar] [CrossRef] [PubMed]
  47. Hemalatha, P.; Bomzan, D.P.; Rao, B.V.S.; Sreerama, Y.N. Distribution of phenolic antioxidants in whole and milled fractions of quinoa and their inhibitory effects on alpha-amylase and alpha-glucosidase activities. Food Chem. 2016, 199, 330–338. [Google Scholar] [CrossRef] [PubMed]
  48. Xu, D.P.; Zheng, J.; Zhou, Y.; Li, Y.; Li, S.; Li, H.B. Extraction of natural antioxidants from the Thelephora ganbajun mushroom by an ultrasound-assisted extraction technique and evaluation of antiproliferative activity of the extract against human cancer cells. Int. J. Mol. Sci. 2016, 17, 1664. [Google Scholar] [CrossRef] [PubMed]
  49. Samanidou, V.; Tsagiannidis, A.; Sarakatsianos, I. Simultaneous determination of polyphenols and major purine alkaloids in greek sideritis species, herbal extracts, green tea, black tea, and coffee by high-performance liquid chromatography-diode array detection. J. Sep. Sci. 2012, 35, 608–615. [Google Scholar] [CrossRef] [PubMed]
  50. Oszmianski, J.; Wojdylo, A. Aronia melanocarpa phenolics and their antioxidant activity. Eur. Food Res. Technol. 2005, 221, 809–813. [Google Scholar] [CrossRef]
  51. Pan, M.H.; Chiou, Y.S.; Wang, Y.J.; Ho, C.T.; Lin, J.K. Multistage carcinogenesis process as molecular targets in cancer chemoprevention by epicatechin-3-gallate. Food Funct. 2011, 2, 101–110. [Google Scholar] [CrossRef] [PubMed]
  52. Khan, A.K.; Rashid, R.; Fatima, N.; Mahmood, S.; Mir, S.; Khan, S.; Jabeen, N.; Murtaza, G. Pharmacological activities of protocatechuic acid. Acta Pol. Pharm. 2015, 72, 643–650. [Google Scholar] [PubMed]
  53. Upadhyay, R.; Rao, L.J.M. An outlook on chlorogenic acids-occurrence, chemistry, technology, and biological activities. Crit. Rev. Food Sci. Nutr. 2013, 53, 968–984. [Google Scholar] [CrossRef] [PubMed]
  54. Mandel, S.A.; Amit, T.; Kalfon, L.; Reznichenko, L.; Weinreb, O.; Youdim, M.B.H. Cell signaling pathways and iron chelation in the neurorestorative activity of green tea polyphenols: Special reference to epigallocatechin gallate (EGCG). J. Alzheimers Dis. 2008, 15, 211–222. [Google Scholar]
  55. Shay, J.; Elbaz, H.A.; Lee, I.; Zielske, S.P.; Malek, M.H.; Huttemann, M. Molecular mechanisms and therapeutic effects of (−)-epicatechin and other polyphenols in cancer, inflammation, diabetes, and neurodegeneration. Oxid. Med. Cell. Longev. 2015, 2015, 181260. [Google Scholar] [CrossRef] [PubMed]
  56. Hosseinzadeh, H.; Nassiri-Asl, M. Review of the protective effects of rutin on the metabolic function as an important dietary flavonoid. J. Endocrinol. Investig. 2014, 37, 783–788. [Google Scholar] [CrossRef] [PubMed]
  57. Li, Y.; Chen, Y.L.; Li, H. Recovery and purification of cholesterol from cholesterol-beta-cyclodextrin inclusion complex using ultrasound-assisted extraction. Ultrason. Sonochem. 2017, 34, 281–288. [Google Scholar] [CrossRef] [PubMed]
  58. Xu, D.P.; Li, Y.; Meng, X.; Zhou, T.; Zhou, Y.; Zheng, J.; Zhang, J.J.; Li, H.B. Natural antioxidants in foods and medicinal plants: Extraction, assessment and resources. Int. J. Mol. Sci. 2017, 18, 96. [Google Scholar] [CrossRef] [PubMed]
  59. Deng, G.F.; Xu, D.P.; Li, S.; Li, H.B. Optimization of ultrasound-assisted extraction of natural antioxidants from sugar apple (Annona squamosa L.) peel using response surface methodology. Molecules 2015, 20, 20448–20459. [Google Scholar] [CrossRef] [PubMed]
  60. Re, R.; Pellegrini, N.; Proteggente, A.; Pannala, A.; Yang, M.; Rice-Evans, C. Antioxidant activity applying an improved ABTS radical cation decolorization assay. Free Radic. Biol. Med. 1999, 26, 1231–1237. [Google Scholar] [CrossRef]
  61. Singleton, V.L.; Rossi, J.A. Colorimetry of total phenolics with phosphomolybdic-phosphotungstic acid reagents. Am. J. Enol. Vitic. 1965, 16, 144–158. [Google Scholar]
  62. Kalia, K.; Sharma, K.; Singh, H.P.; Singh, B. Effects of extraction methods on phenolic contents and antioxidant activity in aerial parts of Potentilla atrosanguinea lodd and quantification of its phenolic constituents by RP-HPLC. J. Agric. Food Chem. 2008, 56, 10129–10134. [Google Scholar] [CrossRef] [PubMed]
  • Sample Availability: Samples of the compounds are not available from the authors.
Figure 1. Effects of ethanol concentration (a); solvent/material ratio (b); extracting time (c); temperature (d) and ultrasound power (e) on the antioxidant activity of the extracts.
Molecules 22 00306 g001aMolecules 22 00306 g001b
Figure 2. Response surface plots of the effects of solvent/material ratio (mL/g) and ethanol concentration (%) (a); extracting time (min) and ethanol concentration (b); and solvent/material ratio and extracting time (c) on TEAC value (μmol Trolox/g DW).
Molecules 22 00306 g002
Table 1. The experimental design, actual value, and predicted value, of response surface methodology.
RunX1 (Ethanol Concentration, %)X2 (Solvent/Material Ratio, mL/g)X3 (Extracting Time, min)Y (TEAC Value, μmol Trolox/g DW)
Actual ValuePredicted Value
1502525988.49998.34
2502525981.79998.34
3403515876.92905.11
4603535855.01846.94
54035351067.811050.23
666.822525591.72604.16
75025251005.26998.34
833.182525999.67975.19
950258.18789.55758.87
105041.8225911.31921.25
115025251045.49998.34
12601535799.64779.95
13502541.82997.431016.08
14508.1825846.54824.57
155025251008.61998.34
16603515689.15676.78
17601515593.10619.19
18502525958.32998.34
19401535971.98992.86
20401515840.55857.13
validation42.9828.2934.291074.611077.37
Table 2. Analysis of variance (ANOVA) of the response surface model.
SourceSum of SquaresdfMean SquareF Valuep ValueSignificant
Model368,043.36940,893.7140.59<0.0001significant
X1(Ethanol concentration)166,172.901166,172.90164.93<0.0001
X2 (Solvent/material ratio)11,282.75111,282.7511.200.0074
X3 (Extracting time)79,864.25179,864.2579.27<0.0001
X1X246.19146.190.050.8348
X1X3313.391313.390.310.5893
X2X344.07144.070.040.8385
X1278,430.22178,430.2277.84<0.0001
X2228,340.63128,340.6328.130.0003
X3222,140.13122,140.1321.970.0009
Residual10,075.50101007.55
Lack of Fit5726.4951145.301.320.3850Not significant
Pure Error4349.025869.80
Cor Total378,118.8619
R-Squared0.973
Adj R-Squared0.949
Table 3. The comparison of UAE with conventional extraction methods.
Extracting MethodsEthanol ConcentrationTimeTemperatureTEAC Value (μmol Trolox/g DW)TPC (mg GAE/g DW)TFC (mg QE/g DW)
Maceration42.98%24 h25 °C723.27 ± 11.61104.21 ± 2.171.39 ± 0.07
Soxhlet42.98%4 h95 °C518.37 ± 23.2376.05 ± 2.711.89 ± 0.16
UAE42.98%34.29 min60 °C1074.61 ± 32.56158.61 ± 6.442.58 ± 0.18
Table 4. The contents of phenolic components in extract.
Phenolic ComponentsRetention Time (tR, min)Parent Ion (m/z, [M − H]¯)Product Ion (m/z)Contents (μg/g DW)
epicatechin gallate6.874411691019.57 ± 99.39
epicatechin5.428920390.34 ± 4.84
rutin9.6760930061.6 ± 1.59
epigallocatechin3.0330513728.67 ± 2.62
protocatechuic acid3.09152.9107.83.22 ± 0.23
chlorogenic acid4.133531912.34 ± 0.28
quercetin11.83011791.39 ± 0.18
Table 5. Independent variables and their five levels used for central composite rotatable design.
Independent VariableUnitsSymbolCoded Levels
−1.68−1011.68
Ethanol concentration% (v/v)X133.1840506066.82
Solvent/material ratiomL/gX28.1815253541.82
Extracting timeminX38.1815253541.82

