Article

Stable Carbon Isotope Composition of the Lipids in Natural Ophiocordyceps sinensis from Major Habitats in China and Its Substitutes

1
Dongguan Key Laboratory of Environmental Medicine, School of Public Health, Guangdong Medical University, Dongguan 523808, China
2
Guangdong Provincial Key Laboratory of Marine Resources and Coastal Engineering/South China Sea Bioresource Exploitation and Utilization Collaborative Innovation Center, School of Marine Sciences, Sun Yat-Sen University, Guangzhou 510006, China
*
Authors to whom correspondence should be addressed.
Submission received: 21 August 2017 / Revised: 10 September 2017 / Accepted: 15 September 2017 / Published: 18 September 2017

Abstract

:
Ophiocordyceps sinensis is one rare medicinal fungus produced in the Qinghai-Tibetan Plateau. Its quality and price varies hugely with different habitat, and its numerous substitutes have sprung up in functional food markets. This paper aims to discriminate the geographic origin of wild O. sinensis and its substitutes via element analyzer–isotope ratio mass spectrometry and gas chromatography–isotope ratio mass spectrometry. The δ13C values of major fatty acids in the lipids of O. sinensis are characterized unanimously by the variation relation C18:0 < C18:2 ≈ C16:0 < C18:1, while their fluctuation intervals are notably different between those of neutral and polar lipids. The comparative analysis of the δ13C ratios of major fatty acids in lipids of O. sinensis suggests that the δ13C patterns may be sensitive potential indicators to discriminate its geographical origin. The δ13C values of individual major fatty acids of lipids from the cultivated stromata of Cordyceps militaris (SCM), the fermented mycelia of Hirsurella sinensis (FMH) and Paecilomyces epiali (FMP) range from −31.2‰ to −29.7‰, −16.9‰ to −14.3‰, and −26.5‰ to −23.9‰, respectively. Their δ13C pattern of individual major fatty acids may be used as a potential indicator to discriminate the products of natural O. sinensis and its substitutes.

1. Introduction

Ophiocordyceps sinensis, popularly named as winter-worm-summer-grass (Dong Chong Xia Cao in Chinese), is one precious insect larva–fungus symbiote mainly occurred in the Qinghai-Tibetan Plateau [1,2]. The Latin term of Ophiocordyceps sinensis (O. sinensis) refers to the teleomorph stage of the larva–fungus complex, and has been renamed from Cordyceps sinensis since 2007 [3]. Its anamorph has been confirmed as Hirsurella sinensis based on the mainstream view [4]. In this paper, we use O. sinensis to refer to its teleomorph and anamorph according to the regulation that one fungus only has one Latin name [5].
For more than 2000 years in China, O. sinensis has been used as a rare functional food or traditional medicinal herb to promote health and treat diverse chronic diseases [6,7,8]. Recent studies have suggested that O. sinensis possesses various components with the wide biological activities [6,9]. The investigation of O. sinensis has attracted our great attention, and become a hot topic due to its specific pharmacological effects [10]. It is well known that the wild resource of O. sinensis is extremely scarce because of its obligate parasitism [11,12] and eco-geographical preference [1,2,13]. In the latest decade, the wild yield of O. sinensis has continuously decreased, while its retail prices have accordingly increased due to excessive excavation [14,15]. It is particularly noteworthy that the prices of wild O. sinensis evidently vary according to its quality that closely depends on different geographic origins [16].
To alleviate the contradiction between the supply and demand of O. sinensis, many studies have been accordingly carried out in various academic fields. Diverse studies have involved in its artificial cultivation [15], but the large-scale man-made development has still constrained by the key technique of the host larva being infected by O. sinensis. Owing to the existence of this issue, many investigators focused on studying its alternatives, such as artificial cultivation of other Cordyceps fungi isolated from the stroma of O. sinensis as well as their fermented products [17], or artificially synthesizing their secondary metabolites [8]. Although some progress has been made, these substitutes have not replaced wild O. sinensis due to the differences in their minor bioactive substances [18]. In terms of their chemical compositions, previous studies are mainly concentrated on water-soluble components. To further understand the lipids of wild O. sinensis, the fatty acid composition of neutral and polar lipids in wild O. sinensis has been measured from several high-altitude habitats [13]. Simultaneously, we further investigated the fatty acid composition of neutral and polar lipids in indoor-cultivated O. sinensis at a high-altitude laboratory in the Tibetan Plateau [19]. However, the so-called artificially cultured or synthesized products are not recommended in the recent situation of the unclear functional components in O. sinensis. It is consensus that the obvious function difference exists among artificial, semi-artificial and wild O. sinensis, which may result from the specific functional ingredients biosynthesized by the host Thitarodes larva and O. sinensis in extreme environments [13,19]. Recently, there is indeed the adulteration in the processed products of natural O. sinensis with its substitutes [20], which seriously hurts the consumers and also disturbs the markets. Therefore, it is of significance to establish some effective indicators for discriminating this kind of adulteration or even the geographical origin of wild O. sinensis.
Previously, empirical methods based on the morphology, color or odor have been widely applied to discriminate natural O. sinensis from its substitutes [21]. In recent decades, health foods derived from O. sinensis have been extremely popular [6], and the conventional methods have become powerless for identifying the adulteration of processed products of natural O. sinensis with its substitutes. Up to date, the HPLC fingerprint method seems to be most effective [22]. Stable carbon isotope technique has been widely used to study the circulation of materials in the biosphere due to its remarkable advantage in tracing the long-term diet of animals [23]. The δ13C values of organisms or foods have also been widely applied as sensitive markers for discriminating their geographical origins and food adulteration [24,25,26,27,28,29]. Our group had employed stable carbon isotope analysis to study the diet of the host Thitarodes larva in the habitat of O. sinensis and the fungus–larva relation in the formation of O. sinensis, revealing that the humic matters in habitat soils were also one alternative food of the host larva except conventional tender plant roots [30]; and the site near the head of the host larva was the initial target attacked by O. sinensis [31]. Although our group reported the fatty acid composition of polar and neutral lipids in O. sinensis [13,19], to our knowledge, no report has involved the stable carbon isotope composition of lipids in wild O. sinensis and its artificially cultivated substitutes. In the present study, stable carbon isotope composition of the dominant fatty acids in polar and neutral lipids is presented for natural O. sinensis in seven typical habitats in China and several Cordyceps substitutes. The result may be used to discuss the impact of environmental factors on lipid synthesis in the formation of O. sinensis, determine the geographical origin of wild O. sinensis and discriminate the products of natural O. sinensis and its substitutes.

2. Results and Discussion

2.1. δ13C Values of the Bulk Samples of O. sinensis

The δ13C values of the bulk samples of O. sinensis (Table 1) determined by elementary analyzer–isotope ratio mass spectrometer (EA–IRMS) are listed in Table 2. The results show that the δ13C values range from −27.5‰ to −25.3‰. The δ13C average values of O. sinensis in seven producing areas (Figure 1) were −26.2‰ (YN), −26.4‰ (HM), −25.5‰ (NQ), −26.6‰ (ML), −25.7‰ (NM), −26.9‰ (SJ), and −25.7‰ (MZ), respectively.

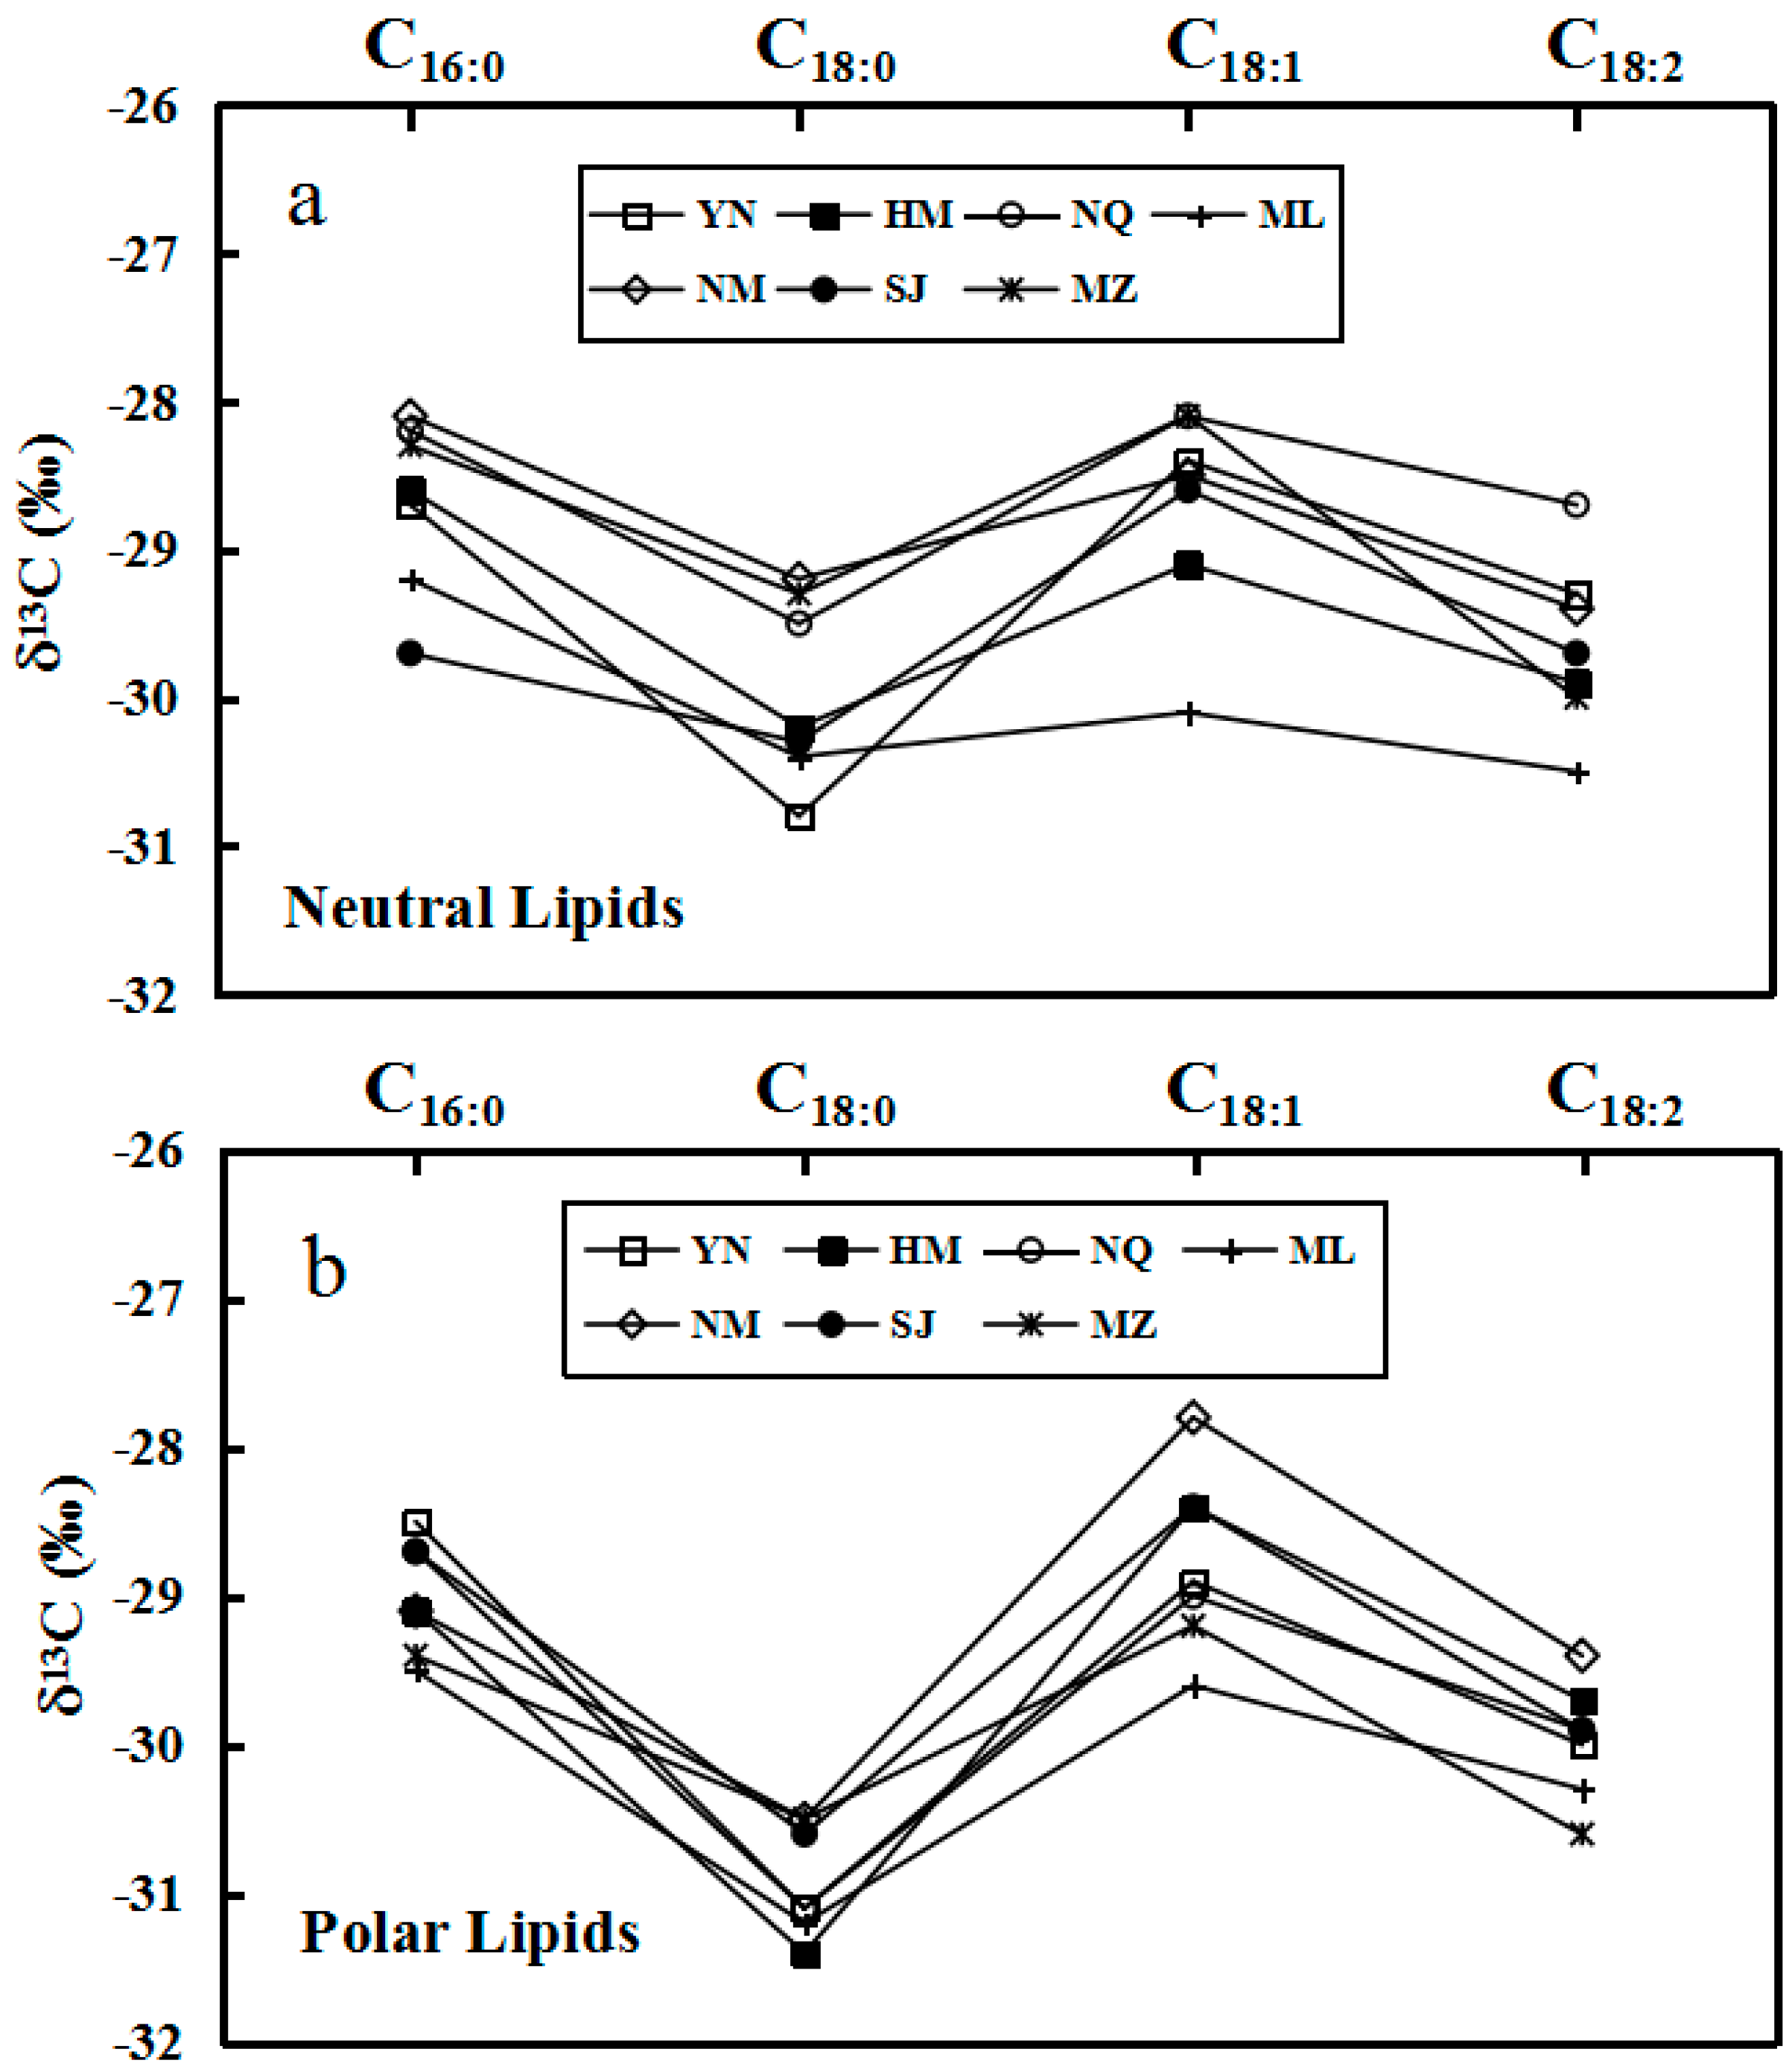
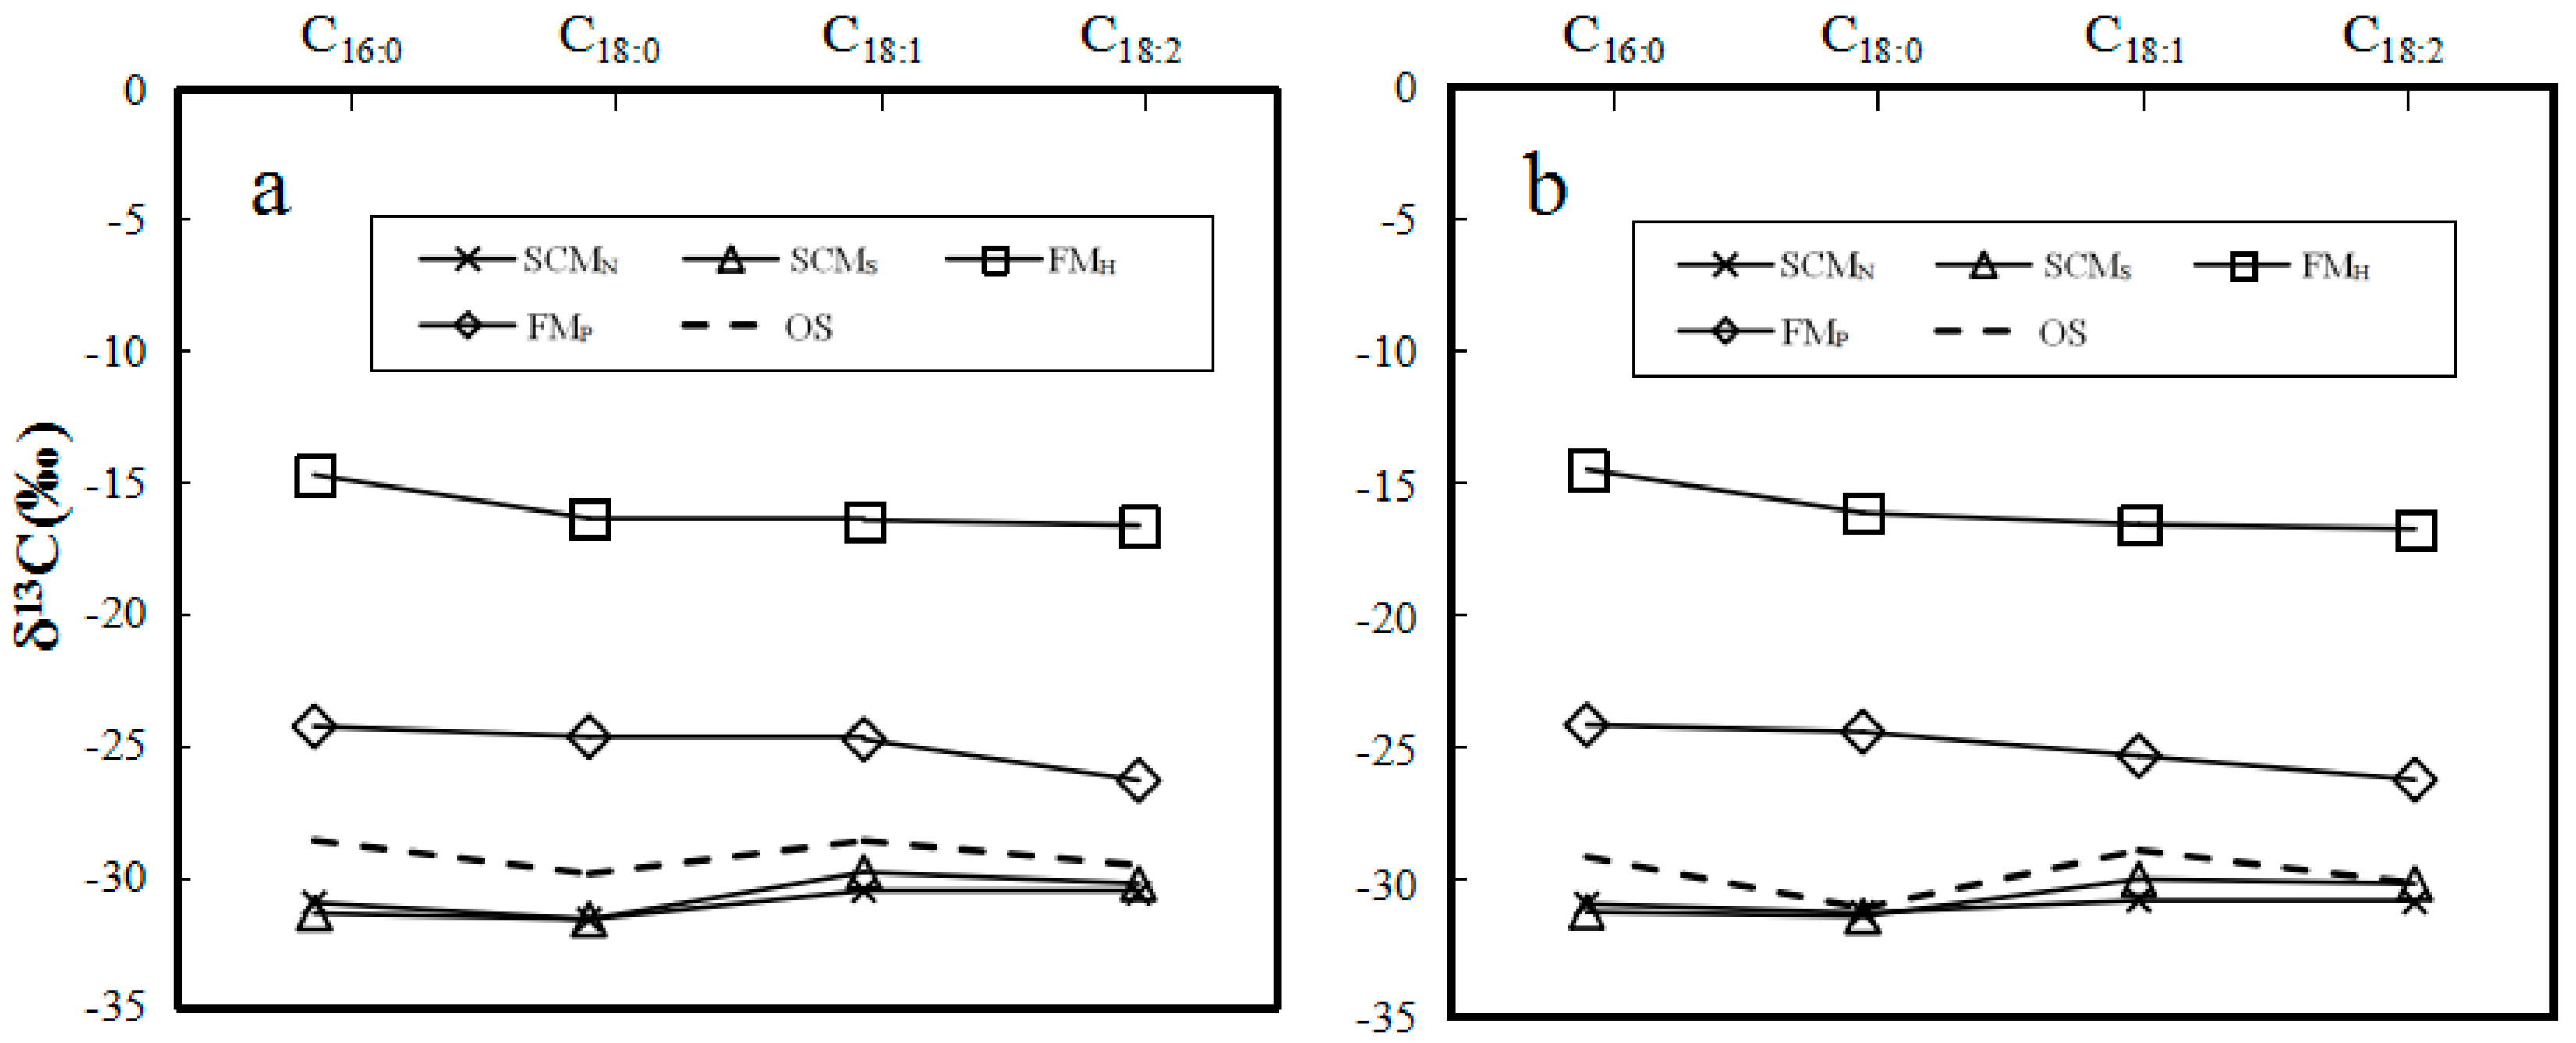
2.2. δ13C Values of Individual Major Fatty Acids of Neutral and Polar Lipids from O. sinensis and Its Substitutes

The δ13C values of individual major fatty acids of neutral and polar lipids from O. sinensis were determined by gas chromatography–isotope ratio mass spectrometer (GC–IRMS), as presented in Table 2. It can be seen in Table 2 that the δ13C values of major fatty acids C16:0, C18:0, C18:1 and C18:2 range from −31.4‰ to −27.8‰ for neutral lipids, and −31.9‰ to −27.5‰ for polar lipids, exhibiting the 13C depletion comparing with those of the bulk tissues. The δ13C values also disclosed a prominent fluctuation with the amplitudes of 3.6‰ for neutral lipids and 4.4‰ for polar lipids. The δ13C values of major fatty acids in neutral and polar lipids were characterized uniformly by the variation law C18:0 < C18:2 ≈ C16:0 < C18:1 (Table 2 and Figure 2). However, the fluctuation amplitudes were notably different between neutral and polar lipids. The δ13C values of C16:0 and C18:0 in neutral and polar lipids have the relationship of C16:0 > C18:0, and C18:0 has a pronounced 13C depletion of −0.4‰ to −2.9‰ in neutral lipids and −1.7‰ to −2.9‰ in polar lipids compared with C16:0. The δ13C values of C18:0 and C18:1 in neutral and polar lipids possess the relationship of C18:0 < C18:1, and C18:1 displays an evident 13C enrichment of +1.6‰ to +3.0‰ in neutral lipids and +2.2‰ to +3.6‰ in polar lipids. The δ13C values of C18:1 and C18:2 in neutral and polar lipids show the trend of C18:1 > C18:2, and C18:2 and exhibit the 13C depletion of −0.3‰ to −1.8‰ in neutral lipids and −0.2‰ to −2.1‰ in polar lipids.
The δ13C values of individual major fatty acids of neutral and polar lipids from the samples of SCMN, SCMS, FMH and FMP were presented in Table 3. The δ13C values of major fatty acids C16:0, C18:0, C18:1 and C18:2 in the samples of SCMN and SCMS range from −32.0‰ to −29.8‰ for neutral lipids and −31.2‰ to −29.7‰ for polar lipids, while the δ13C values of the four major fatty acids in the samples of FMH are in the intervals of −16.8‰ to −14.6‰ for neutral lipids and −16.9‰ to −14.3‰ for polar lipids. For the samples of FMP, the δ13C values of the four major fatty acids are in the ranges of −26.5‰ to −24.2‰ for neutral lipids and −26.2‰ to −23.9‰ for polar lipids.

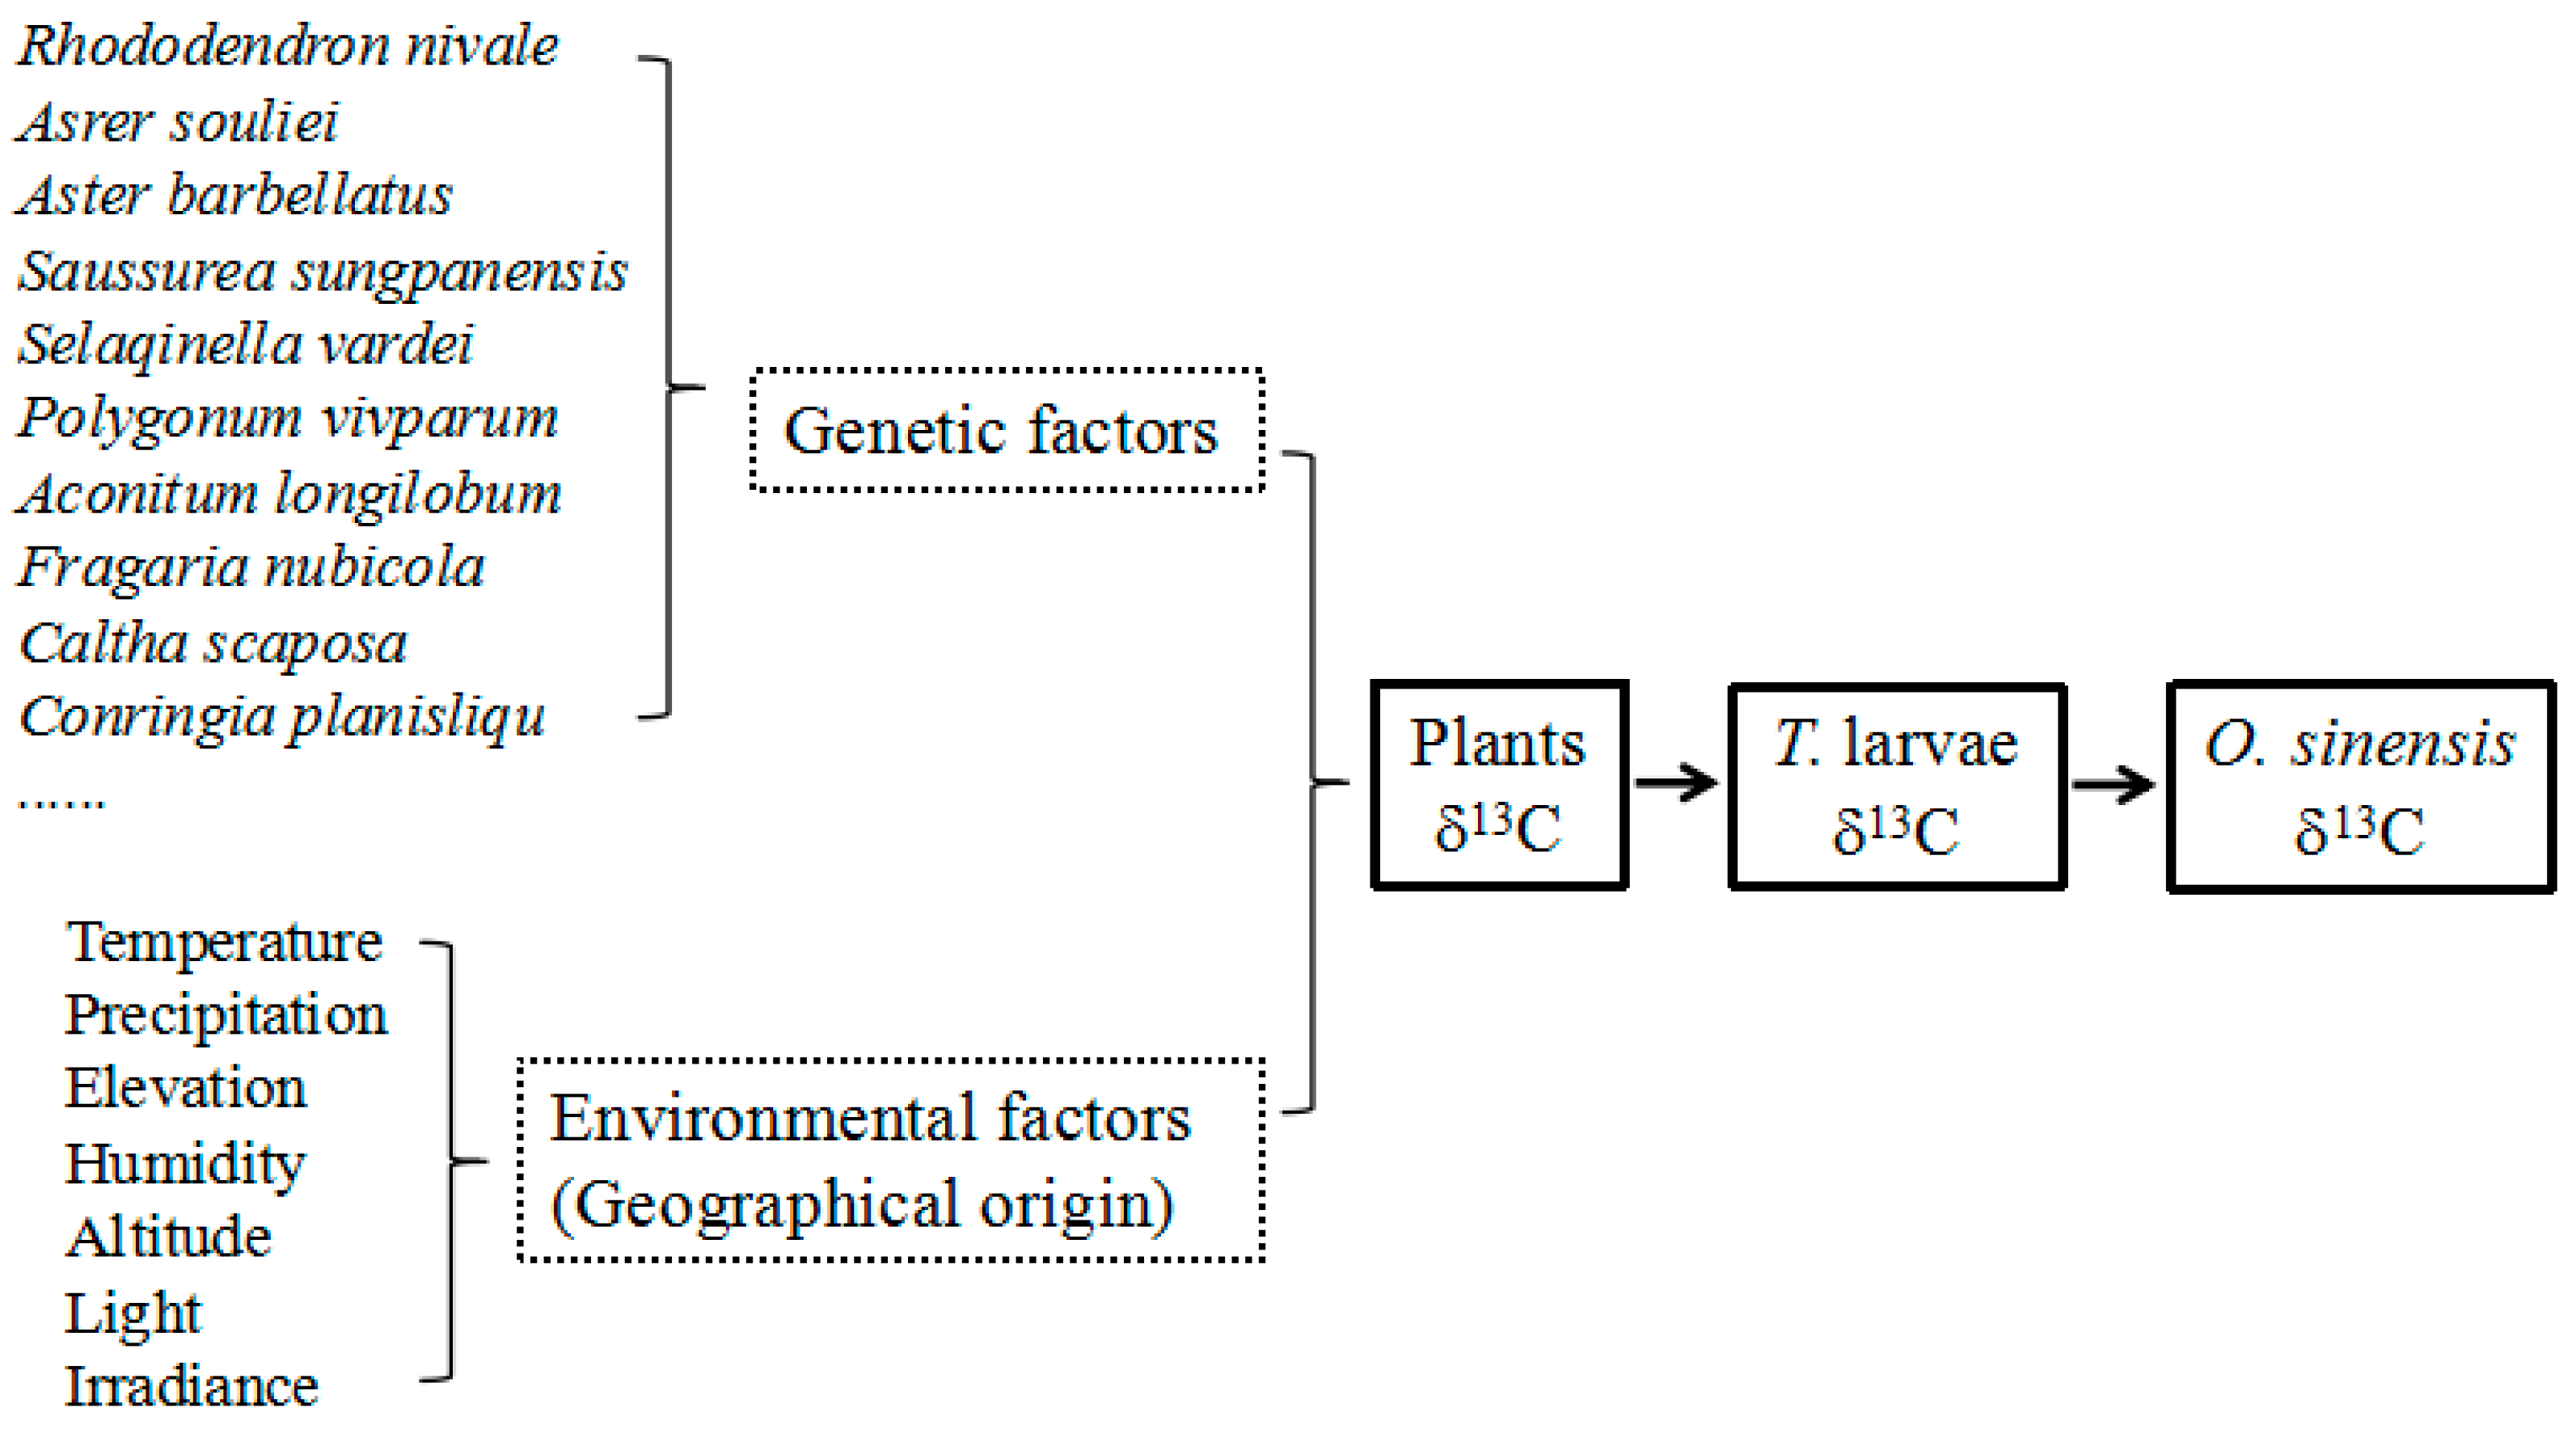
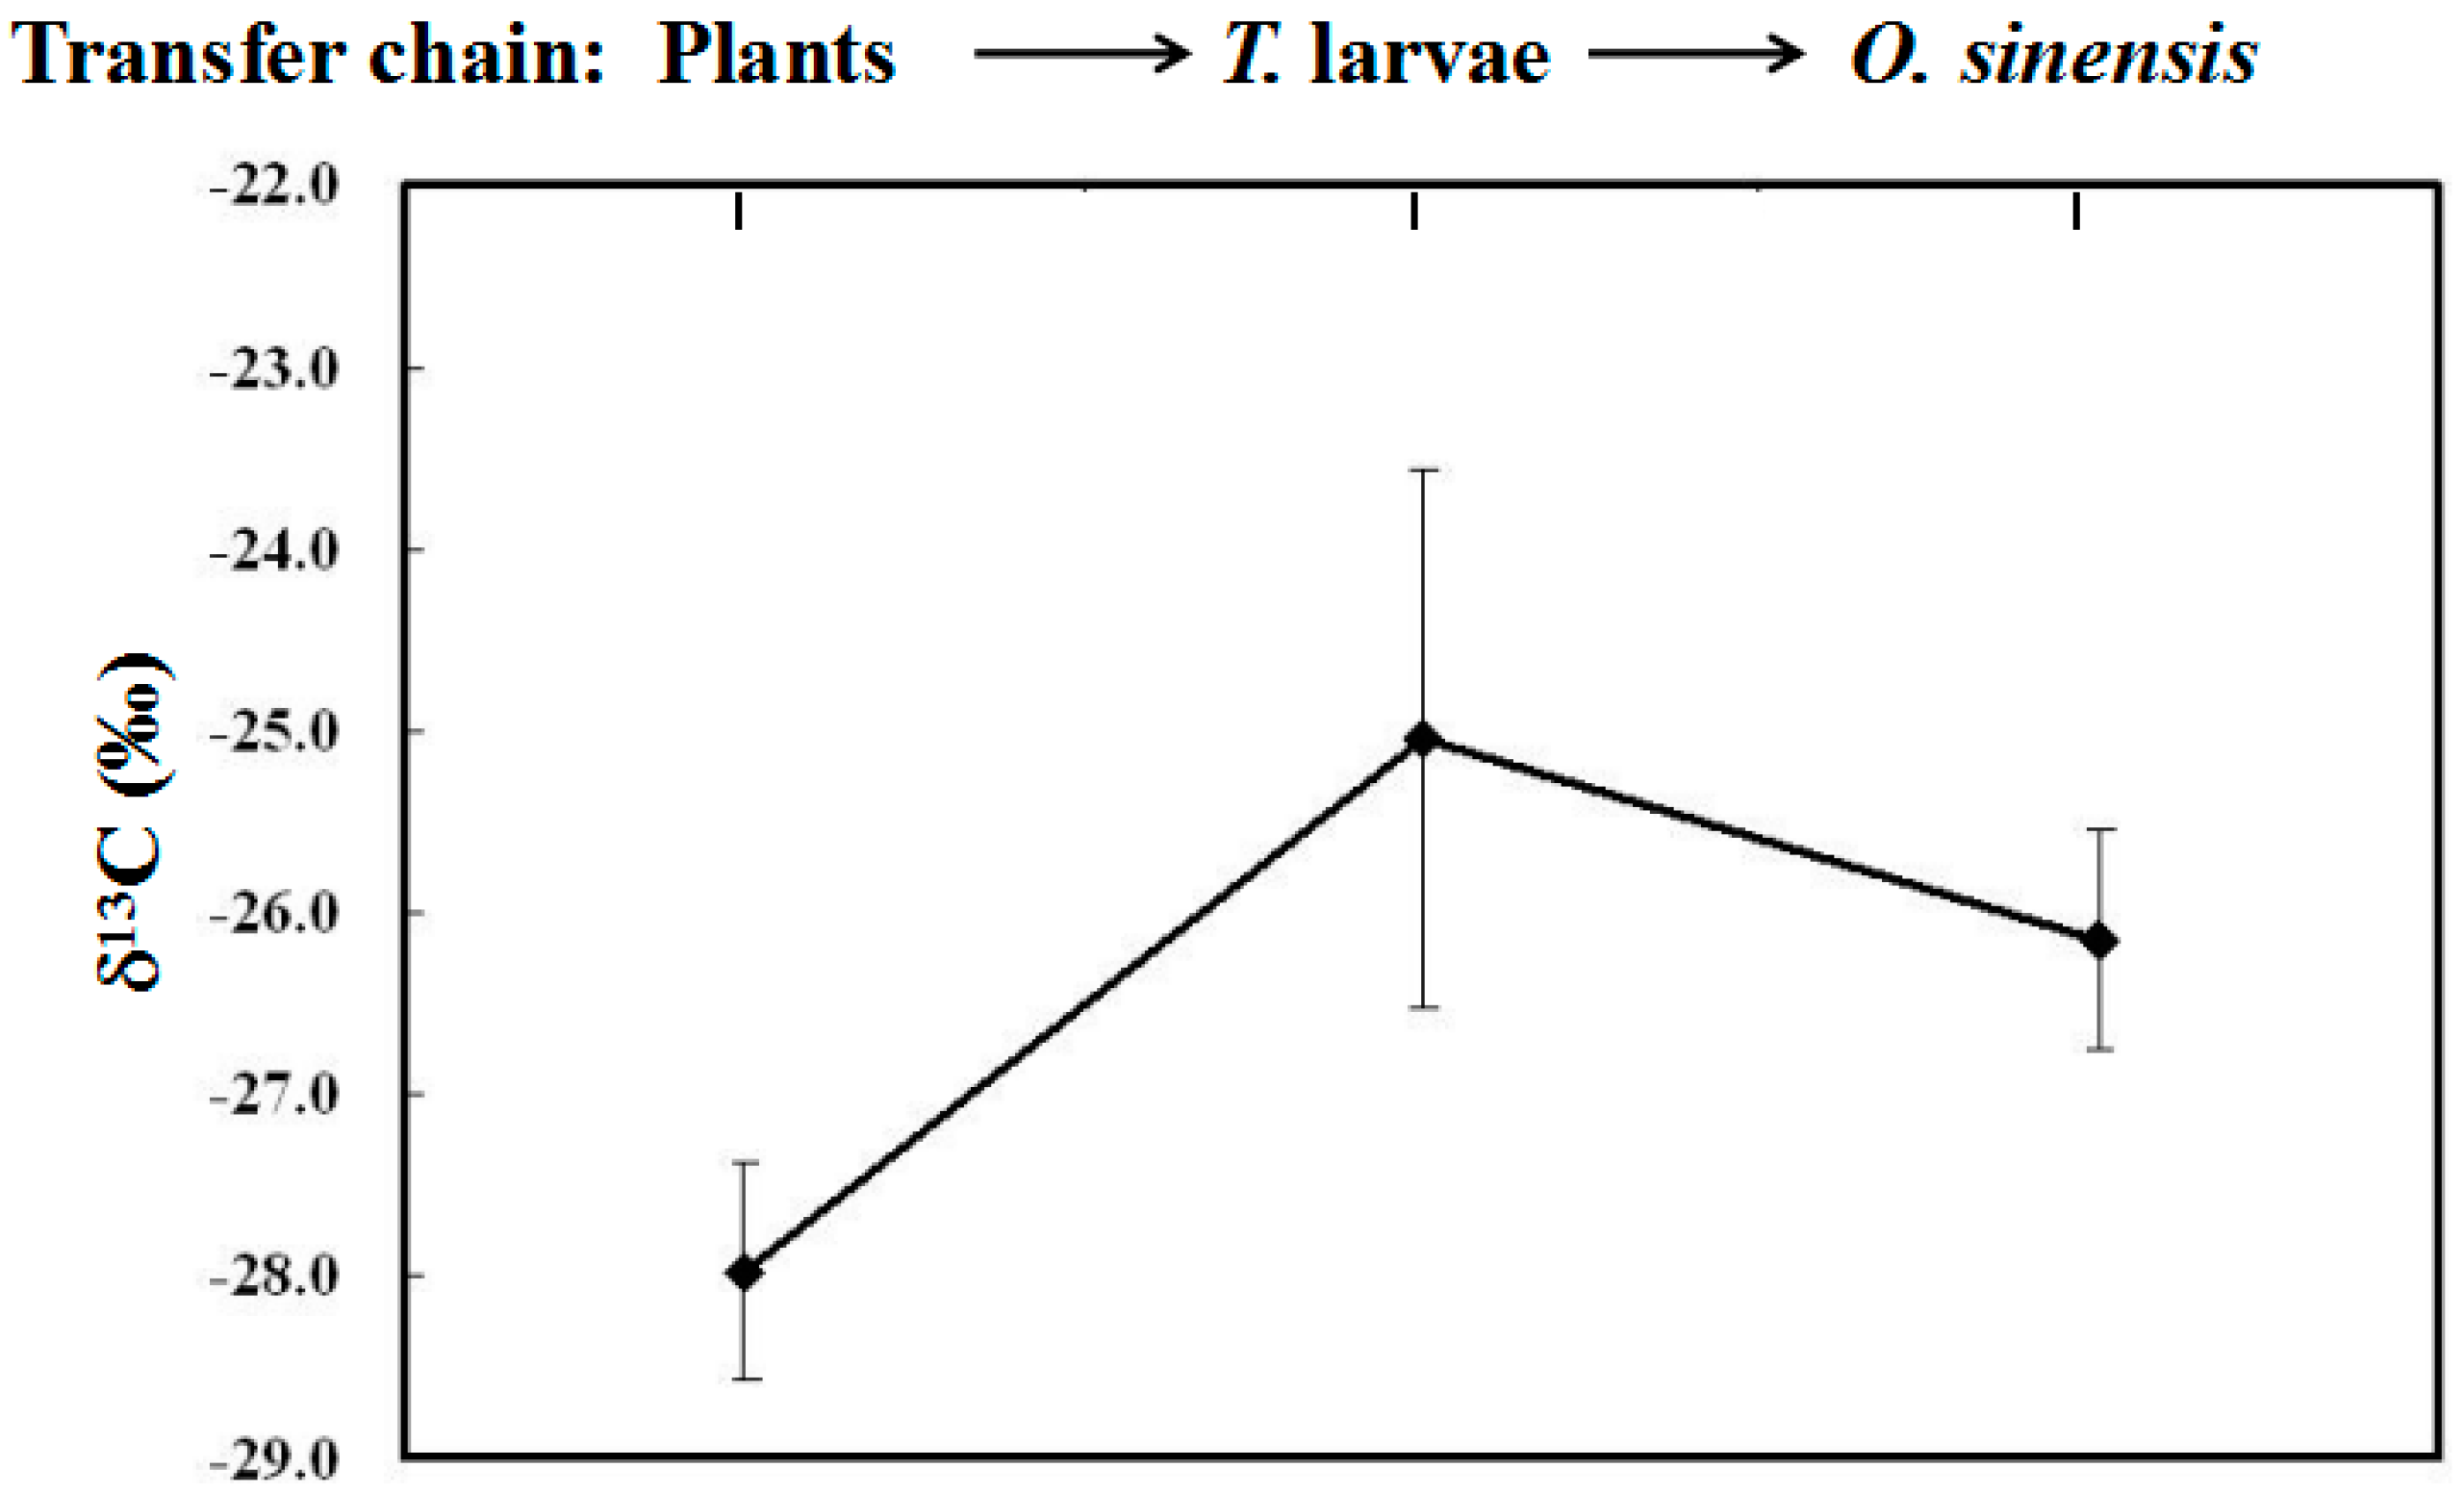
2.3. Stable Carbon Isotope Fractionation among Plants, Larvae and O. sinensis

Catabolism or synthetic metabolism of carbonaceous compounds may result in stable carbon isotope fractionation in organisms. Out of biological metabolisms, the fixation and release of CO2 are proven to be two notable processes that can induce stable carbon isotope fractionation. It is well known that the δ13C values have remarkable advantage in tracing carbon cycling in the food chain. Two stable carbon isotopes, i.e., 12C and 13C, are unevenly distributed in different compounds, which can be used to trace the chemical, physical and metabolic processes in carbon transfer [32]. For instance, C3 and C4 plants possess distinctly different δ13C values due to the isotope fractionation in the photosynthetic carbon fixation. Because heterotrophic organisms do not substantially alter the δ13C values of their foods [23], it is probable to assess the relative dependence of heterotrophic organisms on these isotopically distinct categories of primary producers.
The food chain among plants, larvae and O. sinensis in wild environments can be described as follows (Figure 3). The plants, whose tender roots are the favorite food for Thitarodes larvae, are at the bottom of the food chain Thitarodes larvae are the predator. O. sinensis, a fungus obligately parasitized on Thitarodes larvae, is the primary decomposer in the food chain. Theoretically, there is a significant correlation of the δ13C values among O. sinensis, Thitarodes larvae and plants. It can be seen in Figure 4 that there is an obvious variation of the δ13C values from plants to host larvae, and to O. sinensis based on our previous [30] and newly-obtained data. Thitarodes larva, which generally lives in deeper soils and mainly feeds on the tender roots of C3 plants [1], is the specific host of O. sinensis. Therefore, the δ13C values of O. sinensis clearly exhibit the specific δ13C ratios of C3 plants.
It has already reported that, for the decomposer, fungus, the average enrichment of δ13C values reached about 3.5‰ in comparison with its substrate [33]. However, the δ13C values of O. sinensis in this study are slightly less than those of the host larvae, which is in agreement with the result provided by Ruess et al. [34]. The above discrepancy among fungi suggests that stable carbon fractionation may also depend on different microbes. For O. sinensis, the increasing studies have proved that there is intrinsically the complexity among fungi and bacteria. The abundant diversity of microbes in the formation of O. sinensis may be one important reason resulting in its diverse bioactivities [35]. Thus, we consider that the combination of diverse microbial metabolisms in the host larva as one substrate may ultimately cause the specific stable carbon composition of O. sinensis.

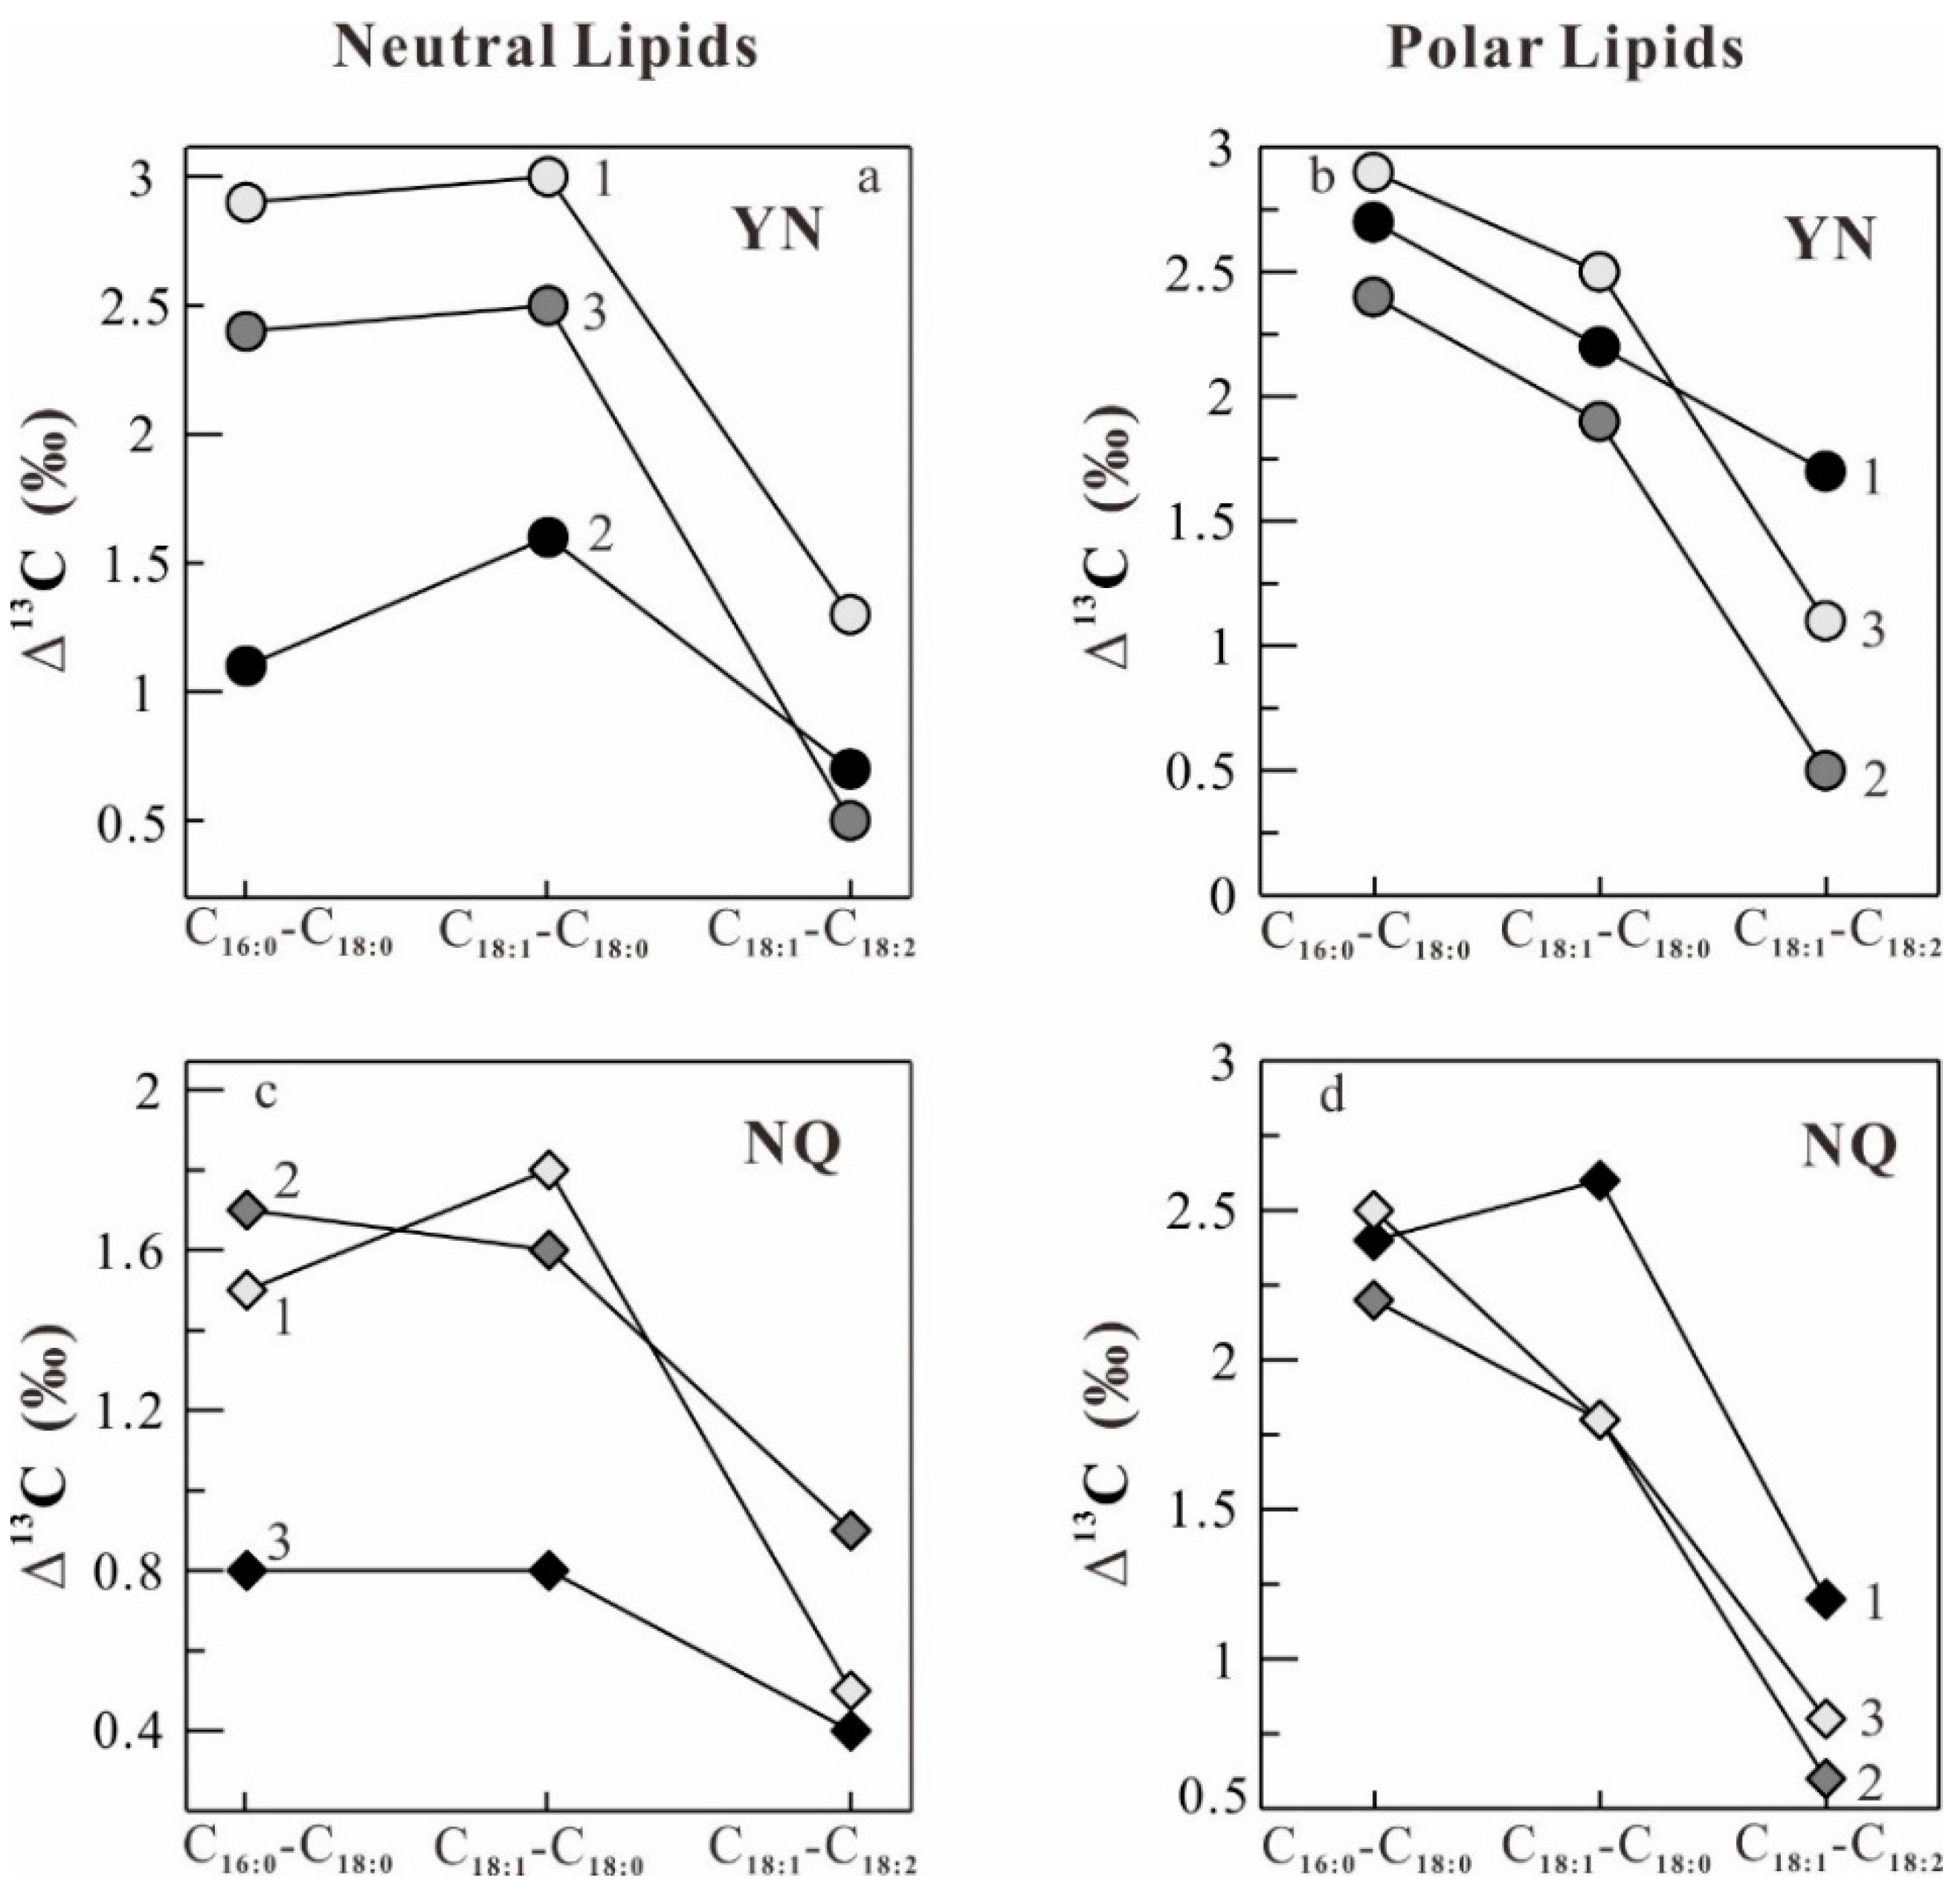
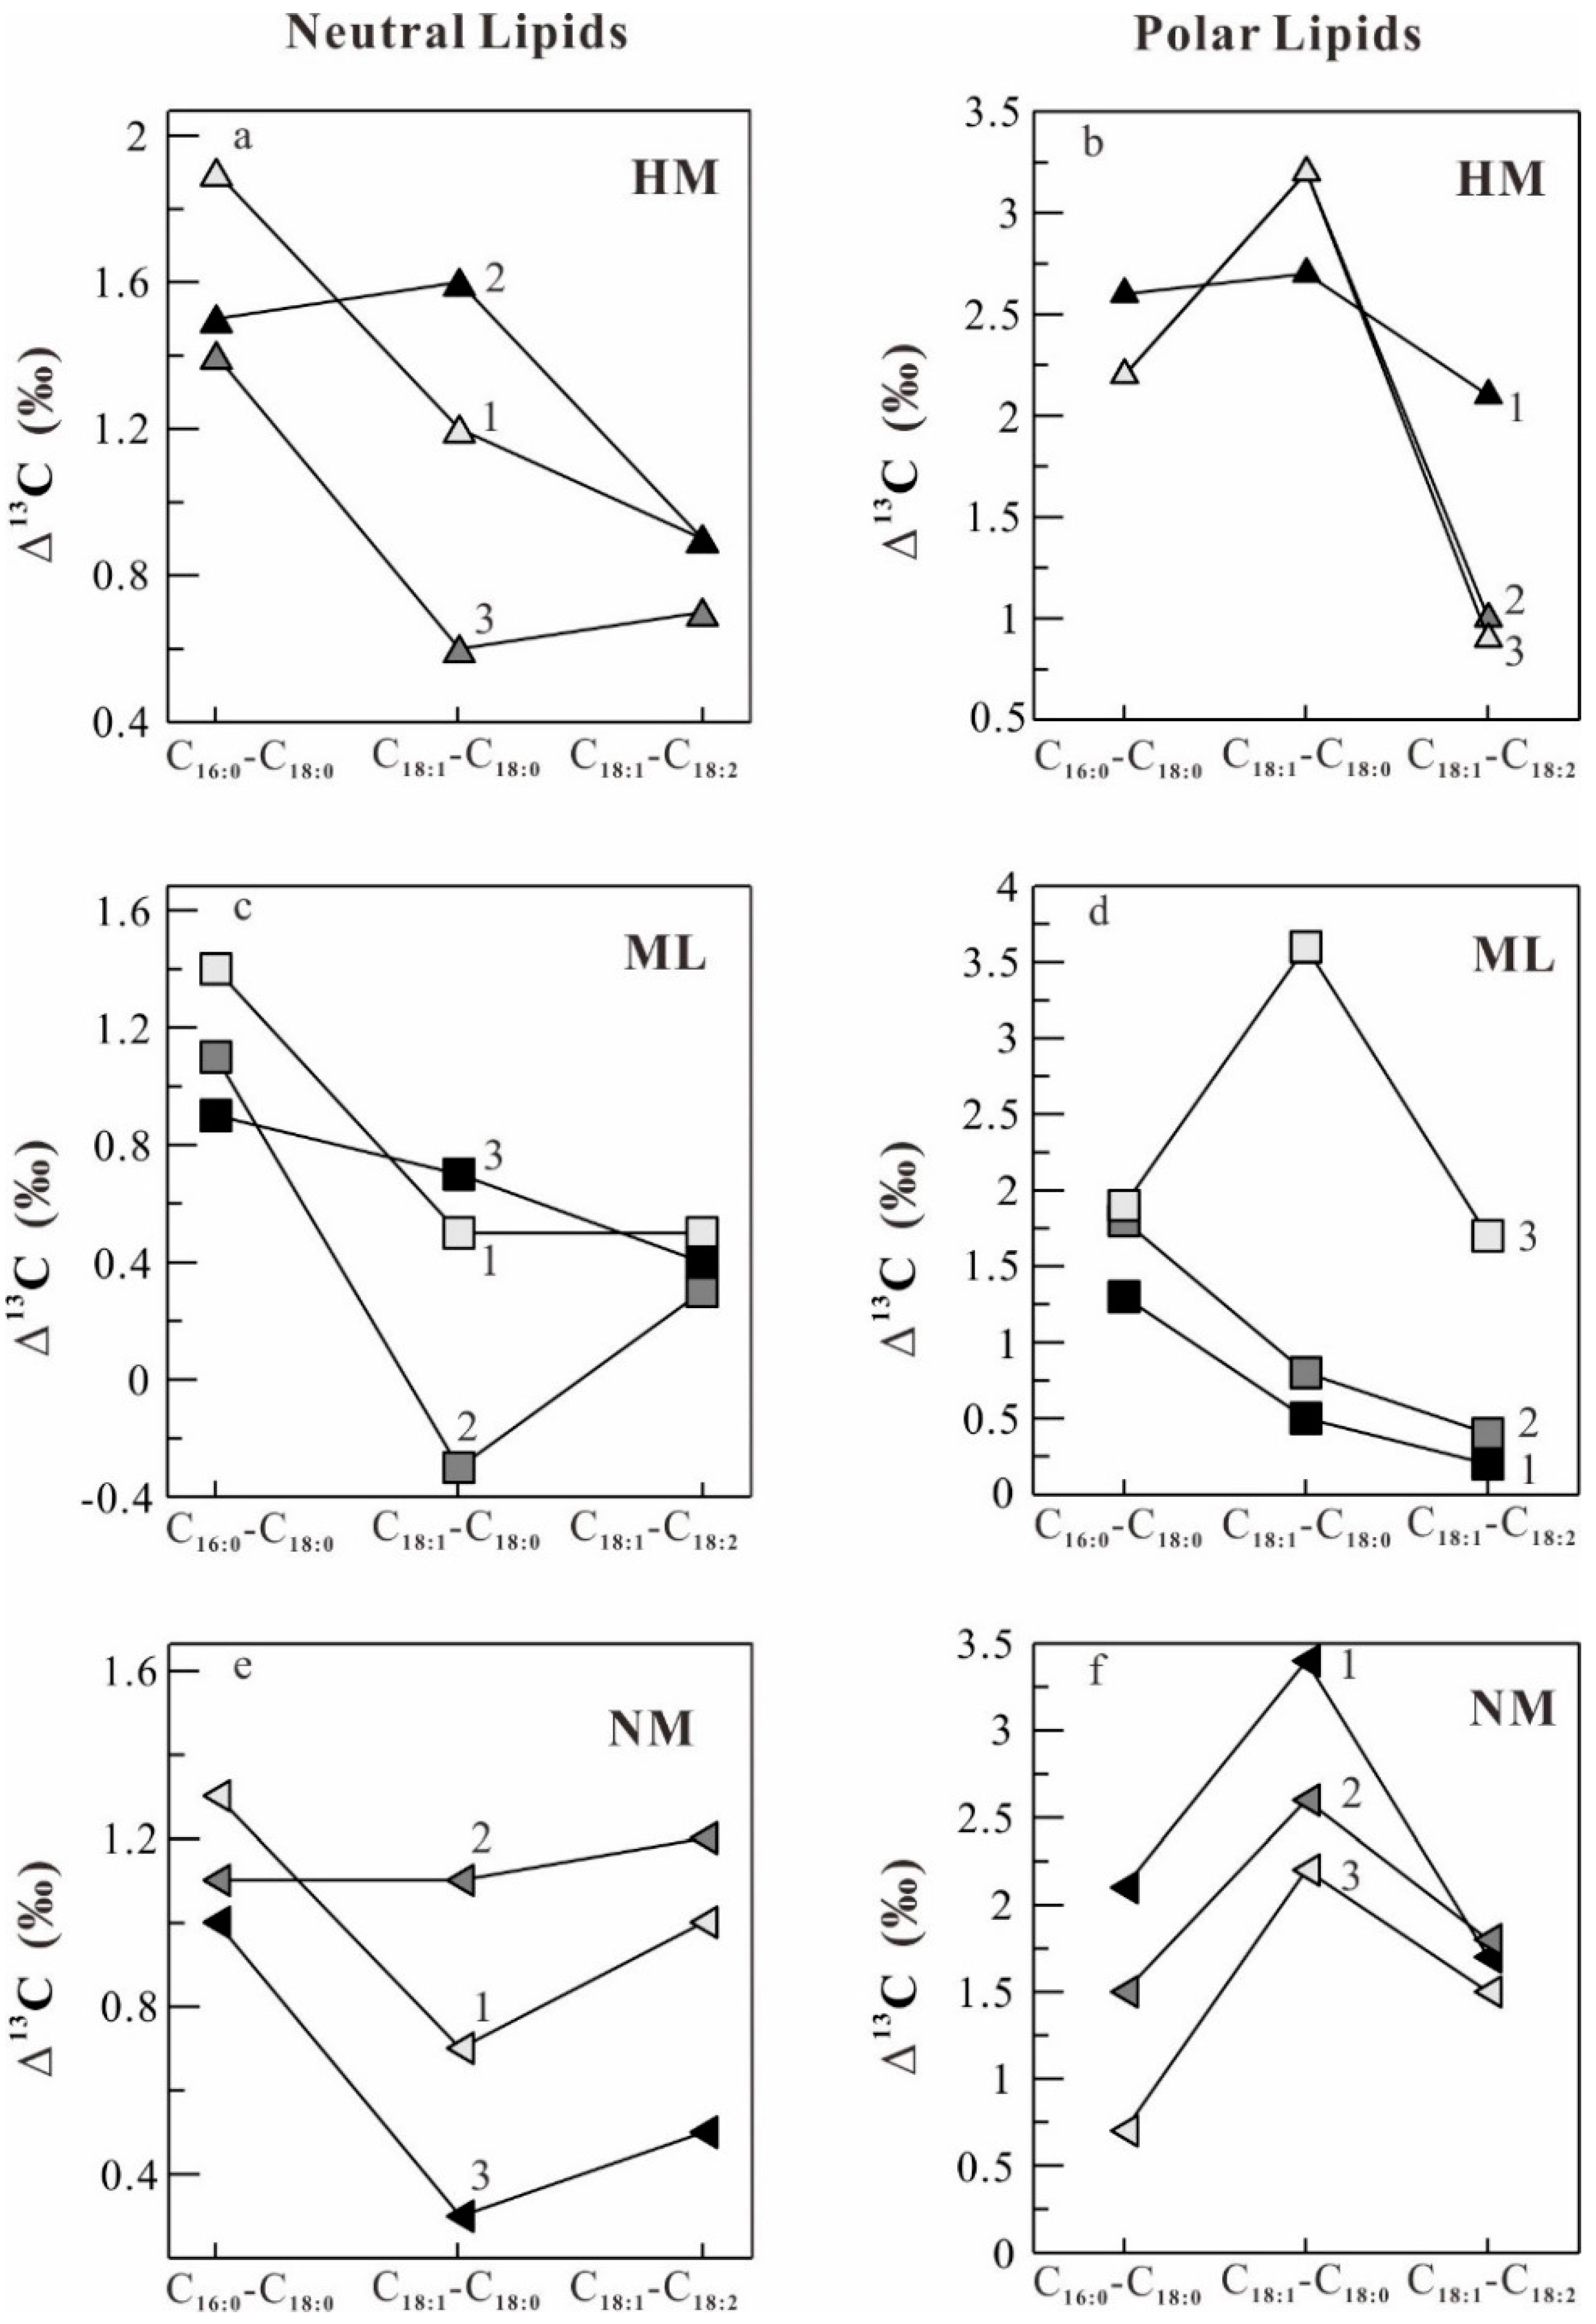
2.4. Stable Carbon Isotope Fractionation in the Lipids of O. sinensis

The lipids in O. sinensis are derived, from either de novo synthesis or uptake of fatty acids from the host Thitarodes larva [36]. For de novo synthesis, C16:0 in all studied samples of O. sinensis is considered to be the starting material for longer fatty acids and dehydro-fatty acids, and plays a central role in the biosynthesis of other fatty acids in O. sinensis, just as revealed in other fungi [37,38]. Theoretically, both elongation and desaturation of fatty acids in lipids from O. sinensis may result in the 13C depletion in comparison with the precursors in its parasitized larva, even though no carbon atoms are involved in desaturation since the addition of one neutron can considerably decrease the rate of a chemical reaction [39]. Our newly-obtained data have shown that the variation of δ13C values in the elongation from C16:0 to C18:0 and the second desaturation from C18:1 to C18:2 in O. sinensis are consistent with the above prognostication, while the evident 13C enrichment abnormally occurs in the first desaturation from C18:0 to C18:1 (Table 2 and Figure 2). This abnormity may be reasonably explained as follows. To adapt to the inclement environments, O. sinensis requires the plentiful polar lipids enriched in polyunsaturated fatty acids, in particular C18:2, for the larger proportion of cellular and subcellular biomembranes [19,40]. We had revealed that the absolute amount of total fatty acids and relative content of C18:2 in polar lipids from O. sinensis were evidently higher than those from its host larva, implying that O. sinensis assimilated polar lipids much more than those in the host larva and had transformed more C18:1 to C18:2 except a direct uptake of C18:2 from the parasitized larva. Thus, C18:2 in O. sinensis was originated both from the host larva and de novo synthesis. However, the host larva was unable to biosynthesize C18:2 [41,42], and had to assimilate C18:2 only from the tender roots of plants, especially Polygonum macrophyllum and Polygonum viviparnm, which were considered to be its favorite food with the δ13C value lower than that of the predator larva [30]. In the de novo synthesis of C18:2, the 13C-depleted C18:1 in O. sinensis was preferred to be desaturated. The formation of abundant C18:2 consequentially resulted in a remarkable 13C enrichment in C18:1 and a greater 13C depletion in C18:2 in O. sinensis.
The carbon isotope fractionation of major fatty acids in O. sinensis may reflect the complicated integration of biochemical processes and environmental factors [36], mainly be triggered by its cold-tolerance response. The above results have also demonstrated the importance of elucidating the metabolism and biosynthesis (carbon-chain elongation and desaturation) of fatty acids, which result in the discrimination of δ13C value observed in O. sinensis. This carbon isotope fractionation of individual compounds by fungi may also help to discriminate the distinct carbon sources of food webs and contaminants in environment studies [29,38].

2.5. Relationship between the δ13C Values of O. sinensis and Its Habitats

In our previous studies, the fatty acid composition of polar lipids was found to be a potential marker for distinguishing O. sinensis between Yunnan and the other habitats; and the fatty acid profile and ratio of C18:1/C18:2 in polar lipids were suggested to be two potential indicators for discriminating its geographical origin [13]. It is well known that the fatty acid composition of lipids and their δ13C values in organisms are closely related to their living environments, in particular temperature and humidity [43]. Furthermore, as mentioned above, the biochemical processes and environmental factors have a great impact on the δ13C pattern of major fatty acids. Thus, we here calculate the difference of the δ13C values of individual major fatty acids (Δ13C values) in neutral and polar lipids of O. sinensis, and discuss whether the Δ13C values may be a potential indicator for discriminating its geographical origin.
The δ13C patterns of difference of the δ13C values of individual major fatty acids (Δ13C values) in neutral and polar lipids in O. sinensis from seven different habitats (Figure 1) are illustrated in Figure 5, Figure 6 and Figure 7. It can be seen in Figure 5, Figure 6 and Figure 7 that the samples from Maizhokunggar (MZ) and Sejila Mountain (except SJ1) have the nearly similar δ13C patterns both in neutral and polar lipids, with the variation trends (Δ13C values) of C18:1–C18:2 > C18:1–C18:0 > C16:0–C18:0 and C18:1–C18:0 > C18:1–C18:2 > C16:0–C18:0, respectively (Figure 5). It is worth noting that the samples from Maizhokunggar (MZ) have the special δ13C patterns, with an increasing δ13C trend from C16:0–C18:0 to C18:1–C18:0, and to C18:1–C18:2. The samples from Yunnan (YN) and Naqu (except NQ1) share the same δ13C patterns both in neutral and polar lipids, with the variation tendency of C18:1–C18:0 > C16:0–C18:0 > C18:1–C18:2 for neutral lipids, while C16:0–C18:0 > C18:1–C18:0 > C18:1–C18:2 for polar lipids (Figure 6). It can be seen from Figure 6 that the Δ13C values of major fatty acids in the samples from Yunnan (YN) are generally larger than those from Naqu (NQ); and there is an obvious difference in the δ13C patterns of neutral and polar lipids from both Yunnan and the other habitats (Figure 7). For instance, the samples from Mila Mountain (except ML3) possess the δ13C variation trend of C16:0–C18:0 > C18:1–C18:2 > C18:1–C18:0 in neutral lipids and C16:0–C18:0 > C18:1–C18:0 > C18:1–C18:2 in polar lipids; the samples from Heimahe (except HM2) have the δ13C profiles of C16:0–C18:0 > C18:1–C18:0 ≥ C18:1–C18:2 in neutral lipids and C18:1–C18:0 ≥ C16:0–C18:0 > C18:1–C18:2 in polar lipids; the samples from Nam Co (except NM2) have the δ 13C tendencies of C16:0–C18:0 > C18:1–C18:2 > C18:1–C18:0 in neutral lipids and C18:1–C18:0 > C18:1–C18:2 ≥ C16:0–C18:0 in polar lipids. The different δ13C patterns of major fatty acids in neutral and polar lipids of wild O. sinensis from different habitats may exhibit a close relation to their living environments.
It should be pointed out that there are a few outliers in our data, implying that the δ13C values of O. sinensis may be affected by complicated factors. Based on the principle that “you are what you eat” as well as those described above, the δ13C values of O. sinensis were ultimately related to those of the plants at the bottom of the food chain (Figure 3). Thus, except the genetic factors, the δ13C values of plants were influenced by environmental factors, such as temperature, precipitation, elevation, humidity, altitude, light and irradiance [43]; and are dominated by environmental factors in different habitats on the premise of the similar or same species of plants in habitats [24]. It can further be inferred that the δ13C value of O. sinensis should significantly correlate with environmental factors in diverse habitats if the host larva eats the same foods. However, the foods of the larvae are actually diverse and not limited to particular plants, even including humic substances in habitat soils in the period of food deprivations [30]. Consequently, the δ13C outliers of O. sinensis may be resulted from the omnivory of the host larvae and their complicated food web. Obviously, more δ13C data of major fatty acids are required to further confirm the coupling relation between the habitat (geographic origin) and δ13C value of wild O. sinensis.

2.6. Discrimination between O. sinensis and Its Substitutes

O. sinensis, as an insect–fungus symbiosis and the treasury of bioactive substances, has been approved as a valuable functional food with diverse pharmacological activities in oriental countries. However, owing to the particularity of its habitats, obligatory parasitism, and complexity of its life history, as well as the over-exploitation and ecological disruption caused by human beings, the natural O. sinensis resources have become increasingly scarce and endangered [8]. The retail price of O. sinensis (15,000 USD/kg for the medium quality) was correspondingly elevated largely in the recent decade [44]. Various processed products of natural O. sinensis or its so-called perfect substitutes are widely merchandised in a Cordyceps market dually driven by profits and demand [8]. Among the above-mentioned Cordyceps products, one kind of tablets made up of the superfine grinding powder of natural O. sinensis was the most expensive in the Chinese health food markets. The economic incentives urge manufacturers to produce the adulterated tablets by using the relatively cheap substitutes. Thus, it is necessary to study some indicators to discriminate the adulteration of O. sinensis products.
Stable carbon isotope analysis has been used to monitor the quality and authenticate various foods [24,25,26,27,28,29]. In this study, the patterns of the average δ13C values of individual major fatty acids in the three Cordyceps substitutes (Figure 8) are evidently different from that of wild O. sinensis (as shown by the dashed line in Figure 8). Thus, the δ13C pattern may be one potential indicator to discriminate the adulteration of O. sinensis products. In other words, the δ13C values of authentic wild O. sinensis products are controlled by diverse factors (Figure 3), and are slightly lower than those of its host larva, but obviously higher than those of the favorite food plants of its host (Figure 4). Comparatively, the Cordyceps substitutes are generally produced via the large-scale cultivation or fermentation of the easily-cultured microbes in the formulated culture media at the low-elevation region. Therefore, both the genetic and environmental factors of the substitutes are completely different from wild O. sinensis.
It can be seen in Table 3 and Figure 8 that the lowest δ13C values of individual fatty acids occur in the SCM out of all studied samples, and range from −32.0‰ to −29.8‰ and −31.2‰ to −29.7‰ for natural and polar lipids, respectively. The stable carbon isotope composition suggests that the carbon source of the SCM is derived from C3 plants [45]. Similarly, the highest δ13C values of individual fatty acids appear in the FMH among all the detected samples, and are at the intervals of −16.8‰ to −14.6‰ and −16.9‰ to −14.3‰ in natural and polar lipids, respectively. These δ13C values illustrate that the carbon source of the FMH is originated from C4 plants. However, the δ13C values of major fatty acids in the FMP are in the ranges of −26.5‰ to −24.2‰ and −26.2‰ to −23.9‰ in natural and polar lipids, respectively, indicating that its culture media may be a mixture of C3 and C4 plants. Except the discrepancy of the δ13C values among wild O. sinensis and its substitutes, the composition of their major fatty acids also has the specific variation trend. The δ13C patterns of FMH and FMP exhibit a slightly decreasing trend from C16:0 to C18:2; while those of SCMN and SCMS show a gently increasing trend (Figure 8). Both of them have the δ13C pattern different from that of wild O. sinensis. The uneven variation of these substitutes might be caused by the different δ13C value of carbon origin in the artificial medium. Obviously, the above δ13C patterns of individual major fatty acids may be potential signatures to discriminate wild O. sinensis from conventional Cordyceps substitutes.

3. Materials and Methods
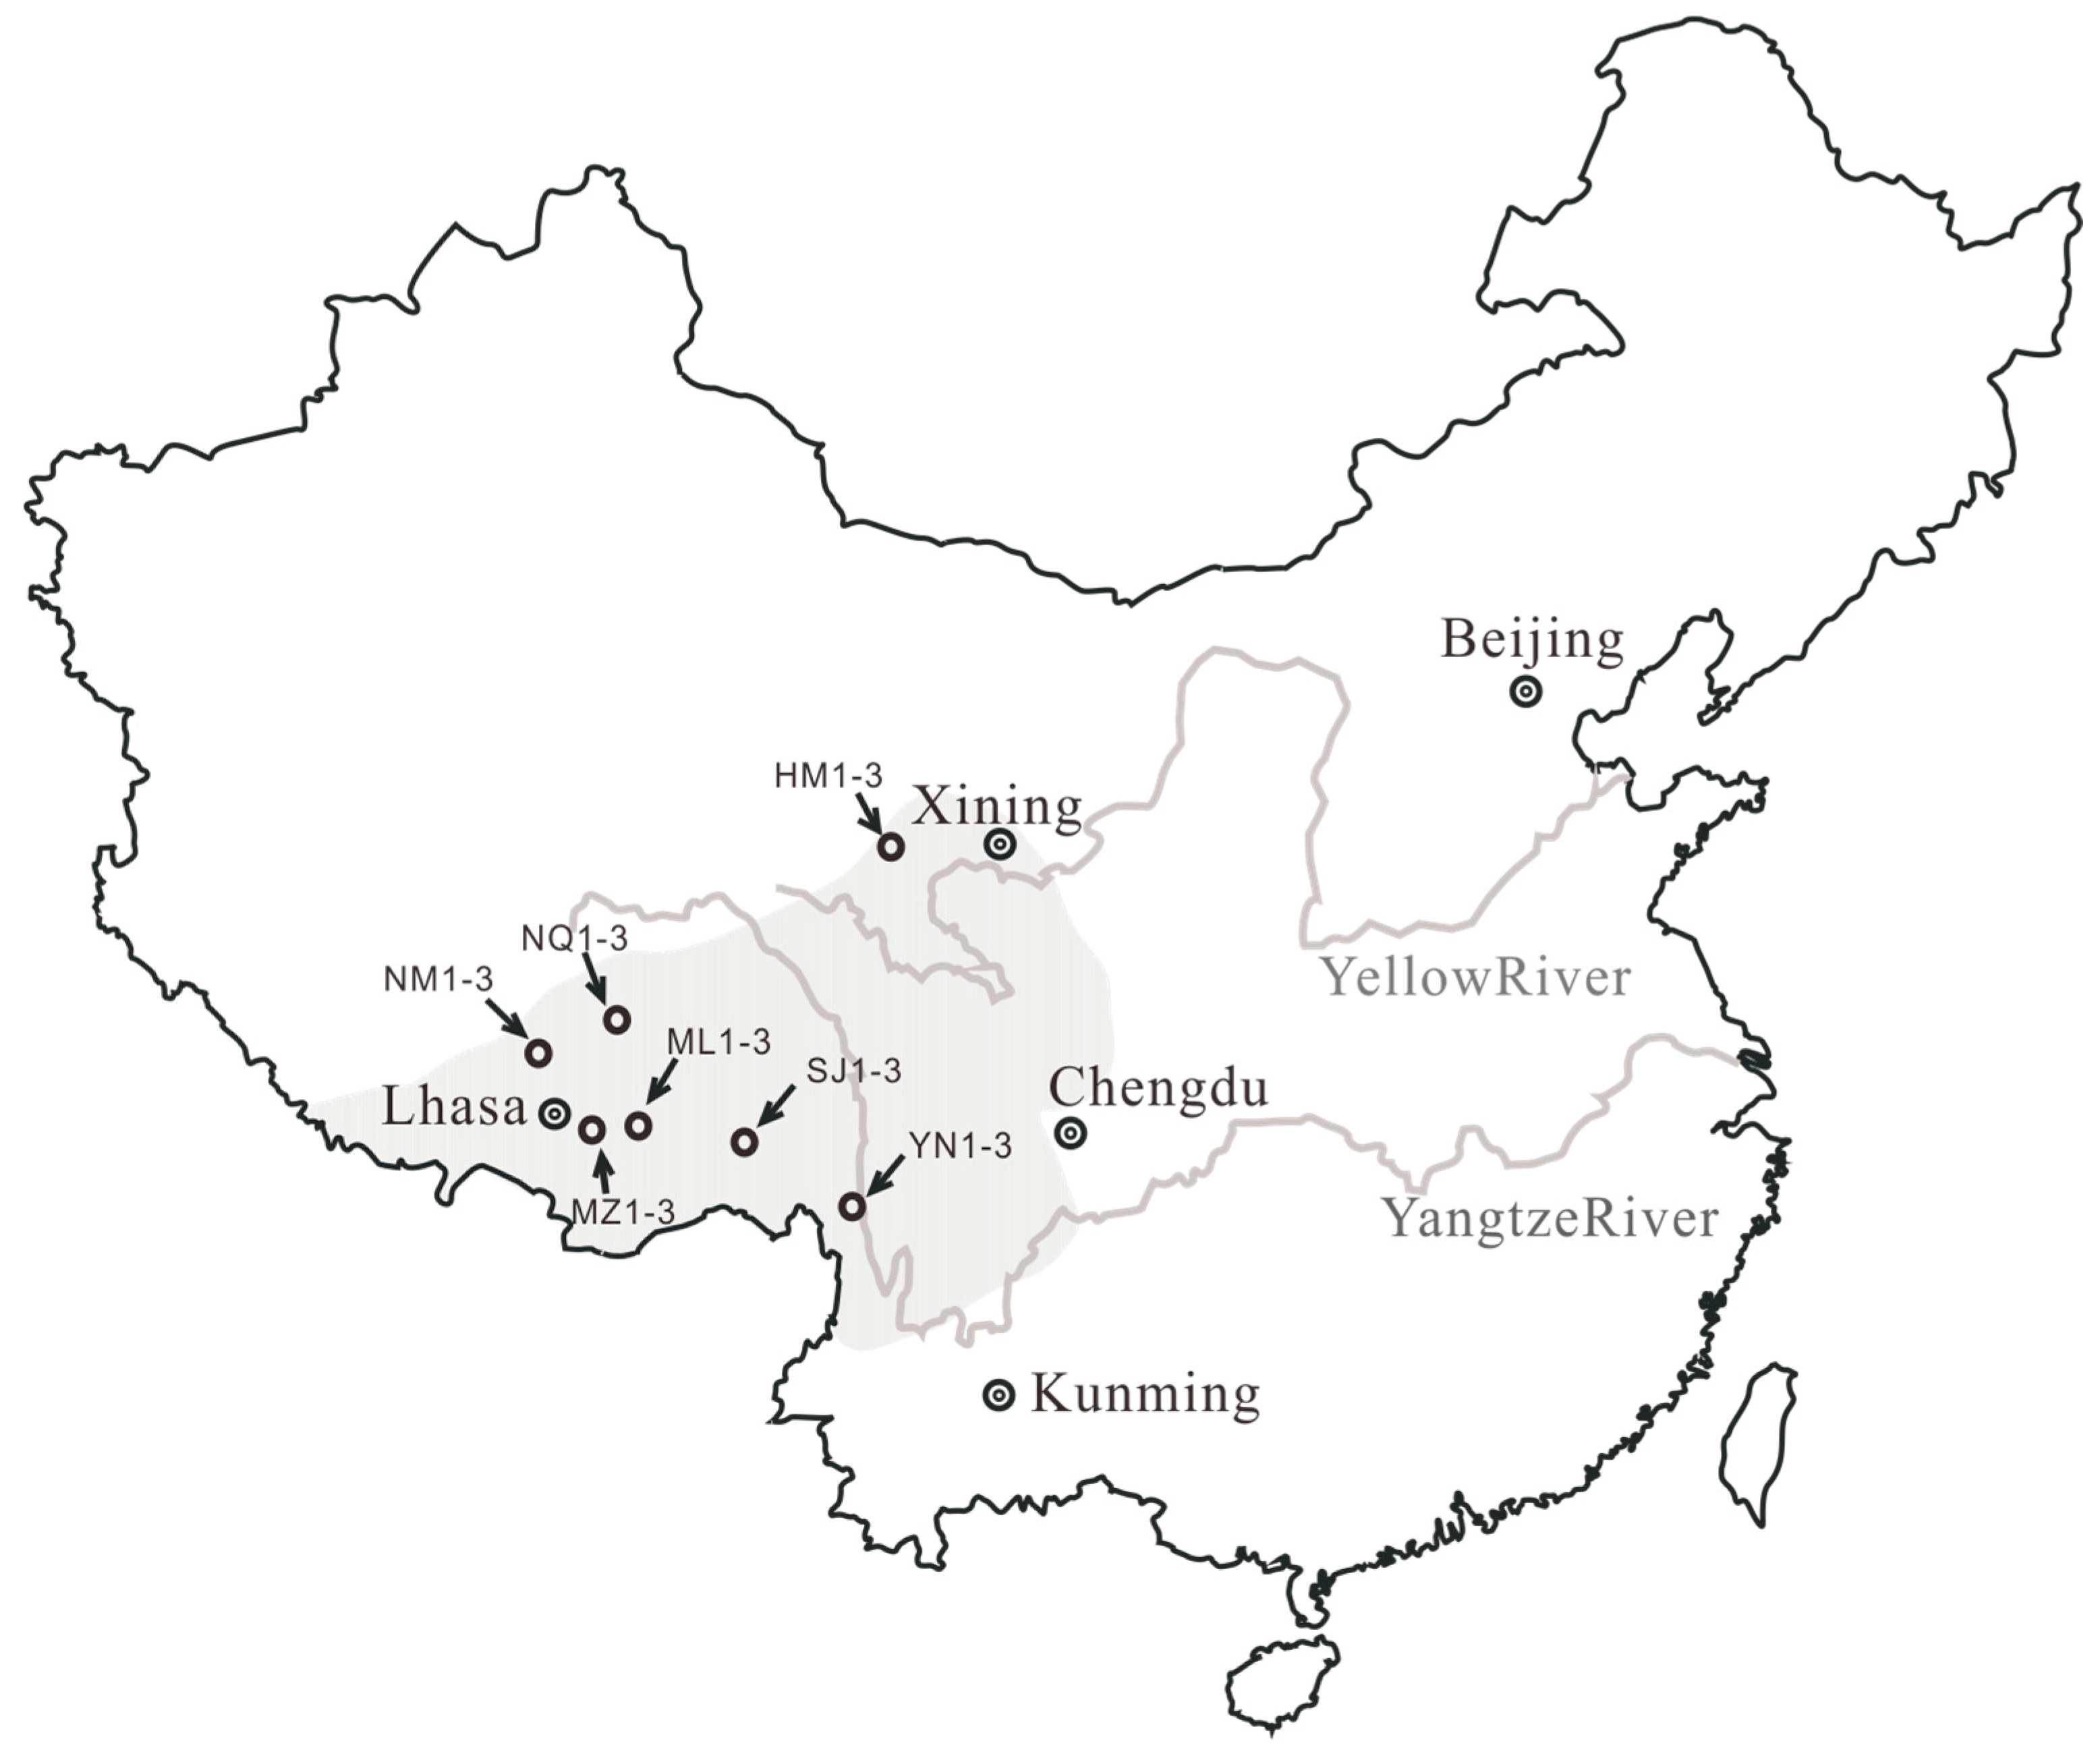
3.1. Samples

Twenty-one samples of wild O. sinensis were collected from seven habitats in Yunnan, Qinghai and Tibet, China. Their masses range from 137.9 mg to 530.0 mg per single O. sinensis. The stromata and larval lengths of these samples were at the intervals of 2.10–4.76 cm and 2.57–4.95 cm, respectively. Their more detailed information and sampling sites are shown in Figure 1 and Table 1. The stroma samples of Cordyceps militaris (SCM) were purchased at two factories of artificially cultivating Cordyceps militaris in northern (SCMN 1-3) and southern (SCMS 1-3) China, respectively. The samples of FMH 1-3 and FMP 1-3 were purchased at the functional food market, and their strains were Hirsurella sinensis and Paecilomyces epiali. The samples of O. sinensis, C. militaris and fermented mycelia were dried and manually ground to fine-grained (less than 150 meshes) powders with a mortar and pestle.

3.2. δ13C Analysis of the Bulk Samples

The δ13C values of bulk samples were measured by element analyzer–isotope ratio mass spectrometry (EA-IRMS) with a CE EA1112 C/N/S analyzer (CE Instruments, Wigan, UK) interfaced with a Delta Plus XL mass spectrometer (Finnigan, Thermo Scientific, Waltham, MA, USA). In brief, ca. 2 mg of each powder sample was loaded into a clean tin capsule, which burned in an O2 atmosphere at 960 °C with helium as the carrier gas. One known δ13C value (−29.1‰, calibrated against the NBS-22 reference material with a δ13C value of −29.7‰) was used to calibrate a reference CO2 gas. One empty tin capsule was analyzed every batch of analyses to check the background. Instrument performance was routinely checked using a carbon black sample with the known δ13C value of −36.9‰. The corresponding standard deviation for each analysis was less than 0.3‰.

3.3. δ13C Analysis of Individual Major Fatty Acids in Neutral and Polar Lipids

The methods for preparation, extraction and trans-esterification of lipids followed the previous references [13,19]. Briefly, aliquots of the powder samples of each wild O. sinensis and about 500 mg O. sinensis substitutes were subjected to extract lipids with petroleum ether in an ultrasonic bath at room temperature for 5 min. The ultrasonic frequency was set at 40 kHz, and the ratio of the reagent to the material was 4:1. The suspension was filtered, and the residue was re-extracted with the same volumes of petroleum ether for additional three times. Extracts were combined and concentrated in a rotary evaporator, followed by reduction of the solvent to near dryness in a stream of N2. The yields were the extracts of the neutral lipids. Afterwards, the sample residues were re-extracted by using a solvent mixture of dichloromethane and methanol (1:1, v/v). This procedure was repeated at least four times. The products were then washed by distilled water to yield polar lipids. Thin-layer chromatography (TLC) was used to monitor each extraction procedure and check the purity of the products as visualized by using sulfuric acid as a spraying reagent.
Fatty acids in the neutral and polar lipids were further derivatized to be corresponding fatty acid methyl esters (FAMEs) before GC-IRMS analysis. In brief, a solution of neutral lipids in 2 mL anhydrous petroleum ether and 2 mL dichloromethane and methanol for polar lipids were prepared, respectively, before anhydrous tetrahydrofuran (1 mL) and sodium methoxide (5%, 1 mL) were added. After rigorous shaking and left to stand for ten minutes, the mixture was neutralized with 5% acetic acid (1 mL) and then washed with distilled water for three times to isolate fatty acid methyl esters (FAMEs).
The δ13C values of individual FAMEs were analyzed by using a 6890 gas chromatography (Agilent, Palo Alto, CA, USA) equipped with a split/splitless injector coupled to a combustion furnace to an isotope ratio mass spectrometer (IRMS, GV IsoPrime, Manchester, UK). The analytical conditions were identical to those used in our previous studies [46]. In brief, the injector was used in splitless mode at 290 °C; helium was the carrier gas at a constant flow rate of 1.0 mL per minute. A Varian WCOT fused silica column (50 m × 0.25 mm i.d. × 0.25 μm film thickness, CP-7419, Varian, Palo Alto, CA, USA) was used. The oven temperature was initially set at 100 °C (held for 2 min) and programmed to 190 °C at a heating rate of 6 °C/min (held for 5 min), and then programmed to 260 °C at a rate of 20 °C/min and held for 5 min.
The carbon isotope ratios were given as the δ-values (δ13C in ‰) relative to Vienna Pee Dee Belemnite standard (V-PDB), and they were corrected for the addition of carbon during the preparation of the FAMEs [46]. The average δ13C value of the methyl group was −32.5 ± 0.2‰ (six replicate analyses), and the δ13C values of the original fatty acids of samples were calculated according to the following equation:
δ13CFA = [(n + 1) δ13CFAME – δ13CMethyl group]/n
where FA represents fatty acids, and n is the number of carbon atoms of the fatty acid. Each sample was analyzed thrice, and the standard deviations for FAMEs were at the interval of 0.15–0.27‰, showing the good reproducibility.

3.4. Statistical Analysis

The experimental data were analyzed by using the IBM SPSS Statistics (Version 20, Microsoft, Chicago, IL, USA). The δ13C value for each sample of O. sinensis was determined three times. Their standard deviations were <0.3‰, and are expressed as the mean values (Table 2 and Table 3).

4. Conclusions

The δ13C values of major fatty acids in the lipids of O. sinensis are characterized unanimously by the variation relation C18:0 < C18:2 ≈ C16:0 <C18:1, while their fluctuation intervals are notably different between the neutral and polar lipids, suggesting the mutual involvement of the complicated biochemical processes and environmental factors during the formation of O. sinensis. Stable carbon isotope fractionation in wild O. sinensis reflects the complicated influence from the biochemical processes and environmental factors. The δ13C profile of major fatty acids in the lipids may be a potential indicator to determine the geographical origin and quality of wild O. sinensis as well as authenticate the products of natural O. sinensis.

Acknowledgments

The study was supported by the National Natural Science Foundation of China (No. 81303155), the Natural Science Foundation of Guangdong Province, China (No. 2014A030313538), the Social Science and Technology Development Project of Dongguan, China (No. 2013108101055), and the Specialized Research Fund for the Doctoral Program of Higher Education (No. 20090171110015).

Author Contributions

Conceived and designed the experiments: J.-H.W. Performed experiments: L.-X.G. and X.-M.X. Wrote the paper: L.-X.G., Y.L. and J.-H.W. Data analysis and assessment: L.-X.G., Y.L. and Y.-H.H. Modified the manuscript: J.-H.W. All authors approved the final version of this work.

Conflicts of Interest

The authors declare no conflict of interest.

References

  1. Li, Y.; Wang, X.L.; Jiao, L.; Jiang, Y.; Li, H.; Jiang, S.P.; Lhosumtseiring, N.; Fu, S.Z.; Dong, C.H.; Zhan, Y.; et al. A survey of the geographic distribution of Ophiocordyceps sinensis. J. Microbiol. 2011, 49, 913–919. [Google Scholar] [CrossRef] [PubMed]
  2. Shrestha, U.B.; Bawa, K.S. Impact of climate change on potential distribution of Chinese caterpillar fungus (Ophiocordyceps sinensis) in Nepal Himalaya. PLoS ONE 2014, 9, e106405. [Google Scholar] [CrossRef] [PubMed]
  3. Sung, G.H.; Hyweljones, N.L.; Sung, J.M.; Luangsaard, J.J.; Shrestha, B.; Spatafora, J.W. Phylogenetic classification of Cordyceps and the Clavicipitaceous fungi. Stud. Mycol. 2007, 57, 5–59. [Google Scholar] [CrossRef] [PubMed]
  4. Xiao, W.; Yang, J.L.; Zhu, P.; Cheng, K.D.; He, H.X.; Zhu, H.X. Non-support of species complex hypothesis of Cordyceps sinensis by targeted rDNA-ITS sequence analysis. Mycosystema 2009, 28, 724–730. [Google Scholar]
  5. Hawksworth, D.L. A new dawn for the naming of fungi: Impacts of decisions made in Melbourne in July 2011 on the future publication and regulation of fungal names. IMA Fungus 2011, 2, 155–162. [Google Scholar] [CrossRef] [PubMed]
  6. Lo, H.C.; Hsieh, C.; Lin, F.Y.; Hsu, T.H. A systematic review of the mysterious caterpillar fungus Ophiocordyceps sinensis in dongchongxiacao (dōng chóng xià cǎo) and related bioactive ingredients. J. Tradit. Complement. Med. 2013, 3, 16–32. [Google Scholar] [CrossRef]
  7. Chen, P.X.; Wang, S.A.; Nie, S.P.; Marcone, M. Properties of Cordyceps sinensis: A review. J. Funct. Foods 2013, 5, 550–569. [Google Scholar] [CrossRef]
  8. Qiu, X.H.; Cao, L.; Han, R.C. The progress, issues and perspectives in the research of Ophiocordyceps sinensis. J. Environ. Entomol. 2016, 38, 1–23. [Google Scholar]
  9. Zhao, J.; Xie, J.; Wang, L.Y.; Li, S.P. Advanced development in chemical analysis of Cordyceps. J. Pharm. Biomed. Anal. 2014, 87, 271–289. [Google Scholar] [CrossRef] [PubMed]
  10. Yue, K.; Ye, M.; Zhou, Z.; Sun, W.; Lin, X. The genus Cordyceps: A chemical and pharmacological review. J. Pharm. Pharmacol. 2013, 65, 474–493. [Google Scholar] [CrossRef] [PubMed]
  11. Liang, H.H.; Cheng, Z.; Yang, X.L.; Li, S.; Ding, Z.Q.; Zhou, T.S.; Zhang, W.J.; Chen, J.K. Genetic diversity and structure of Cordyceps sinensis populations from extensive geographical regions in China as revealed by inter-simple sequence repeat markers. J. Microbiol. 2008, 46, 549–556. [Google Scholar] [CrossRef] [PubMed]
  12. Quan, Q.M.; Chen, L.L.; Wang, X.; Li, S.; Yang, X.L.; Zhu, Y.G.; Wang, M.; Cheng, Z. Genetic diversity and distribution patterns of host insects of caterpillar fungus Ophiocordyceps sinensis in the Qinghai-Tibet Plateau. PLoS ONE 2014, 9, e92293. [Google Scholar] [CrossRef] [PubMed]
  13. Guo, L.X.; Xu, X.M.; Wu, C.F.; Lin, L.; Zou, S.C.; Luan, T.G.; Yuan, J.P.; Wang, J.H. Fatty acid composition of lipids in wild Cordyceps sinensis, from major habitats in China. Biomed. Prev. Nutr. 2012, 2, 42–50. [Google Scholar] [CrossRef]
  14. Winkler, D. Yartsa gunbu (Cordyceps sinensis) and the fungal commodification of Tibet’s rural economy. Econ. Bot. 2008, 62, 291–305. [Google Scholar] [CrossRef]
  15. Zhou, X.W.; Li, L.J.; Tian, E.W. Advances in research of the artificial cultivation of Ophiocordyceps sinensis in China. Crit. Rev. Biotechnol. 2014, 34, 233–243. [Google Scholar] [CrossRef] [PubMed]
  16. Cai, Z.J.; Yin, D.H.; Li, L.; Xia, W.J. Investigation on quality difference between Cordyceps of Sichuan and those of Xizang. China J. Chin. Mater. Medica 2001, 26, 450–452. [Google Scholar]
  17. Cai, J.Z.; Wang, L.L. Research progress of artificial Cordyceps mycelium. Life Sci. Instrum. 2011, 9, 30–33. [Google Scholar]
  18. He, X.F.; Zhao, S.R. A review and prospect on the development of Cordyceps mycelium. Qinghai Med. J. 1999, 29, 60–61. [Google Scholar]
  19. Guo, L.X.; Xu, X.M.; Liang, F.R.; Yuan, J.P.; Peng, J.; Wu, C.F.; Wang, J.H. Morphological observations and fatty acid composition of indoor-cultivated Cordyceps sinensis at a high-altitude laboratory on Sejila Mountain, Tibet. PLoS ONE 2015, 10, e0126095. [Google Scholar] [CrossRef] [PubMed]
  20. Wang, Q.; Xu, Z.L.; Lv, Y. The discrimination of Cordyceps sinensis and its adulterants. Jiangsu J. Agric. Sci. 2015, 43, 273–279. [Google Scholar]
  21. Pan, X.Y. Identification of Cordyceps sinensis by experience. China Pharm. 2006, 9, 380–381. [Google Scholar]
  22. Huang, B.; Cheng, Y.L.; Cao, X.J.; Li, Y.; Chen, R.; Cao, J.; Peng, C.; Wan, D.G.; Shen, C.H.; Guo, J.L. HPLC fingerprint of Cordyceps sinensis and its confused species and identification of common composition. Chin. Tradit. Herb. Drugs 2017, 48, 991–996. [Google Scholar]
  23. Caut, S.; Angulo, E.; Courchamp, F. Variation in discrimination factors (δ15N and δ13C): The effect of diet isotopic values and applications for diet reconstruction. J. Appl. Ecol. 2009, 46, 443–453. [Google Scholar] [CrossRef]
  24. Qiang, W.Y.; Wang, X.L.; Chen, T.; Feng, H.Y.; An, L.Z.; He, Y.Q.; Wang, G. Variations of stomatal density and carbon isotope values of Picea crassifolia at different altitudes in the Qilian Mountains. Trees-Struct. Funct. 2003, 17, 258–262. [Google Scholar]
  25. Camin, F.; Larcher, R.; Nicolini, G.; Bontempo, L.; Bertoldi, D.; Perini, M.; Schlicht, C.; Schellenberg, A.; Thomas, F.; Heinrich, K.; et al. Isotopic and elemental data for tracing the origin of European olive oils. J. Agric. Food Chem. 2010, 58, 570–577. [Google Scholar] [CrossRef] [PubMed]
  26. Horacek, M.; Min, J.S.; Heo, S.C.; Soja, G. Discrimination between ginseng from Korea and China by light stable isotope analysis. Anal. Chim. Acta 2010, 682, 77–81. [Google Scholar] [CrossRef] [PubMed]
  27. Kropf, U.; Golob, T.; Necemer, M.; Kump, P.; Korosec, M.; Bertoncelj, J.; Ogrinc, N. Carbon and nitrogen natural stable isotopes in Slovene honey: Adulteration and botanical and geographical aspects. J. Agric. Food Chem. 2010, 58, 12794–12803. [Google Scholar] [CrossRef] [PubMed]
  28. Ehtesham, E.; Hayman, A.R.; McComb, K.A.; Van Hale, R.; Frew, R.D. Correlation of geographical location with stable isotope values of hydrogen and carbon of fatty acids from New Zealand milk and bulk milk powder. J. Agric. Food Chem. 2013, 61, 8914–8923. [Google Scholar] [CrossRef] [PubMed]
  29. Guo, L.X.; Mai, Z.H.; Zhao, H.; Liu, H.; Tang, H.W. Application of stable carbon isotopes in detection of food adulteration and traceability. Modern Food Sci. Technol. 2016, 32, 281–290. [Google Scholar]
  30. Chen, D.; Yuan, J.; Xu, S.; Zhou, X.; Zhang, Y.; Xu, X.; Zou, Z.; Zhang, G.; Wang, J. Stable carbon isotope evidence for tracing the diet of the host Hepialus larva of Cordyceps sinensis in the Tibetan Plateau. Sci. China Ser. D Earth Sci. 2009, 52, 655–659. [Google Scholar] [CrossRef]
  31. Guo, L.X.; Hong, Y.H.; Zhou, Q.Z.; Zhu, Q.; Xu, X.M.; Wang, J.H. Fungus-larva relation in the formation of Cordyceps sinensis as revealed by stable carbon isotope analysis. Sci. Rep. 2017, 7, 7789. [Google Scholar] [CrossRef] [PubMed]
  32. Kubásek, J.; Urban, O.; Šantrůček, J. C4 plants use fluctuating light less efficiently than do C3 plants: A study of growth, photosynthesis and carbon isotope discrimination. Physiol. Plant. 2013, 149, 528–539. [Google Scholar] [CrossRef] [PubMed]
  33. Gleixner, G.; Danier, H.J.; Werner, R.A.; Schmidt, H.L. Correlations between the 13C content of primary and secondary plant products in different cell compartments and that in decomposing basidiomycetes. Physiol. Plant. 1993, 102, 1287–1290. [Google Scholar] [CrossRef]
  34. Ruess, L.; Tiunov, A.; Haubert, D.; Richnow, H.H.; Haggblom, M.M.; Scheu, S. Carbon stable isotope fractionation and trophic transfer of fatty acids in fungal based soil food chains. Soil Biol. Biochem. 2005, 37, 945–953. [Google Scholar] [CrossRef]
  35. Xia, F.; Chen, X.; Guo, M.Y.; Bai, X.H.; Liu, Y.; Shen, G.R.; Li, Y.L.; Lin, J.; Zhou, X.W. High-throughput sequencing-based analysis of endogenetic fungal communities inhabiting the Chinese Cordyceps reveals unexpectedly high fungal diversity. Sci. Rep. 2016, 6, 33437. [Google Scholar] [CrossRef] [PubMed]
  36. DeNiro, M.J.; Epstein, S. Mechanism of carbon isotope fractionation associated with lipid synthesis. Science 1977, 197, 261–263. [Google Scholar] [CrossRef] [PubMed]
  37. Hayes, J.M. Fractionation of carbon and hydrogen isotopes in biosynthetic processes. Stable Isot. Geochem. 2001, 43, 225–277. [Google Scholar] [CrossRef]
  38. Liu, X.; Xu, S.P.; Wang, J.H.; Yuan, J.P.; Guo, L.X.; Li, X.; Huang, X.N. Characterization of ganoderma spore lipid by stable carbon isotope analysis: Implications for authentication. Anal. Bioanal. Chem. 2007, 388, 723–731. [Google Scholar] [CrossRef] [PubMed]
  39. Hoefs, J. Stable Isotope Geochemistry, 6th ed.; Springer: Berlin/Heidelberg, Germany, 2008. [Google Scholar]
  40. Sakuradani, E.; Ando, A.; Ogawa, J.; Shimizu, S. Improved production of various polyunsaturated fatty acids through filamentous fungus Mortierella alpina breeding. Appl. Microbiol. Biot. 2009, 84, 1–10. [Google Scholar] [CrossRef] [PubMed]
  41. Kilby, B.A. The biochemistry of the insect fat body. Adv. Insect Physiol. 1963, 1, 111–174. [Google Scholar]
  42. Stanley-Samuelson, D.W.; Jurenka, R.A.; Cripps, C.; Blomquist, G.J.; Renobales, M.D. Fatty acids in insects: Composition, metabolism, and biological significance. Arch. Insect Biochem. Physiol. 1988, 9, 1–33. [Google Scholar] [CrossRef]
  43. Araus, J.L.; Villegas, D.; Aparicio, N.; del Moral, L.F.G.; El Hani, S.; Rharrabti, Y.; Ferrio, J.P.; Royo, C. Environmental factors determining carbon isotope discrimination and yield in durum wheat under Mediterranean conditions. Crop Sci. 2003, 43, 170–180. [Google Scholar] [CrossRef]
  44. Wang, H.; Shan, Y.; Sun, Z. The utilization and analysis of present market situation for Cordyceps sinensis. Chin. Med. J. Res. Pract. 2016, 30, 83–86. [Google Scholar]
  45. DeNiro, M.J.; Epstein, S. You are what you eat (plus a few per mil): The carbon isotope cycle in food chains. Geol. Soc. Am. Abstr. Prog. 1976, 8, 834–835. [Google Scholar]
  46. Guo, L.X.; Xu, X.M.; Yuan, J.P.; Wu, C.F.; Wang, J.H. Characterization and authentication of significant Chinese edible oilseed oils by stable carbon isotope analysis. J. Am. Oil Chem. Soc. 2010, 87, 839–848. [Google Scholar] [CrossRef]
Sample Availability: The FAMEs for all samples and substitudes of O. sinensis are available from the authors.
Figure 1. Schematic diagram illustrating the habitats of wild Ophiocordyceps sinensis in China (shadow area) and the sampling locations.
Molecules 22 01567 g001
Figure 2. Variation of the stable carbon isotope ratios (δ13C) of fatty acids C16:0, C18:0, C18:1, and C18:2 in the neutral (a) and polar (b) lipids from wild Ophiocordyceps sinensis.
Molecules 22 01567 g002
Figure 3. Impact factors on the δ13C values of O. sinensis.
Molecules 22 01567 g003
Figure 4. Variation of the stable carbon isotope ratios (δ13C) of the bulk samples of plants, larvae and O. sinensis.
Molecules 22 01567 g004
Figure 5. Difference of the δ13C values of major fatty acids (Δ13C) between the samples from Sejila Mountain (SJ, (a,b)) and Maizhokunggar (MZ, (c,d)). (a,c) and (b,d) refer to neutral and polar lipids, respectively.
Molecules 22 01567 g005
Figure 6. Difference of the δ13C values of major fatty acids (Δ13C) between the samples from Yunnan (YN, (a,b)) and Naqu (NQ, (c,d)). (a,c) and (b,d) refer to neutral and polar lipids, respectively.
Molecules 22 01567 g006
Figure 7. Difference of the δ13C values of major fatty acids (Δ13C) among the samples from Heimahe (HM, (a,b)), Mila Mountain (ML, (c,d)) and Nam Co (NM, (e,f)). (a,c,e) and (b,d,f) refer to neutral and polar lipids, respectively.
Molecules 22 01567 g007
Figure 8. Variation of the δ13C values of major fatty acids C16:0, C18:0, C18:1, and C18:2 in the neutral (a) and polar (b) lipids from the common substitutes of Ophiocordyceps sinensis. SCMN and SCMP, the cultivated stromata of Cordyceps militaris; FMH, the fermented mycelia of Hirsurella sinensis; FMP, the fermented mycelia of Paecilomyces epiali; OS, wild Ophiocordyceps sinensis.
Molecules 22 01567 g008
Table 1. Description of twenty-one samples of Ophiocordyceps sinensis from Yunnan, Qinghai and Tibet, China.
Sample Nos.LocationLongitudeLatitudeWeight (mg)Larva Length (cm)Stroma Length (cm)Altitude (m)Relative Humidity (%)
YN1Deqin (Yunnan)99°32′20 E29°15′02 N164.13.234.45425071
YN2Deqin (Yunnan)99°32′20 E29°15′02 N530.04.952.13425071
YN3Deqin (Yunnan)99°32′20 E29°15′02 N492.33.713.26425071
HM1Heimahe (Qinghai)99°53′50 E36°58′50 N137.92.733.12331049
HM2Heimahe (Qinghai)99°53′50 E36°58′50 N154.92.574.61331049
HM3Heimahe (Qinghai)99°53′50 E36°58′50 N148.92.473.61331049
NQ1Naqu (Tibet)93°02′20 E31°55′02 N434.24.082.13480050
NQ2Naqu (Tibet)93°02′20 E31°55′02 N479.33.953.43480050
NQ3Naqu (Tibet)93°02′20 E31°55′02 N449.33.853.13480050
ML1Mila Mountain (Tibet)92°19′53 E29°50′21 N223.43.182.67482546
ML2Mila Mountain (Tibet)92°19′53 E29°50′21 N235.13.212.95482546
ML3Mila Mountain (Tibet)92°19′53 E29°50′21 N245.73.983.89482546
NM1Nam Co (Tibet)90°16′50 E30°35′18 N510.04.343.39480553
NM2Nam Co (Tibet)92°19′53 E29°50′21 N381.74.223.08480553
NM3Nam Co (Tibet)92°19′53 E29°50′21 N397.14.323.28480553
SJ1Sejila Mountain (Tibet)94°36′03 E29°35′36 N282.54.324.76424179
SJ2Sejila Mountain (Tibet)94°36′03 E29°35′36 N189.53.953.46424179
SJ3Sejila Mountain (Tibet)94°36′03 E29°35′36 N208.54.153.26424179
MZ1Maizhokunggar (Tibet)91°48′03 E29°50′36 N322.33.933.32424146
MZ2Maizhokunggar (Tibet)94°36′04 E29°35′37 N280.53.754.25424146
MZ3Maizhokunggar (Tibet)94°36′05 E29°35′38 N222.33.253.45424146
Table 2. δ13C values * (‰) of individual major fatty acids in neutral and polar lipids from Ophiocordyceps sinensis.
Sample Nos.Bulk SampleNeutral LipidsPolar Lipids
C16:0C18:0C18:1C18:2C16:0–C18:0C18:1–C18:0C18:1–C18:2C16:0C18:0C18:1C18:2C16:0–C18:0C18:1–C18:0C18:1–C18:2
YN1−26.0−28.5−31.4−28.4−29.72.93.01.3−28.2−30.9−28.7−30.42.72.21.7
YN2−25.5−27.9−30.3−27.8−28.32.42.50.5−28.2−30.6−28.7−29.22.41.90.5
YN3−27.0−29.6−30.7−29.1−29.81.11.60.7−29.0−31.9−29.4−30.52.92.51.1
YN AVR ± SD−26.2 ± 0.8−28.7 ± 0.9−30.8 ± 0.6−28.4 ± 0.7−29.3 ± 0.82.12.40.9−28.5 ± 0.5−31.1 ± 0.7−28.9 ± 0.4−30.0 ± 0.72.62.21.1
HM1−26.2−28.7−30.2−28.6−29.51.51.60.9−28.2−30.8−28.1−30.22.62.72.1
HM2−26.2−28.7−30.1−29.5−30.21.40.60.7−29.7−31.9−28.7−29.72.23.21.0
HM3−26.8−28.4−30.3−29.1−30.01.91.20.9−29.3−31.5−28.3−29.22.23.20.9
HM AVR ± SD−26.4 ± 0.4−28.6 ± 0.2−30.2 ± 0.1−29.1 ± 0.5−29.9 ± 0.41.61.10.8−29.1 ± 0.8−31.4 ± 0.6−28.4 ± 0.3−29.7 ± 0.52.33.01.3
NQ1−25.8−28.2−29.7−27.9−28.41.51.80.5−28.4−30.8−28.2−29.42.42.61.2
NQ2−25.6−28.0−29.7−28.1−29.01.71.60.9−29.3−31.5−29.7−30.32.21.80.6
NQ3−25.3−28.4−29.2−28.4−28.80.80.80.4−28.5−31.0−29.2−30.02.51.80.8
NQ AVR ± SD−25.6 ± 0.3−28.2 ± 0.2−29.5 ± 0.3−28.1 ± 0.3−28.7 ± 0.31.31.40.6−28.7 ± 0.5−31.1 ± 0.4−29.0 ± 0.8−29.9 ± 0.52.42.10.9
ML1−26.7−29.3−30.7−30.2−30.71.40.50.5−30.1−31.4−30.9−31.11.30.50.2
ML2−26.5−29.1−30.2−30.5−30.81.1-0.30.3−28.7−30.5−29.7−30.11.80.80.4
ML3−26.7−29.3−30.2−29.5−29.90.90.70.4−29.8−31.7−28.1−29.81.93.61.7
ML AVR ± SD−26.6 ± 0.1−29.2 ± 0.1−30.4 ± 0.3−30.1 ± 0.5−30.5 ± 0.51.20.30.4−29.5 ± 0.7−31.2 ± 0.6−29.6 ± 1.4−30.3 ± 0.71.71.60.7
NM1−25.8−28.2−29.5−28.8−29.81.30.71.0−28.8−30.9−27.5−29.22.13.41.7
NM2−25.8−28.2−29.3−28.2−29.41.11.11.2−29.0−30.5−27.9−29.71.52.61.8
NM3−25.5−27.8−28.8−28.5−29.01.00.30.5−29.4−30.1−27.9−29.40.72.21.5
NM AVR ± SD−25.7 ± 0.2−28.1 ± 0.2−29.2 ± 0.4−28.5 ± 0.3−29.4 ± 0.41.10.70.9−29.1 ± 0.3−30.5 ± 0.4−27.8 ± 0.2−29.4 ± 0.31.42.71.6
SJ1−26.2−28.7−30.1−28.6−28.91.41.50.3−28.7−31.0−28.8−29.52.32.20.7
SJ2−27.5−30.2−30.6−28.7−30.00.41.91.3−28.8−30.5−28.2−30.11.72.31.9
SJ3−27.0−30.3−30.3−28.5−30.20.01.81.7−28.5−30.3−28.1−30.11.82.22.0
SJ AVR ± SD−26.9 ± 0.7−29.7 ± 0.9−30.3 ± 0.3−28.6 ± 0.1−29.7 ± 0.70.61.71.1−28.7 ± 0.2−30.6 ± 0.4−28.4 ± 0.4−29.9 ± 0.41.92.21.5
MZ1−25.6−28.0−29.3−27.9−29.71.31.41.8−29.3−30.5−29.1−30.61.21.41.5
MZ2−25.7−28.2−29.5−28.0−30.01.31.52.0−29.5−30.7−29.1−30.81.21.61.7
MZ3−25.8−28.8−29.1−28.4−30.20.30.71.8−29.5−30.4−29.4−30.50.91.01.1
MZ AVR ± SD−25.7 ± 0.1−28.3 ± 0.4−29.3 ± 0.2−28.1 ± 0.3−30.0 ± 0.31.01.21.9−29.4 ± 0.1−30.5 ± 0.2−29.2 ± 0.2−30.6 ± 0.21.11.31.4
* The δ13C values are the means of three determinations, and have their typical standard deviations (SD) of ≤0.25‰ (SDC16:0 ≤ 0.13‰; SDC18:0 ≤ 0.25‰; SDC18:1 ≤ 0.19‰; and SDC18:2 ≤ 0.21‰). AVR represents the average.
Table 3. δ13C values (‰) of individual major fatty acids in neutral and polar lipids from O. sinensis substitutes *.
Sample Nos. **Neutral LipidsPolar Lipids
C16:0C18:0C18:1C18:2C16:0C18:0C18:1C18:2
SCMN 1−31.0−31.5−30.4−30.4−30.5−30.8−30.4−30.4
SCMN 2−30.7−31.6−30.5−30.6−30.6−30.9−30.5−30.6
SCMN 3−31.5−32.0−30.9−31.1−31.2−31.6−31.0−31.1
SCMN AVR ± SD−31.1 ± 0.4−31.7 ± 0.3−30.6 ± 0.3−30.7 ± 0.4−30.8 ± 0.4−31.1 ± 0.4−30.6 ± 0.4−30.7 ± 0.4
SCMS 1−31.4−31.7−30.0−30.3−31.2−31.2−30.0−30.1
SCMS 2−31.2−31.4−29.8−30.5−30.9−31.1−29.8−30.0
SCMS 3−31.8−31.9−29.9−30.2−31.1−31.4−29.7−29.9
SCMS AVR ± SD−31.5 ± 0.3−31.7 ± 0.3−29.9 ± 0.1−30.3 ± 0.2−31.1 ± 0.2−31.2 ± 0.2−29.8 ± 0.2−30.0 ± 0.1
FMH 1−14.7−16.2−16.4−16.6−14.5−15.9−16.4−16.5
FMH 2−14.6−16.4−16.3−16.6−14.3−16.0−16.3−16.6
FMH 3−14.9−16.6−16.7−16.8−14.5−16.3−16.8−16.9
FMH AVR ± SD−14.7 ± 0.2−16.4 ± 0.2−16.5 ± 0.2−16.7 ± 0.1−14.4 ± 0.1−16.1 ± 0.2−16.5 ± 0.3−16.7 ± 0.2
FMP 1−24.5−24.8−25.0−26.5−24.2−24.4−25.3−26.2
FMP 2−24.3−24.8−24.8−26.3−23.9−24.2−25.2−26.0
FMP 3−24.2−24.6−24.7−26.4−24.0−24.3−25.1−26.1
FMP AVR ± SD−24.3 ± 0.2−24.7 ± 0.1−24.8 ± 0.2−26.4 ± 0.1−24.0 ± 0.2−24.3 ± 0.1−25.2 ± 0.1−26.1 ± 0.1
* The δ13C values are the means of three determinations, and have their typical standard deviations (SD) of ≤0.25‰ (SDC16:0 ≤ 0.13‰; SDC18:0≤ 0.25‰; SDC18:1 ≤ 0.19‰; and SDC18:2 ≤ 0.21‰). AVR represents the average; ** SCM, the cultivated stromata of Cordyceps militaris; FM, the fermented mycelia.

