Article

Multi-Response Extraction Optimization Based on Anti-Oxidative Activity and Quality Evaluation by Main Indicator Ingredients Coupled with Chemometric Analysis on Thymus quinquecostatus Celak

1
School of Chinese Pharmacy, Beijing University of Chinese Medicine, Beijing 100102, China
2
School of Chinese Pharmacy, Ningxia Medical University, Yinchuan 750004, China
*
Authors to whom correspondence should be addressed.
Submission received: 24 March 2018 / Revised: 10 April 2018 / Accepted: 16 April 2018 / Published: 19 April 2018
(This article belongs to the Collection Recent Advances in Flavors and Fragrances)

Abstract

:
Thymus quinquecostatus Celak is a species of thyme in China and it used as condiment and herbal medicine for a long time. To set up the quality evaluation of T. quinquecostatus, the response surface methodology (RSM) based on its 2,2-Diphenyl-1-picrylhydrazyl (DPPH) radical scavenging activity was introduced to optimize the extraction condition, and the main indicator components were found through an UPLC-LTQ-Orbitrap MSn method. The ethanol concentration, solid-liquid ratio, and extraction time on optimum conditions were 42.32%, 1:17.51, and 1.8 h, respectively. 35 components having 12 phenolic acids and 23 flavonoids were unambiguously or tentatively identified both positive and negative modes to employ for the comprehensive analysis in the optimum anti-oxidative part. A simple, reliable, and sensitive HPLC method was performed for the multi-component quantitative analysis of T. quinquecostatus using six characteristic and principal phenolic acids and flavonoids as reference compounds. Furthermore, the chemometrics methods (principal components analysis (PCA) and hierarchical clustering analysis (HCA)) appraised the growing areas and harvest time of this herb closely relative to the quality-controlled. This study provided full-scale qualitative and quantitative information for the quality evaluation of T. quinquecostatus, which would be a valuable reference for further study and development of this herb and related laid the foundation of further study on its pharmacological efficacy.

1. Introduction

Cardiovascular disease (CVD) is the major cause of death and remains the No.1 killer in the world. It is known that oxidative stress is the main reason resulted in CVD. To find antioxidants from natural sources for clinic preventive medicine has become a hot issue [1,2,3,4]. Due to growing concerns among consumers about food safety, natural antioxidants have been searched to replace chemical additives [5,6]. It was reported that a great number of spice, aromatic, and medicinal plants containing abundant phenolic compounds exhibits obviously antioxidant properties [5,7,8].
Thyme as a well-known fragrant plant is a kind of spice approved by the International Standard Organization [9]. Thymus quinquecostatus Celak is a variety of thyme in China. It is primarily distributed in China, Korea, and Japan [10]. This plant has been used as a food additive in cooking bacon and sausage because of its natural antiseptic action and was traditionally used as a tea-like beverage to dissipate heat and expel poison in China [11,12,13,14,15,16,17]. It also has been widely used for the treatment of arthritis, kaschin-beck disease, acute gastroenteritis, and chronic stomachaches in the clinic nowadays [18].
It is rich in essential oil of T.quinquecostatus, which has been proved to have strong antioxidant capacity [19,20,21]. When compared with its volatile oil, T. quinquecostatus in-volatile part is poorly investigated, and there are few reports on its chemical composition and pharmacological activity [22,23,24]. Our group reported that T. quinquecostatus had a significant anti-cerebral ischemia effect. Several flavonoids and phenolic acids were isolated from its ethanol extract for the first time also displayed obvious anti-cerebral ischemia effect and applied in many fields of clinical medicine, especially scutellarin and danshensu as a most common medicament for the treatment of cerebral ischemia [23,25,26]. According to the free radical theories, there is a great possibility that the anti-cerebral ischemia effect was due to its ability of eliminating free-radicals [27,28,29].
In this study, for the scavenging free radicals activity being quick, easy to operate, and get clear phenomenon, we had attempted to develop a reliable method for the extraction of T. quinquecostatus, according to the scavenging free radicals activity by response surface methodology (RSM). An UPLC-MS2-based method was developed to detect the possible presence of 35 commercially available phenolic acids and flavonoids in this extract. Then, an effective HPLC method was established for the multi-component quantitative analysis, which possesses good antioxidant activity. Accordingly, chemometrics methods, principal components analysis (PCA) and hierarchical clustering analysis (HCA) were utilized to probe the relation between growing areas or harvest times, and the multi-component contents of this plant.

2. Results and Discussions

2.1. Optimization of Extraction Conditions

The RSM is a combination of mathematical and statistical techniques that is useful for modelling and problem analysis. The objective is to optimize this response, as influenced by several variables. In the present study, RSM was used to optimize the extraction conditions and obtain the maximal response variables of T. quinquecostatus for the first time. In preliminary experiments, ethanol concentration, solid-liquid ratio, and extraction time were considered to be factors influencing the plant’s free-radical scavenging ability. The three factors were inspected and the result was shown in Table 1.
The experimental data were fitted to a second-order polynomial model, which can be described as the following Equation (1):
Y = 205.01 + 11.04 X1 + 43.14 X2 + 2.11 X3 − 38.98 X1X2 − 8.07 X1X3 + 64.72 X2X3
24.24 X12 + 122.96 X22 + 35.14 X32
where Y is the measured response variables (IC50 value) and X1, X2 and X3 are the independent variables.
For any term in the model, a large regression coefficient and a small P-value indicated a more significant effect on the respective response variables. The ANOVA was used to assess the significance of each factor and interaction terms (Table 2). The model was found to be highly significant, as evidenced by the results of an F-test, which gave an F-value of 1655.45 (p < 0.0001). The ANOVA of the regression model demonstrated that this model was highly significant (R2 = 0.9989, p < 1%). R Adj 2 (Adjusted R2) provided a measure of how much variability in the observed response values could be explained by the experimental factors and their interactions. In this study, the R Adj 2 (0.9949) was in reasonable agreement, showing that the regression model could be used to explain 99.49% variability in the test data. In the assay process, approximately 0.5% of the results cannot be explained by the model. Moreover, the adequate precision (133.002) showed remarkable signal (>4). The F-value (2.36) and P-value (0.2128) for “lack-of-fit” indicated that the “lack-of-fit” was insignificant relative to the pure error. These data also indicated that the model equation was adequate for predicting response under any combination of the variables. On the basis of Table 3, all of the variables except extraction time (X3, p > 0.05) have greatest effect on the extraction efficiency (p < 0.01). These results indicated that the model had a good representative and could thus be used to predict the actual experiment results.
Three-dimensional plots give a comprehensive picture of the behaviors on the prediction variances throughout a region and the quality of the predicted responses that were obtained by Box-Behnken Design (BBD). Figure 1a–c, it clearly illustrated that the eliminating 2,2-Diphenyl-1-picrylhydrazyl (DPPH) capacity was mainly affected by the liquid mass ratio and ethanol concentration. The antioxidant capacity increased with the liquid mass ratio and ethanol concentration, and then decreased with further increases. The highest clearing DPPH radical was obtained at an ethanol concentration of approximately 42.32% and a liquid mass ratio of 17.51:1. In order to carry out future research on T. quinquecostatus and for the convenience of industrial production, the optimal ethanol concentration and liquid-solid ratio was changed to be 45% and 20:1, respectively. The extract of phenolic compounds depends largely on the polarity of solvent, and a combination of solvent and water is more effective than a solvent alone. As the ethanol concentration increased, the dielectric constant and energy that is required for breaking the water arrangement decreased, not only more phenolic compounds were extracted, but also more impurities [30]. From the Figure 1b,c, we assumed that the extraction time had nonsignificant influence on the antioxidant capacity. The trapping-DPPH action increased when the extraction time increased from 1 h to approximately 1.5 h, and then this tendency was interrupted. The result may be explained by the fact that the prolonged extraction time may cause the decomposition of active compounds, resulting in the loss of active compounds [31]. Thus, the best extraction time was 1.5 h. In conclusion, the optimum extraction process was 45% (ethanol concentration), 20:1 (liquid mass ratio), and 1.5 h (extraction time), respectively.

2.2. Identification of the Main Constituents of T. quinquecostatus Extract

In this study, to explore the chemical compounds’ structural diversity in the extract using the optimum extraction process, an UPLC-MS2-based method was developed. In order to get adequate structural information of the chemical constituents in this extract and to reveal as many chemical compounds as possible, both positive and negative modes were employed for the comprehensive analysis. Finally, a total of 35 compounds were detected by Mass profiler (Figure 2) and were identified by comparing their retention time, accurate mass data, and the information of fragmentation with reported reference (Table 3 and Table 4), including 12 phenolic acids and 23 flavonoids that are characteristic of thymus species.

2.2.1. Characterization of Phenolic Acids

In this work, a total number of 12 phenolic acids were identified in the extract. Peaks 3, 5 were identified as danshensu, vanillic acid, by comparing with the reference standards. They all had the characteristic fragment ions that were generated by the neutral loss of H2O (18 Da) or CO2 (44 Da), which indicated the existence of carboxyl in molecular structures. The fragmentation behaviors of peaks 1, 11, 12, and 23 were similar with that of danshensu, but the quasi-molecular ions [M − H] of them were different. According to the MS2 information achieved and the chemical constituents that were reported in literatures [32,33], they were identified as paeonol, hydroxybenzoic acid, caffeic acid, and ethyl caffeate, respectively. Peak 4, which had the quasi-molecular ion at m/z 153 in negative ion mode, was tentatively characterized as gentisic acid or protocatechuic acid, due to lacking of information [33,34].
Thereinto, danshensu, and caffeic acid are the basic components in the extract. Due to the loss of 198 Da and 180 Da, peaks 15, 16, 17, 33 were inferred to be condensed by different numbers of danshensu and caffeic acid. Meanwhile, the characteristic fragment ions of peak 6 were the ions at m/z [M − H − 180] and [M − H − 192] in MS2 spectrum, which were important to estimate the phenolic acid containing caffeic acid and quinic acid. Finally, according to the different quasi-molecular and when comparing with the data in the literature [35,36,37,38], peaks 6, 15, 16, 17 and 34 were identified as chlorogenic acid, salvianolic acid A, rosmarinic acid, salvianolic acid C, and methyl rosmarinate, respectively.

2.2.2. Characterization of Flavonoids

Under the conditions of soft-ionization, the mass fragmentation of parent nucleus of flavonoids occurs on the C ring in general, producing the corresponding fragment ions of 1,3A+, 1,3B+, 0,2B+ (Figure 3) [39]. In this study, most of flavones had the characteristic fragment ions through the retro Diels-Alder (RDA) reaction. In the MS2 spectrum of peak 23 in negative ion mode, a product ion at m/z 121 [0,2B+ + OH] was generated. Finally, when comparing with the reference standards, peak 23 was identified as apigenin.
There were 23 flavonoids that were identified in the T. quinquecostatus extract, including eight O-glycosyl flavonoids, nine polyhydroxy flavones, and six polymethoxy flavones. The loss of 15 Da (CH3), 18 Da (H2O), 31 Da (CH3O), and 28 Da (CO) is characteristic of poly-substituted flavones. Among them, peaks 26 and 27 were characterized as xanthomicrol and cirsilineol. The identical quasi-molecular ions at m/z 345 [M + H]+ and similar fragmentation make it difficult to distinguish them. Yet, the flavonoids containing methoxyl at 6- and 8- will generate a strong ion [M − CH3]+, and then product ion [M − 43]+ by losing CO consecutively. According to this rule, peak 26 that had the product ion at m/z 330 as the base peak in MS2 spectrum by the loss of methyl was assigned as xanthomicrol, which is a potentially previously unrecognized compounds in the thyme genus. The loss of a hexoside residue (162 Da) or (176 Da) usually occurs on O-glucoside or O-glucuronide flavonoids and the aglycone [M − 162] was the base peak in MS2 spectrum. Based on the MS2 information achieved, 6 O-glucoside flavonoids and 2 O-glucuronide flavonoids were identified.

2.3. Optimization of HPLC Conditions

Based on the results of “2.2”, the compounds danshensu (peak 3), vanillic acid (peak 4), chlorogenic acid (peak 6), galuteolin (peak 10), scutellarin (peak 13), and apigenin (peak 23) were the characteristic constituents in each sample. Pharmacological researches show that they have good abilities of free radical scavenging, activating blood, and removing stasis [40,41,42]. Therefore, a HPLC method was developed to analyse the above six compounds.
T. quinquecostatus secondary metabolites are difficult to separate because of their complex compositions and their similar physicochemical properties. So to obtain chromatograms with good separation, the different mobile phases comprising of acetonitrile–water and methanol–water in various proportions were compared under different gradient elution modes, while they failed to produce satisfactory separation of the six analytes. Acetic acid and phosphoric acid additives were therefore investigated, and it was observed that phosphoric acid could improve the separation. The effects of flow rate and detection wavelength were also investigated, and the results showed that the separation was optimal at 1.0 mL/min and 294 nm, respectively. Finally, a gradient elution program was selected to ensure that each run was completed within 75 min. In addition, 25 °C was chosen as the column temperature. After many tests, excellent separations of the six compounds were achieved in a single run. The representative chromatogram is shown in Figure 4.

2.4. Validation of HPLC

2.4.1. Linearity

The parameters of the linear calibration curve with the R2, linear range, and regression equation of the six compounds are listed in Table 5. Consequently, each coefficient of determination (R2) was greater than or equal to 0.9990, as determined by least squares analysis, suggesting a good linearity between the peak areas (y) and the compound concentrations (x) over a wide concentration range.

2.4.2. Precision, Repeatability, Stability and Accuracy

The intra- and inter-day precisions of the 6 active components ranged from 1.28% to 1.82% and 0.21% to 1.96%, respectively, indicating that the method described was sufficiently precise enough for the quantitative evaluation of the analytes in thyme. Repeatability (RSD < 2%) demonstrated that the developed analytical method was reproducible for all of the components that were examined. The sample solutions were stable within 48 h (RSD < 2%). Average recoveries of the investigated targets ranged from 96.72% to 101.67%, and the RSD was less than 2% (n = 9), which demonstrated that the developed HPLC method was sufficiently reliable and accurate for the measurement of the compounds analyzed. The results of precision, repeatability, stability, and accuracy are shown in Table 5.

2.5. Quantitative Determination of 6 Compounds

The developed HPLC method was successfully applied to simultaneously determine the six major active components in the samples of T. quinquecostatus from different habitats and harvest times. Remarkable differences occurred amongst the contents of the chemical markers that were analyzed in the different samples (Table 6 showed). The habitat of thyme had a great influence on the chemical constituents’ contents. Generally, the contents in qingyang and yanchi samples (both from Gansu province) were higher than that of the jingbian samples (Shaanxi province). Notably, the highest contents of danshensu and scutellarin could reach to 11.080 and 4.472 mg/g, respectively. danshensu and scutellarin were the most abundant bioactive components of the six components, having a strong effect on cardio-cerebrovascular diseases [43,44]. In addition, galuteolin and apigenin were scarcely detectable in some samples, suggesting that there were obvious variations amongst the test samples in chemical compositions.

2.6. Chemometric Analysis

Chemometrics is an analysis method for extracting valuable information from large amounts of multivariate data. The PCA and HCA were performed to further explore the relation amongst the contents of ingredients, harvest times, and habitats.

2.6.1. PCA

PCA, which is a data transformation technique, could systematically convert a large number of original variables to a set of more coherent linear combinations (called principal components, PCs) [45]. PCA is a powerful tool to reduce the dimensions of multivariate data sets [46]. In the present study, the areas of six common peaks were treated as variables. Figure 5 indicated that the first two PCs accumulated approximately 84.6% of the original data variability. The score plot indicates that the 12 samples could be classified into three groups. The S2–S5 from qingyang was primarily distributed in the origin of coordinates, unlike the S1, because its multi-component contents were all higher than the contents from other harvest times, particularly danshensu. This result suggested that if danshensu is the target composition, medicinal herbs harvested around July 1 in qingyang should be considered first. The S10–S12 from yanchi was primarily distributed in quadrant II, and the S7–S9 from jingbian was primarily distributed in quadrant Ш, except for the S6. The content of S6 was also higher than the content from other harvest times in the same habitat.

2.6.2. HCA

HCA, which is a multivariate analysis technique, is used to sort samples into groups. The between-groups linkage method as the amalgamation rule and the squared Euclidean distance, as the metric was applied to establish clusters. Figure 6 showed the resulting dendrogram, which is divided into two primary clusters. The result indicated that S1 collected from qingyang may be classified into group I with S10–S12 from yanchi, which means that S1 is more similar to yanchi than to other samples from qingyang. These results may be confirmed by the danshensu and the scutellarin contents in S1, which is more similar to S10–S12 than to other samples. As shown in Figure 6, the distance from groups II and Ш to I is longer than from group II to group Ш, which indicates that the samples in group II and group Ш were more similar. Figure 6, with a few exceptions, indicated that the contents of samples in the same habitat are quite similar to one another. The contents were quite consistent with the contents of PCA. It is also necessary to study the accumulation of the active ingredients in thyme to further optimize the best harvest season.

3. Materials and Methods

3.1. Materials and Reagents

The DPPH (2,2-Diphenyl-1-picrylhydrazyl, Sigma Co., Ltd., Croydon, UK) radical scavenging activity was determined using an ELISA microplate reader (Beijing Perlong New Technology Co., Ltd., Beijing, China) with 96-well plates (Nantong lineng Experiment Equipment Co., Ltd., Nantong, China). The T. quinquecostatus plant was obtained from yulin in Shaanxi province and qingyang and yanchi in the Gansu province in China. The samples were identified by Dr Shengjun Ma, department of Chinese Medicinal Resources, Beijing University of Chinese Medicine. Chlorogenic acid (Batch No. 110753), vanillic acid (Batch No. 110776-200402), scutellarin (Batch No. 110842-201207), galuteolin (Batch No. 111720-201307), apigenin (Batch No. 111901-201102), and danshensu (Batch No. 110855-201311) were reference compounds. Acetonitrile of HPLC-grade and LC-MS-grade was purchased from Fisher Scientific (Fair Lawn, NJ, USA). Phosphoric acid (Tianjin Fuchen Chemical Reagents Factory, Tianjin, China) and formic acid (Beijing Chemical works, Beijing, China) were HPLC grade. Ultra-pure waterused throughout the experiment was obtained from Guangzhou Watsons Food & Beverage Co., Ltd. (Guangzhou, China).

3.2. Optimization of Extraction Conditions

3.2.1. Design of the Extraction Method

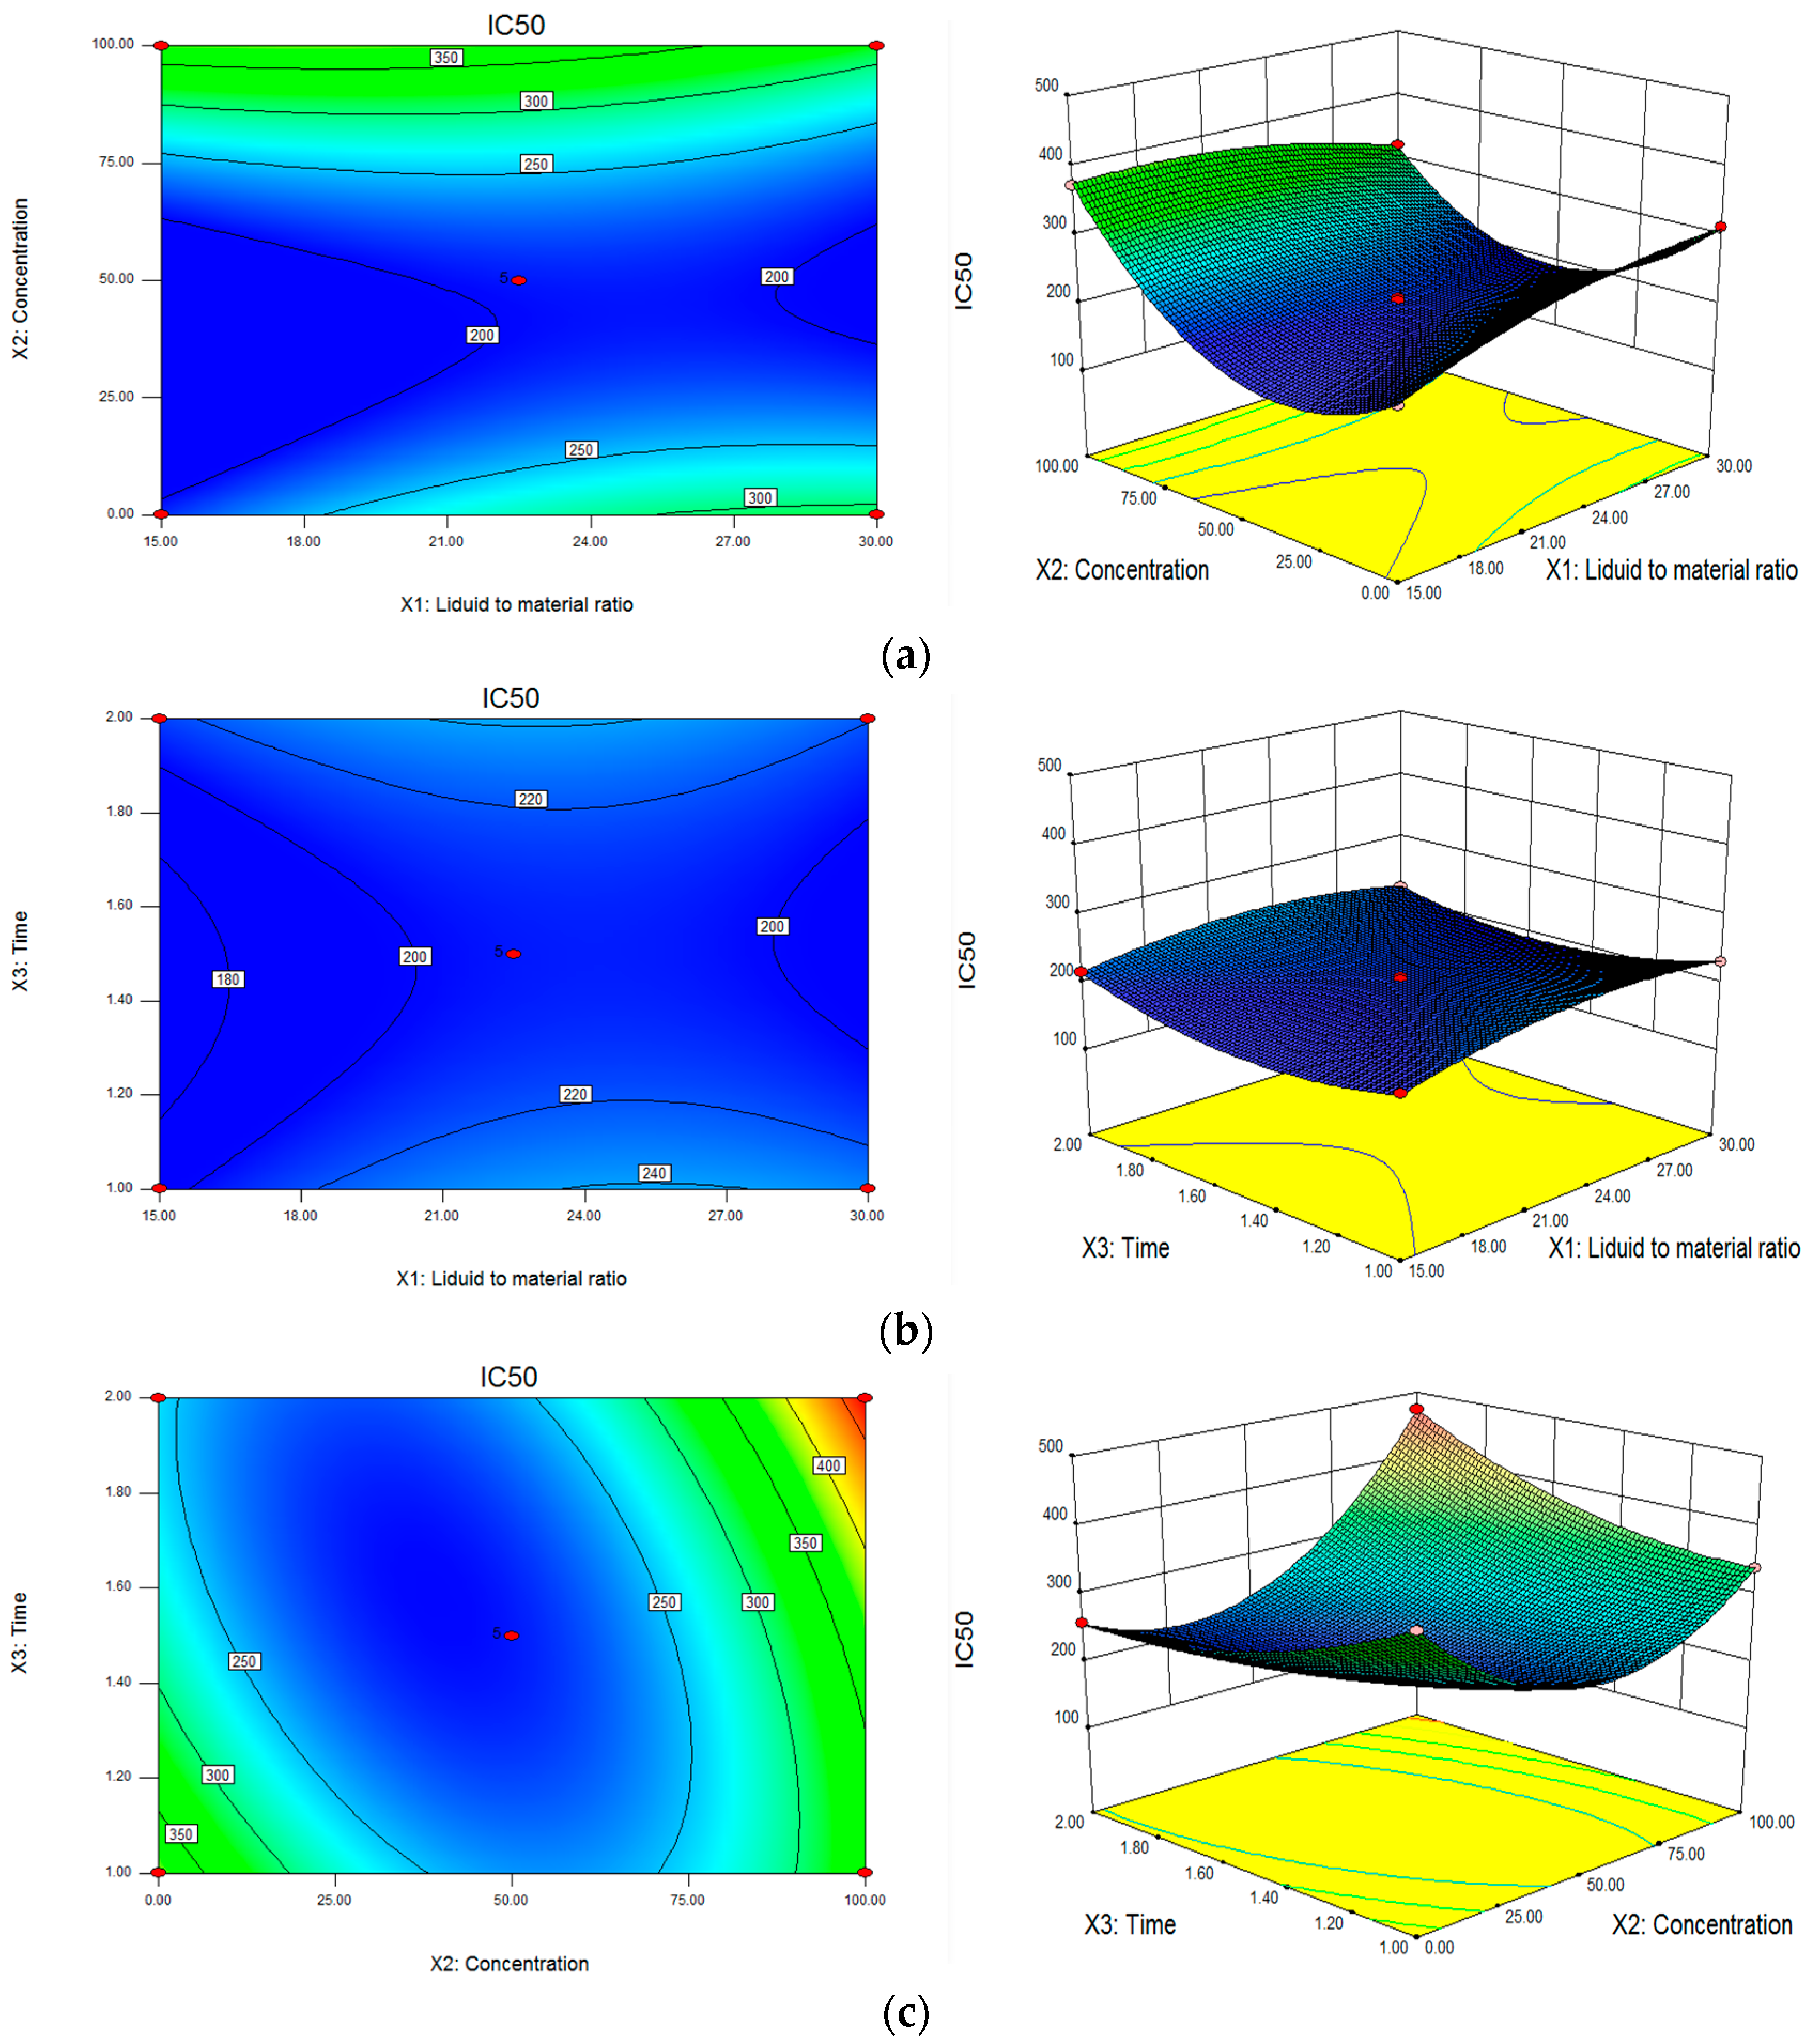
RSM was employed to optimize the extraction conditions in terms of antioxidant activity. The design using a three-factor, three-level BBD comprised of 17 experimental points. The three independent variables examined were solid-liquid ratio (X1), ethanol concentration (X2), and extraction time (X3). The actual values of each variable, which were predetermined by preliminary experiments, were coded at three levels (−1, 0, 1) for statistical analysis (Table 7).

3.2.2. DPPH Radical Scavenging Activity Assay

The DPPH radical scavenging activity was determined, according to the method that was reported by Sharififar and others with some modifications [47]. An equal amount of (1 mL of 0.15 mg) DPPH solution in 70% ethanol was mixed with 0.1 mL T. quinquecostatus extract in 70% ethanol in various concentrations. After being mixed, the solution was allowed to reach a steady state at room temperature for approximately 1.5 h. The DPPH radical scavenging activity was determined by the absorbance at λ = 517 nm using a microplate reader and was calculated by the following Equation (2):
DPPH radical scavenging activity = (A0 − A1)/A0 × 100%
where A0 is the absorbance of the control (blank, without extract) and A1 is the absorbance of the mixture with the extract.

3.3. Preparation of Sample Solution

Sample preparation was conducted according to the above optimum extraction process with an ultrasonic cleansing bath. In brief, the crushed sample (approximately 2.0 g), accurately weighed, was transferred into a 100 mL conical flask with a stopper, and 40 mL of 45% ethanol solution was added, and was then ultrasonically extracted at room temperature for 1.5 h. The extracted solution was concentrated and filtered through 0.22 µm membrane filters before analysis. The contents of the selected compounds in T. quinquecostatus were obtained from the corresponding calibration curves.

3.4. Preparation of Standard Solution

Standard stock solutions of the six reference standards, vanillic acid (12.9 µg/mL), chlorogenic acid (100.0 µg/mL), danshensu (150.0 µg/mL), galuteolin (20.0 µg/mL), scutellarin (200.0 µg/mL), and apigenin (20.0 µg/mL) were prepared by dissolving the respective working standard substance in alcohol. The solutions were then diluted with alcohol to the concentrations required. All of the solutions were stored at 4 °C before use.

3.5. Instrument and UPLC-MS/MS Conditions

UPLC separations were optimized and finally performed on a Themo DIONEX UltiMate 3000 system (Thermo Fisher Scientific, Waltham, MA, USA) using a reverse-phase analytical column (3.6 μm, 4.6 × 150 mm, XDB-C18, Agilent, Santa Clara, CA, USA) at 30 °C with a 1.0 mL/min flow rate. 1 μL test solution was injected into the UPLC system. The mobile phase comprised acetonitrile (A) and 0.1% formic acid (B). The linear eluting gradient was as follows: 0–5 min, 5–30% A; 5–8 min, 30–52% A; 8–12 min, 52%A; 12–18 min, 52–95% A; 18–22 min, 95% A; 22–23 min, 95–5% A; and, 23–30 min, 5% A.
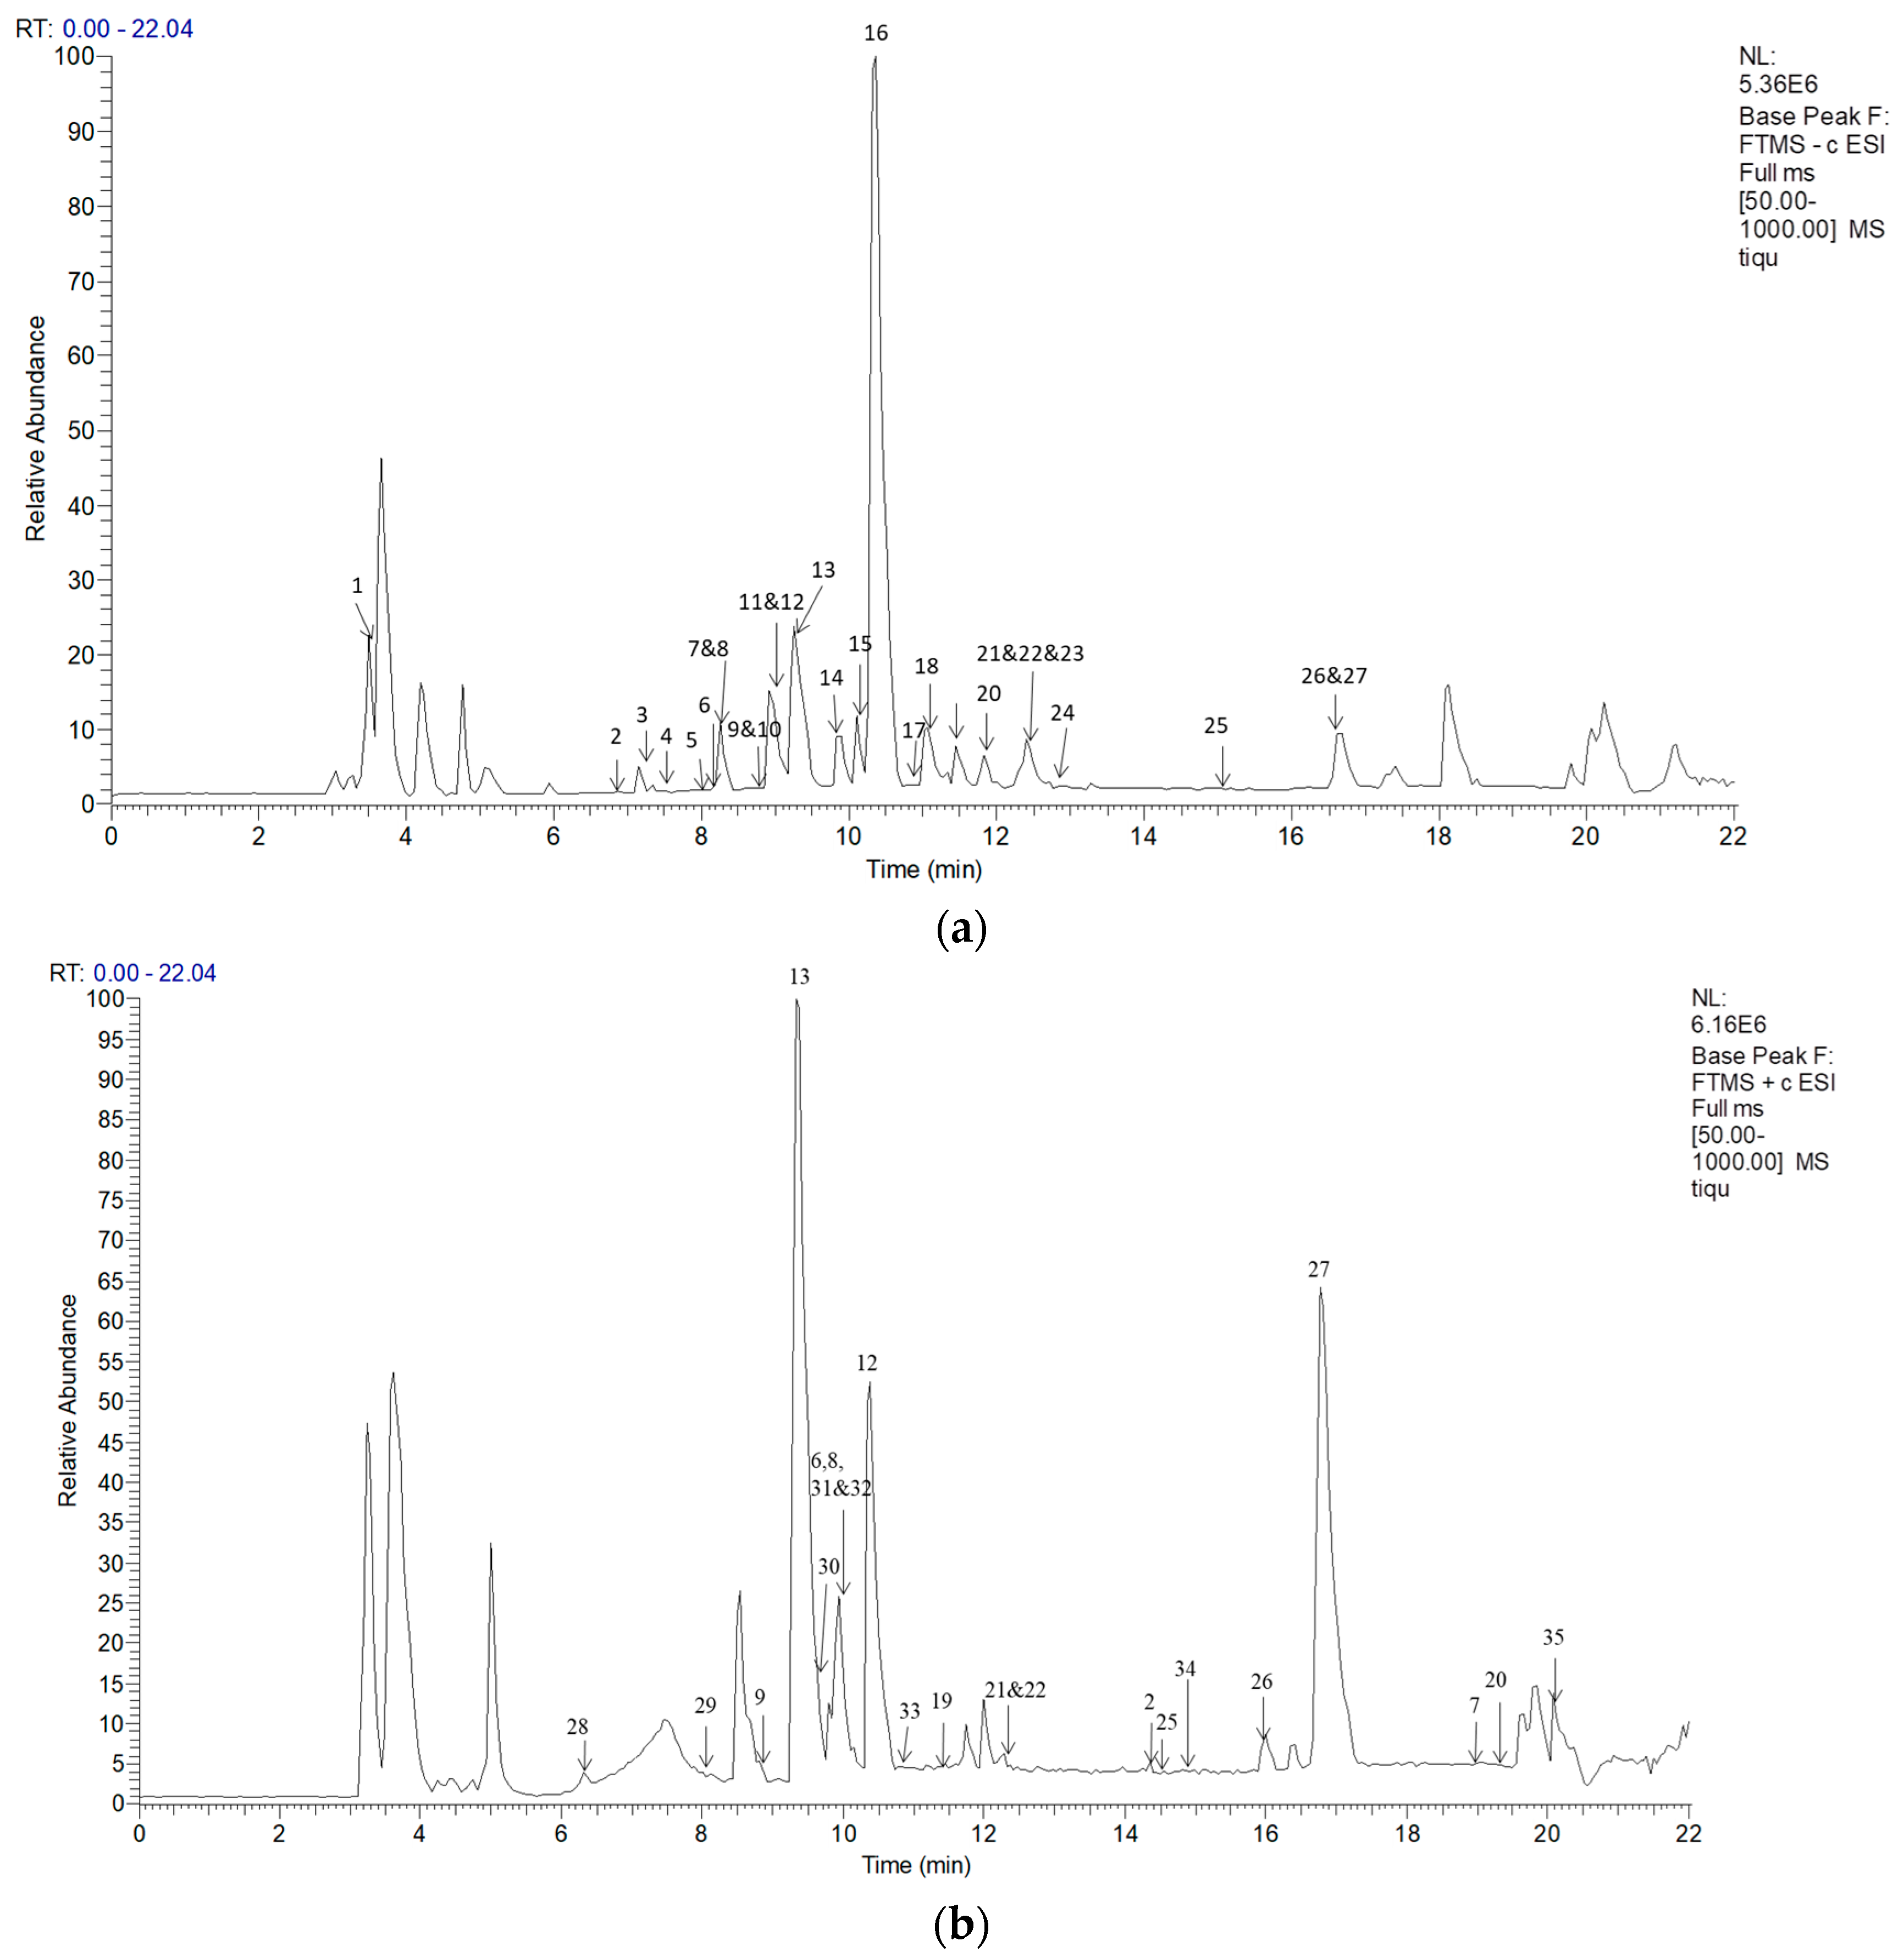
For the ESI-MS/MS experiment, a Thermo LTQ-Orbitrap Velos Pro Hybrid mass spectrometer (Thermo Fisher Scientific, Bremen, Germany), equipped with an ESI source operating in auto-MSn mode to obtain fragmentation in negative mode. Full scan data acquisition was performed from m/z 50 to 1000 in both negative and positive ion mode. The optimized ESI parameters in negative ion mode were set, as follows: capillary temperature of 350 °C; sheath gas flow rate of 40 arb; auxiliary gas flow rate of 10 arb; electrospray voltage of −3.5 V; and, tube lens voltage of −120 V. The electrospray voltage was 3.4 V and tube lens voltage was 120 V in positive ion mode; and other parameters were same as those of negative ion mode. The scan cycle employed a full-scan event at a resolution of 30,000. The most intense ions detected in the full-scan spectrum were selected for the data-independent scan. The collision energy for collision-induced dissociation (CID) was adjusted to 35% of the maximum. All of the instruments were controlled by the Xcalibur data system, and the data acquisition was carried out by analyst software Xcalibur 2.1 (Thermo Fisher Scientific, Waltham, MA, USA).

3.6. Instrument and HPLC Conditions

Quantitative analysis of 6 selected compounds were conducted on a Waters 2489 HPLC system (Waters Corporation (Shanghai), Shanghai, China), equipped with a breeze 2 data workstation, a UV detector and a manual injector. The separation was performed on a Thermo Hypersil GOLD C18 (5 μm, 4.6 × 250 mm, Thermo Fisher Scientific, Waltham, MA, USA) at 25 °C. The mobile phase comprising acetonitrile (solvent A) and 0.1% aqueous phosphoric acid (solvent B) was used to elute the target components with a gradient programme (0–5 min, 0–7% A; 5–l0 min, 7–13% A; 10–15 min, 13–15% A; 15–20 min, 15–18% A; 20–25 min, 18% A; 25–30 min, 18–20% A; 30–35 min, 20% A; 35–45 min, 20–28% A; 45–55 min, 28–40% A; 55–65 min, 40–80% A; 65–70 min, 80–100% A; and, 70–75 min, 100% A). The sample injection volume, flow rate, and detection wavelength were set at 10 μL, 1.0 mL/min, and 294 nm, respectively.

3.7. HPLC Method Validation

3.7.1. Linearity

The stock solutions containing the six analytes were prepared and diluted with alcohol to the appropriate concentration for construction of calibration curves. At least six concentrations of each compound were analysed under optimum HPLC conditions in triplicate, and the calibration curves were then constructed by plotting the peak areas compared with the concentration of each analyte. The regression equations were calculated in the form of y = ax + b, where y and x correspond to the peak area and concentration, respectively. The results are presented in Table 4.

3.7.2. Precision, Repeatability, and Stability

The measurement of intra- and inter-day variability was utilized to evaluate the precision of the developed method. The intra-day precision was investigated for the mixed standards using six replicates within one day, and inter-day precision was determined in triplicate for three consecutive days. Variations were expressed by RSD.
The repeatability of the established method was examined at one level, and the T. quinquecostatus samples were extracted and analysed in triplicate using the previously mentioned method. The repeatability was presented as RSD (n = 6).
The stability of the sample solution was also assessed at room temperature. The same sample solution was analysed in triplicate at 0, 2, 4, 8, 12, 24, and 48 h. RSD was considered as a measure of stability.
Results regarding the stability as well as the precision and repeatability were summarized (Table 4).

3.7.3. Accuracy

A recovery test was used to evaluate the accuracy of the developed method. Three quantities (low, medium, and high) of the six authentic standards were added to a certain amount of the sample with known contents of target analytes. The mixtures were then extracted and analysed, as described above.

3.8. Identification and Determination of 6 Components

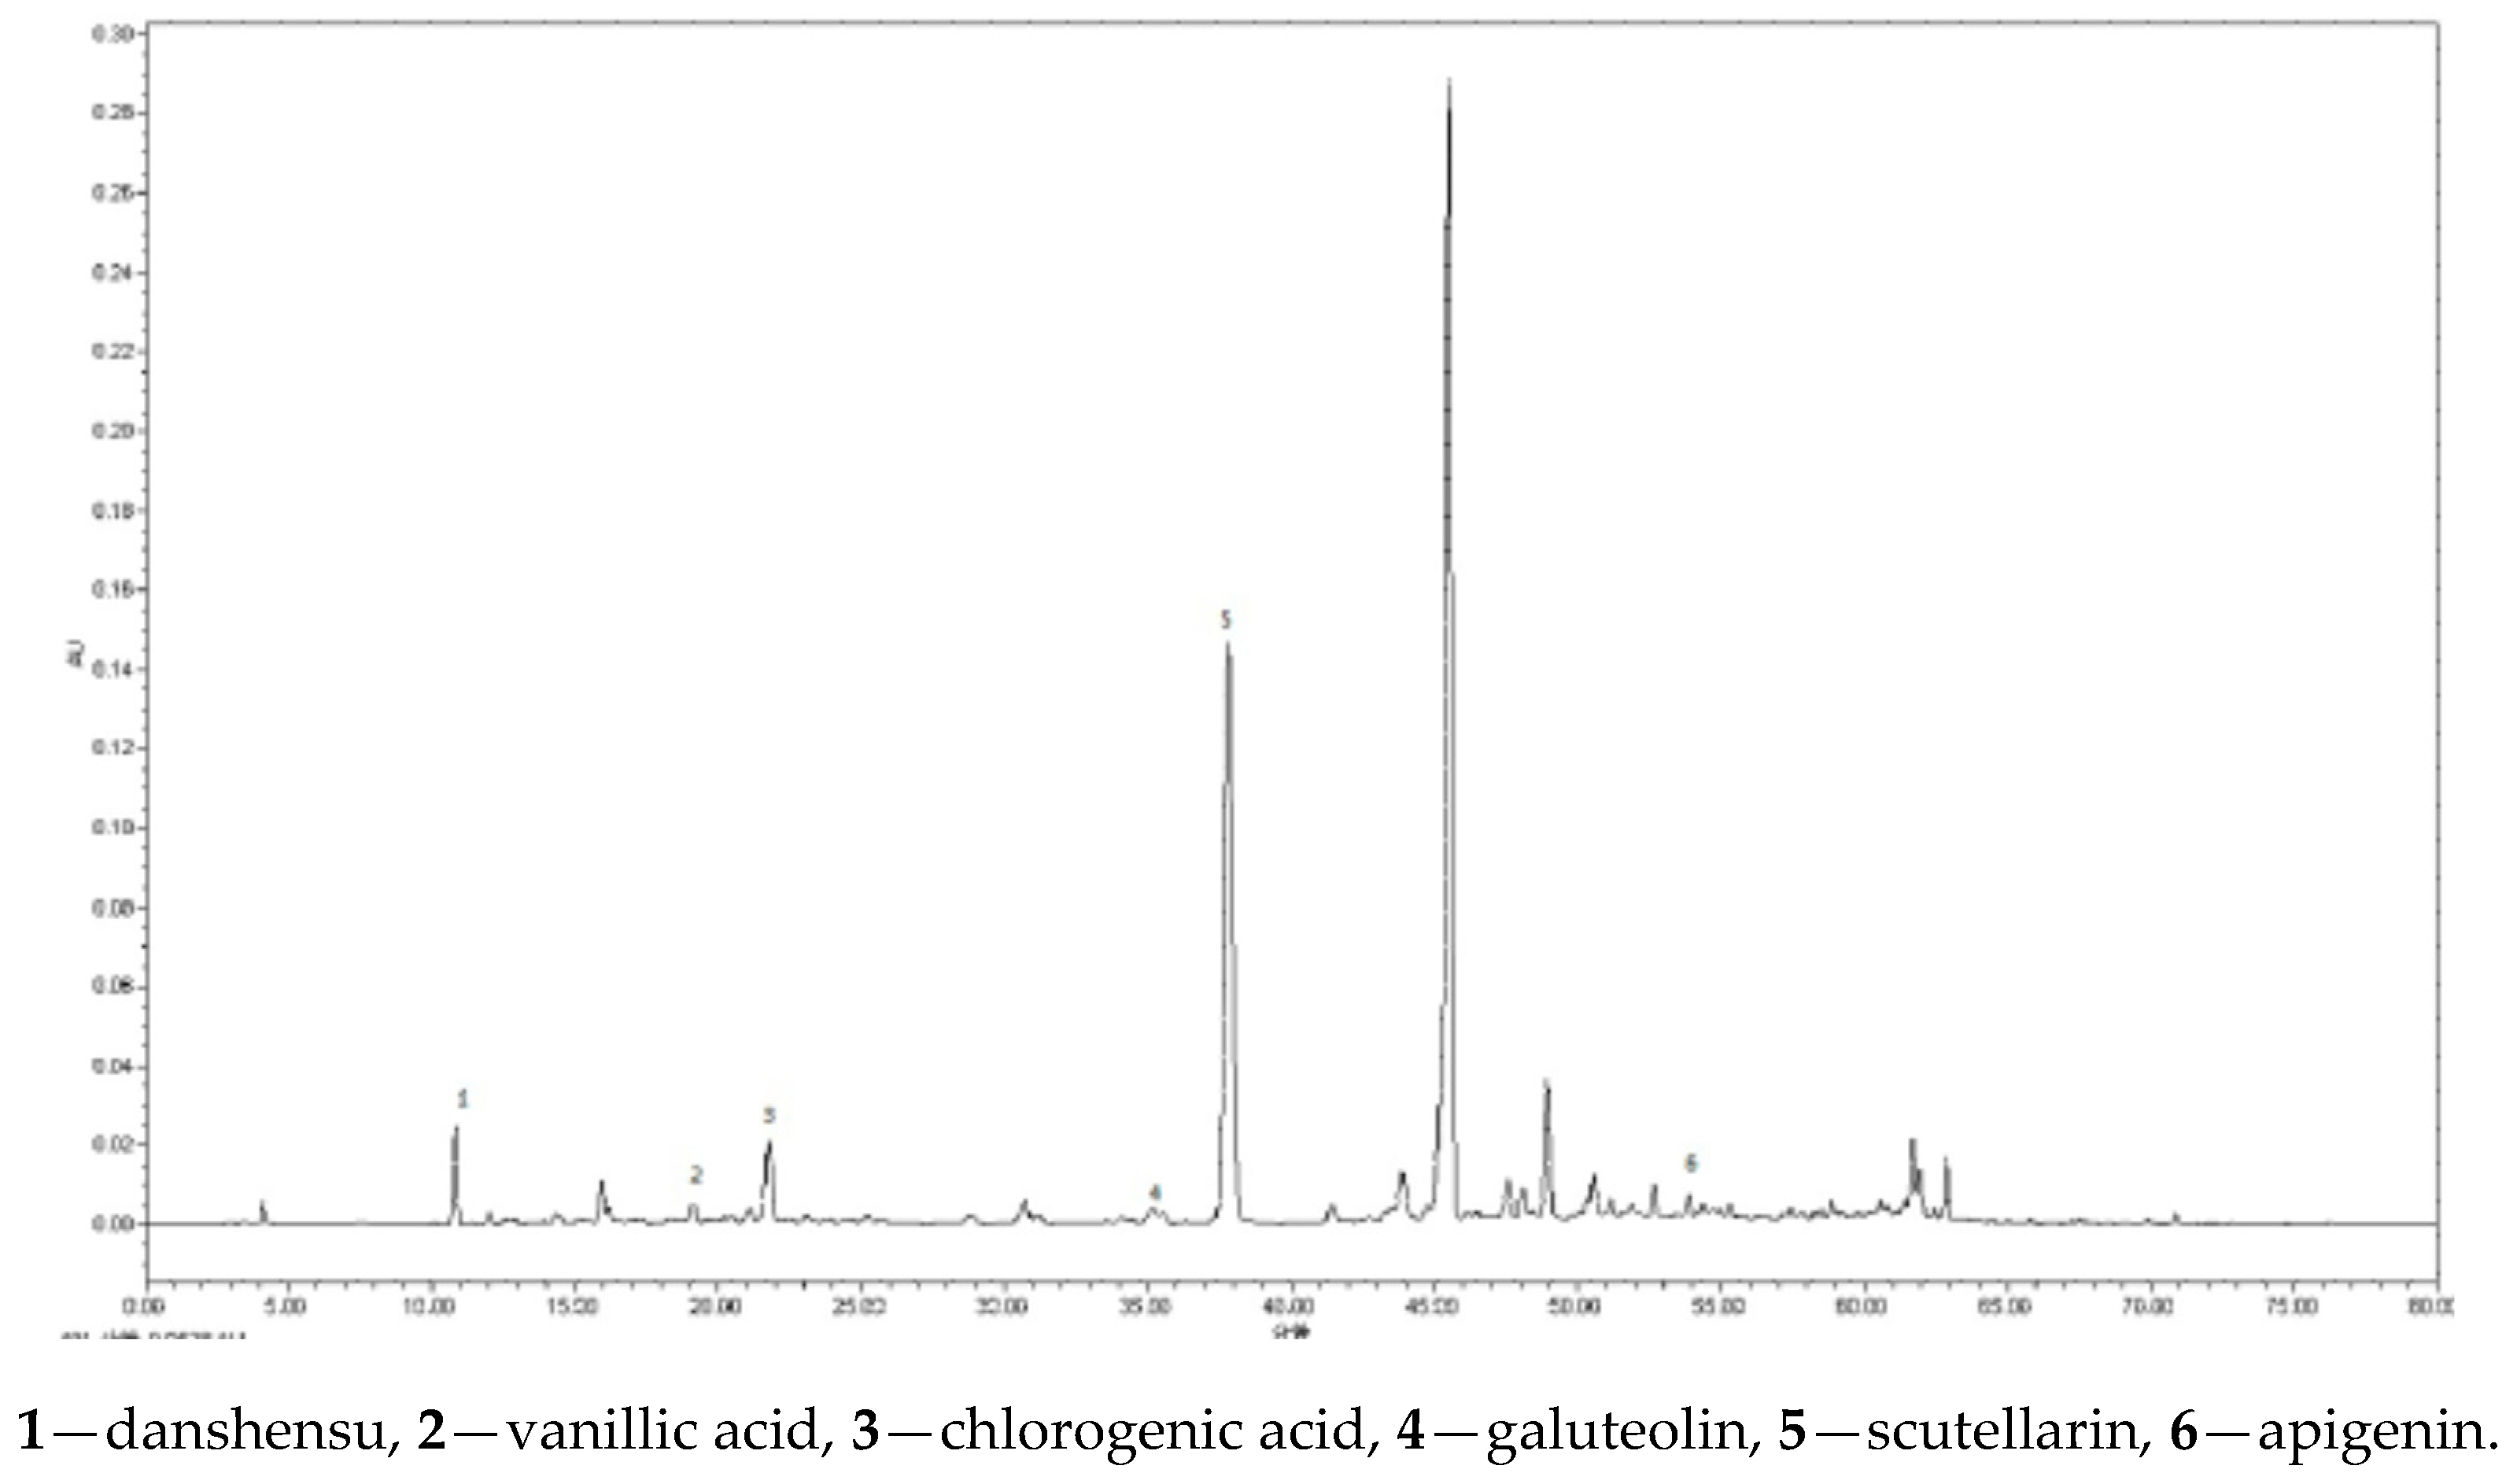
According to the HPLC chromatogram ofsample solution and standard solution, the peak position of each component in the T. quinquecostatus was determined (Figure 3). T. quinquecostatus plants, distributed in qingyang, jingbian and yanchi, were harvested. The plants were gathered from July to October to obtain 12 batch samples and they were dried in a shady area. The extract was prepared according to Section 3.3 and then analysed, as described above.

3.9. Data Analysis

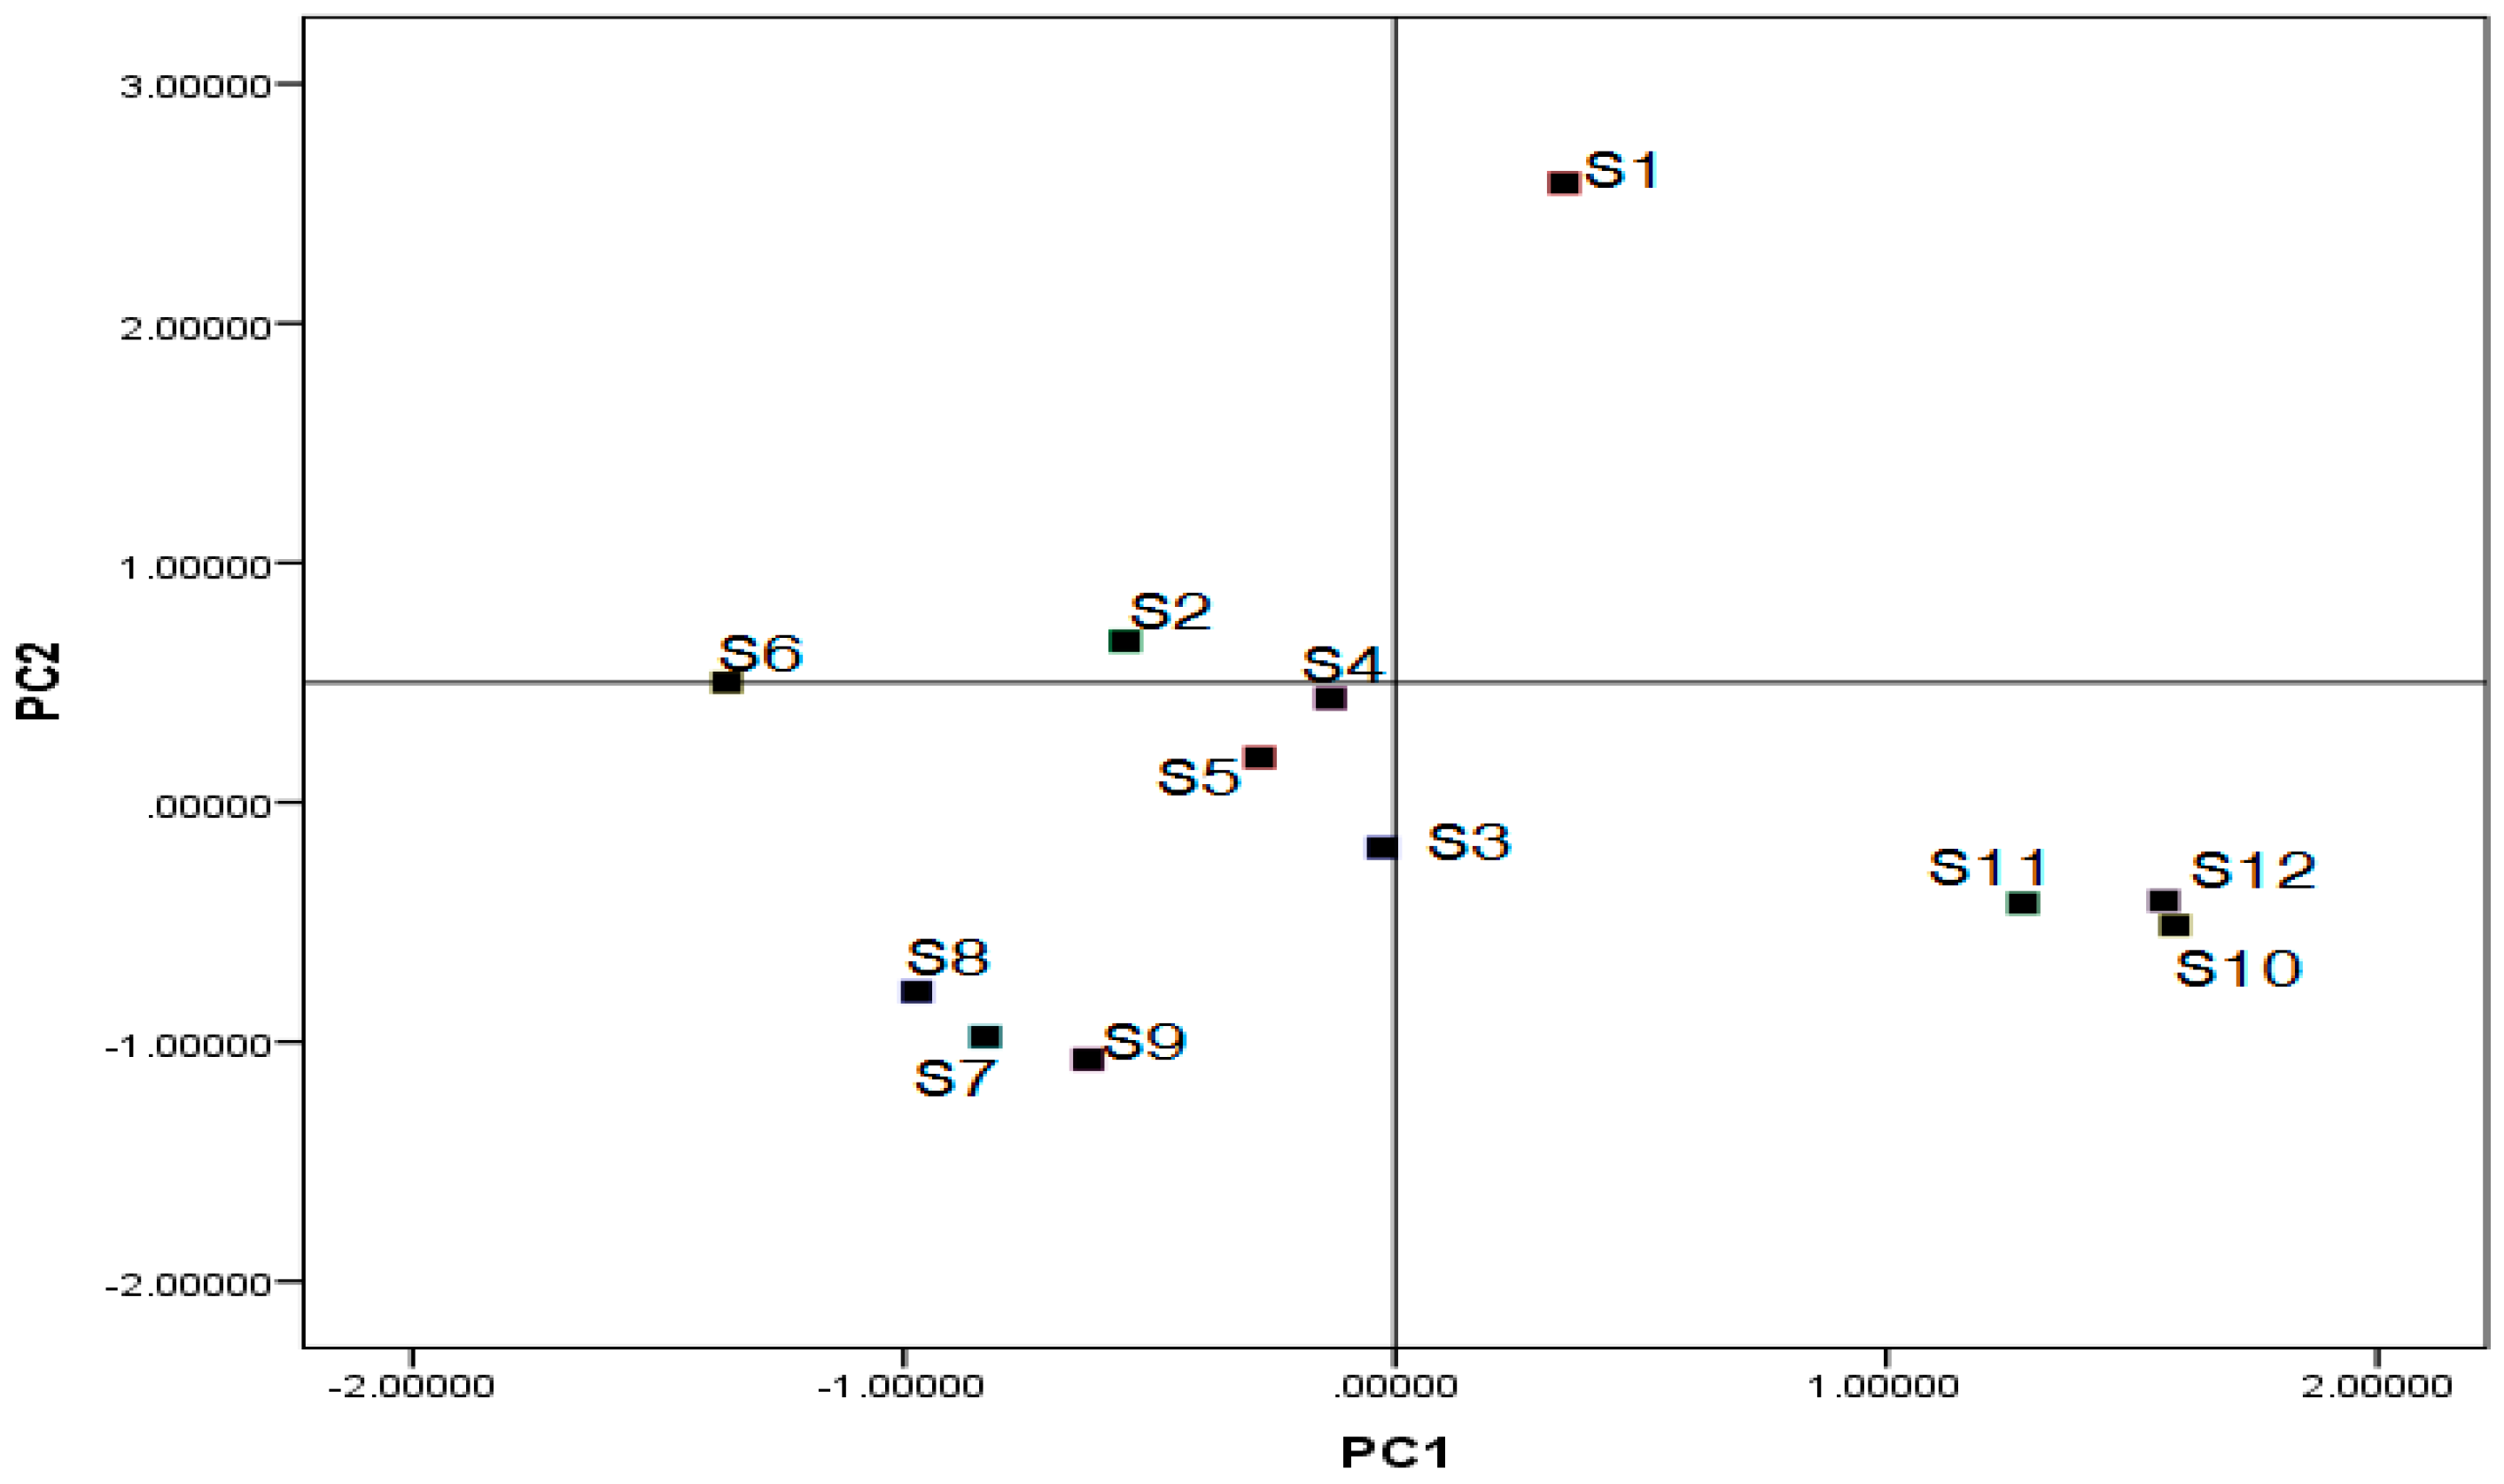
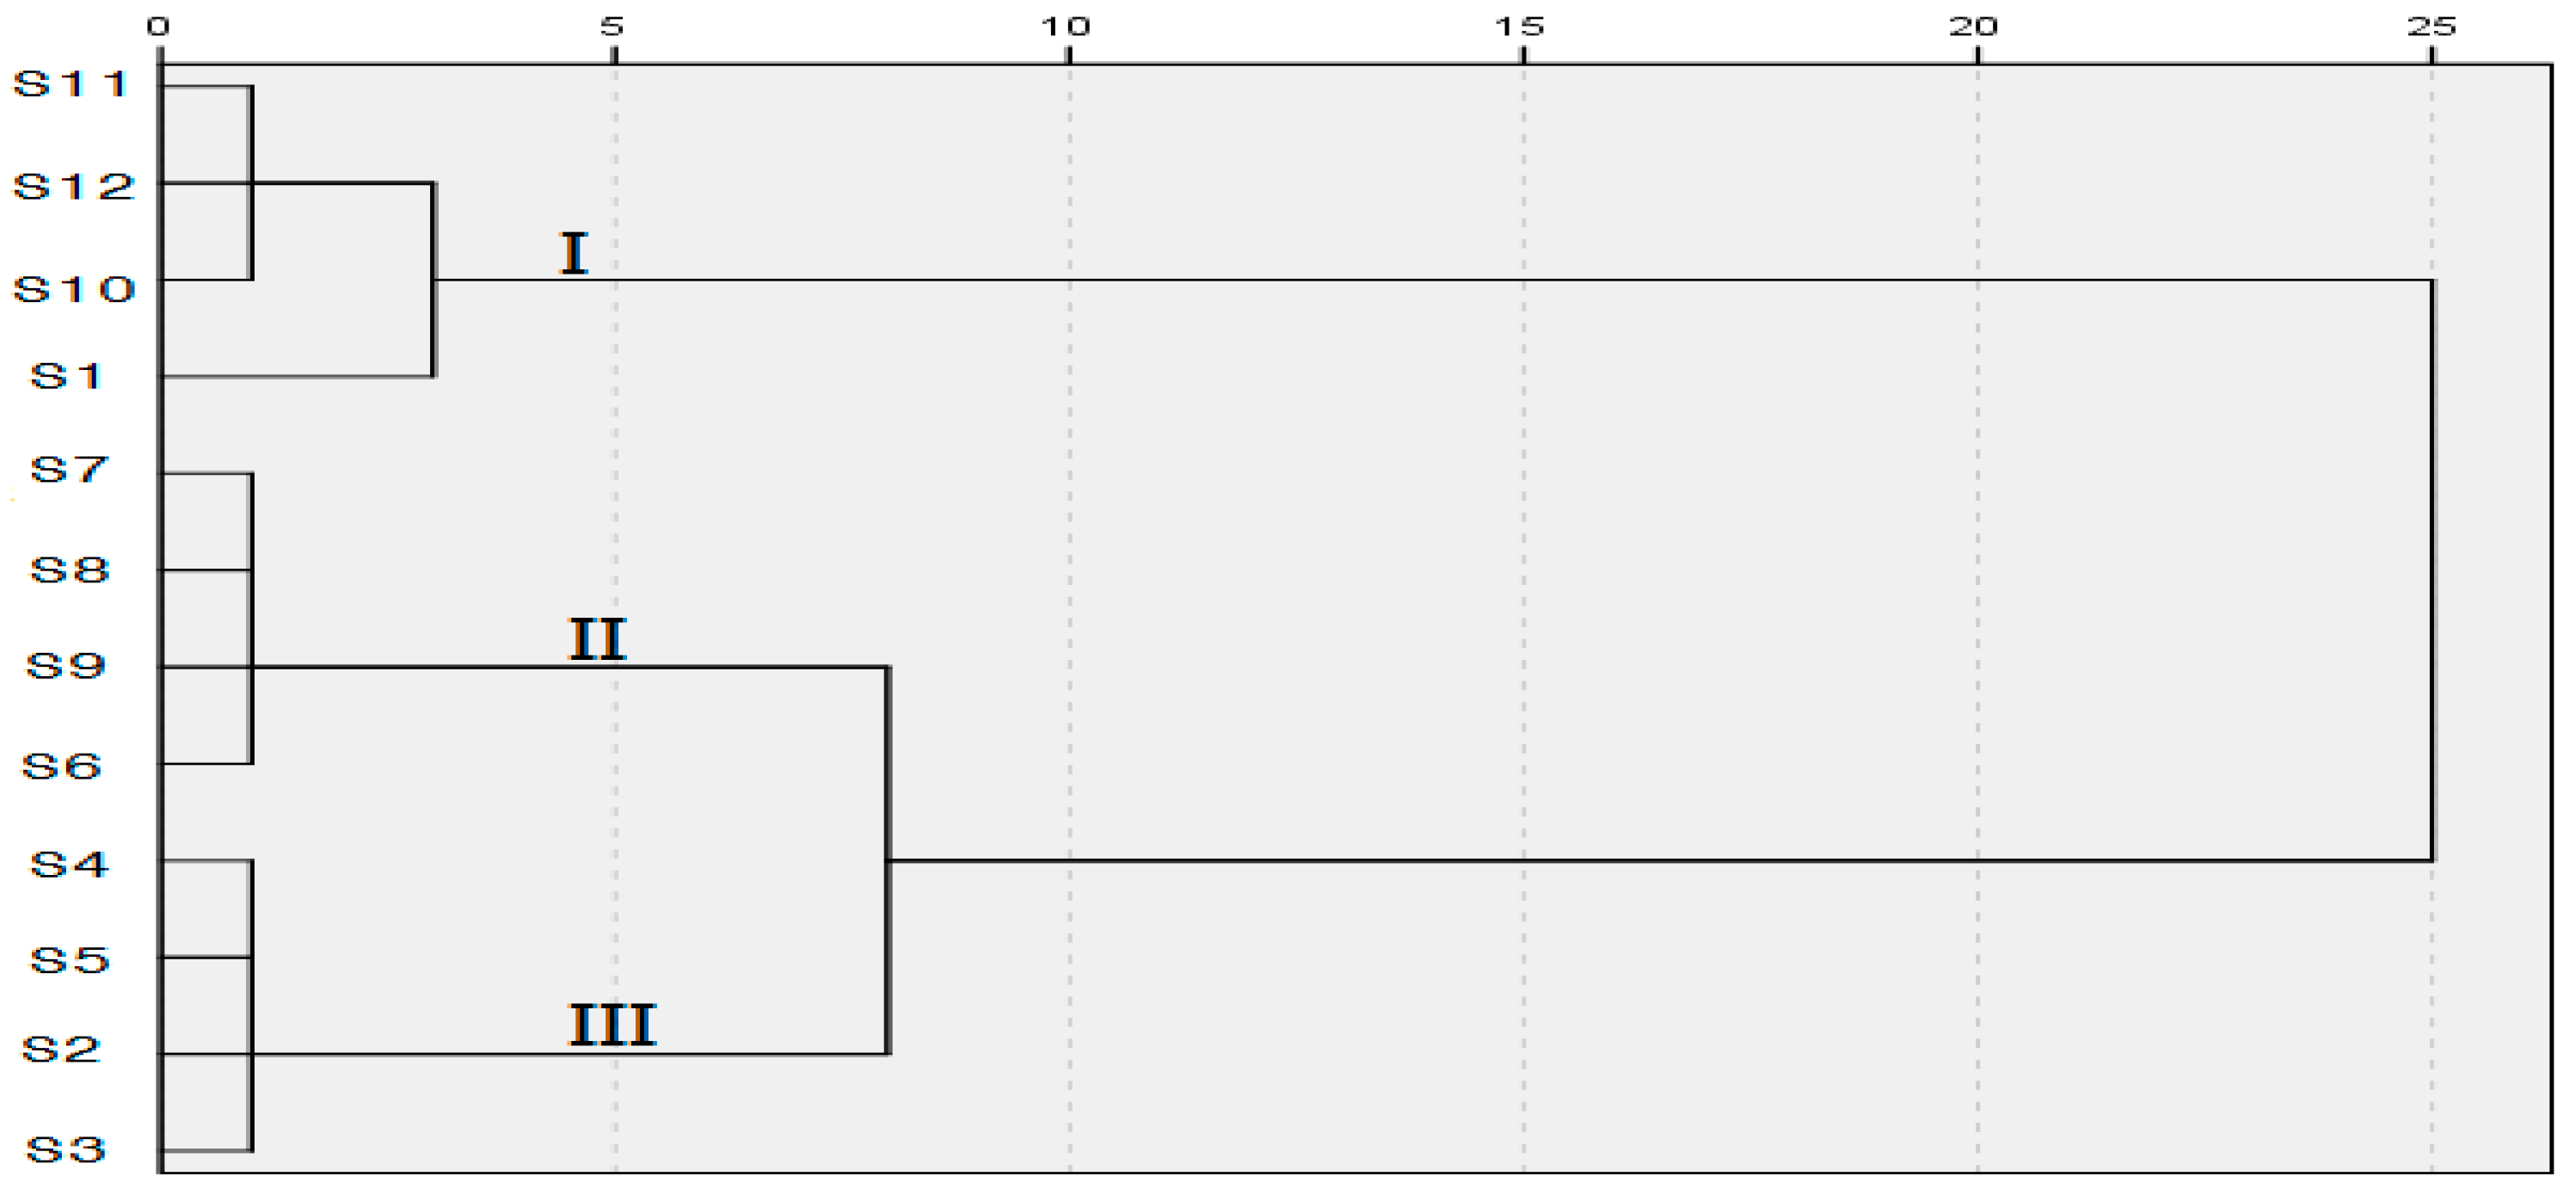
Optimization of extraction conditions was conducted using the Design Expert software (Version 8.0.6.1, Stat-Ease Inc., Minneapolis, MN, USA) for regression analysis and variance (ANOVA) analysis. All 12 samples of T. quinquecostatus were classified by PCA and HCA using SPSS 20.0 software (IBM Company, Chicago, IL, USA).

4. Conclusions

To our best knowledge, the multi-responses optimization by RSM based on the DPPH radical scavenging activity was successfully implemented to evaluate the extraction of T. quinquecostatus for the first time. The established model exhibited favorable prediction ability and the alcoholic extract has a good antioxidant activity. In the extract, phenolic acids and flavonoids were main indicator ingredients according to the result of UPLC-MS/MS. Among them, xanthomicrol is firstly characterized in this herb. Then, six major active compounds were selected to analyze 12 batch samples. They were properly sorted on the basis of the active compounds’ content by PCA and HCA, and significant differences in the twelve different samples that were collected from different regions and harvest times were found. In summary, our work provides an easy approach that could markedly promote the study of the antioxidant parts of T. quinquecostatus, and establishes an effective quality evaluation method. Moreover, it has also the emphasized the chemical difference between samples from different growth environments, therefore contributing to the prominence of quality assurance and the efficacy of the medicinal plant.

Acknowledgments

The authors gratefully acknowledge the financial support of National Natural Science Foundation of China (No. 81760769), the Agricultural Project in Shaanxi Province (No. S2014NY2608), the youthful teacher project of Beijing University of Chinese Medicine (2018-JYBZZ-JS017), the Self-selected Topic of Beijing University of Chinese Medicine (No. 2017-JYB-XS-054) and the opening topic of Beijing Union University, the National Training Program of Innovation, Entrepreneurship for Undergraduates (No. 201710026045).

Author Contributions

Y.-L.C., H.S. and G.-M.S. conceived and designed the experiments; M.S., X.L. and T.H. performed the experiments; X.-Y.R., M.S., X.-P.W. and L.W. analyzed the data; S.-S.F., X.-Y.C. and X.-H.W. contributed reagents/materials/analysis tools; Y.-L.C., H.S. and G.-M.S. wrote the paper. Authorship must be limited to those who have contributed substantially to the work reported.

Conflicts of Interest

The authors declare no conflict of interest.

References

  1. Jurca, T.; Vicas, L.; Marian, E.; Vicaş, S.; Muresan, M. A new natural antioxidant supplement-design and development. Farmacia 2016, 64, 135–142. [Google Scholar]
  2. Inagi, R. Oxidative stress in cardiovascular disease: A new avenue toward future therapeutic approaches. Recent. Pat. Cardiovasc. Drug. Discov. 2006, 1, 151–159. [Google Scholar] [CrossRef] [PubMed]
  3. Slemmer, J.E.; Shacka, J.J.; Sweeney, M.I.; Weber, J.T. Antioxidants and free radical scavengers for the treatment of stroke, traumatic brain injury and aging. Curr. Med. Chem. 2008, 15, 404–414. [Google Scholar] [PubMed]
  4. Paul, S.; Das, S.; Tanvir, E.M.; Hossen, S.; Saha, M.; Afroz, R.; Islam, A.; Hossain, S.; Gan, S.H.; Khalil, I. Protective effects of ethanolic peel and pulp extracts of Citrus macroptera fruit against isoproterenol-induced myocardial infarction in rats. Biomed. Pharmacother. 2017, 94, 256–264. [Google Scholar] [CrossRef] [PubMed]
  5. Nieto, G.; Huvaere, K.; Skibsted, L.H. Antioxidant activity of rosemary and thyme by-products and synergism with added antioxidant in a liposome system. Eur. Food. Res. Technol. 2011, 233, 11–18. [Google Scholar] [CrossRef]
  6. Mohiseni, M.; Sepidnameh, M.; Bagheri, D.; Banaee, M.; Haghi, B.N. Comparative effects of Shirazi thyme and vitamin E on some growth and plasma biochemical changes in common carp (Cyprinuscarpio) during cadmium exposure. Aquac. Res. 2017. [Google Scholar] [CrossRef]
  7. Miliauskas, G.; Venskutonis, P.R.; van Beek, T.A. Screening of radical scavenging activity of some medicinal and aromatic plant extracts. Food Chem. 2004, 85, 231–237. [Google Scholar] [CrossRef]
  8. Ortiz-Viedma, J.; Romero, N.; Puente, L.; Burgos, K.; Toro, M.; Ramirez, L.; Rodriguez, A.; Barros-Velazquez, J.; Aubourg, S.P. Antioxidant and antimicrobial effects of stevia (Stevia rebaudiana Bert.) extracts during preservation of refrigerated salmon paste. Eur. J. Lipid. Sci. Tech. 2017. [Google Scholar] [CrossRef]
  9. Lin, J.N. Production and Application of Natural and Practical Spices; China Light Industry Press: Beijing, China, 1991; ISBN 7-5019-0957-1. [Google Scholar]
  10. Mancini, E.; Senatore, F.; Monte, D.D.; Martino, L.D.; Grulova, D.; Scognamiglio, M.; Snoussi, M.; Feo, V.D. Studies on chemical composition, antimicrobial and antioxidant activities of five Thymus vulgaris L. essential oils. Molecules 2015, 20, 12016–12028. [Google Scholar] [CrossRef] [PubMed]
  11. Tohidi, B.; Rahimmalek, M.; Arzani, A. Essential oil composition, total phenolic, flavonoid contents, and antioxidant activity of Thymus species collected from different regions of Iran. Food. Chem. 2017, 220, 153–161. [Google Scholar] [CrossRef] [PubMed]
  12. Khadir, A.; Sobeh, M.; Gad, H.A.; Benbelaid, F.; Bendahou, M.; Peixoto, H.; Sporer, F.; Ashour, M.L.; Wink, M. Chemical composition and biological activity of the essential oil from Thymus lanceolatus. Z. Naturforsch. C. 2016, 71, 155–163. [Google Scholar] [CrossRef] [PubMed]
  13. The Editorial Committee of the Flora of China; Chinese Academy of Sciences. The Flora of China; Science and Technology Press: Beijing, China, 1977; ISBN 9787030271662. [Google Scholar]
  14. National Herbal Medicine Editorial Group. National Herbal Medicine Collection, 3rd ed.; People’s Medical Publishing House: Beijing, China, 1988; ISBN 9787117180351. [Google Scholar]
  15. Nie, H.H.; Qiu, Y.F.; Xing, G.Q. The anti-inflammatory effect of volatile oil of thyme. J. Taishan Med. Coll. 1993, 14, 262–265. [Google Scholar]
  16. Zhao, Q.; Ren, C.; Han, Z.M. Drinking the Thymus quinquecostatus Celak and Fu tea for the treatment of cattle enteritis. Anim. Husb. Vet. Med. 2001, 30, 44–45. [Google Scholar]
  17. Tschiggerl, C.; Bucar, F. Influence of saponin plants on the volatile fraction of thyme in herbal teas. Fitoterapia 2011, 82, 903–910. [Google Scholar] [CrossRef] [PubMed]
  18. Li, J. Study on the Effects of Using Properties of Forsythia Suspensa and Thymus in Chinese-Style Sausage. Master’s Thesis, Shaanxi Normal University, Xi’an, China, 2006. [Google Scholar]
  19. Wang, Z.S. Comprehensive Research advances on Thymus mongolicus. Mod. Agric. Sci. Technol. 2016, 672, 63–66. [Google Scholar]
  20. Zhang, Y.X.; Shang, Z.J. Jia You Ben Cao Series of Copy; TCM Ancient Books Publishing House: Beijing, China, 2009; ISBN 9787801745903. [Google Scholar]
  21. Zhidan County Zhifang Commune Health Station. The preliminary observation of acute gastroenteritis and chronic stomachache treated by Thymus quinquecostatus Celak. Shaanxi Med. J. 1972, 5, 49–50. [Google Scholar]
  22. Hyun, T.K.; Kim, H.; Kim, J. Antioxidant and antidiabetic activity of Thymus quinquecostatus Celak. Ind. Crop Prod. 2014, 52, 611–616. [Google Scholar] [CrossRef]
  23. Sun, Z.X.; Sun, J.H.; Cheng, S.; Ma, Q.W.; Guo, S.L.; Zhang, J.B. The antitumor effects and the influence on immunity function in mice of the extraction of Thymus quinquecostatus Celak. J. Beijing Univ. Chin. Med. 2003, 1, 209–210. [Google Scholar]
  24. Sun, Z.X.; Zhang, H.Y.; Cheng, S.; Ma, Q.W.; Guo, S.L.; Zhang, J.B. Anti-tumor effect of ethanol extracts of Thymus quinquecostatus Celak on human leukemia cell line. J. Chin. Integr. Med. 2005, 3, 382–385. [Google Scholar] [CrossRef]
  25. Yan, C.; Chen, X.Y.; Sui, H.; Yu, X.T.; Wang, Y.; Bai, S.J.; Zhao, Y.C.; Shi, R.B.; She, G.M. Antioxidant activities and chemical compositions of Thymus quinquecostatus Celak. J. Beijing Univ. Trad. Chin. Med. 2016, 39, 383–389. [Google Scholar]
  26. Cheng, S.; Ma, Q.W.; Sun, Z.X.; Dai, G.Z. The extract of Thymuson scavenging activities to free radicals in vitro. Sci. Technol. Food. Ind. 2004, 25, 53–55. [Google Scholar]
  27. Liao, K.T.; Su, M.; Huang, S.S.; Chih, C.L.; Tsai, S.K. Honokiol Ameliorates Cerebral Infarction from Ischemia-Reperfusion Injury in Rats. Planta Med. 2003, 69, 130–134. [Google Scholar] [CrossRef] [PubMed]
  28. Akhtar, M.; Maikiyo, A.M.; Najmi, A.K.; Khanam, R.; Mujeeb, M.; Aqil, M. Neuroprotective effects of chloroform and petroleum ether extracts of Nigella sativa seeds in stroke model of rat. J. Pharm. Bioallied Allied Sci. 2013, 5, 119–125. [Google Scholar] [CrossRef] [PubMed]
  29. Guo, H.; Hu, L.M.; Wang, S.X.; Wang, Y.L.; Shi, F.; Li, H.; Liu, Y.; Kang, L.Y.; Gao, X.M. Neuroprotective Effects of Scutellarin against Hypoxic-Ischemic-Induced Cerebral Injury via Augmentation of Antioxidant Defense Capacity. Chin. J. Physiol. 2011, 54, 399–405. [Google Scholar] [PubMed]
  30. Mou, Q.Q.; He, J.X.; Yin, R.L.; Yang, B.; Fu, M.H.; Fang, J.; Li, H. Response surface optimized infrared-assisted extraction and UHPLC determination of flavonoid types from Flos Sophorae. Molecules 2017, 22, E1000. [Google Scholar] [CrossRef] [PubMed]
  31. Huang, W.; Xue, A.; Niu, H.; Jia, Z.; Wang, J. Optimized ultrasonic-assisted extraction of flavonoids from Folium eucommiae and evaluation of antioxidant activity in multi-test systems in vitro. Food Chem. 2009, 114, 1147–1154. [Google Scholar] [CrossRef]
  32. Li, J.H.; Zeng, R.; Qu, Y.; Huang, L.F. Rapid identification on chemical constituents in roots of Paeonia delavayi var. lutea by UPLC-Q-TOF-MSE combined with UNIFI informatics platform. Chin. Tradit. Herbal. Drug. 2017, 8, 1529–1536. [Google Scholar]
  33. Zhang, Y.; Ma, H.L.; Mai, X.; Wang, H.L. Identification of components and metabolites of Mentha haplocalyx in rats plasma by UHPLC-Q-TOF-MS/MS. Chin. Tradit. Herbal. Drug. 2017, 19, 3927–3934. [Google Scholar]
  34. Chi, M.Y.; Xiang, W.Y.; Yang, W.; Sun, J.; Liao, S.G.; Li, Y.J.; Huang, Y. Analysis on Metabolites of Polygonum capitatum Extract in R at Urine by UPLC-Q-TOF/MS. Chin. J. Exp. Tradit. Med. Form. 2016, 17, 77–80. [Google Scholar]
  35. Wei, W.F.; Chen, H.C.; Liu, Y.; Ren, X.L.; Wang, W.M. Preliminary study on serum pharmacochemistry of leaves of acanthopanax senticosus based on UPLC-Q-TOF-MS. Chin. Tradit. Herbal. Drug. 2017, 7, 1306–1313. [Google Scholar]
  36. Zhou, Y.N.; Zhao, L.; Zheng, L.; Lv, L. Rapid identification of chemical constituents in Salvia chinensis Benth. by HPLC-TOF-MS. Chin. J. Chin. Mater. Med. 2013, 23, 4109–4112. [Google Scholar]
  37. Huang, H.; Ji, L.X.; Song, S.Y.; Wang, J.; Wei, N.; Jiang, M.; Bai, G.; Luo, G.A. Identification of the Major Constituents in Xuebijing Injection by HPLC-ESI-MS. Phytochem. Anal. 2011, 22, 330–338. [Google Scholar] [CrossRef] [PubMed]
  38. Kou, X.L.; Yang, D.H.; Su, Y.Y.; Liu, F. ESI-MS/MS Analysis of salvianolic acid A and salvianolic acid B from Salvia miltiorrhiza. Mod. Chin. Med. 2015, 10, 1026–1029. [Google Scholar]
  39. Wang, Y.; Li, X.B.; Li, J.J.; Xiong, H.Y.; Peng, C.S. Fragmentation pathway comparison of 5,6,7,4′-tetrahydroxy-flavone and 5,6,7,4′-tetramethoxy-flavone by high resolution electrospray ionization tandem mass spectroscopy. J. Chin. Mass. Spectrom. Soc. 2016, 5, 385–392. [Google Scholar]
  40. Li, K.; Song, J.; Zhao, Q.; Wang, B.; Zhang, Y.; Wang, X.; Tang, T.; Li, S. Effective component of Salvia miltiorrhiza in promoting cardiomyogenic differentiation of human placenta-derived mesenchymal stem cells. Int. J. Mol. Med. 2018, 2, 962–968. [Google Scholar]
  41. Hao, Y.Z. Protective Effect and Mechanism of Ligustrazine—Vanillic Acid on Experimental Cerebral Ischemia. Master’s Thesis, Beijing University of Chinese Medicine, Beijing, China, 2011. [Google Scholar]
  42. Liu, M.; Xia, X.H.; Zhang, Z.M.; Wu, Z.J.; Pan, S.Y. Comparative study on antioxidant activity of danshensu, protocatechuic aldehyde, caffeic acid and salvianolic acid B in vitro. J. Chin. Med. Mater. [CrossRef]
  43. Zhou, L. The research of cardiovascular pharmacological and clinical of breviscapine. Chin. J. Inf. Tradit. Chin. Med. 2013, 30, 134–136. [Google Scholar]
  44. Zhang, N.; Su, J.; Jin, L.; Zou, H.; Zhang, C. The research situation of cardiovascular function mechanism of tanshinol. J. Pharm. Pract. 2009, 27, 404–406. [Google Scholar]
  45. Bro, R.A.; Smilde, K. Principal component analysis. Anal. Methods 2014, 6, 2812–2831. [Google Scholar] [CrossRef]
  46. Da Silva Torres, E.A.F.; Garbelotti, M.L.; Moita Neto, J.M. The application of hierarchical clusters analysis to the study of the composition of foods. Food Chem. 2006, 99, 622–629. [Google Scholar] [CrossRef]
  47. Sharfifar, F.; Moshafi, M.H.; Mansouri, S.H.; Khodashenas, M.; Khoshnoodi, M. In vitro evaluation of antibacterial and antioxidant activities of the essential oil and methanol extract of endemic Zataria multiflora Boiss. Food Control. 2007, 18, 800–805. [Google Scholar] [CrossRef]
Sample Availability: Samples of the compounds are not available from the authors.
Figure 1. Contour plots and response surface showing the effects of the three factors on 2,2-Diphenyl-1-picrylhydrazyl (DPPH) responses of T. quinquecostatus extract. (a) ethanol concentration and liquid mass ratio; (b) extraction time and liquid mass ratio; and, (c) extraction time and ethanol concentration.
Molecules 23 00957 g001
Figure 2. TIC chromatograms of T. quinquecostatus ethanol extract. (a) TIC chromatogramin negative ion mode; and, (b) TIC chromatogram in positive ion mode.
Molecules 23 00957 g002
Figure 3. Cleavage at C ring of flavone.
Molecules 23 00957 g003
Figure 4. The HPLC fingerprints for alcohol extract of T. quinquecostatus.
Molecules 23 00957 g004
Figure 5. PC1–PC2 scores plot for the 12 tested samples of T. quinquecostatus by principal components analysis (PCA).
Molecules 23 00957 g005
Figure 6. Dendrogram of hierarchical clustering analysis (HCA) for the 12 tested samples of T. quinquecostatus.
Molecules 23 00957 g006
Table 1. The factors and response values of response surface method.
No.X1/mL·g−1X2/%X3/hY (IC50 (μg/mL))
1101218.55
2000205.04
3000205.09
4000208.40
501−1338.87
60−1−1382.21
70−11257.91
8−1−10208.50
9000202.47
101−10312.52
11000204.07
12110321.01
13−10−1197.13
14011473.46
15−110372.92
16−101216.58
1710−1231.38
Table 2. The ANOVO analysis of DPPH free radical scavenging rate by response surface method.
SourceQuadratic SumDegree of FreedomMean Sum of SquareF Valuep Value
model111,000912,330.941655.45<0.0001
X1975.271975.27130.93<0.0001
X214,888.48114,888.481998.80<0.0001
X335.74135.744.800.0646
X1X26078.5416078.54816.05<0.0001
X1X3260.501260.5034.970.0006
X2X316,756.01116,756.012249.52<0.0001
X122473.9112473.91332.13<0.0001
X2263,662.73163,662.738546.83<0.0001
X325197.9115197.91697.83<0.0001
residual52.1479.94--
lack of fit33.31311.102.360.2128
pure error18.8349.07--
Total111,00016---
“-” not detected.
Table 3. Summary of chemical constituents identified in T. quinquecostatus alcoholic extract responding to Figure 3a.
Peak NO.Retention Time (min)Formula EmpiricalMWPrecurser Ions [M − H]FragmentationTentative Structural Elucidation
13.49C9H10O3166.17165.0395165.0395, 147.0298, 129.0191Paeonol
26.88C16H12O7316.26315.0700297.0604, 246.9443, 153.0193, 135.0450Isorhamnetin
37.15C9H10O5198.17197.0441179.0347, 153.0552, 135.0447Danshensu
47.33C8H8O4168.15167.0338149.0239, 123.0449Vanillic acid
57.87C7H5O4154.12153.0182135.0447, 109.0293, 91.07836Gentisic acid or Protocatechuic acid
68.00C16H18O9354.31353.0844191.0561, 173.0456, 161.0241, 135.0450Chlorogenic acid
78.26C20H20O8388.37387.1634225.1128, 207.1027, 179.0557, 163.1128Desmethylnobiletin
88.42C21H20O10432.38431.1884385.1869, 341.1600, 311.0554, 279.0715, 223.1341Apigenin-7-O-glucoside
98.61C22H21O10478.40477.0628459.0562, 415.0665, 397.0566, 373.0568, 343.0461, 301.0355Isorhamnetin-3-O-glucoside
108.67C21H20O11448.38447.0887357.0616, 327.0513, 285.0406Galuteolin
118.92C7H5O3138.12137.023593.0343Hydroxybenzoic acid
129.02C9H8O4180.16179.0336135.0450Caffeic acid
139.26C21H18O12462.36461.0702327.0508, 285.0405Scutellarin
149.84C21H18O11446.36445.0749269.0454, 240.9279, 175.0248Apigenin-7-O-glucuronide
1510.21C26H22O10494.45493.1100449.1244, 383.0775, 359.0776, 313.0723, 295.0620Salvianolic acid A
1610.35C18H16O8360.31359.0750341.0663, 315.0870, 197.0458, 179.0353, 161.0247,Rosmarinic acid
1710.61C26H20O10492.43491.0946311.0568, 295.0614, 267.0664, 223.0249, 179.0351Salvianolic acid C
1811.07C15H12O6288.25287.0540269.0448, 259.0608, 243.0660, 151.0033Eridioctyol
1911.45C15H10O6286.24285.0386257.0459, 241.0497, 133.0269Luteolin
2011.84C18H16O6328.32327.2159309.2064, 291.1958, 165.0920Salvigenin
2112.30C17H14O7330329.0644314.0432, 229.1438, 211.1333Thymusin
2212.40C11H12O4208.21207.0651179.0346, 161.0240, 135.0449Ethyl caffeate
2312.57C15H10O5270.24269.0450225.0551, 149.0241, 121.0293Apigenin
2412.71C16H12O6300.26299.0540284.0326, 271.0421, 137.0270Sorbifolin
2514.97C17H14O6314.289313.0696298.0483, 283.0241, 245.0448Ladanein or Cirsimaritin
26 or 2716.62C18H16O7344.32343.0803328.0591, 313.0349Cirsilineol or Xanthomicrol
Table 4. Summary of chemical constituents identified in T. quinquecostatus alcoholic extract responding to Figure 3b.
Peak NO.Retention Time (min)Molecular FormulaMWPrecurser Ions [M + H]+FragmentationTentative Structural Elucidation
286.31C15H12O5272.25272.9965254.9872, 245.0031, 229.0079, 210.9974, 198.9973, 185.0181, 118.9713Naringenin
298.11C27H30O15594.52595.1621577.1669, 559.1462, 541.1353, 529.1353, 511.1248, 475.1426, 457.1143Luteolin-O-rutinoside
98.81C22H22O12478.406479.0795317.0836, 303.0502Isorhamnetin-O-glucoside
139.33C21H18O12462.36463.0854287.0551, 251.1245Scutellarin
309.62C16H12O6300.26301.0693286.0468, 273.0385, 242.0498, 227.0236, 167.7154Sorbifolin
69.80C16H18O9354.31355.1710337.1066, 203.0522, 193.1195Chlorogenic acid
89.93C21H18O11446.36447.0904429.0816, 271.0603Apigenin-7-O-glucuronide
3110.15C27H30O14578.52579.1078517.1119, 471.1556, 399.0691, 381.0586, 337.0686, 319.0580Apigenin-7-O-rutinoside
3210.25C20H20O5340.375341.0640323.0548, 297.0756, 279.0649, 187.0387Prenylnaringenin
1210.38C9H8O4180.16181.0492163.0388Caffeic acid
3310.83C21H22O10434.39435.1234391.1365, 373.1256, 349.1255, 271.0421, 227.0523Naringenin-7-O-glucoside
1911.44C15H10O6286.24287.0532153.0182, 137.8446Luteolin or Scutellarein
2112.18C17H14O7330331.0792316.0573, 298.0466, 255.0646, 213.0387Thymusin
2212.28C15H10O5270.24271.0584135.0026Apigenin
214.35C16H12O7316.26317.1001275.0909, 197.0441, 147.0437, 125.0232,Isorhamnetin
2514.41C17H14O6314.289315.0845300.0626, 282.0520, 196.0326, 175.6378, 154.7404Ladanein or Cirsimaritin
3414.83C19H18O8374.345375.1054360.0840, 345.0603,213.0390, 165.0342Methyl rosmarinate
2615.99C18H16O7344.319345.0952330.0732, 312.0626, 297.0390, 227.0547, 212.8993Xanthomicrol
2716.76C18H16O7344.319345.0953330.0733, 315.0498, 149.0233, 135.0439Cirsilineol
718.98C20H20O8388.372389.1206374.0994, 359.0758, 341.0652, 328.0936, 227.0544Desmethylnobiletin
2019.35C18H16O6328.32329.1000314.0782, 301.1792, 287.1273, 269.1168, 163.0750, 135.0803Salvigenin
3520.08C19H18O7358.346359.1108344.0889, 329.0654, 311.0547, 227.0548, 182.2784Gardenin B
Table 5. Linear regression data, precision, repeatability, stability, and accuracy of the six compounds.
AnalyteRegression EquationR2Linear Range (μg/mL)Precision (RSD, %, n = 6)Repeatability (RSD, %, n = 6)Stability (RSD, %, n = 6)Recovery (%, n = 9)
Intra-Day (n = 6)Inter-Day (n = 3)MeanRSD
danshensu (1)y = 1126x + 724.50.99904.68–150.01.821.291.491.2899.980.75
vanillic acid (2)y = 29710x − 1791.20.99980.40–12.91.281.961.841.9599.721.49
chlorogenic acid (3)y = 21533x − 764850.99956.25–100.01.671.111.841.2198.340.91
galuteolin (4)y = 13898x − 57710.99901.25–20.01.530.491.921.85100.841.24
scutellarin (5)y = 17290x − 630630.99996.25–200.01.610.211.971.2598.940.67
apigenin (6)y = 30618x − 53120.99990.625–20.01.881.701.561.60101.671.30
R2: correlation coefficient; y: peak area; x: concentration (μg/mL).
Table 6. Contents of the six compounds in the 12 samples.
SampleContent of Each Compound (mg/g)
No.HabitatHarvest TimeDanshensuVanillic AcidChlorogenic AcidGaluteolinScutellarinApigenin
S1qingyang7.111.8000.0720.4500.1523.6500.034
S27.155.7500.0270.4500.0951.6500.019
S38.14.3800.0180.8500.0623.3100.013
S48.155.6000.0410.7000.0502.5200.029
S59.15.5500.0361.0500.0522.0500.037
S6jingbian8.12.6500.0150.3300.0730.6300.036
S78.150.8400.0161.2100.0650.4900.019
S89.11.2300.0070.5500.0190.5800.017
S99.151.6700.0071.3000.0641.2700.016
S10yanchi67.0350.0751.181-4.472-
S1179.0210.0561.034-3.612-
S1289.3860.0661.179-4.057-
“-” not detected.
Table 7. The factors and levels of response surface method.
FactorsLevel
−101
X1/mL·g−11522.530
X2/%050100
X3/h11.52

