Enhanced Enzymatic Hydrolysis and Structural Features of Corn Stover by NaOH and Ozone Combined Pretreatment


Abstract
:1. Introduction
2. Materials and Methods
2.1. Materials and Sample Preparation
2.2. Methods
2.2.1. NaOH Treatment
2.2.2. Ozone Treatment
2.2.3. Combined Sodium Hydroxide and Ozone Pretreatment
2.2.4. Enzymatic Hydrolysis
2.2.5. Determination of the Composition Content of the Corn Stover Samples
2.3. Structural Analysis
2.3.1. Scanning Electron Microscope (SEM) Analysis
2.3.2. X-ray Diffraction (XRD) Analysis
2.3.3. Fourier Transform Infrared Spectroscopy (FTIR) Analysis
2.3.4. Cross-Polarization Magic Angle Spinning Carbon-13 Nuclear Magnetic Resonance (CP/MAS 13C-NMR) Analysis
3. Results and Discussion
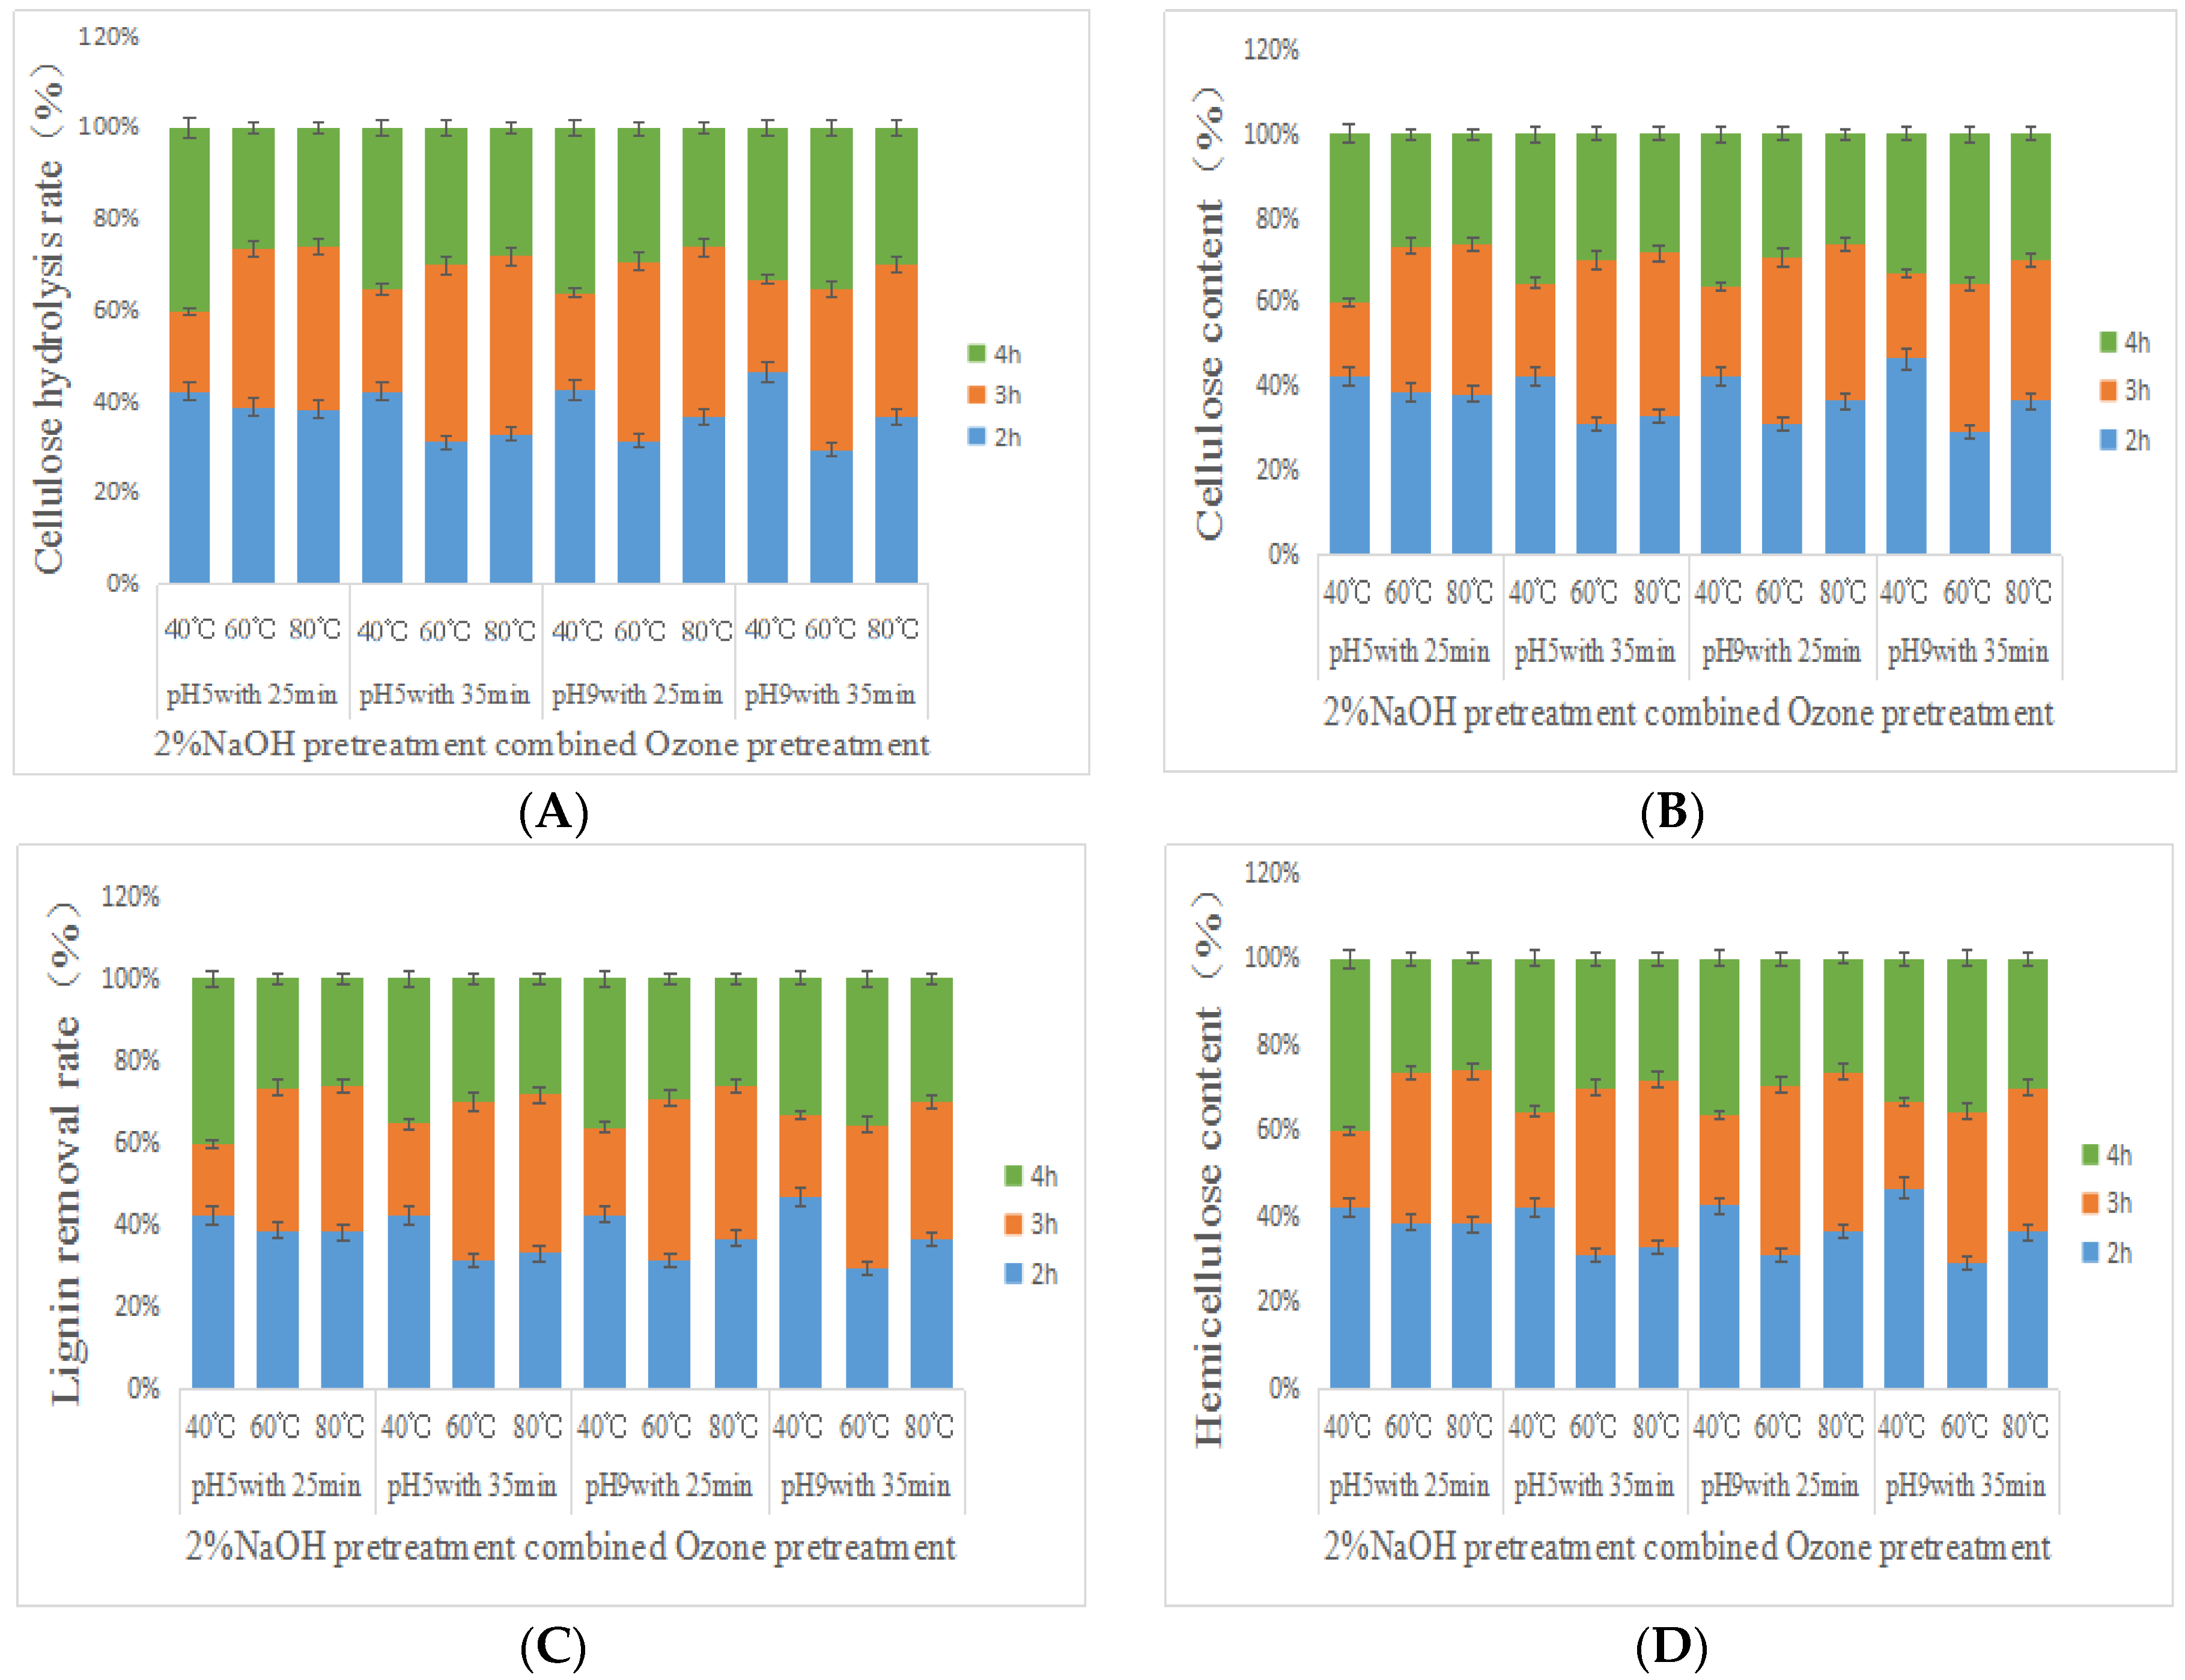
3.1. Enzymatic Hydrolysis and Composition of Pretreated Corn Stover
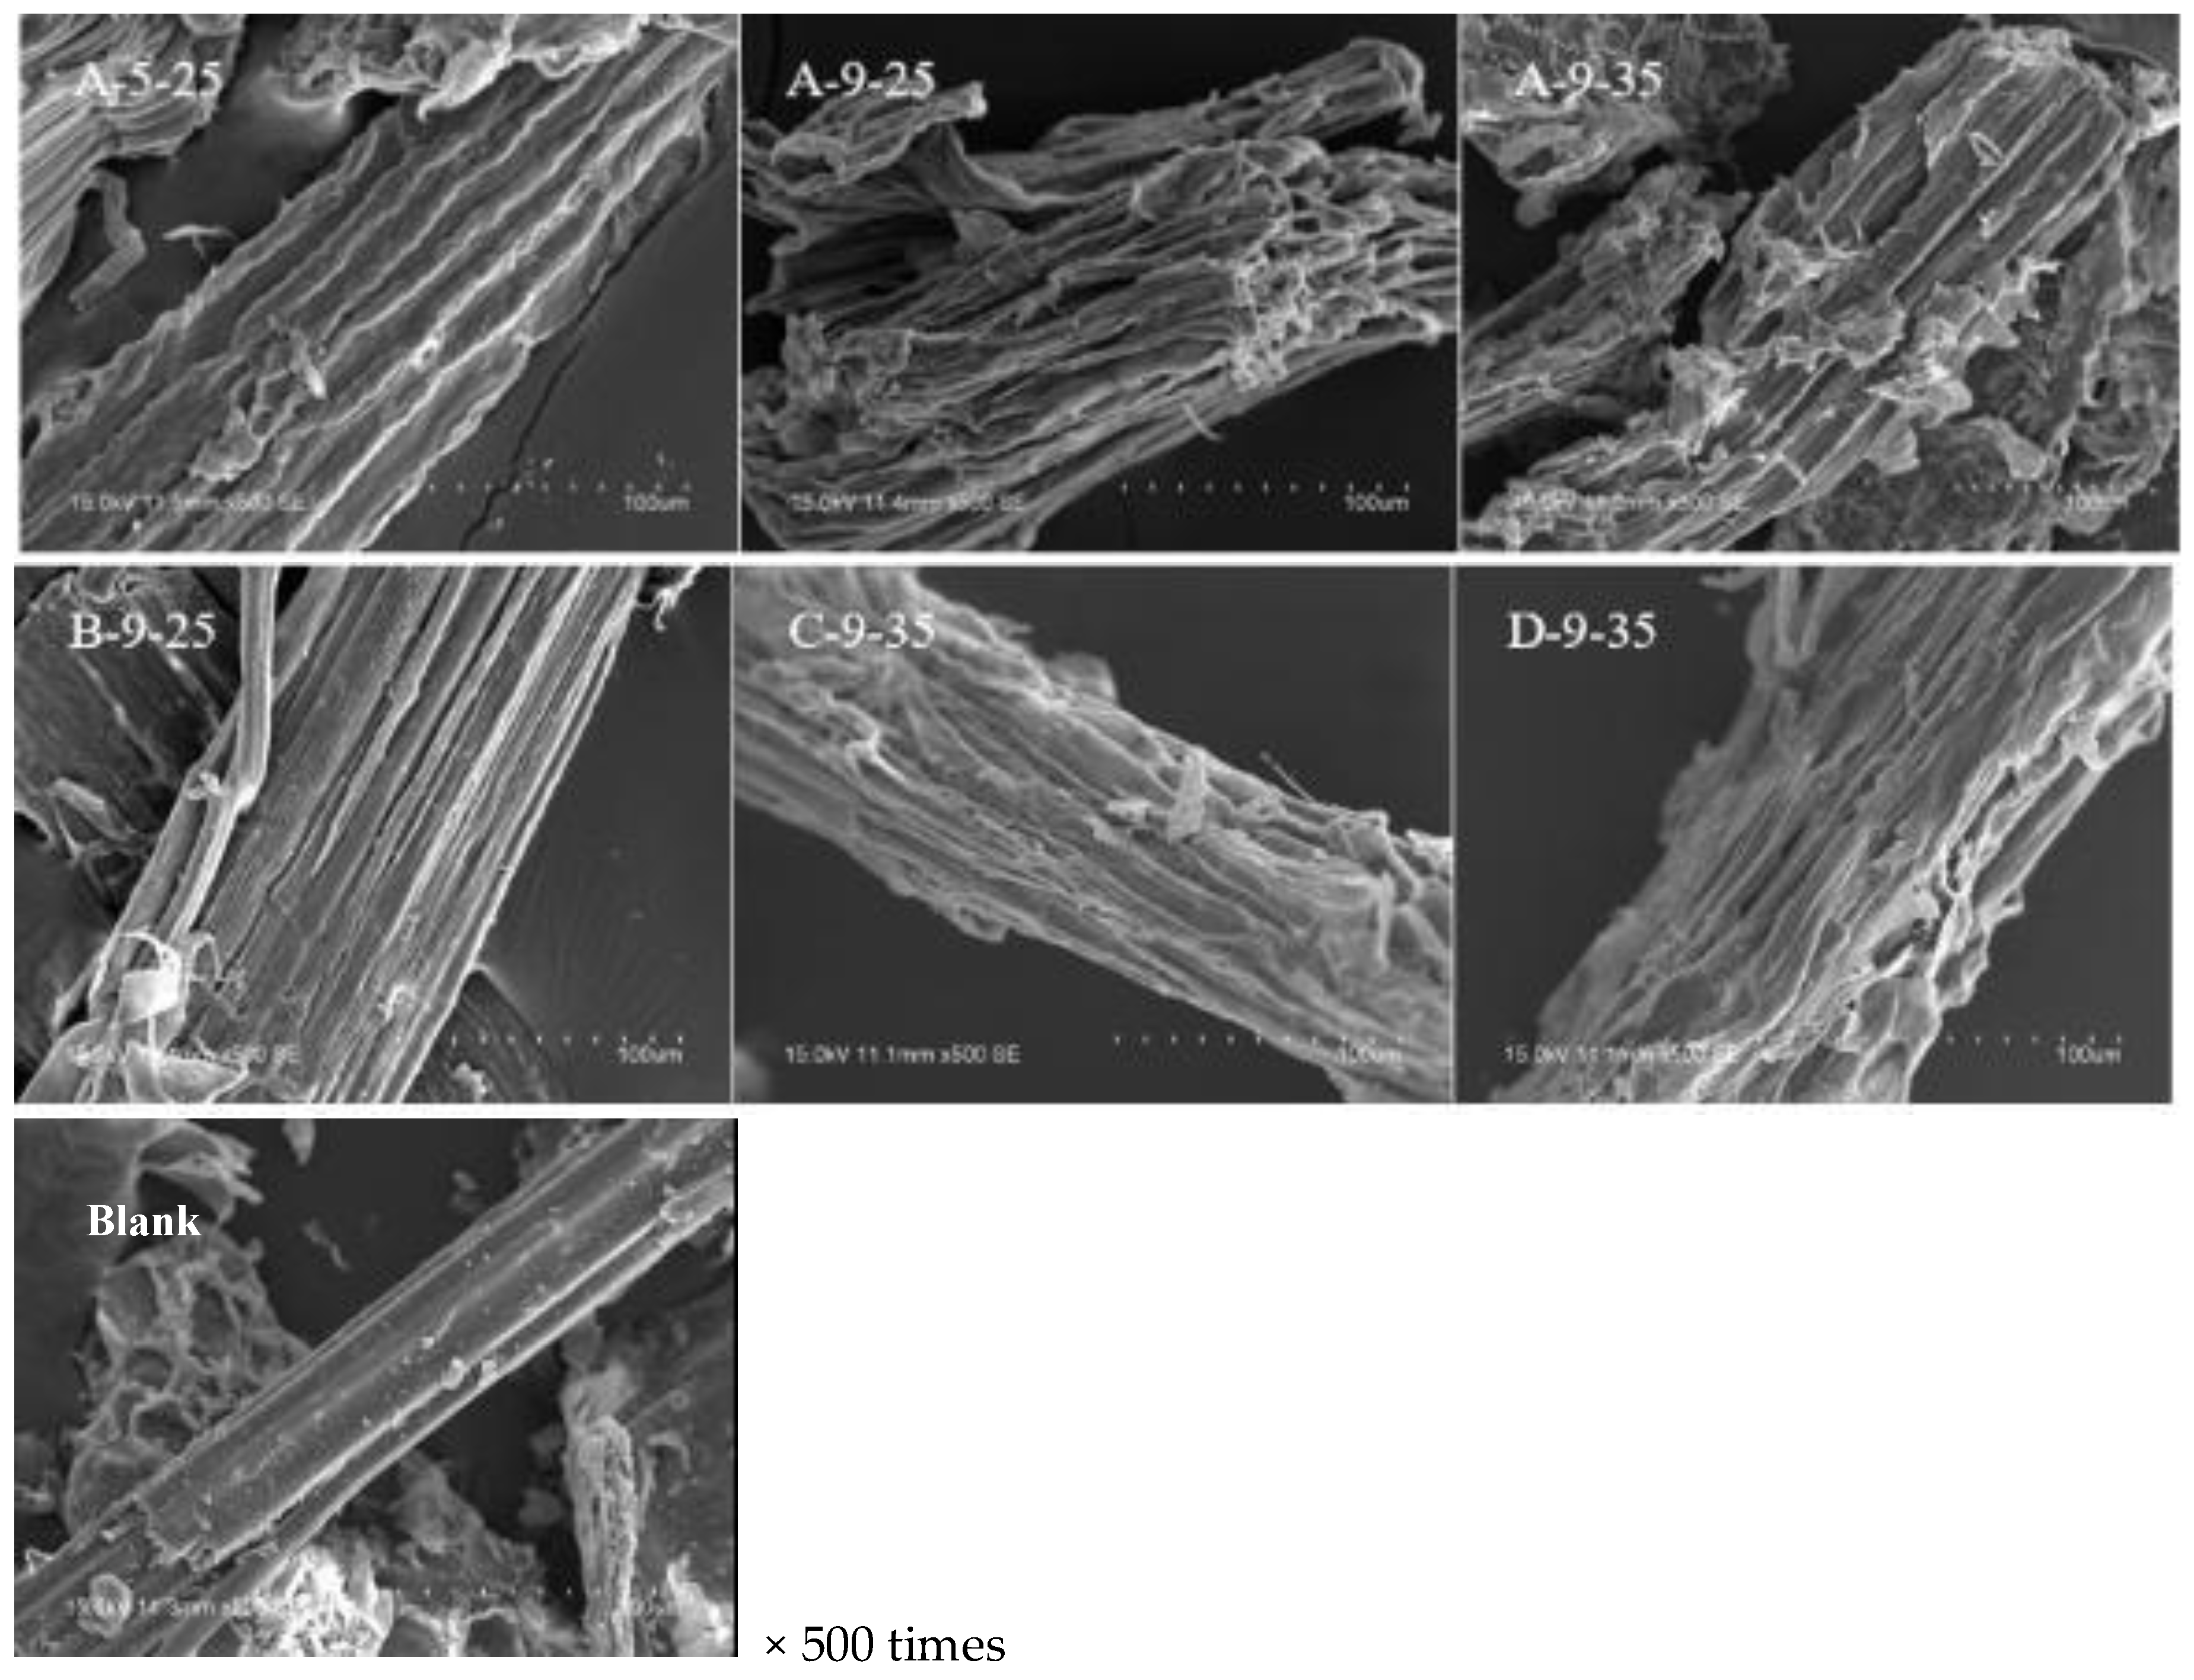
3.2. SEM Analysis
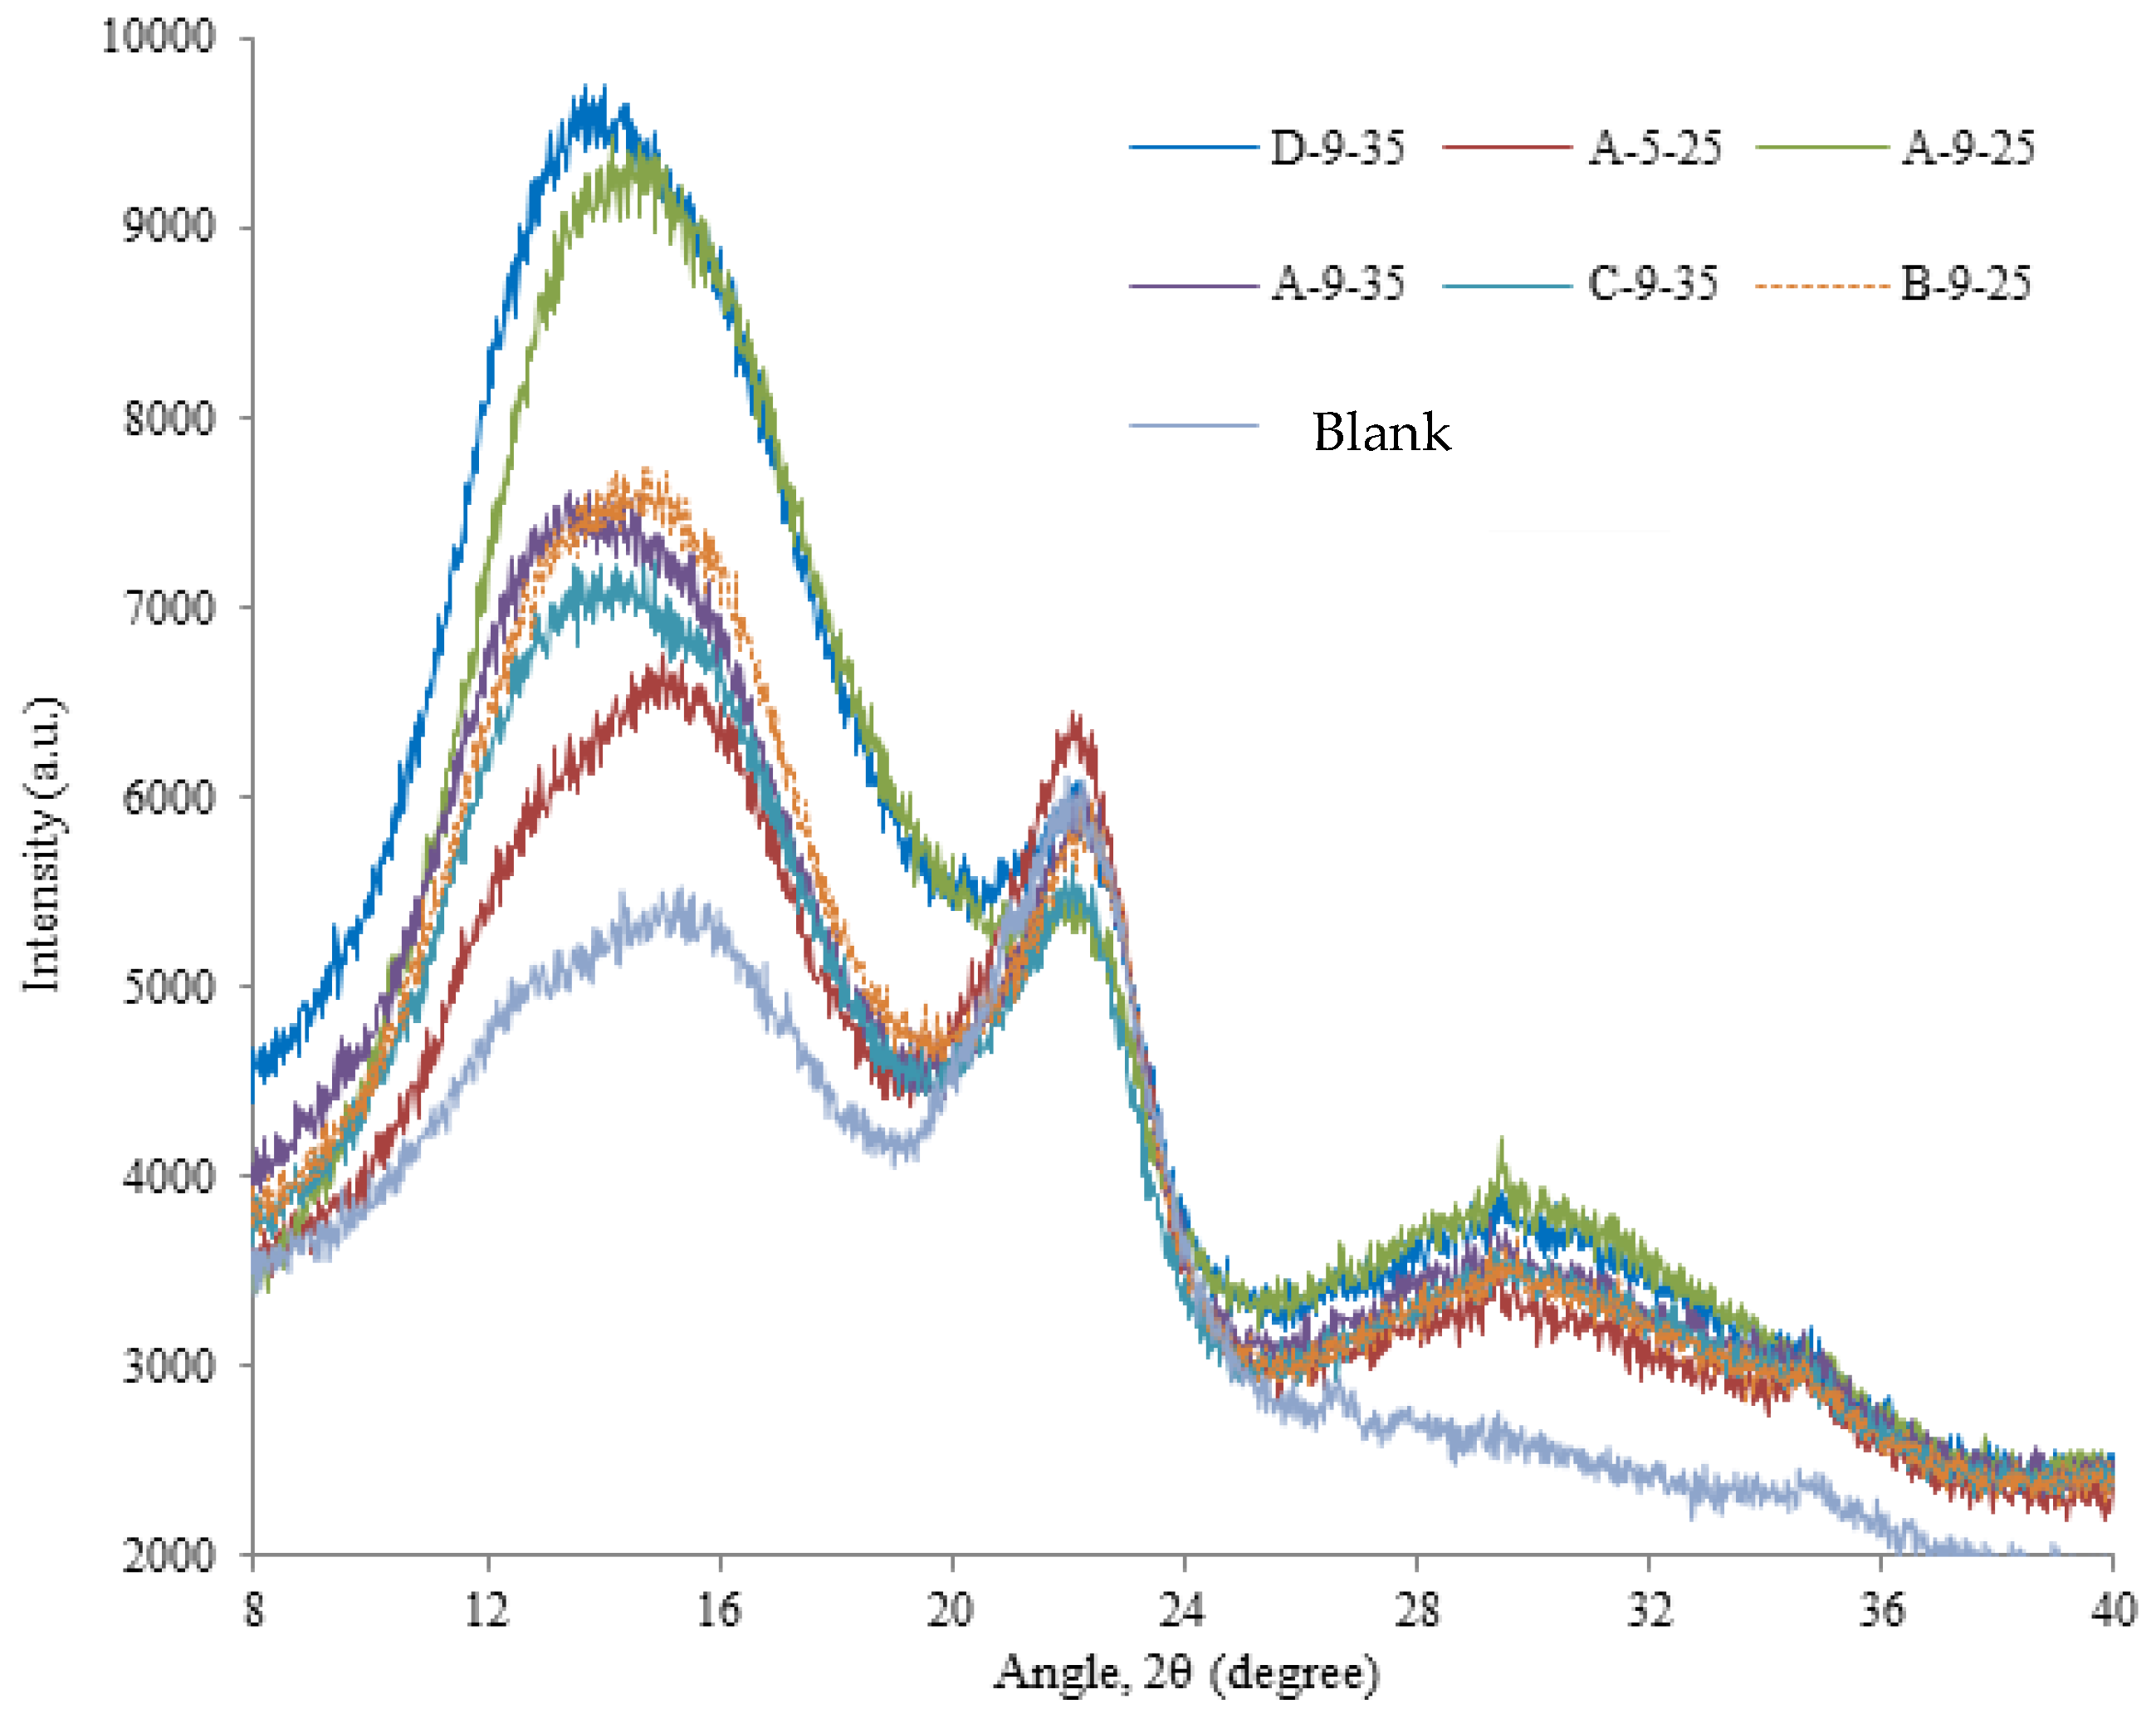
3.3. XRD Analysis
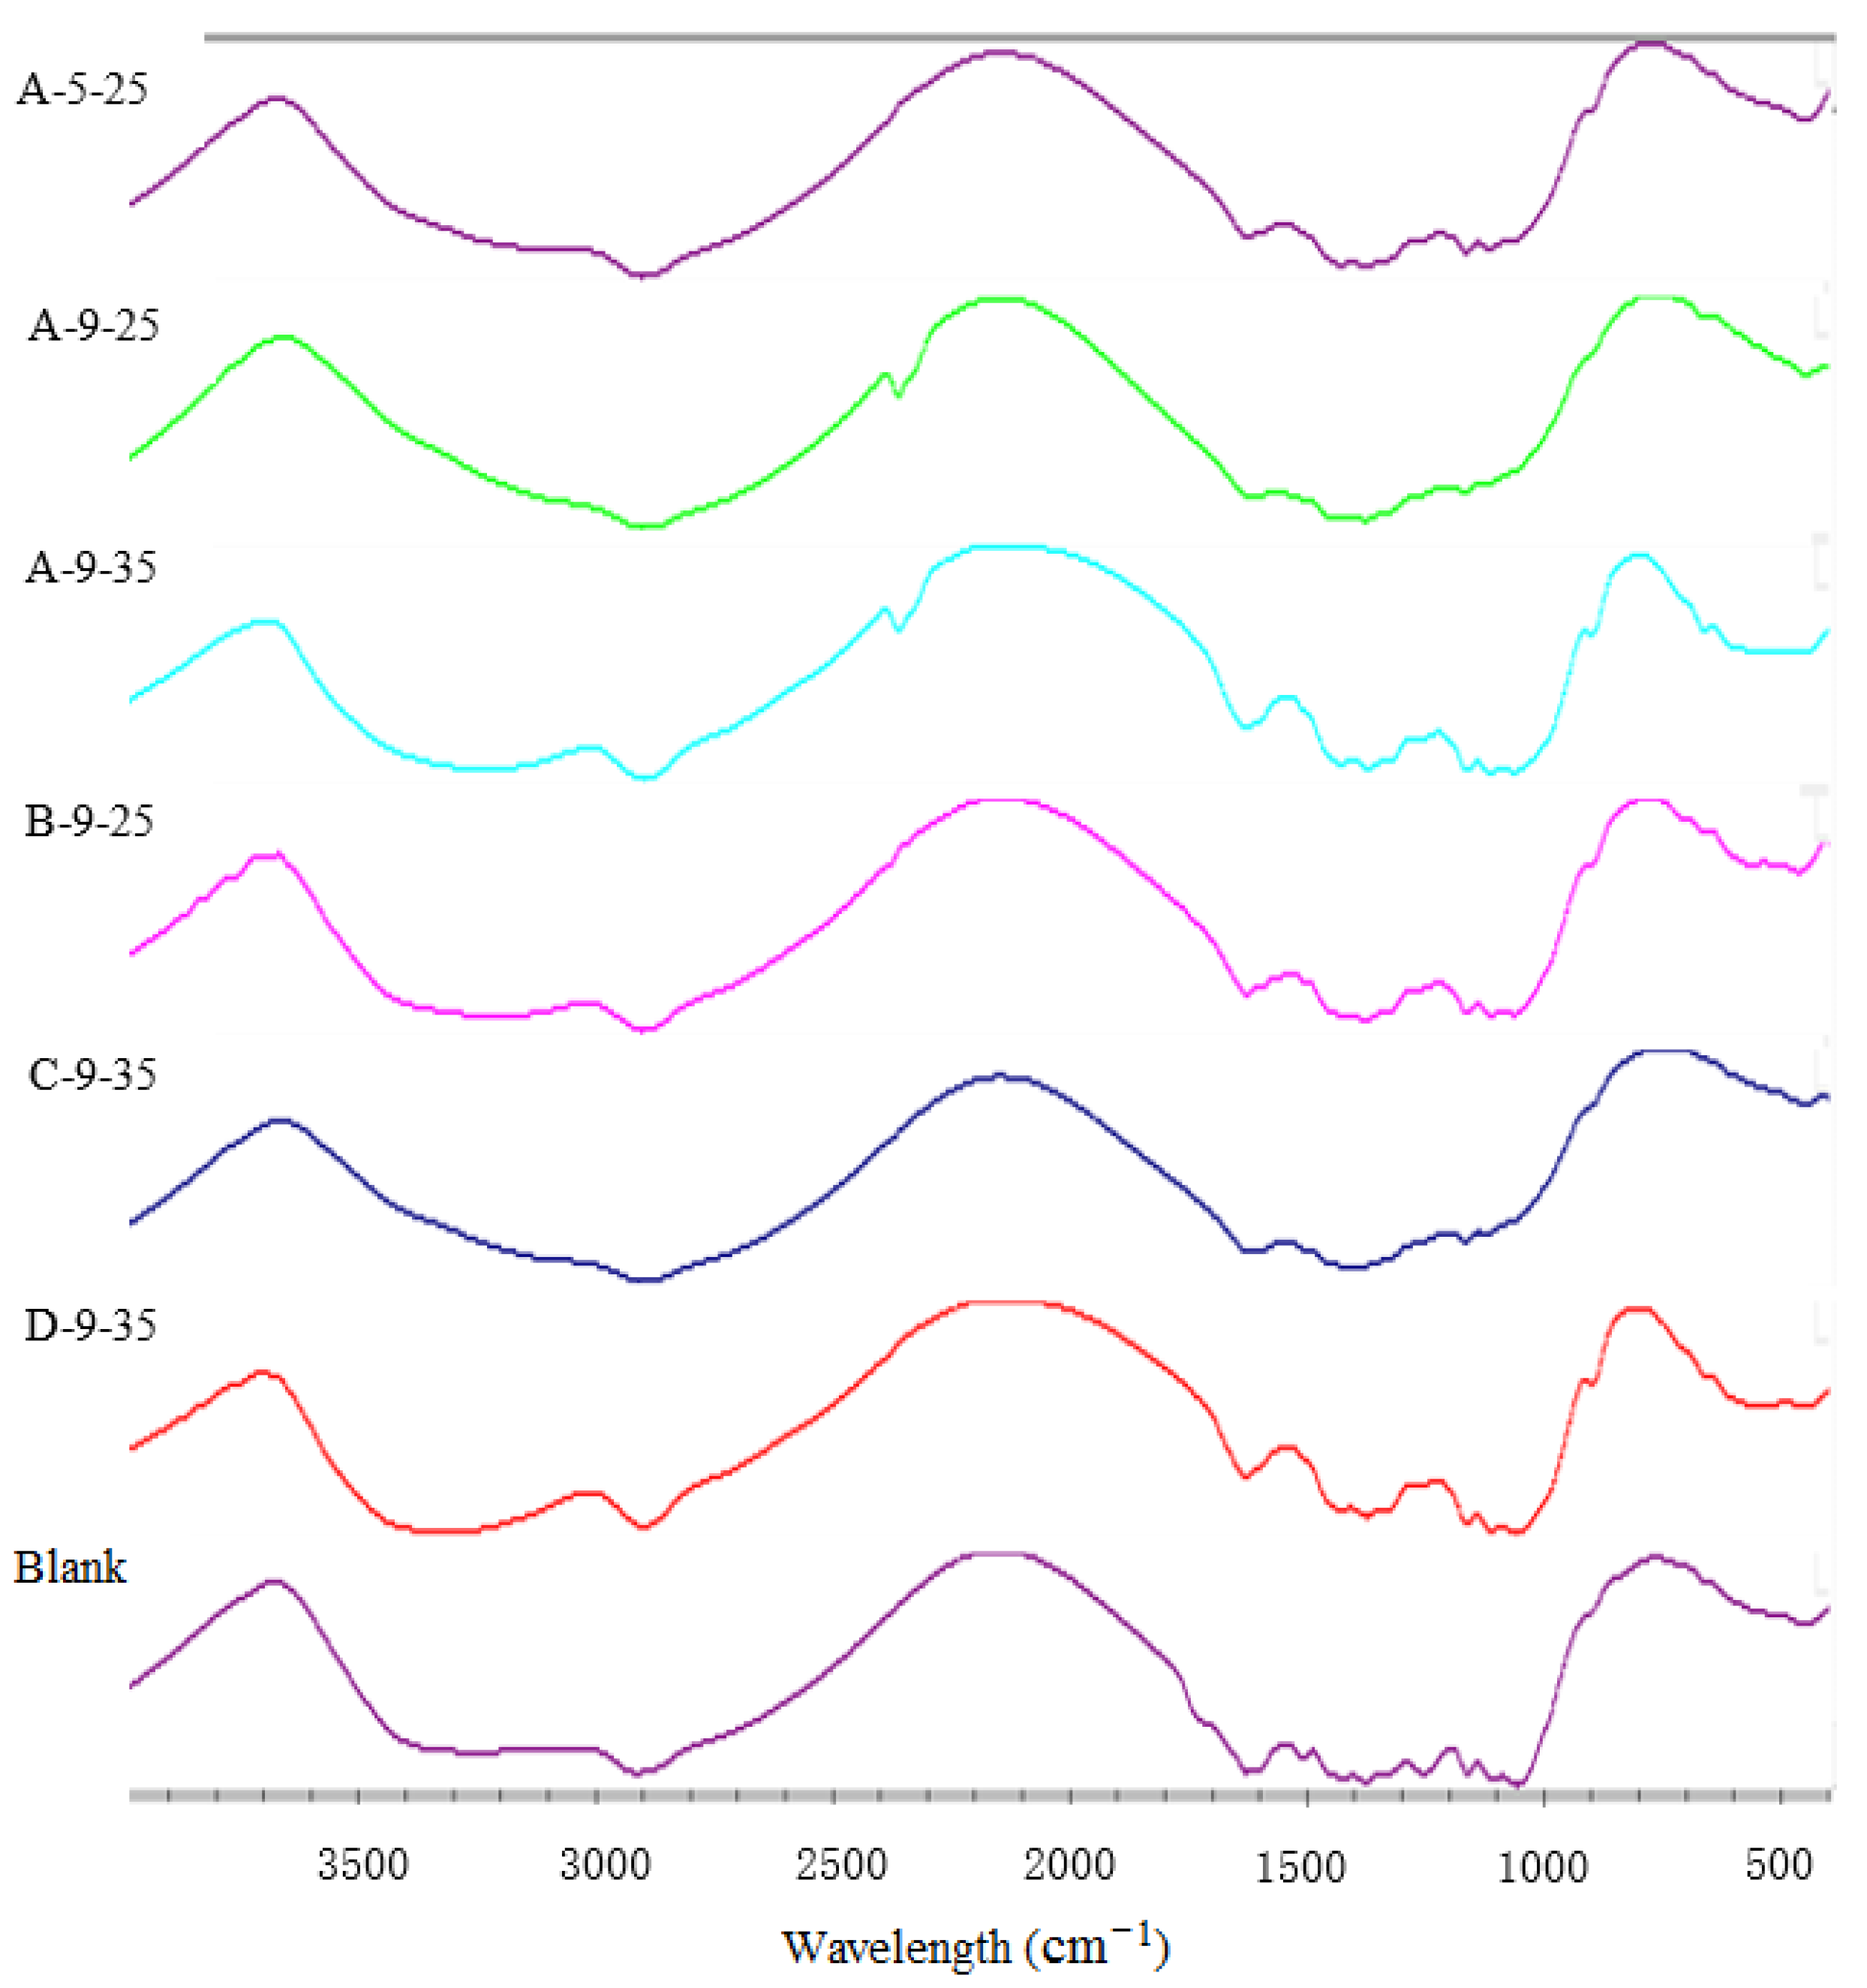
3.4. FTIR Analysis
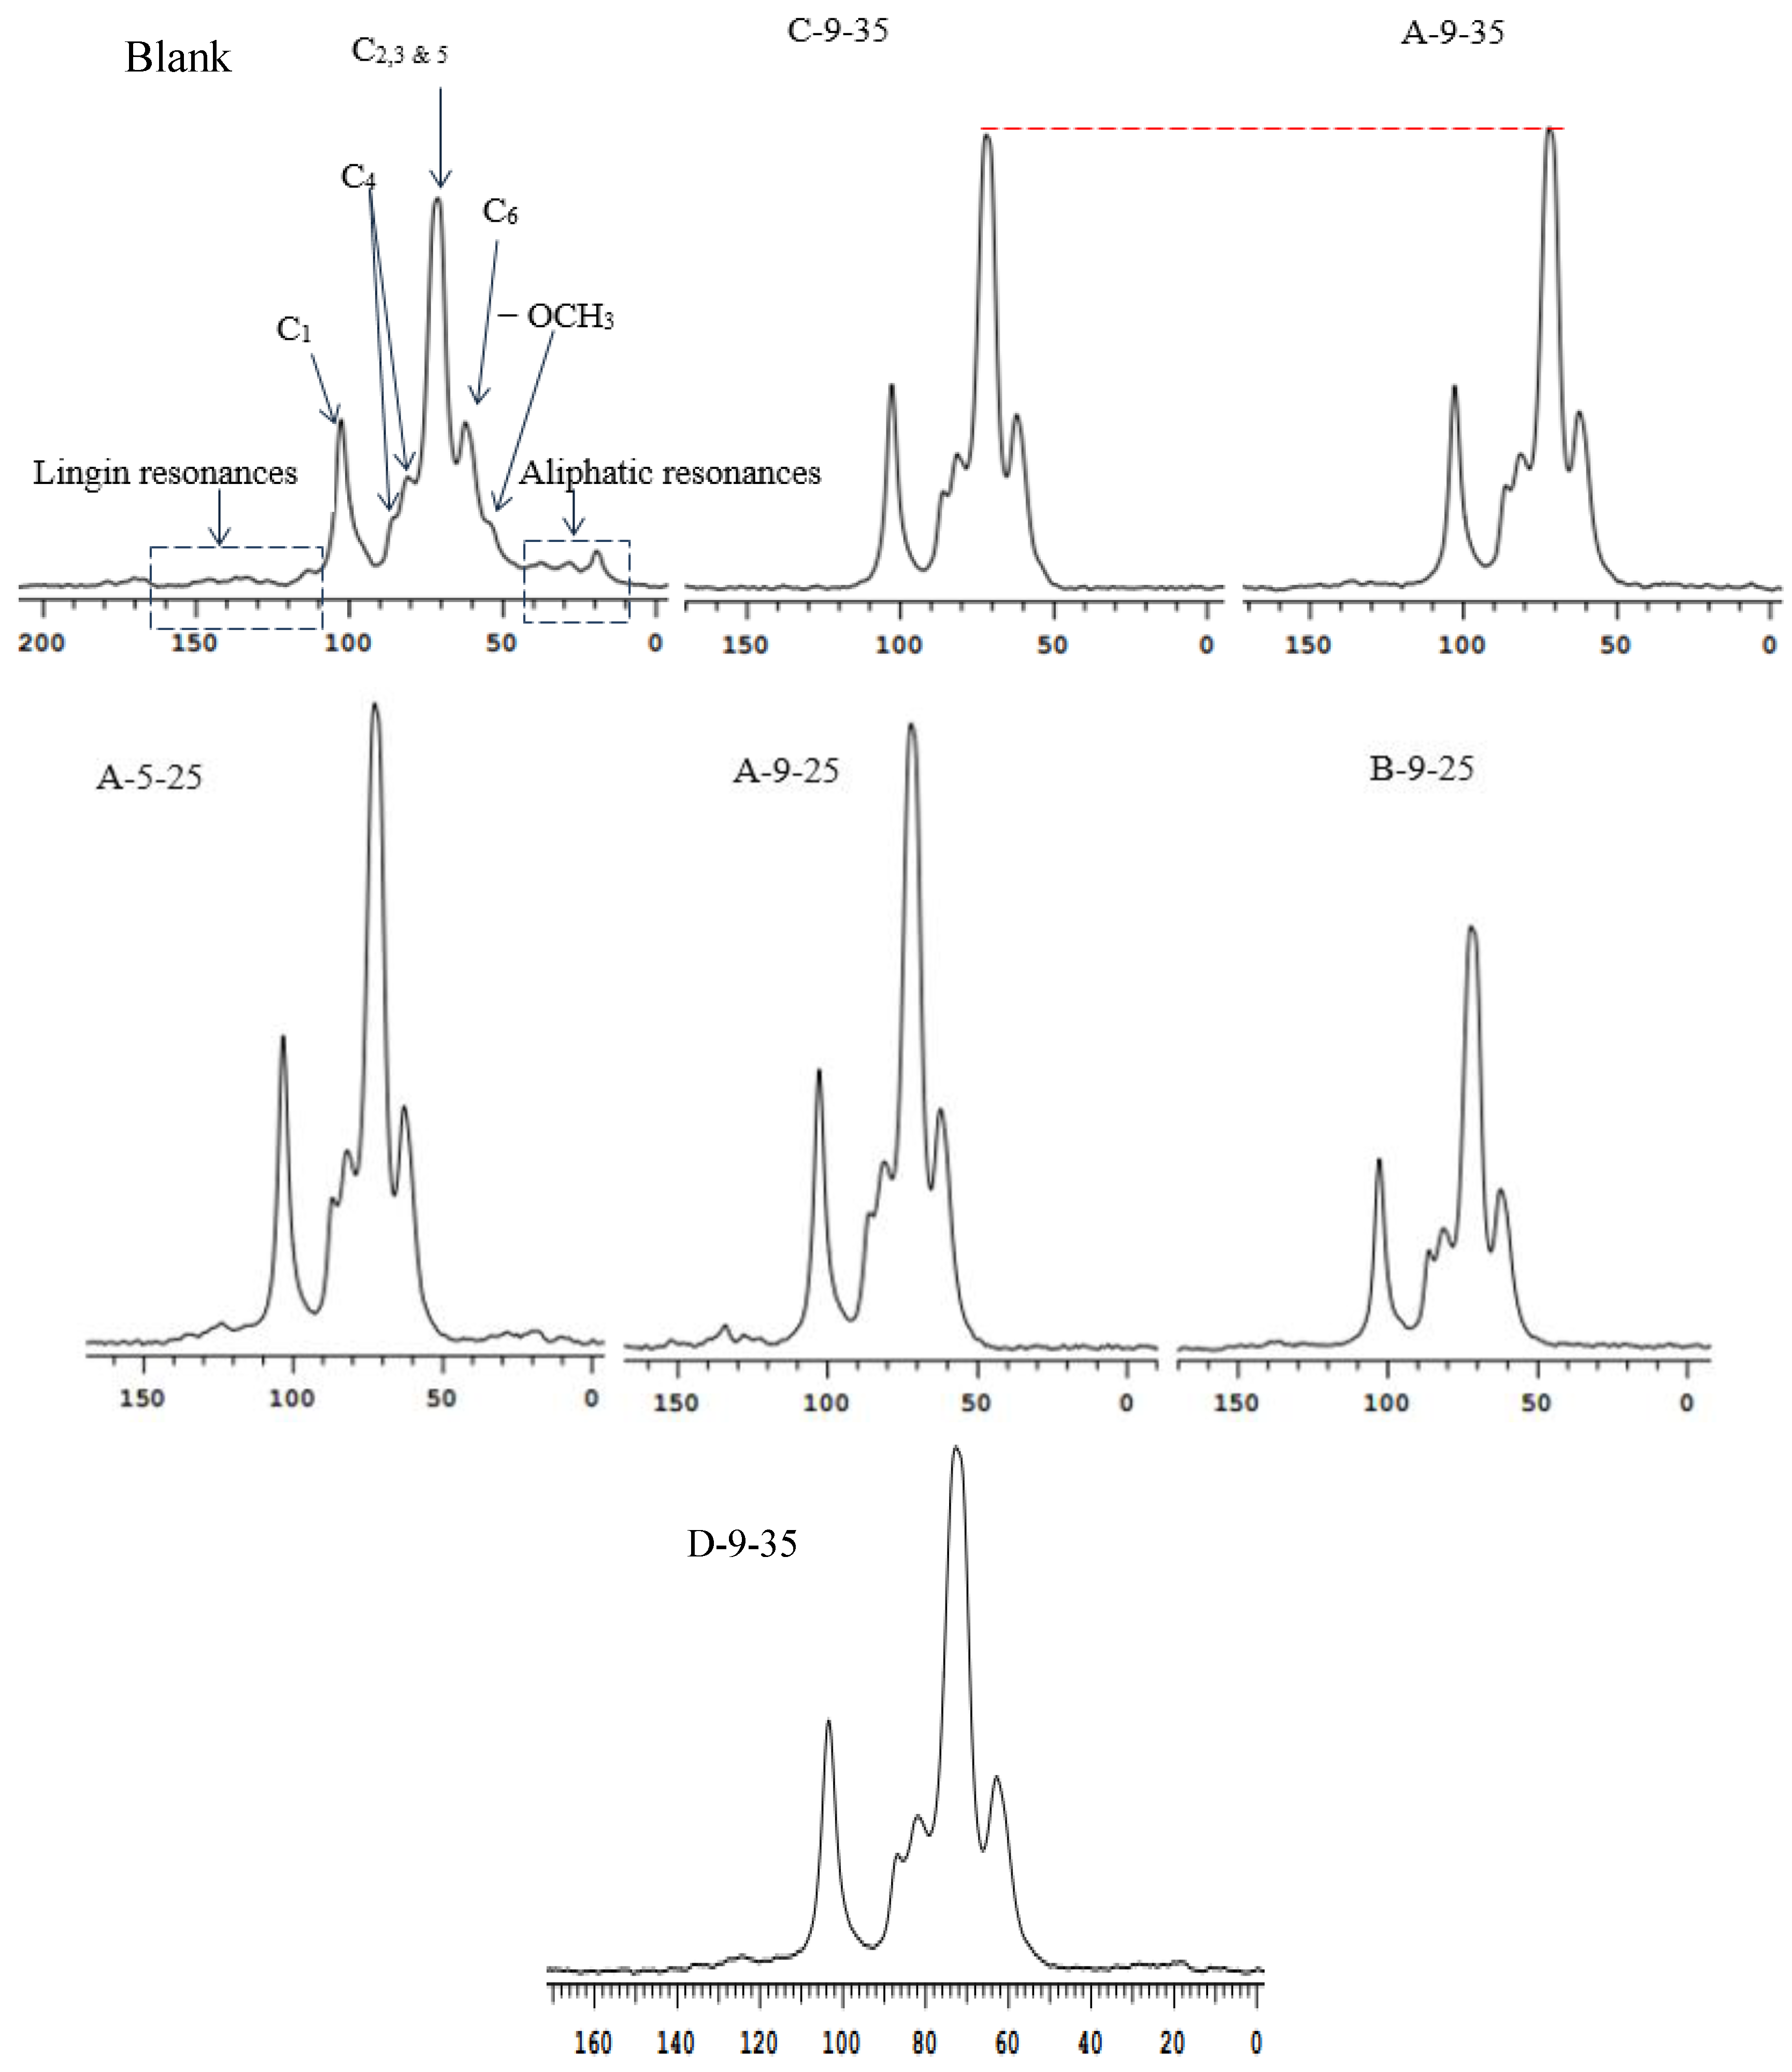
3.5. 13C-NMR Analysis
4. Conclusions
Supplementary Materials
Author Contributions
Acknowledgments
Conflicts of Interest
Nomenclature
| AT | single NaOH pretreatment |
| OT | single ozone pretreatment |
| AT-OT | the combine pretreatment with sodium hydroxide and ozone |
| G | guaiacyllignin |
| S | syringyllignin |
References
- Chen, X.; Ning, X.Q.; Zhang, B.B.; Wang, Y.L.; Zeng, G.M. Effect of steam explosion and ionic liquid pretreatment technology on the enzymatic hydrolysis of corn stalk. Asian J. Chem. 2012, 24, 1015–1018. [Google Scholar]
- Li, M.F.; Chen, C.Z.; Sun, R.C. Effect of pretreatment severity on the enzymatic hydrolysis of bamboo in hydrothermal deconstruction. Cellulose 2014, 21, 4105–4117. [Google Scholar] [CrossRef]
- Ramos, L.P.; Nazhad, M.M.; Saddler, J.N. Effect of enzymatic hydrolysis on the morphology and fine structure of pretreated cellulosic residues. Enzyme Microb. Technol. 1993, 15, 821–831. [Google Scholar] [CrossRef]
- Zhang, Y.-H.P.; Lynd, L.R. Toward an aggregated understanding of enzymatic hydrolysis of cellulose: Noncomplexed cellulase systems. Biotechnol. Bioeng. 2004, 88, 797–824. [Google Scholar] [CrossRef] [PubMed]
- Pang, Y.; Li, X.; Luo, Q. Effect of temperature and chemical pretreatment on anaerobic biogasification of corn stalk. Chin. J. Bioprocess Eng. 2005, 3, 37–41. [Google Scholar]
- Ikeura, H.; Hamasaki, S.; Tamaki, M. Effects of ozone microbubble treatment on removal of residual pesticides and quality of persimmon leaves. Food Chem. 2013, 138, 366–371. [Google Scholar] [CrossRef] [PubMed]
- Zhang, P.Y.; Gang, Y.U.; Sun, H.T.; Jiang, Z.P. Preliminary study on the degradation of organic compound by integrated ozone/activated carbon. China Environ. 2000, 20, 159–162. [Google Scholar]
- Ben’ko, E.M.; Manisova, O.R.; Lunin, V.V. Effect of ozonation on the reactivity of lignocellulose substrates in enzymatic hydrolysis to sugars. Russ. J. Phys. Chem. 2013, 87, 1108–1113. [Google Scholar] [CrossRef]
- Panneerselvam, A.; Sharma-Shivappa, R.R.; Kolar, P.; Clare, D.A.; Ranney, T. Hydrolysis of ozone pretreated energy grasses for optimal fermentable sugar production. Bioresour. Technol. 2013, 148, 97–104. [Google Scholar] [CrossRef] [PubMed]
- Bule, M.V.; Gao, A.H.; Hiscox, B.; Chen, S. Structural modification of lignin and characterization of pretreated wheat stover by ozonation. J. Agric. Food Chem. 2013, 61, 3916–3925. [Google Scholar] [CrossRef] [PubMed]
- Li, H.Y.; Huang, K.L.; Jin, M.; Wei, Q.Q.; Li, Z.G. Effects of alkaline ozone pretreatment on rice stover. Trans. Chin. Soc. Agric. Eng. 2010, 26, 264–268. [Google Scholar]
- Ogiwara, Y.; Arai, K. Swelling degree of cellulose materials and hydrolysis rate with cellulase. Text. Res. J. 1968, 38, 885–891. [Google Scholar] [CrossRef]
- Li, Z.; Wang, Y.; Cheng, L.; Guo, W.; Wu, G. Effect of Nano-CaCO3 on the structure and properties of holocellulose-fiber/polypropylene biomass composites. J. Wood Chem. Technol. 2017, 37, 62–74. [Google Scholar] [CrossRef]
- Zheng, Q.F.; Wang, Z.M.; Chen, B.G.; Liu, G.F.; Zhao, J. Analysis of XRD Spectral Structure and Carbonization of the Biochar Preparation. Spectrosc. Spectr. Anal. 2016. [Google Scholar] [CrossRef]
- Nanda, S.; Azargohar, R.; Kozinski, J.A.; Dalai, A.K. Characteristic studies on the pyrolysis products from hydrolyzed Canadian lignocellulosic feedstocks. Bioenergy Res. 2014, 7, 174–191. [Google Scholar] [CrossRef]
- Chao, Z.; Shao, Q.; Ma, Z.; Li, B.; Zhao, X. Physical and chemical characterizations of corn stalk resulting from hydrogen peroxide presoaking prior to ammonia fiber expansion pretreatment. Ind. Crops Prod. 2016, 83, 86–93. [Google Scholar]
- Li, X.; Ye, J.; Chen, J.; Yu, J.; Ding, M. Dissolution of wheat stover with aqueous NaOH/Urea solution. Fibers Polym. 2015, 16, 2368–2374. [Google Scholar] [CrossRef]
- Zhao, X.B.; Wang, L.; Liu, D.H. Technical note peracetic acid pretreatment of sugarcane bagasse for enzymatic hydrolysis: A continued work. J. Chem. Technol. Biotechnol. 2008, 83, 950–956. [Google Scholar] [CrossRef]
- Steinbeiss, S.; Schmidt, C.M.; Heide, K.; Gleixner, G. δ 13 C values of pyrolysis products from cellulose and lignin represent the isotope content of their precursors. J. Anal. Appl. Pyrolysis 2006, 75, 19–26. [Google Scholar] [CrossRef]
- Faix, O. Classification of Lignins from Different Botanical Origins by FT-IR Spectroscopy. Holzforsch.-Int. J. Biol. Chem. Phys. Technol. Wood 1991, 45, 21–28. [Google Scholar] [CrossRef]
- Zhong, R.; Morrison, W.H.; Himmelsbach, D.S.; Poole, F.L.; Ye, Z.-H. Essential role of caffeoyl coenzyme A O-methyltransferase in lignin biosynthesis in woody poplar plants. Plant Physiol. 2000, 124, 563–577. [Google Scholar] [CrossRef] [PubMed]
- Kim, T.H.; Kim, J.S.; Sunwoo, C.; Lee, Y.Y. Pretreatment of corn stover by aqueous ammonia. Bioresour. Technol. 2003, 90, 39–47. [Google Scholar] [CrossRef]
- Studer, M.H.; Demartini, J.D.; Davis, M.F.; Sykes, R.E.; Davison, B.; Keller, M.; Tuskan, G.A.; Wyman, C.E. Lignin content in natural Populus variants affects sugar release. Proc. Natl. Acad. Sci. USA 2011, 108, 6300–6305. [Google Scholar] [CrossRef] [PubMed]
- Aznm, A.M. Pretreatment of cane bagasse with alkaline hydrogen peroxide for enzymatic hydrolysis of cellulose and ethanol ferment-atiom. J. Environ. Sci. 2009, 100, 1608–1613. [Google Scholar]
Sample Availability: Samples of the compounds corn stover are available from the authors. |


| Factor | NaOH Pretreatment Conditions | ||
|---|---|---|---|
| NaOH Pretreatment Temperature | 40 °C | 60 °C | 80 °C |
| NaOH Pretreatment Time | 2 h | 3 h | 4 h |
| Factor | Ozone Pretreatment Conditions | |
|---|---|---|
| Ozone treatment Initial pH | 5 | 9 |
| Ozone treatment time | 25 min | 35 min |
| Number | Wavelength/cm−1 | Absorption Band Attribution |
|---|---|---|
| 1 | 898 | Vibration of β-glycosidic bonds in cellulose and hemicellulose |
| 2 | 1051 | The bending of hydroxyl groups in lignin |
| 3 | 1250 | Ether bond between lignin and carbohydrates (β-O-4) |
| 4 | 1370 | Phenolic hydroxyl groups in lignin |
| 5 | 1427 | Methoxy in lignin (–OCH3) |
| 6 | 1454 | Methoxy in lignin (–OCH3) |
| 7 | 1515 | Extension of C=C on Lignin Aromatic Rings |
| 8 | 1605 | Lignin aromatic skeleton vibration |
| 9 | 1654 | Conjugated carbonyls in lignin |
| 10 | 1704 | Non-conjugated carbonyls in lignin degradation products |
| 11 | 1732 | Ether bond between lignin and carbohydrate (non-conjugated ketone and carboxyl group C=O stretch) |
© 2018 by the authors. Licensee MDPI, Basel, Switzerland. This article is an open access article distributed under the terms and conditions of the Creative Commons Attribution (CC BY) license (http://creativecommons.org/licenses/by/4.0/).
Share and Cite
Wang, W.; Zhang, C.; Tong, S.; Cui, Z.; Liu, P. Enhanced Enzymatic Hydrolysis and Structural Features of Corn Stover by NaOH and Ozone Combined Pretreatment. Molecules 2018, 23, 1300. https://0-doi-org.brum.beds.ac.uk/10.3390/molecules23061300
Wang W, Zhang C, Tong S, Cui Z, Liu P. Enhanced Enzymatic Hydrolysis and Structural Features of Corn Stover by NaOH and Ozone Combined Pretreatment. Molecules. 2018; 23(6):1300. https://0-doi-org.brum.beds.ac.uk/10.3390/molecules23061300
Chicago/Turabian StyleWang, Wenhui, Chunyan Zhang, Shisheng Tong, Zhongyi Cui, and Ping Liu. 2018. "Enhanced Enzymatic Hydrolysis and Structural Features of Corn Stover by NaOH and Ozone Combined Pretreatment" Molecules 23, no. 6: 1300. https://0-doi-org.brum.beds.ac.uk/10.3390/molecules23061300