Study on Paramagnetic Interactions of (CH3NH3)2CoBr4 Hybrid Perovskites Based on Nuclear Magnetic Resonance (NMR) Relaxation Time


1
Analytical Laboratory of Advanced Ferroelectric Crystals, Jeonju University, Jeonju 55069, Korea
2
Department of Science Education, Jeonju University, Jeonju 55069, Korea
3
Korea Basic Science Institute, Seoul Western Center, Seoul 120-140, Korea
4
Department of Chemistry, Kyungpook National University, Daegu 41566, Korea
*
Author to whom correspondence should be addressed.
Molecules 2019, 24(16), 2895; https://0-doi-org.brum.beds.ac.uk/10.3390/molecules24162895
Submission received: 17 July 2019
/
Revised: 24 July 2019
/
Accepted: 2 August 2019
/
Published: 9 August 2019
(This article belongs to the Special Issue Solid-State NMR Spectroscopy in Materials Chemistry)
Abstract
:The thermal properties of organic–inorganic (CH3NH3)2CoBr4 crystals were investigated using differential scanning calorimetry and thermogravimetric analysis. The phase transition and partial decomposition temperatures were observed at 460 K and 572 K. Nuclear magnetic resonance (NMR) chemical shifts depend on the local field at the site of the resonating nucleus. In addition, temperature-dependent spin–lattice relaxation times (T1ρ) were measured using 1H and 13C magic angle spinning NMR to elucidate the paramagnetic interactions of the (CH3NH3)+ cations. The shortening of 1H and 13C T1ρ of the (CH3NH3)2CoBr4 crystals are due to the paramagnetic Co2+ effect. Moreover, the physical properties of (CH3NH3)2CoBr4 with paramagnetic ions and those of (CH3NH3)2CdBr4 without paramagnetic ions are reported and compared.
1. Introduction
Hybrid organic–inorganic compounds based on perovskite structures are currently attracting an increased amount of interest owing to their potential as substitutes for perovskite solar cells [1,2,3,4,5,6,7,8,9,10]. However, the toxicity and chemical instability of perovskites continue to be the major problems associated with their use in solar cells. Compounds in the (CH3NH3)2MX4 family (where M is the transition metal and X is halide) exhibit a variety of physical properties [1,11]. Ions of the transition metal M are located in the tetrahedral structure formed by the halogen ions X, and lie in the planes bridged by the (CH3NH3)+ cations [12]. These crystals have a layered structure and exhibit quasi-, two-dimensional magnetic properties. Most recently, electrochemical oxygen evolution of (CH3NH3)2CoBr4, a lead-free cobalt-based perovskite, has been reported by Babu et al. [13]. The (CH3NH3)2CoBr4 crystal belongs to the (CH3NH3)2MX4 series and the family of hybrid organic–inorganic compounds in which (CH3NH3)+ cations are connected via a bridge structure between the planes that contain the Co2+ ions. At room temperature, the (CH3NH3)2CoBr4 crystal structure has monoclinic symmetry and belongs to the space group P21/c, with lattice constants a = 7.9782 Å, b = 13.1673 Å, c = 11.2602 Å, and ß = 96.3260° [14]. The unit cell contains four formula units and four magnetic Co2+ ions. The (CoBr4)2− units are surrounded by seven (CH3NH3)+ cations, and two different crystallographic (CH3NH3)+ cations exist. Although the tetrahedral anion exhibits only C1 symmetry, the deviation from an idealized tetrahedral symmetry is small. The NH3+ polar heads of the chains connect the isolated (CoBr4)2− tetrahedral structure with weak N‒H···Br hydrogen bonds. On the other hand, (CH3NH3)2CdBr4 crystals at room temperature have a monoclinic structure and belong to the space group P21/c with lattice constants a = 8.1257 Å, b = 13.4317 Å, c = 11.4182 Å, ß = 96.1840°, and Z = 4 [15,16]. The structure of this crystal is very similar to that of the (CH3NH3)2CoBr4. Until now, the phase transition temperature, thermal property, and paramagnetic interactions of (CH3NH3)2CoBr4 have not been studied in full. The paramagnetic ions of the lead-free perovskite are eco-friendly, which is important for application to solar cells.
The present study was conducted to investigate the thermodynamic properties of the (CH3NH3)2CoBr4 crystal using differential scanning calorimetry (DSC), thermogravimetric analysis (TGA), and optical polarizing microscopy. Additionally, the nuclear magnetic resonance (NMR) chemical shifts and spin–lattice relaxation times T1ρ in the rotating frame of (CH3NH3)2CoBr4 were obtained using 1H magic angle spinning (MAS) NMR and 13C cross-polarization (CP)/MAS NMR methods at several temperatures to probe the local environments and study the roles of the (CH3NH3)+ cations. Moreover, the physical properties of (CH3NH3)2CoBr4 including paramagnetic ions and (CH3NH3)2CdBr4 excluding paramagnetic ions were obtained from previous reports [17], and used as a comparison to understand the effects of Co2+ and Cd2+ ions.
2. Results and Discussion
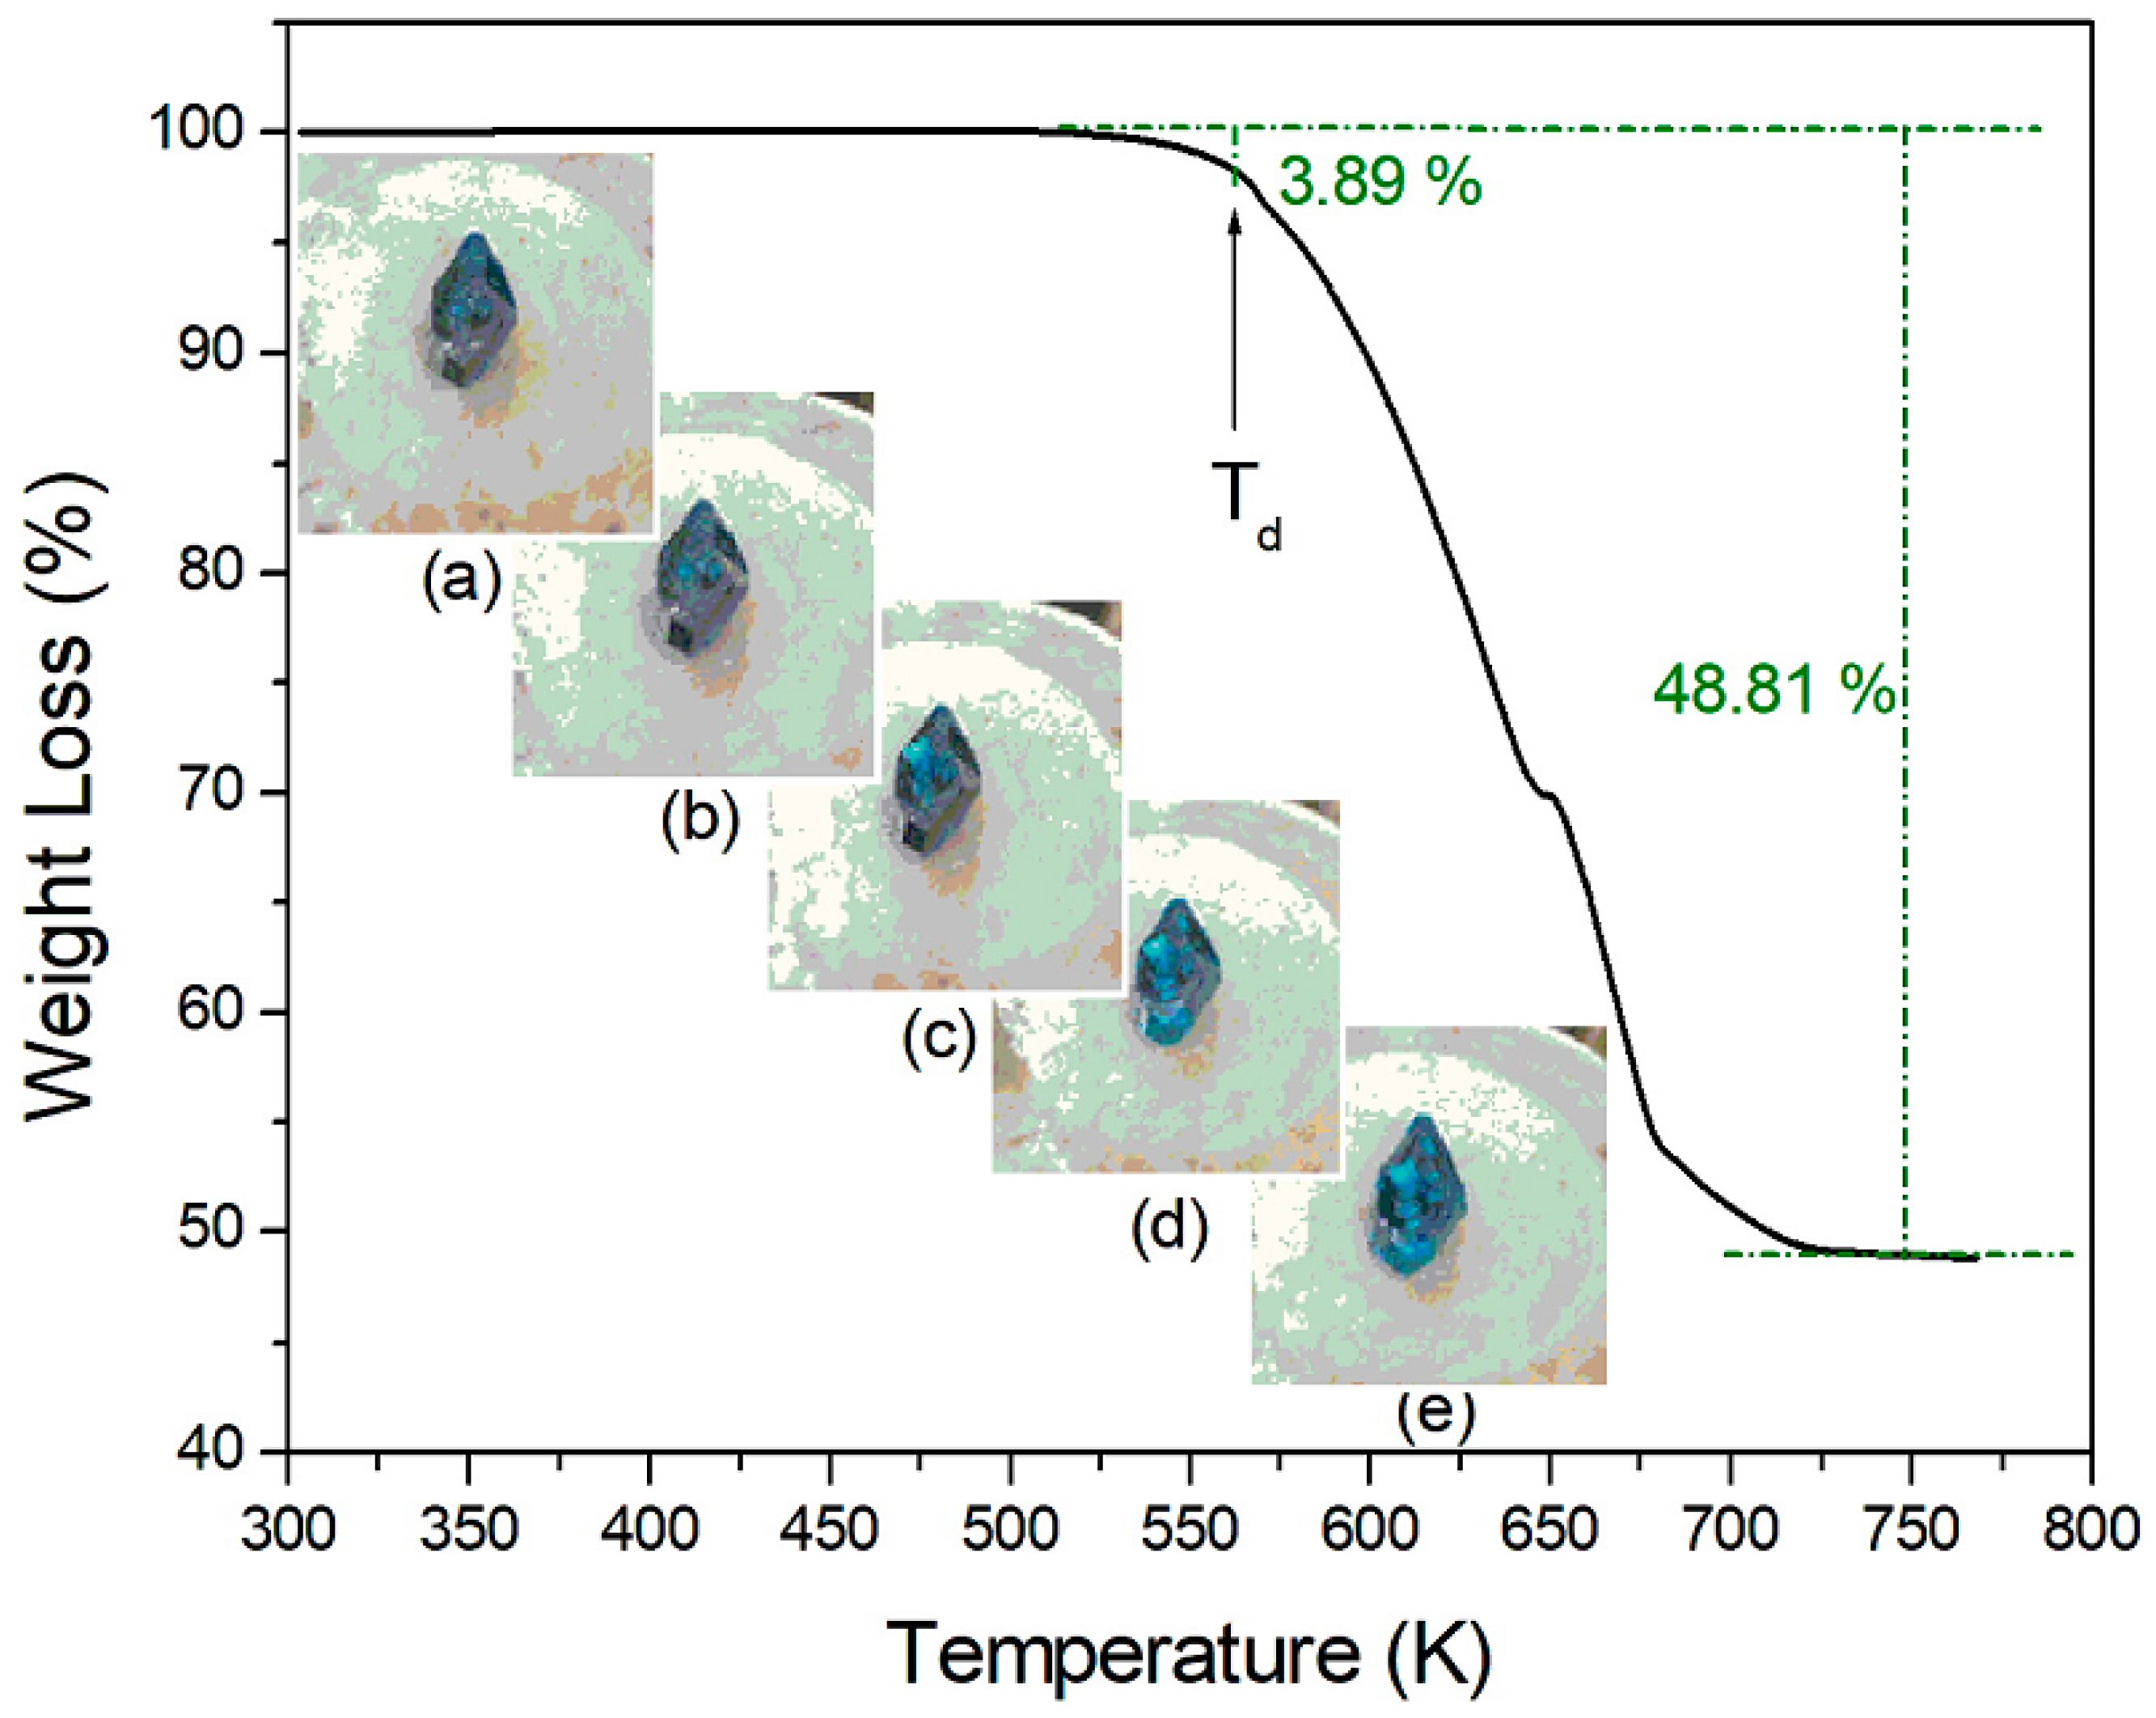
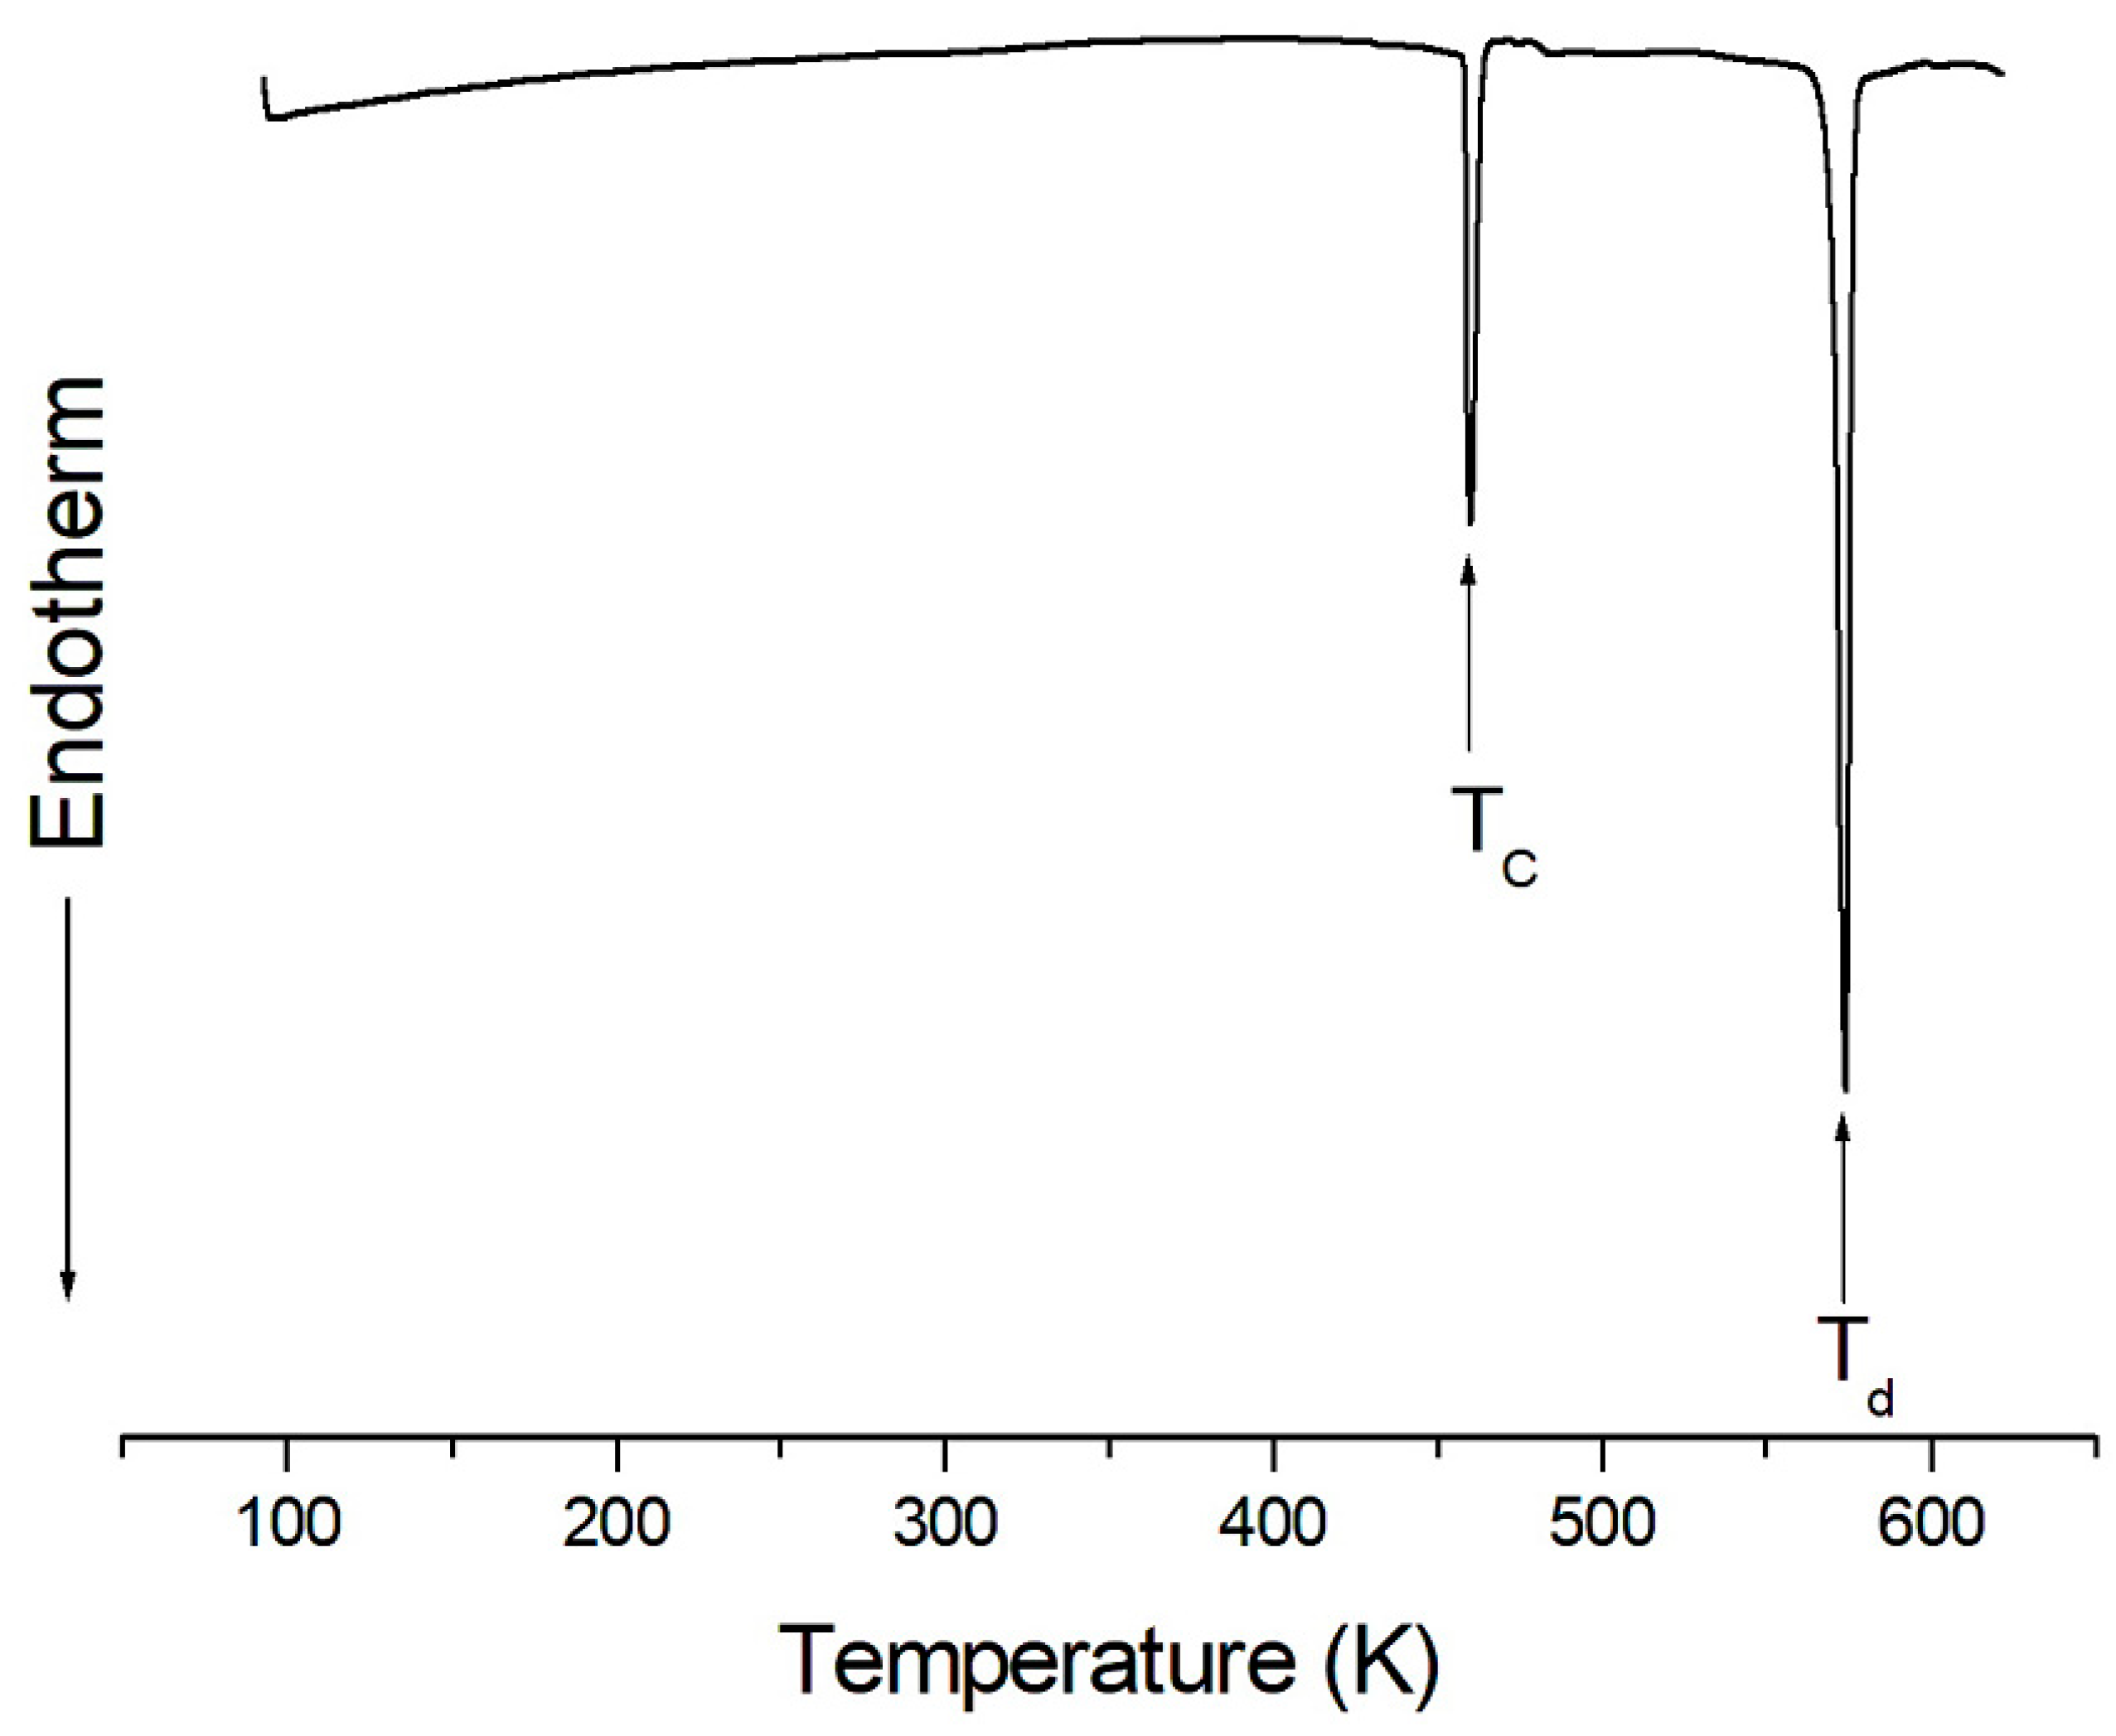
TGA and DSC measurements were obtained to understand the thermal stability, structural phase transitions, and melting temperatures. The TGA and DSC curves of (CH3NH3)2CoBr4 are plotted within the temperature range of 300–770 K, as shown in Figure 1 and Figure 2. The transformation anomaly at 460 K (=TC) in the DSC curve is related to the phase transition. The mass loss of 3.89% occurs at approximately 572 K (=Td), and is ascribed to the onset of partial thermal decomposition. The compound (CH3NH3)2CoBr4 loses its crystallization at increased temperatures. When comparing the experimental TGA results and possible chemical reactions, the solid residue is calculated on the basis of Equations (1) and (2):
(CH3NH3)2CoBr4→(CH3NH2·HBr)2CoBr2→(CH3NH2)2CoBr2 (s) + 2HBr (g)
- Residue:[(CH3NH2)2CoBr2 (M = 280.857 g)]/[(CH3NH3)2CoBr4 (M = 442.681 g)] = 63.4%(CH3NH3)2CoBr4→(CH3NH2·HBr)2CoBr2→CoBr2 (s) + 2(CH3NH2·HBr) (g)
- Residue:[CoBr2 (M = 218.741 g)]/[(CH3NH3)2CoBr4 (M = 442.681 g)] = 49.4 %
The mass loss of 37% near 669 K is likely attributable to the decomposition of the 2HBr moieties. Moreover, the mass loss near 700 K reaches 48.81%. These results are consistent with the TGA results reported by Babu et al. [13]. By the end, only CoBr2 remains. The solid-state decomposition is essentially one of the chemical reactions that occur at the surface. The second stage is associated with the thermal decomposition of (CH3NH3)2CoBr4 to CoBr2. Optical polarizing microscopy showed that the crystals have a seagrass color at room temperature. The color of the crystal does not vary as the temperature increases, and the crystal starts to melt at temperatures above Td, as indicated at the surface. From the TGA and DSC results, the phase transition temperature is 460 K, and the partial decomposition temperature is at 572 K. The high-temperature phenomenon above Td is not related to a physical change, such as structural phase transitions, but is instead related to chemical changes, such as thermal decomposition.
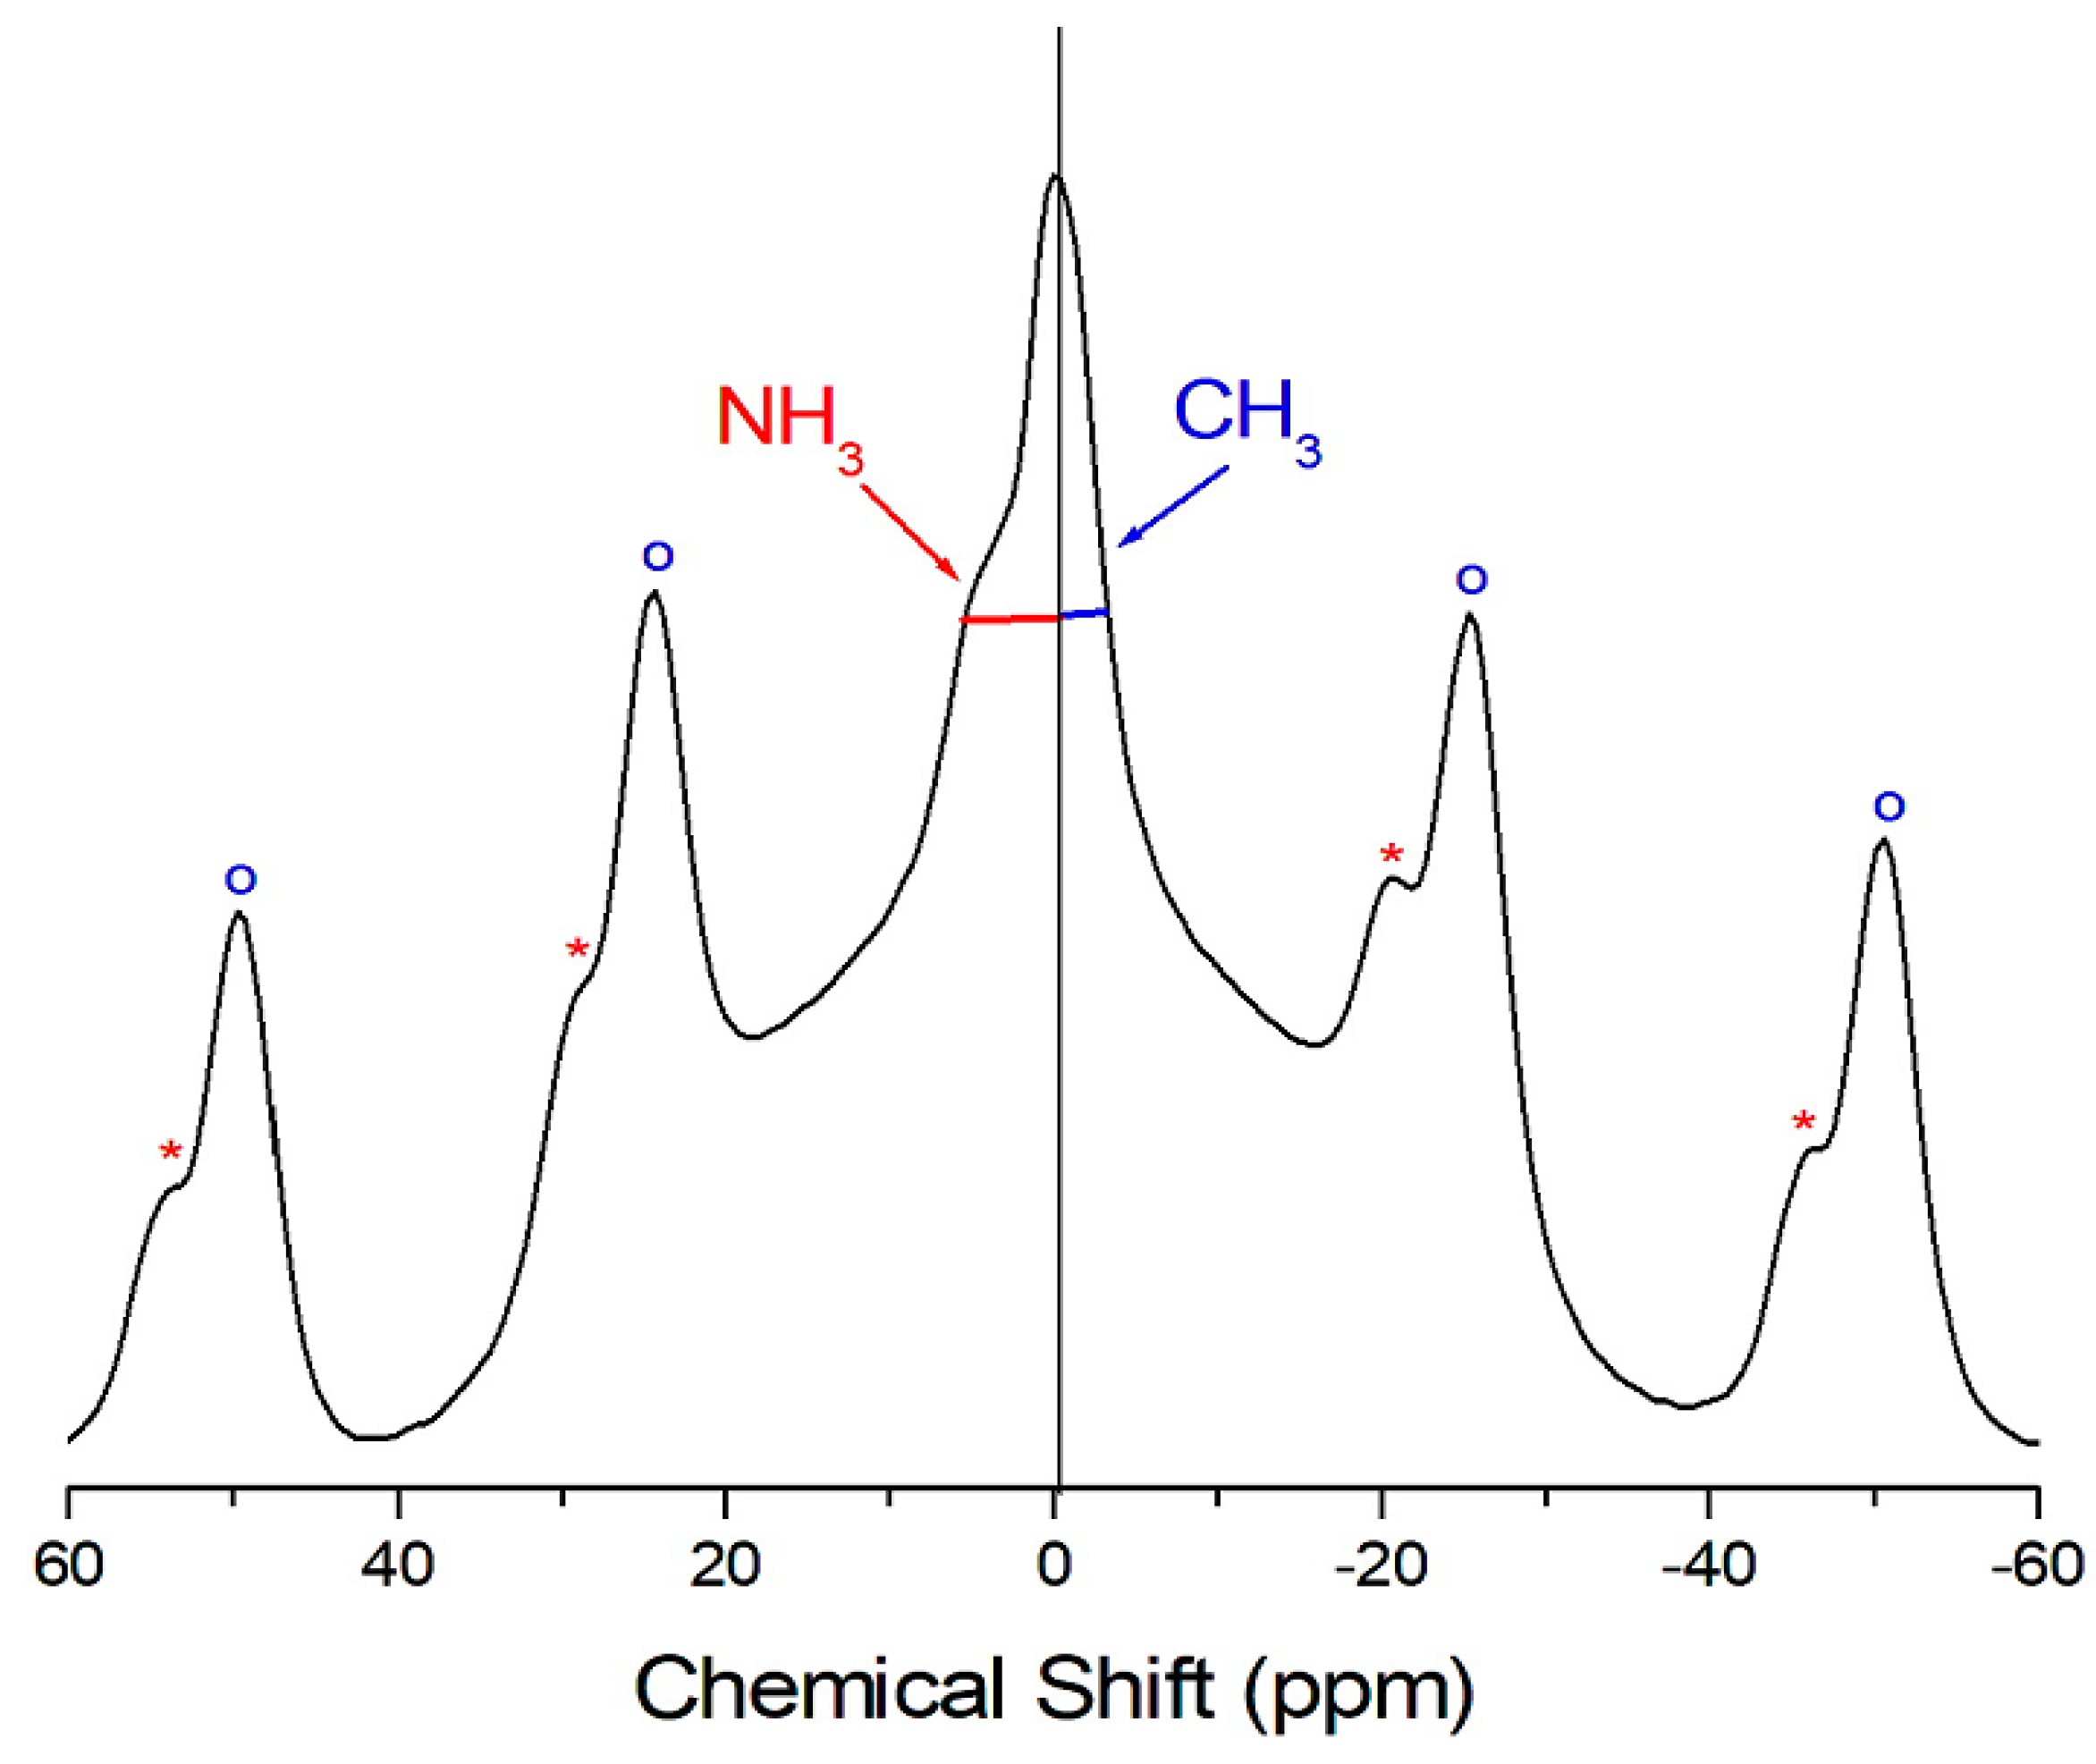
The temperature-dependent 1H-NMR spectrum of (CH3NH3)2CoBr4 is obtained to understand and analyze its structure. All recorded spectra contain only one resonance line, and Figure 3 shows the spectrum at 410 K. The spinning sideband for 1H in CH3 is marked with open circles, and that for 1H in NH3 is marked with asterisks. The 1H resonance line has an asymmetric shape, and the full-width at half maximum (FWHM) values on the left and right sides are not equal. The asymmetric line shape is attributed to the overlapping lines of the two 1H in the (CH3NH3)+ cations. The 1H-NMR chemical shift of δ = −0.3 ppm is due to the CH3, while the 1H-NMR chemical shift of δ = 4.2 ppm is due to the NH3. The 1H-NMR chemical shifts for the two 1H in the (CH3NH3)+ cations are temperature-independent. They remain quasi-constant with increasing temperature, indicating that the structural environment of 1H in the CH3 and NH3 groups does not change.
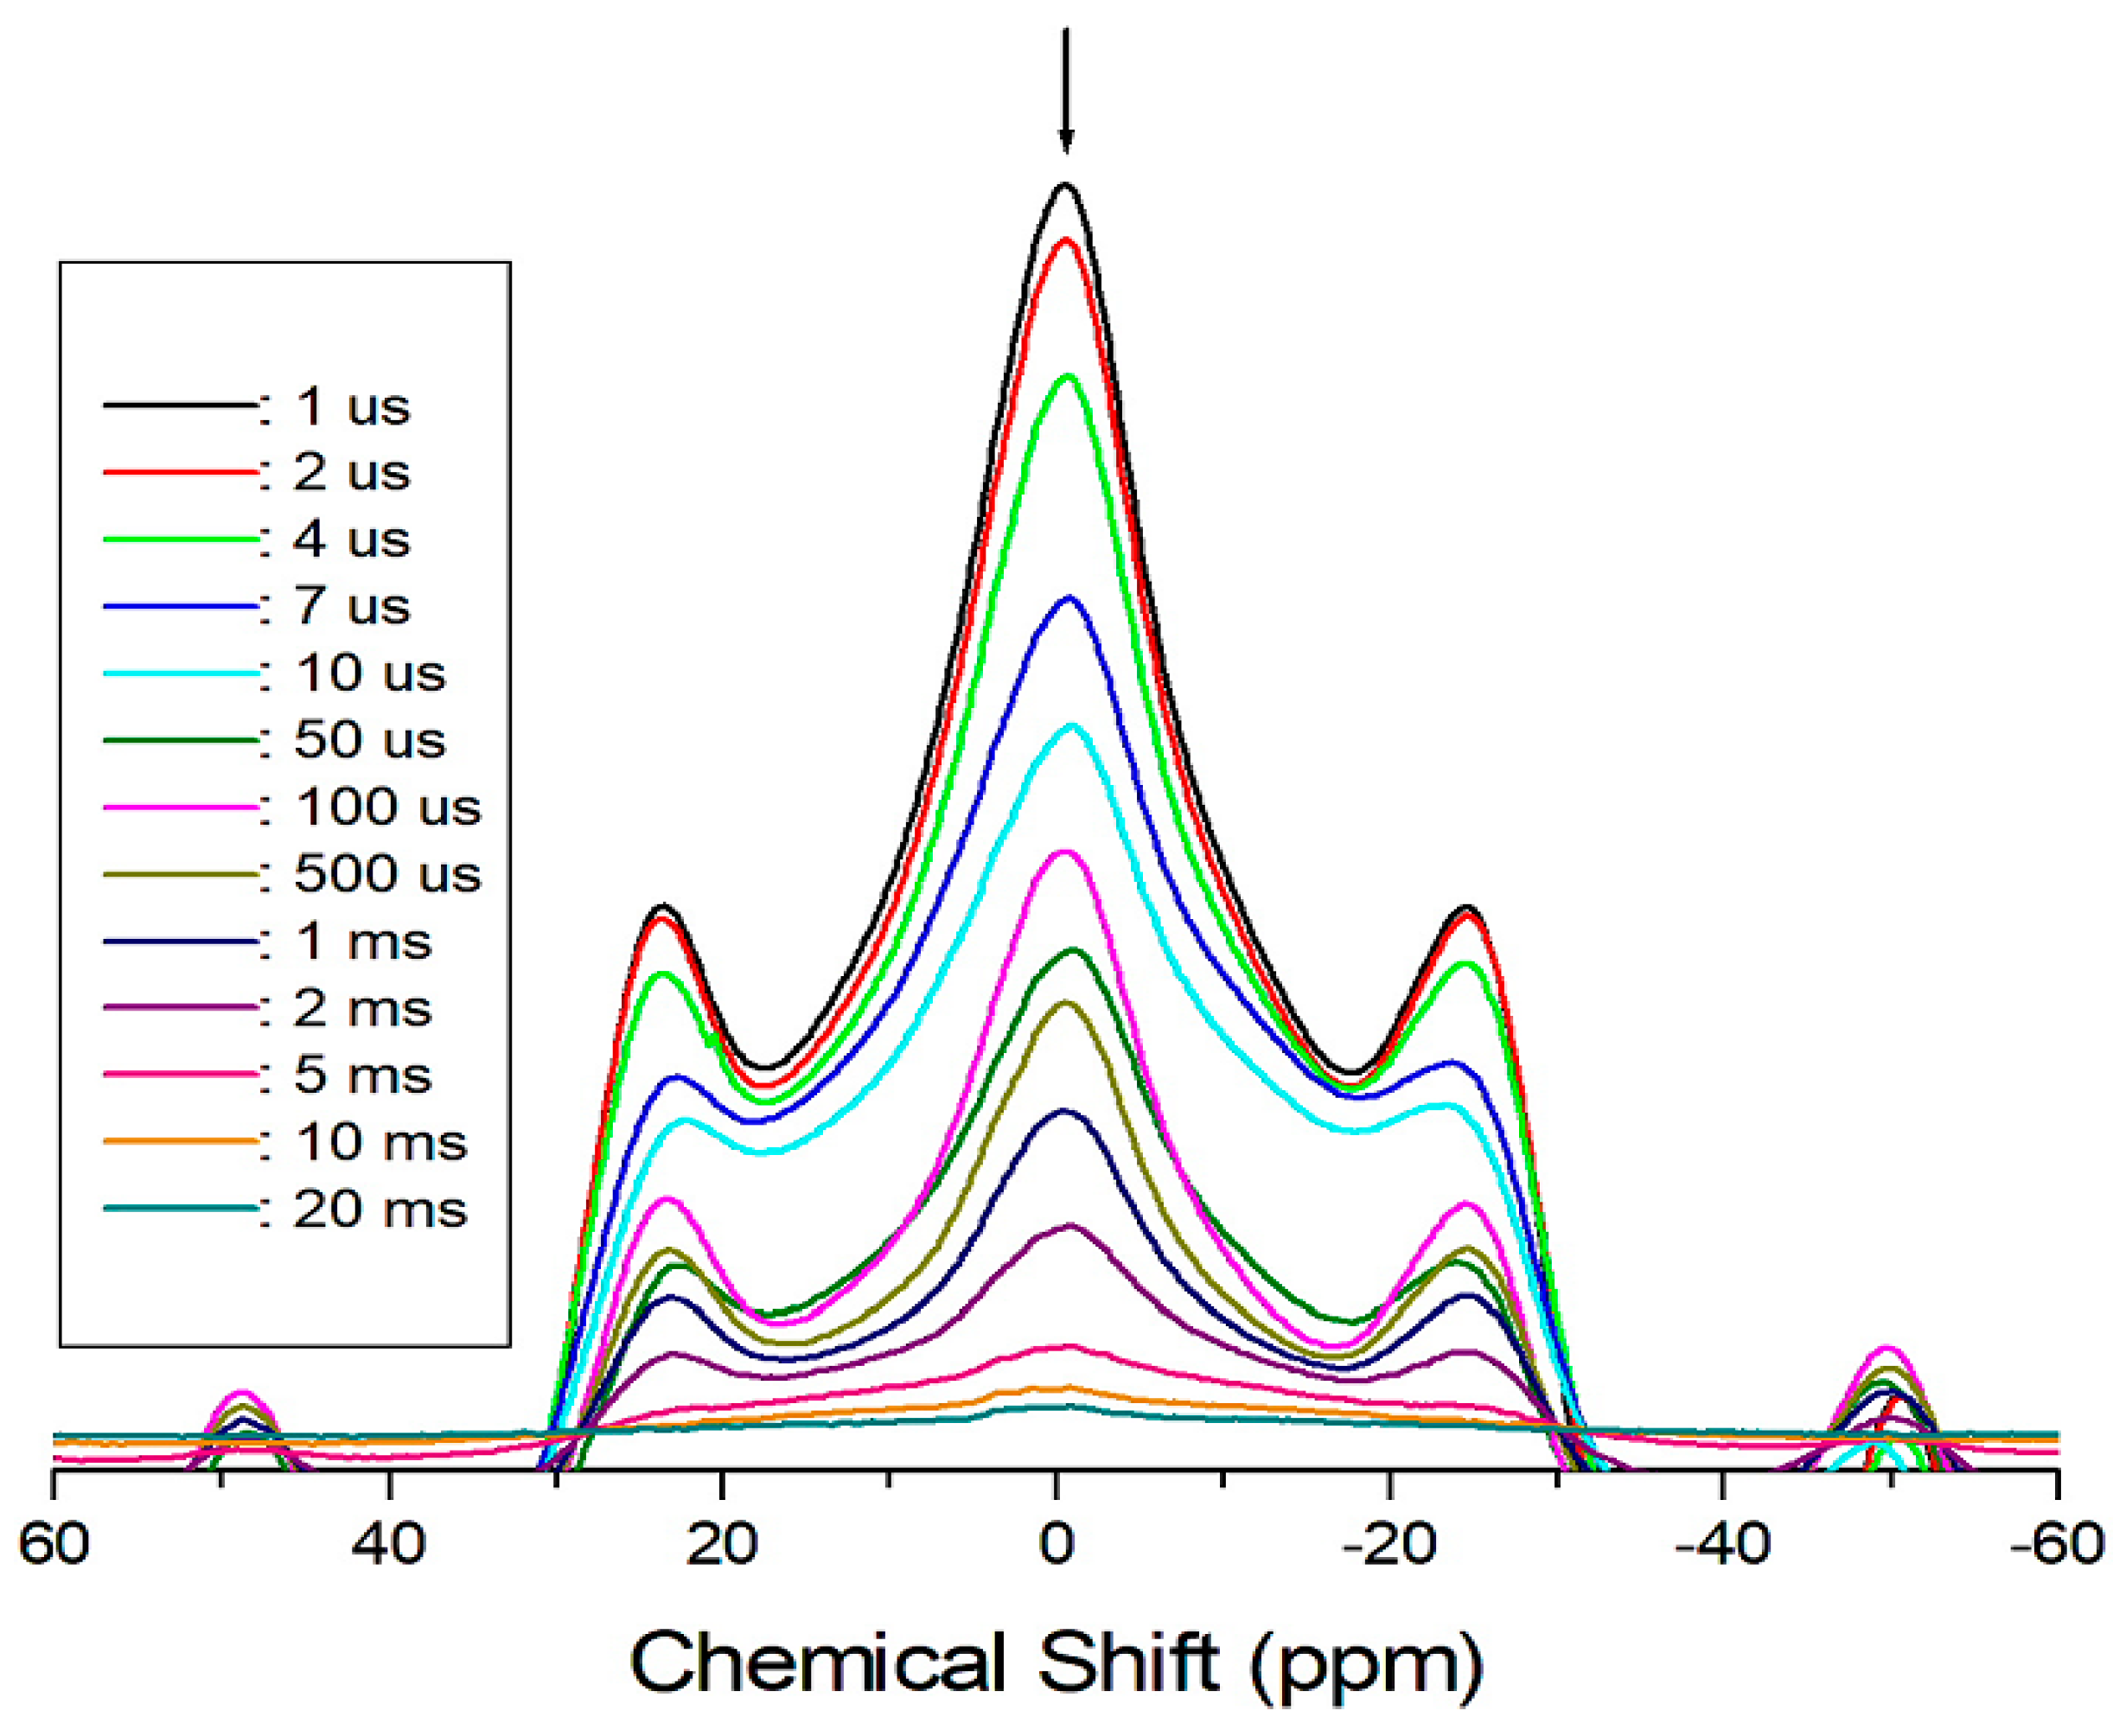
Figure 4 shows the recovery traces for the 1H resonance lines for delay times that range from 1 μs to 20 ms at 300 K. Herein, the arrows mark the resonance lines at each delay time, while the other resonance lines are the sidebands. The T1ρ values are obtained from the intensities of the magnetization recovery curves with respect to the delay time. The recovery traces are described by a simple mono-exponential function [18,19,20].
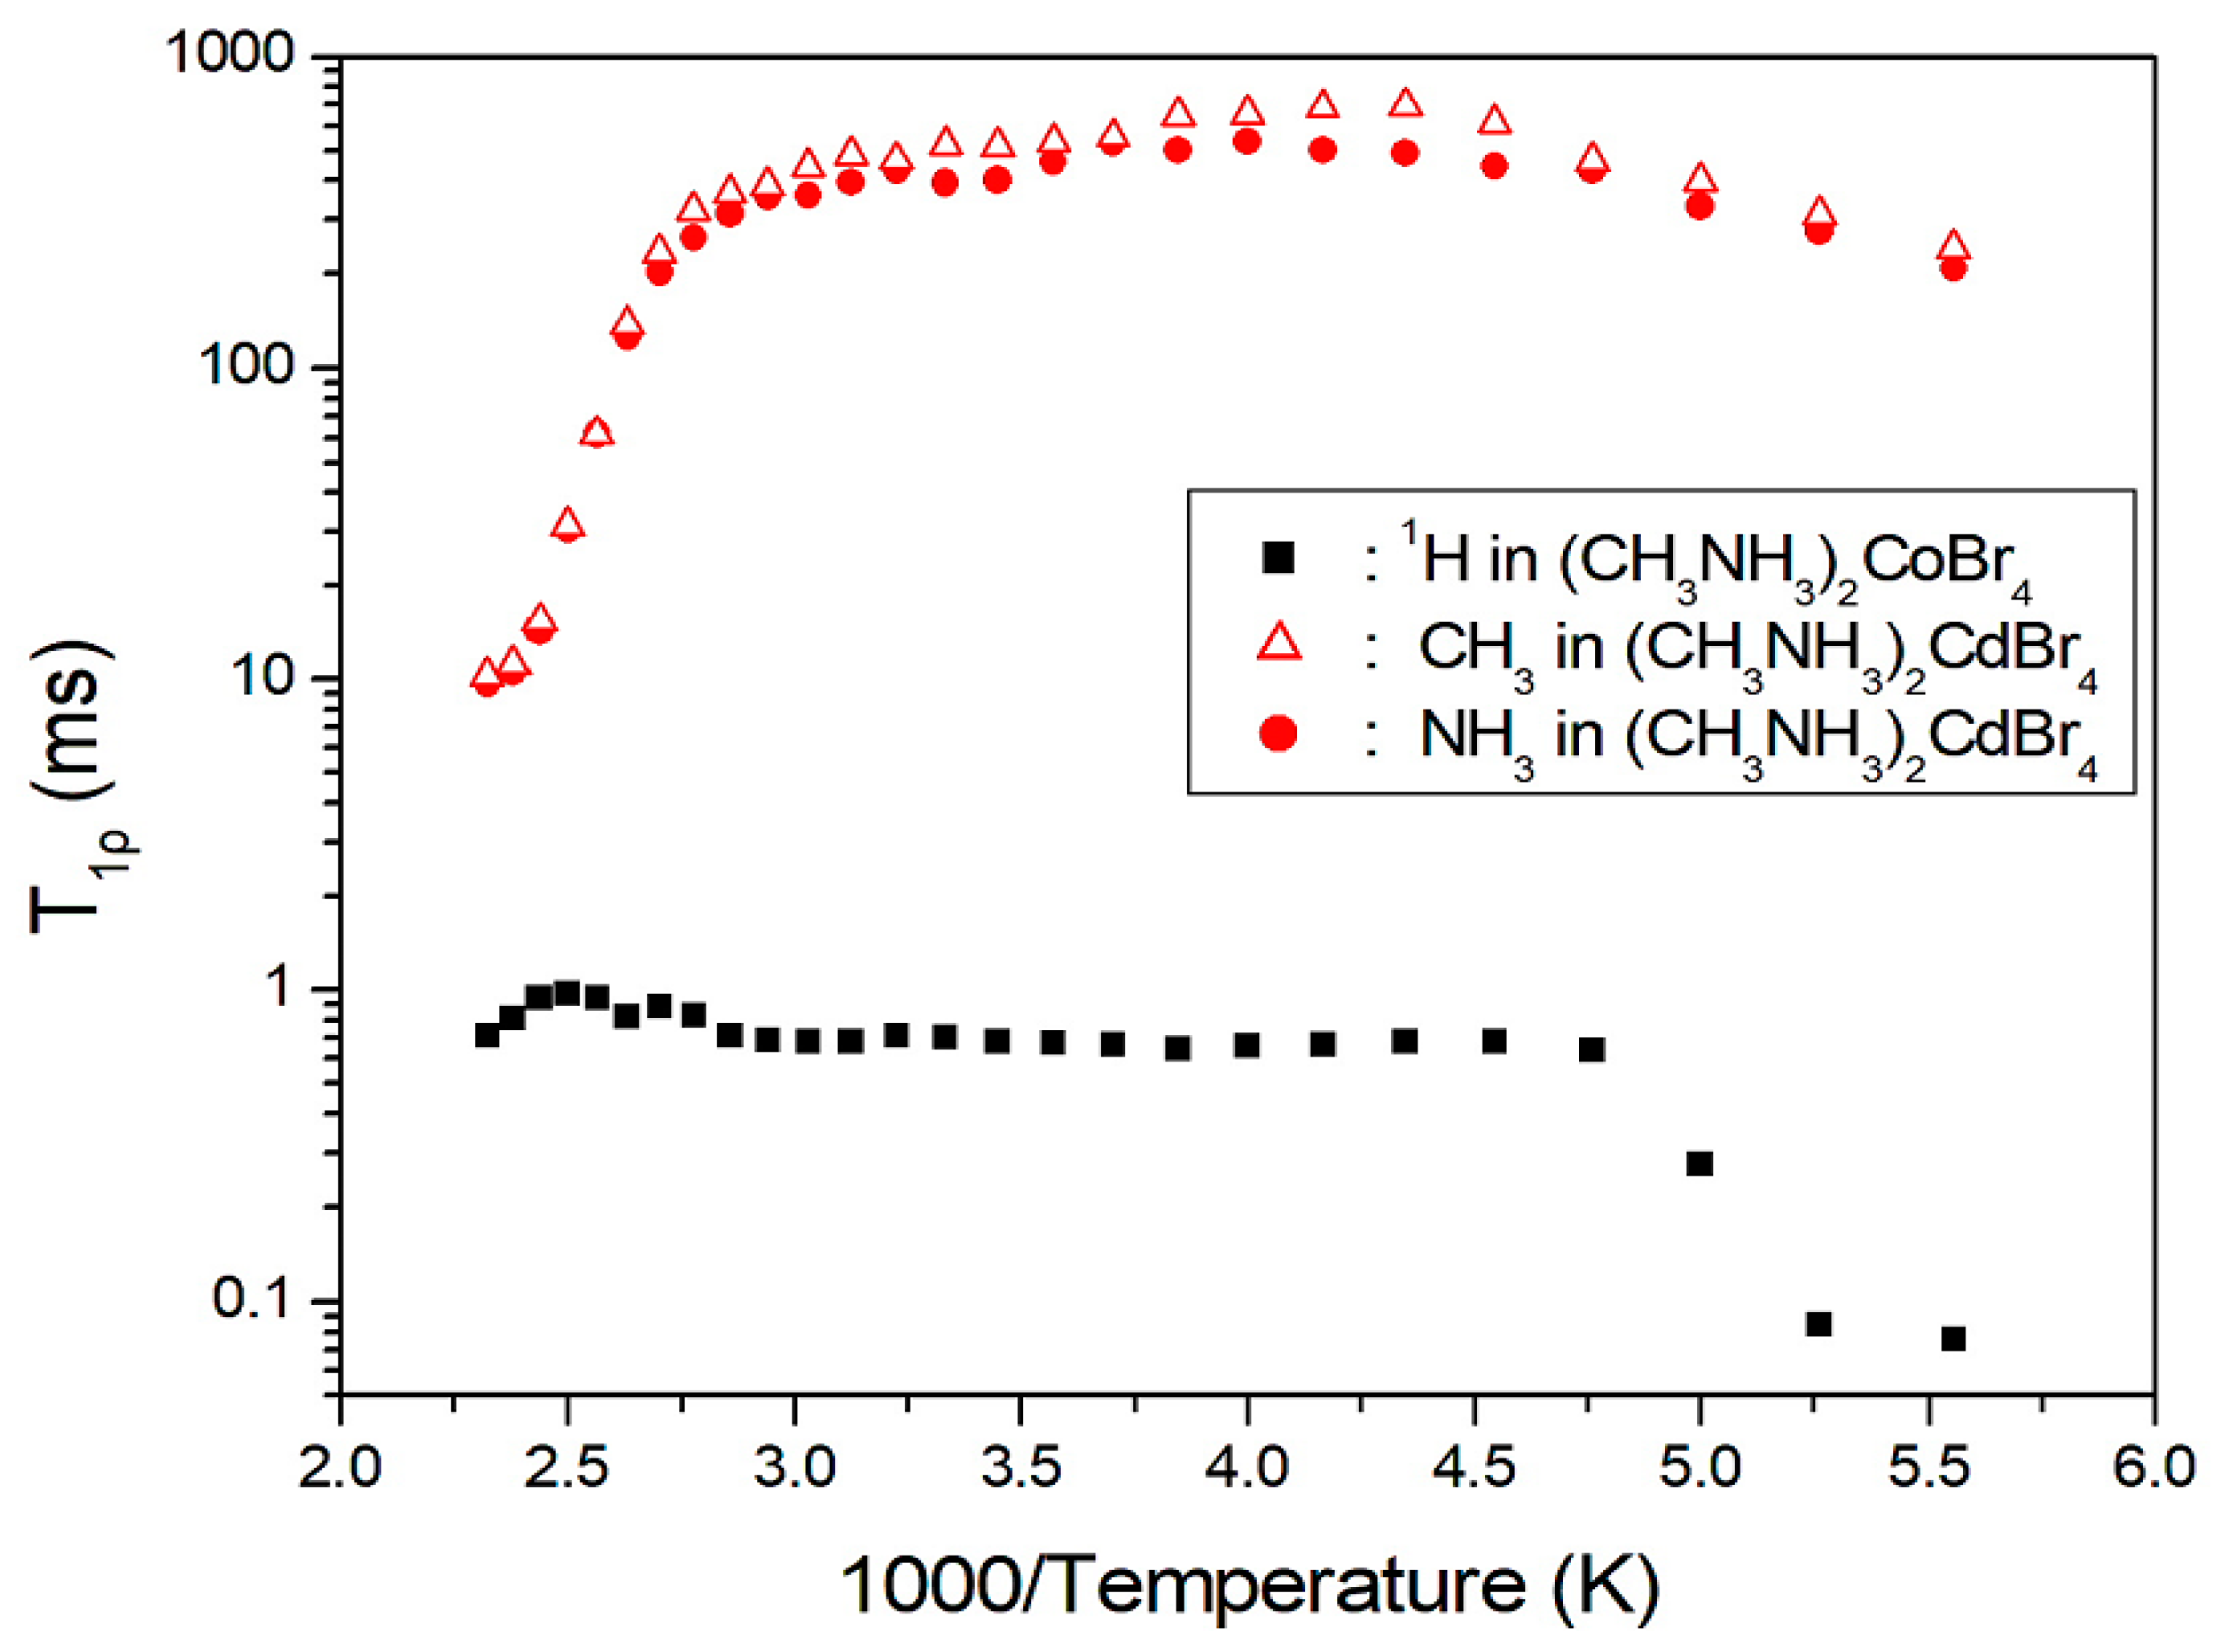
where P(τ) is the NMR signal intensity measured after recovery time τ, and P(0) is the total nuclear magnetization of the protons at thermal equilibrium. This analysis method is used to obtain the T1ρ values for the proton in the (CH3NH3)+ cations. However, the 1H T1ρ values for CH3 and NH3 are indistinguishable owing to the overlapping responses of the two protons. The 1H T1ρ values for (CH3NH3)2CoBr4 obtained herein and the corresponding values for (CH3NH3)2CdBr4 reported previously [17] are shown in Figure 5 as a function of the inverse temperature. In the case of (CH3NH3)2CoBr4, the 1H T1ρ values increased rapidly near 210 K, and those at high temperatures are almost continuous; the T1ρ value at 180 K is 76 μs and that at 300 K is 10 times longer than that at 180 K. The T1ρ value is very short at low temperatures, and thus indicates rapid energy transfer from the nuclear spin system to the surrounding environment. On the other hand, the 1H T1ρ values are obtained for each proton in CH3 and NH3 in the case of (CH3NH3)2CdBr4 as a function of reciprocal temperature. Herein, the T1ρ values for the two protons of the (CH3NH3)+ cations are nearly the same within experimental error. The T1ρ values of 1H in the CH3 and NH3 ions abruptly decrease at approximately 360 K. The 1H T1ρ value of (CH3NH3)2CoBr4 including the paramagnetic ions is very short, whereas that of (CH3NH3)2CdBr4 excluding paramagnetic ions is very long.
P(τ) = P(0) exp(−τ /T1ρ)
The local environment of the carbons in (CH3NH3)2CoBr4 was studied by 13C MAS NMR, and the corresponding 13C-NMR chemical shifts are shown in Figure 6. Attention was paid to 13C-NMR, which should be a sensitive probe of the local environment and of the cation dynamics.
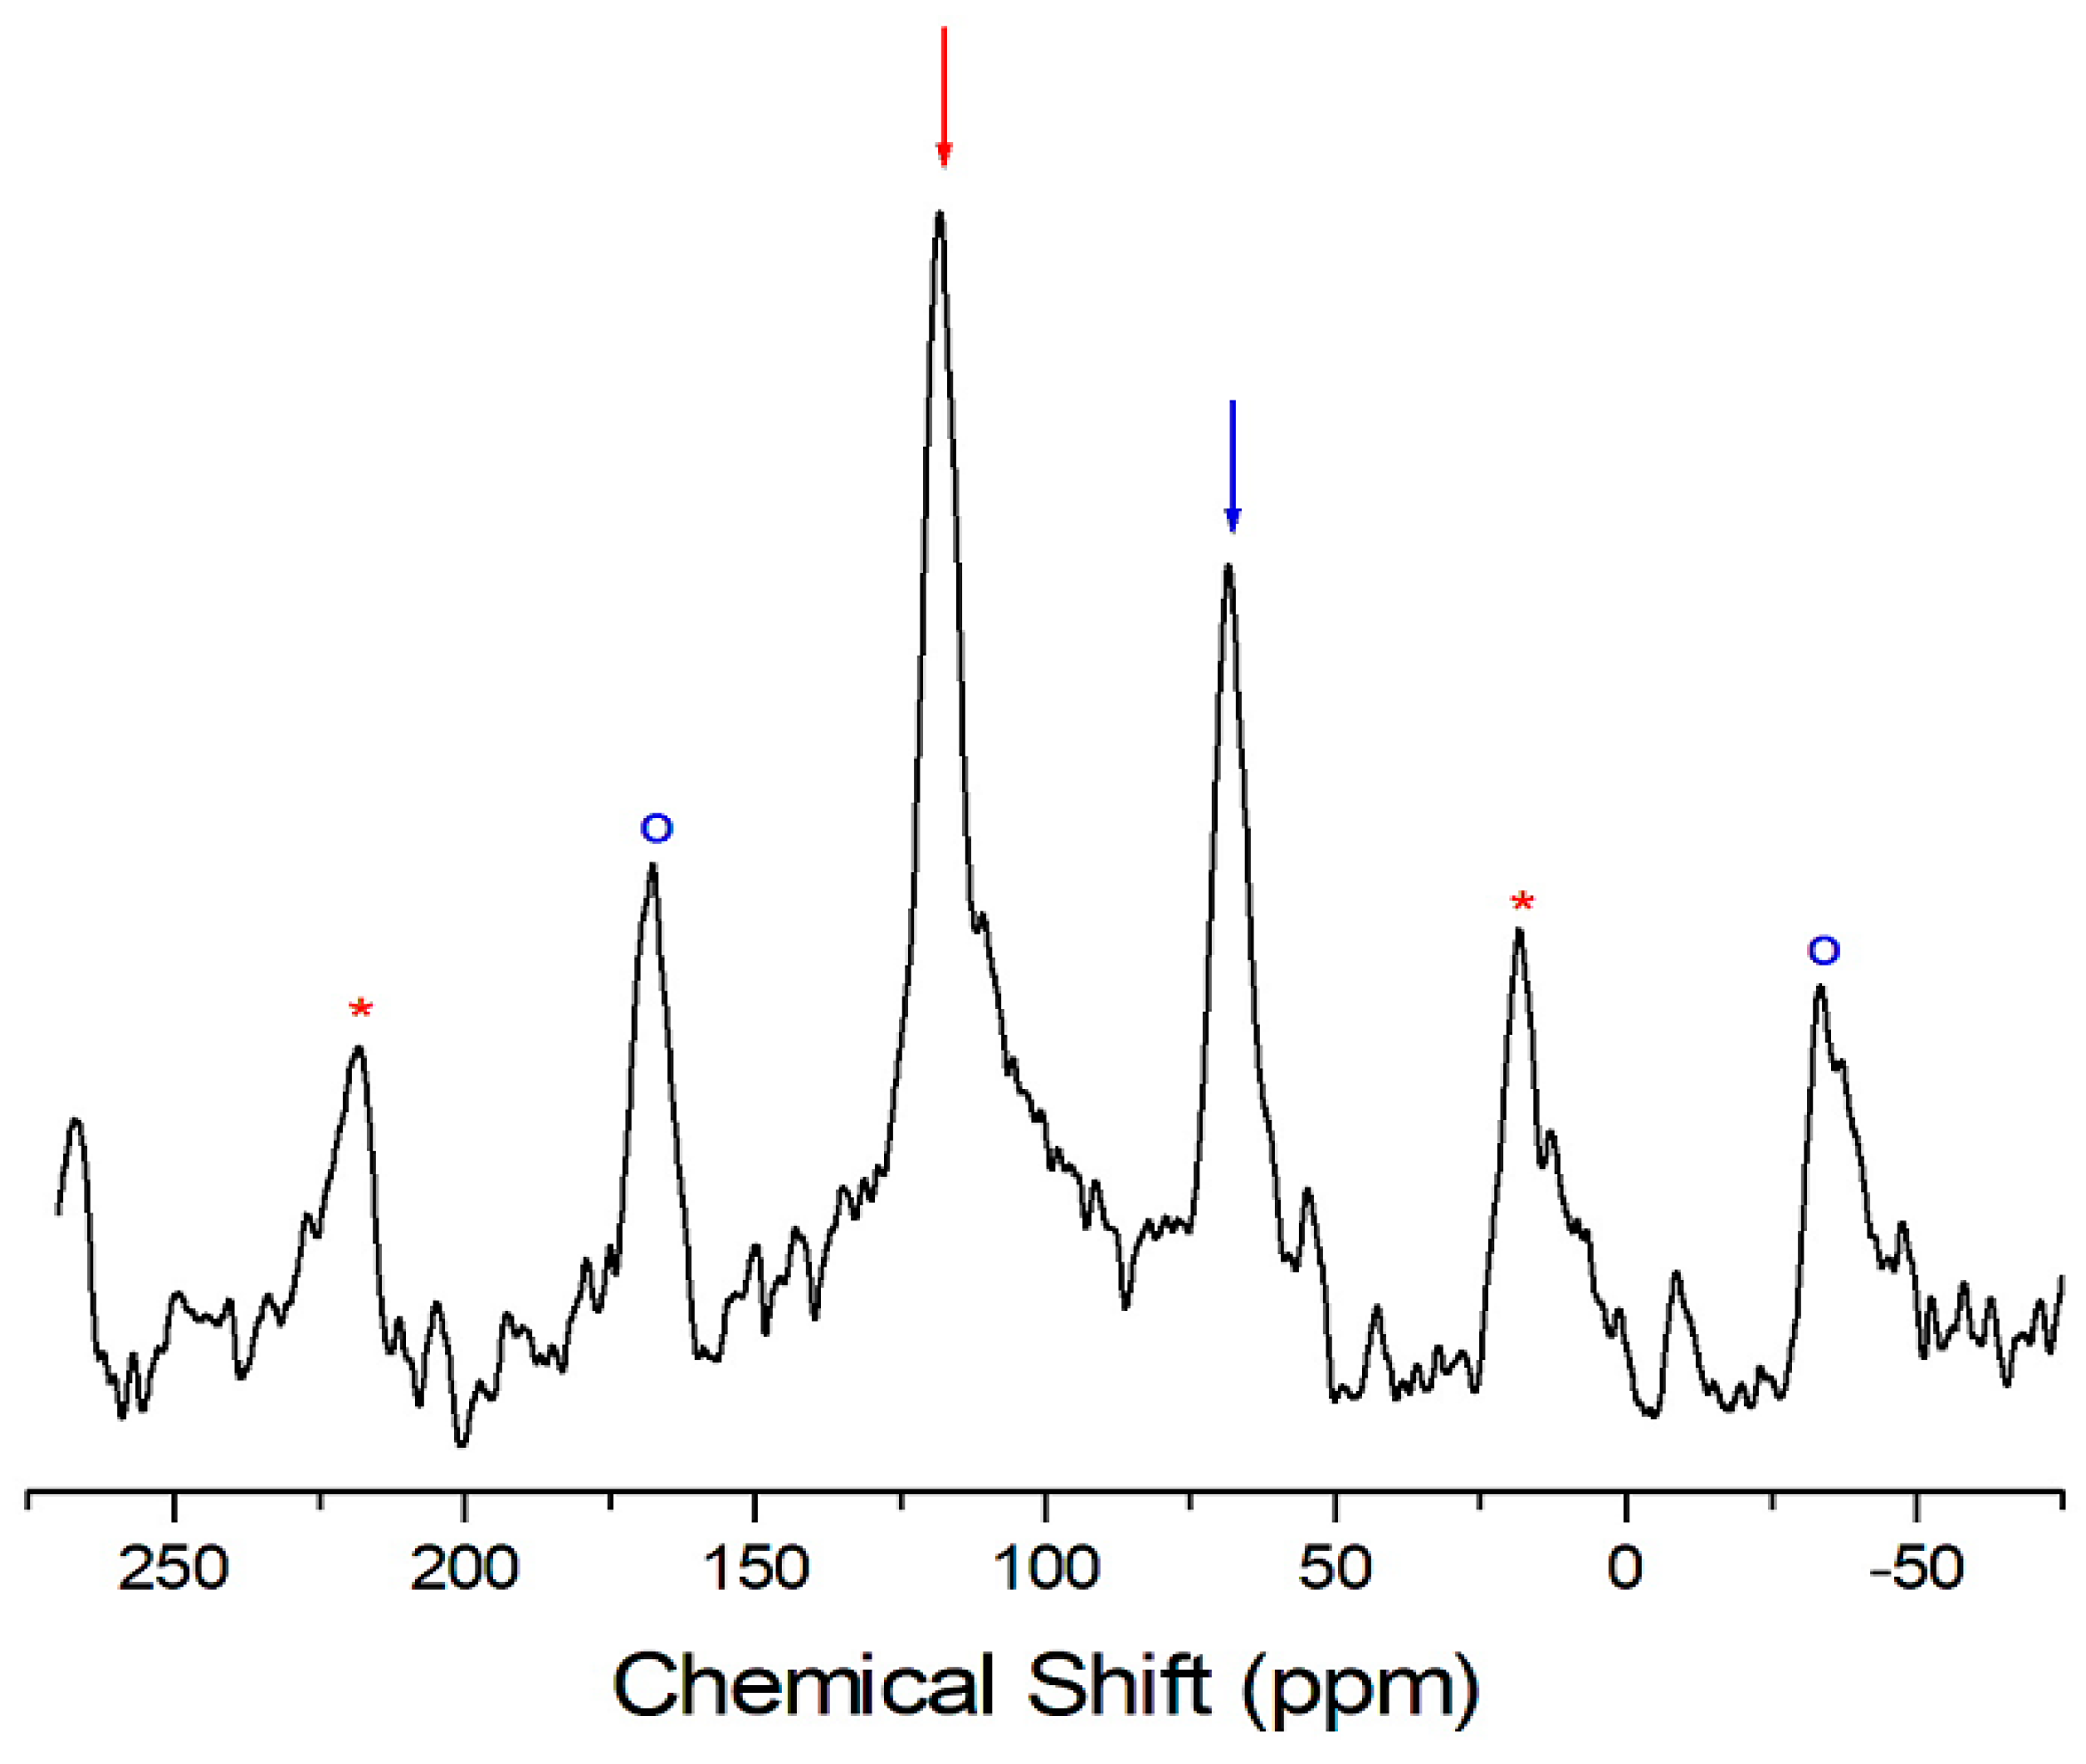
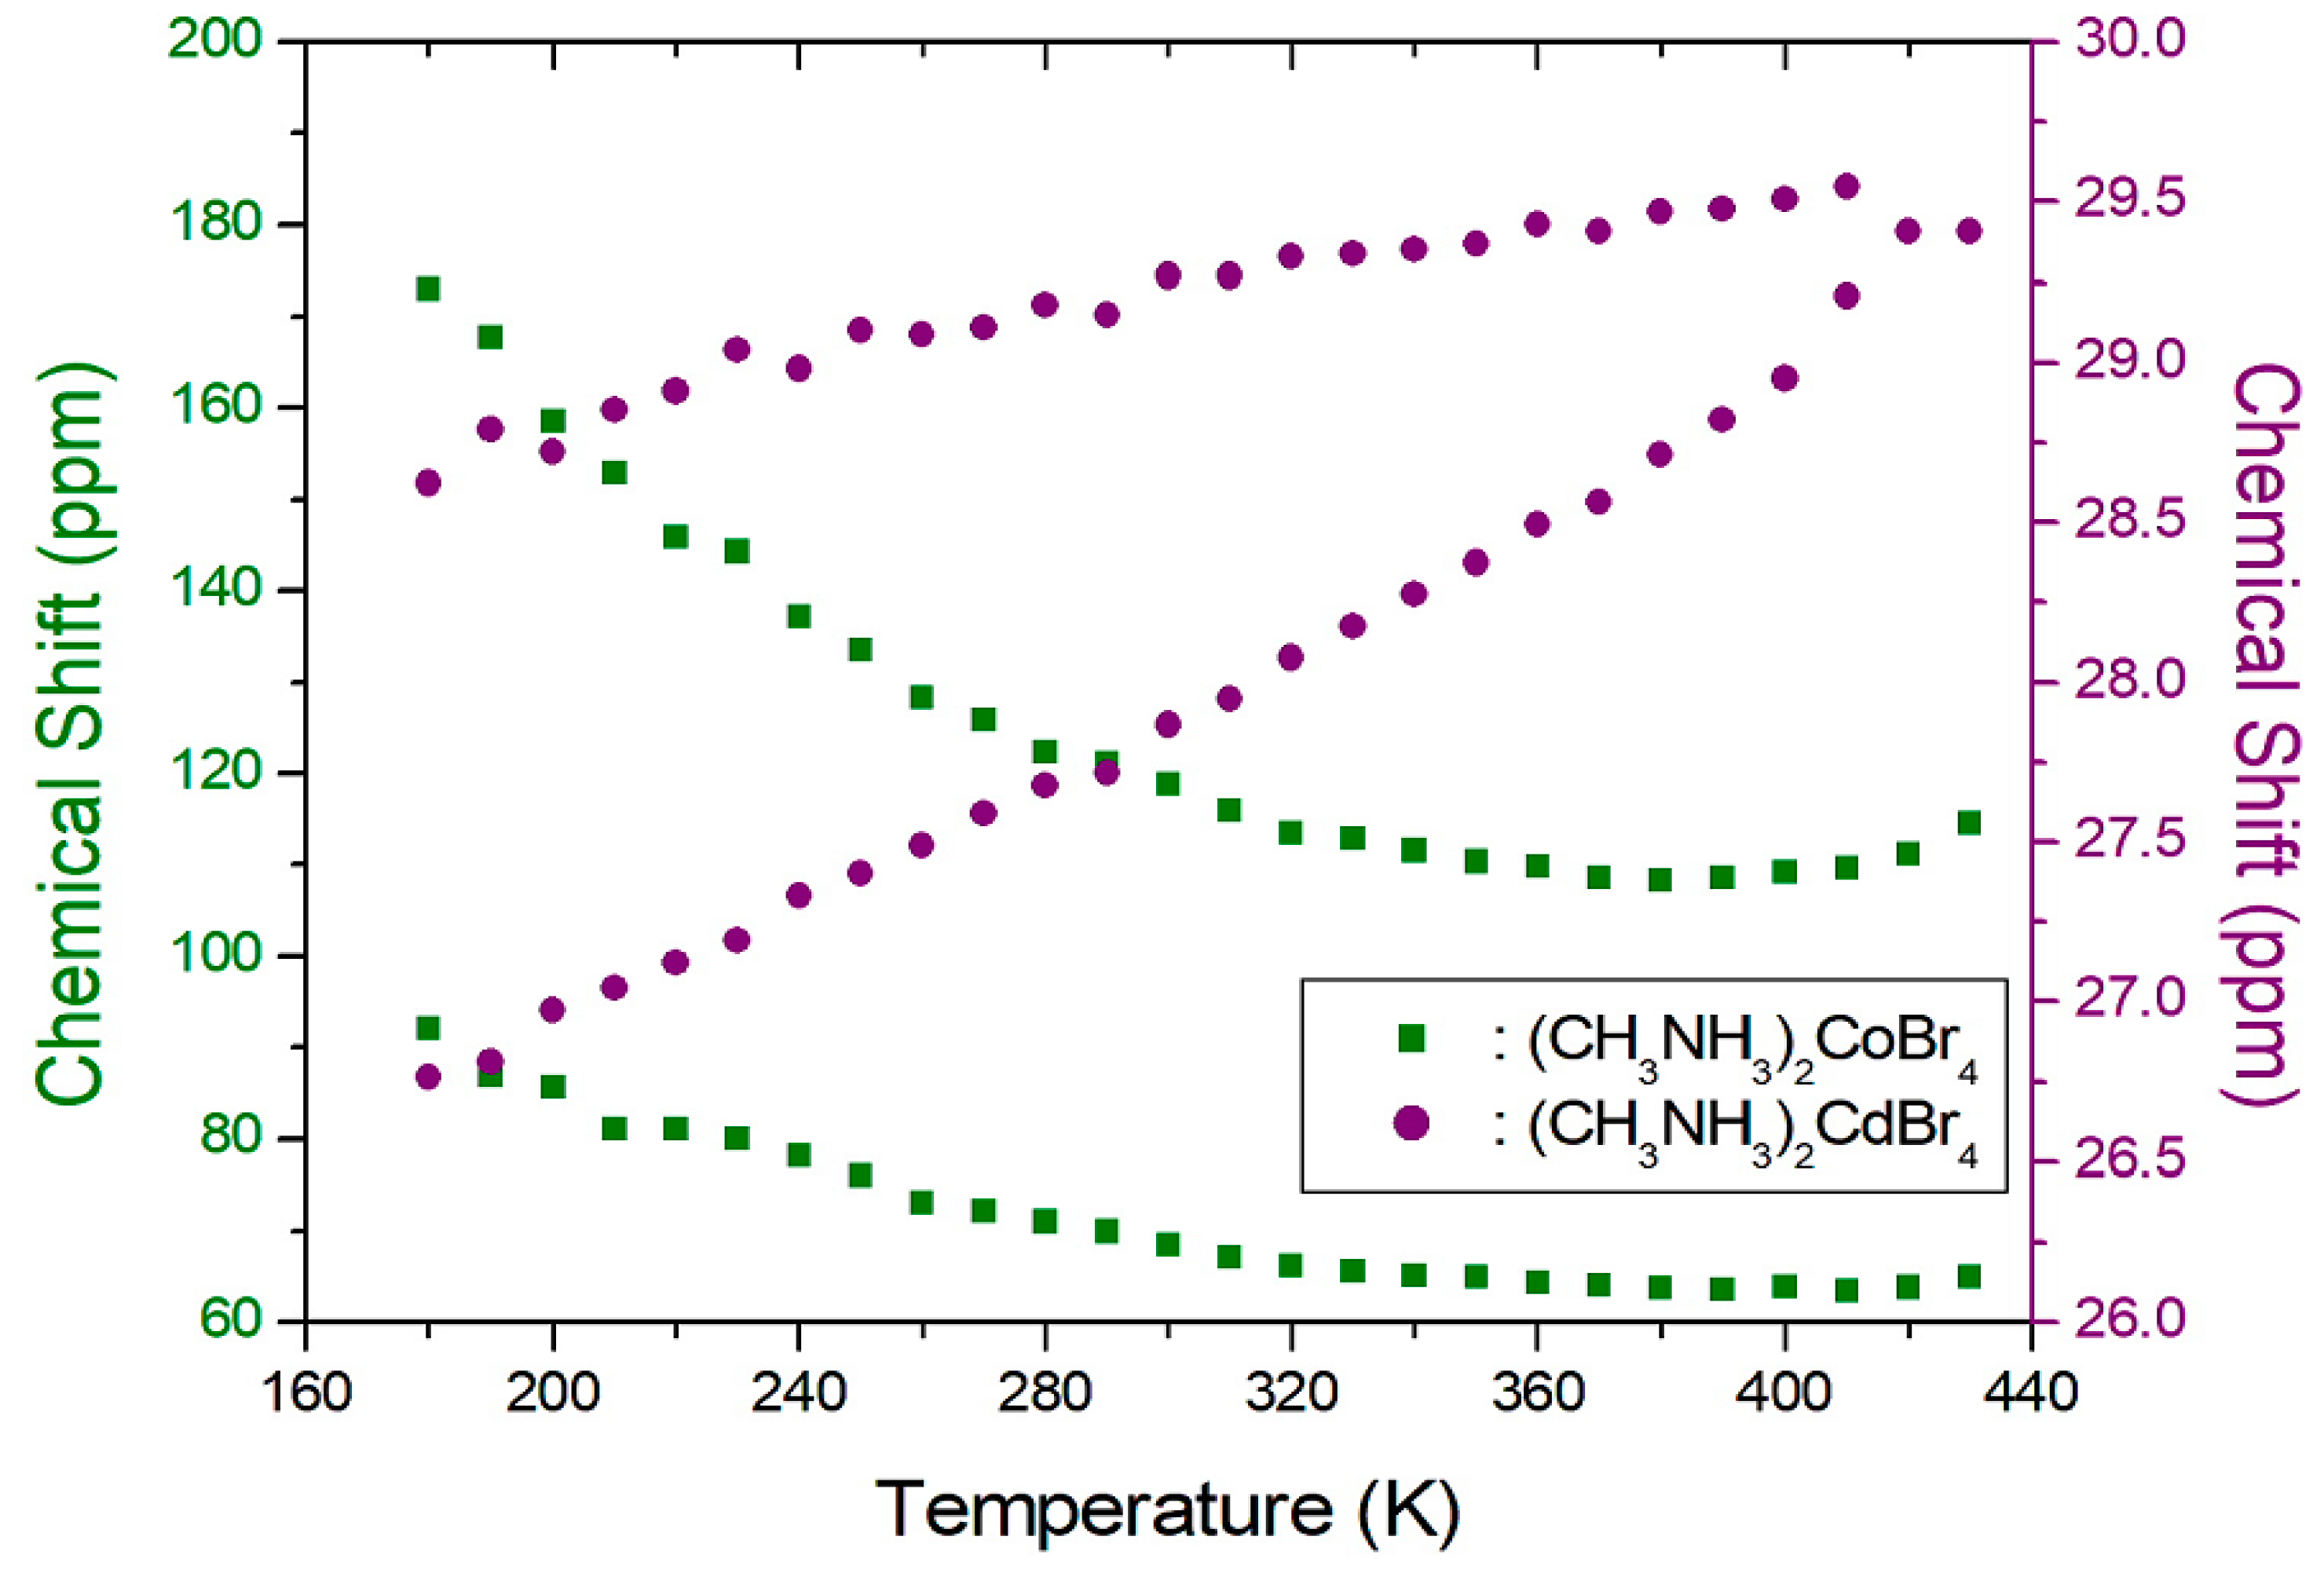
The 13C-NMR spectrum at 300 K in (CH3NH3)2CoBr4 shows two signals at the chemical shifts of δ = 68.3 ppm and δ = 117.9 ppm with respect to TMS [21]. The 13C-NMR spectrum consists of two lines that correspond to a-CH3 and b-CH3. The signals respectively represent the methyl carbons in the two crystallographically different a-CH3 and b-CH3. The 13C-NMR chemical shifts of the two compounds of (CH3NH3)2CoBr4 and (CH3NH3)2CdBr4 are shown in Figure 7 as a function of temperature. The 13C-NMR chemical shifts vary significantly with temperature. Specifically, the 13C-NMR chemical shifts in the case of (CH3NH3)2CoBr4 decrease slowly and monotonically as a function of temperature. Conversely, the 13C-NMR spectrum at 300 K in (CH3NH3)2CdBr4 shows two signals at chemical shifts of δ = 27.9 ppm and δ = 29.3 ppm. The 13C-NMR chemical shifts of the crystallographically different a-CH3 and b-CH3 slowly and monotonously increase as a function of temperature. The 13C chemical shifts of the CH3 groups differ between the two compounds. Generally, the paramagnetic contribution to the NMR shift is responsible for the NMR spectra. The 13C chemical shift of (CH3NH3)2CoBr4, which contains paramagnetic ions, was significantly different to that of (CH3NH3)2CdBr4, which does not contain paramagnetic ions. The differences in the 13C chemical shifts could potentially be due to differences in the electron structures of the metal ions.
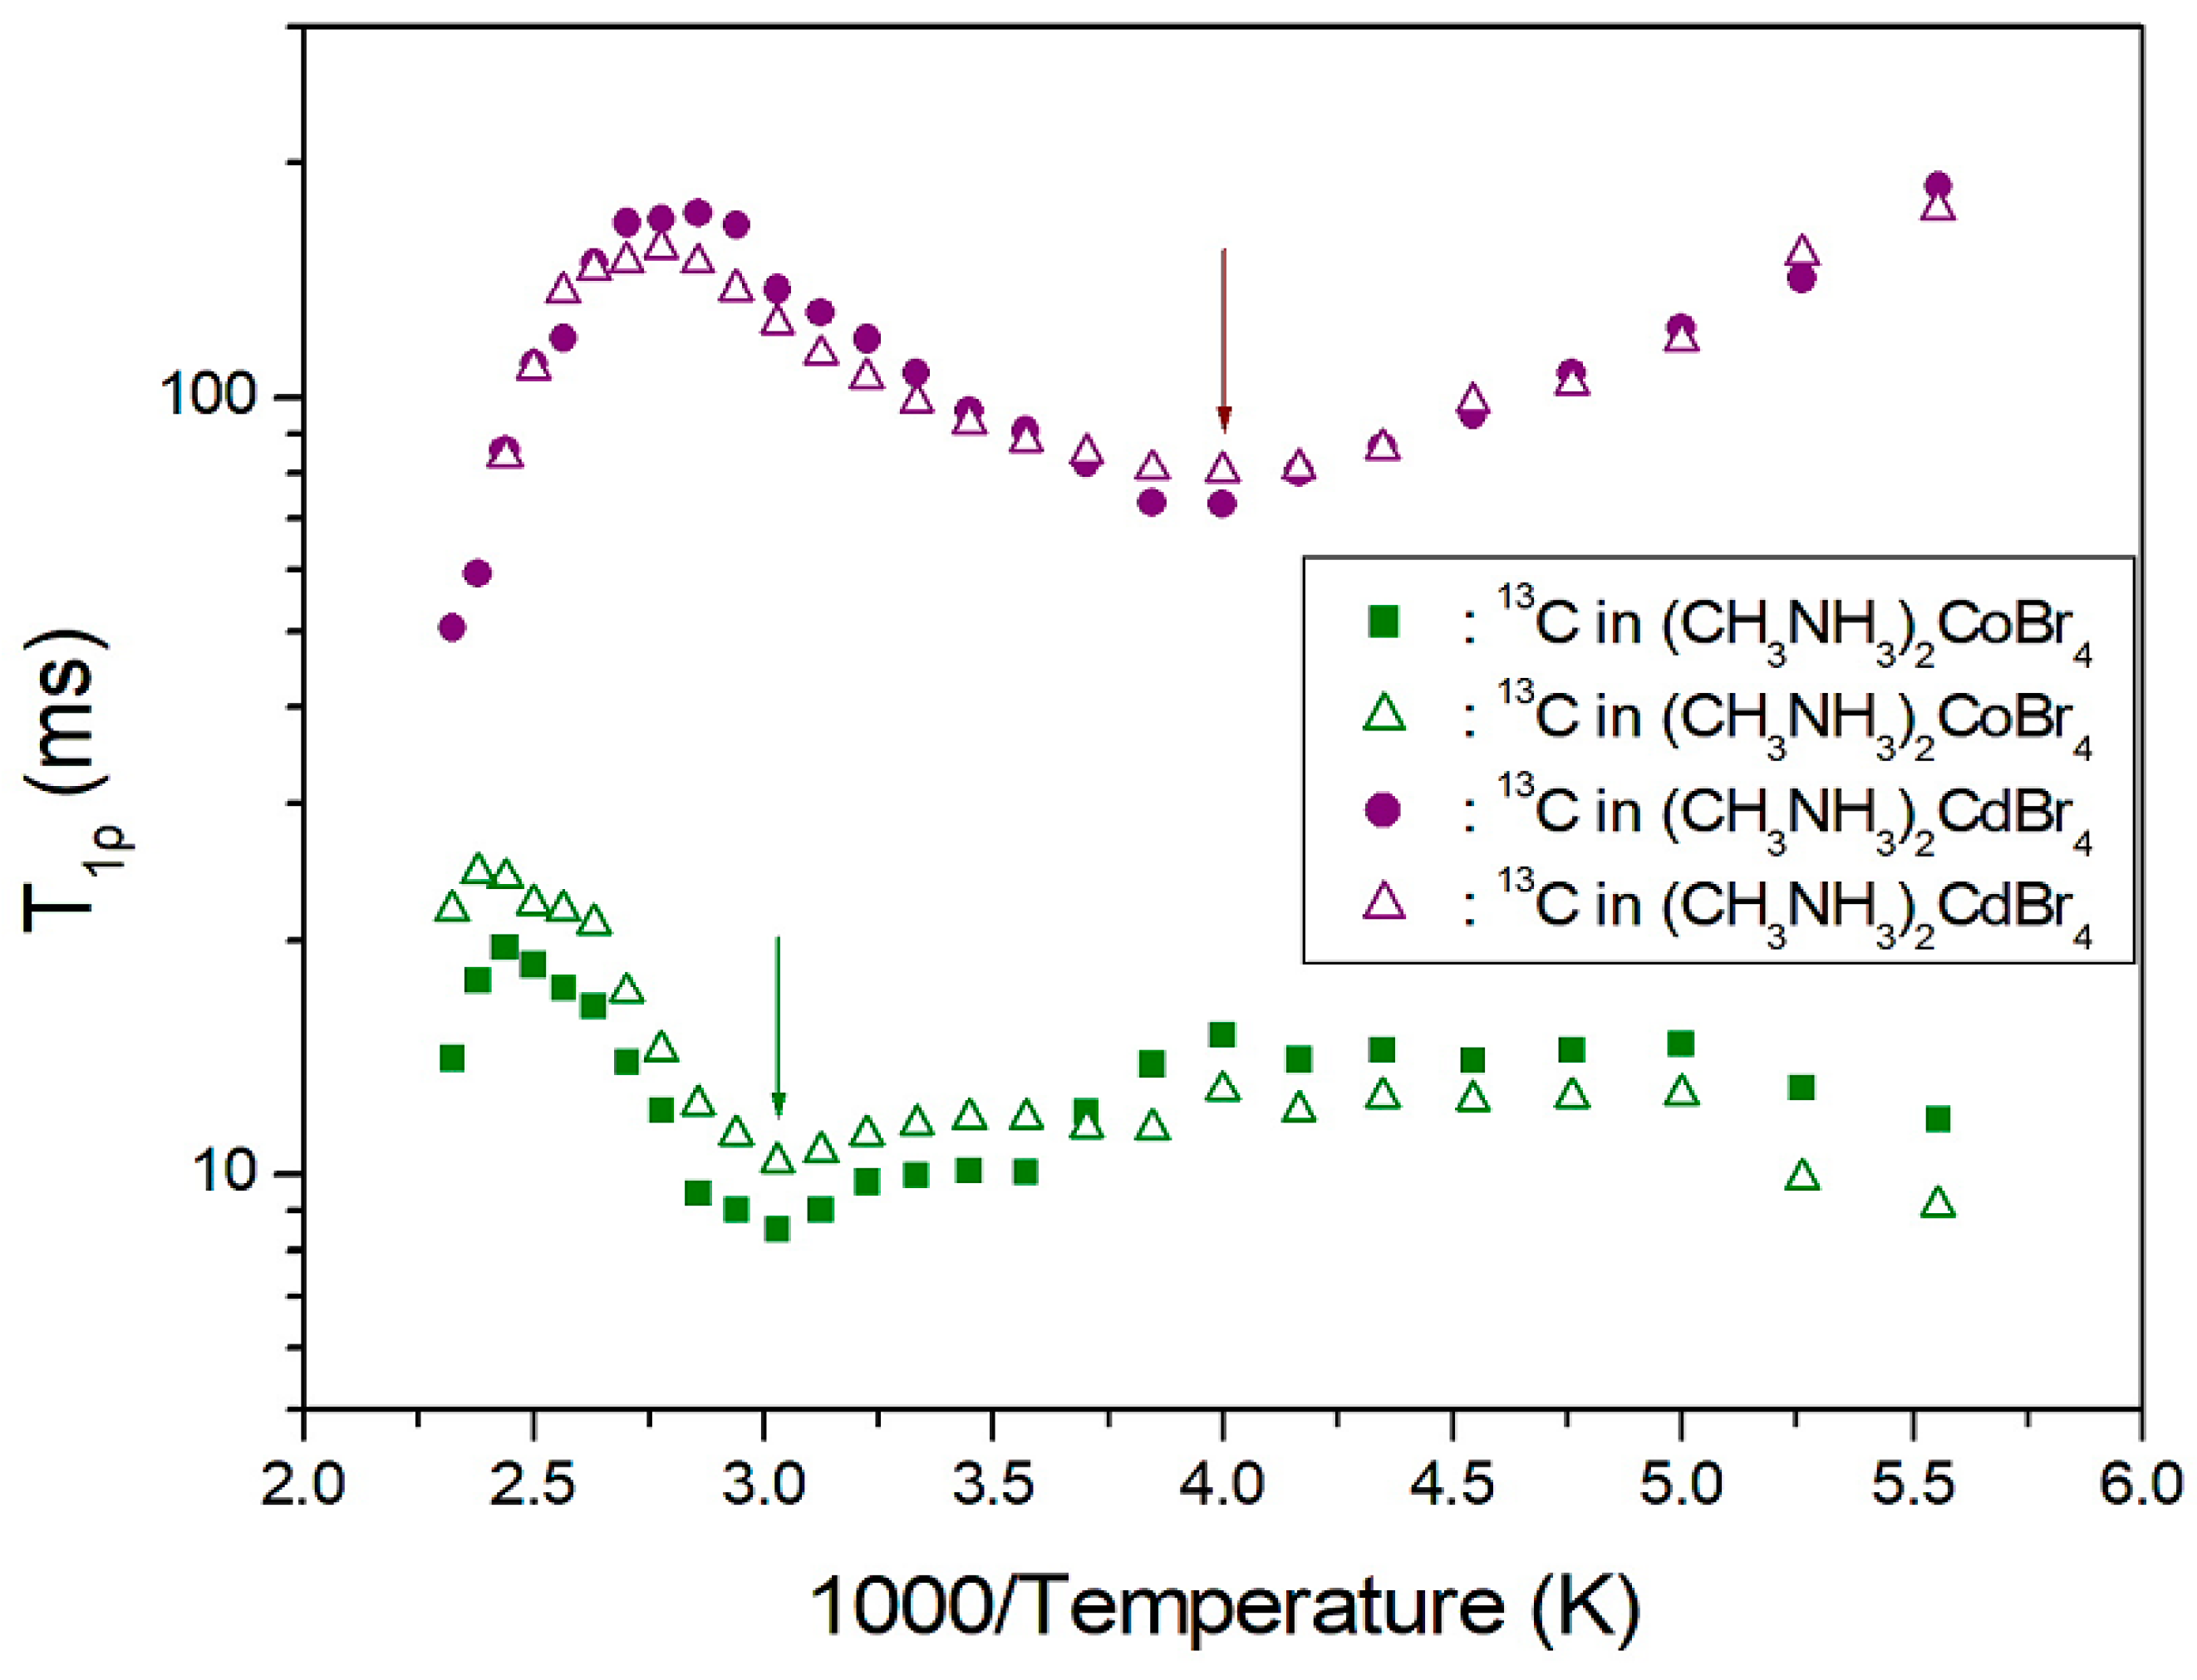
To determine the 13C T1ρ, nuclear magnetization was measured as a function of the delay time. The signal intensities of the nuclear magnetization recovery curves are fitted by the mono-exponential function of Equation (3). From these results, T1ρ values were obtained for the carbons in (CH3NH3)2CoBr4 and (CH3NH3)2CdBr4 as a function of the inverse temperature, as shown in Figure 8. In the case of (CH3NH3)2CoBr4, the T1ρ values of 13C show a minimum value near 330 K, while the T1ρ value abruptly decreases above 410 K. The T1ρ values for a-CH3 and b-CH3 are also very similar and of the order of 10 ms. Conversely, the variation of T1ρ with temperature in the case of (CH3NH3)2CdBr4 exhibits a minimum near 250 K for a-CH3 and b-CH3, respectively, and T1ρ decreases abruptly above 360 K. The presence of these minima are attributed to the effects of the reorientation of (CH3NH3)+ cations. From the 13C T1ρ curves, the relaxation processes of (CH3NH3)2CdBr4 are affected by molecular motion described by the Bloembergen–Purcell–Pound (BPP) theory [22]. The experimental values of T1ρ are explained by the correlation time τC for molecular motion based on the BPP theory [22,23],
where
(1/T1ρ) = 0.05(μo/4π)2[γH2 γC2 ħ2/r6][4Fa + Fb + 3Fc + 6Fd + 6Fe]
- Fa = τC/[1 + ω12τC2]
- Fb = τC/[1 + (ωH ‒ ωC)2τC2]
- Fc = τC/[1 + ωC2τC2]
- Fd = τC/[1 + (ωH + ωC)2τC2]
- Fe = τC/[1 + ωH2τC2].
where μo is the permeability, γH and γC are the respective gyromagnetic ratios for the 1H and 13C nuclei, r is the distance of H–C, ħ = h/2π, and ωH and ωC are the respective Larmor frequencies of 1H and 13C.
On the other hand, the relaxation processes of (CH3NH3)2CoBr4 with the paramagnetic Co2+ ions are affected by the molecular motion described by the Solomon equation [24]. When paramagnetic ions exist, the T1ρ are represented by τC, as presented in [24]
where
(1/T1ρ) = (1/15)(μo/4π)2[γI2γe2μB2S(S+1)/r6][4Ga + Gb + 3Gc + 6Gd + 6Ge]
- Ga = τC/[1 + ω12τC2]
- Gb = τC/[1 + (ωC ‒ ωe)2τC2]
- Gc = τC/[1 + ωC2τC2]
- Gd = τC/[1 + (ωC + ωe)2τC2]
- Ge = τC/[1 + ωe2τC2].
Here, γe is the gyromagnetic ratio of the electron, S is the total spin quantum number of the paramagnetic ion, and ωe is the Larmor frequency of the electron. Additionally, ω1 is the angular frequency at the spin-lock field; 59.52 kHz for (CH3NH3)2CoBr4 and 67.56 kHz for (CH3NH3)2CdBr4. The T1ρ exhibits a minimum when ω1τC = 1. Based on this condition, the coefficients of Equations (4) and (5) which are dependent on ω1, ωH, and ωC, can be obtained. Furthermore, the value of τC can be calculated, and its temperature dependence follows a simple Arrhenius expression [22] according to,
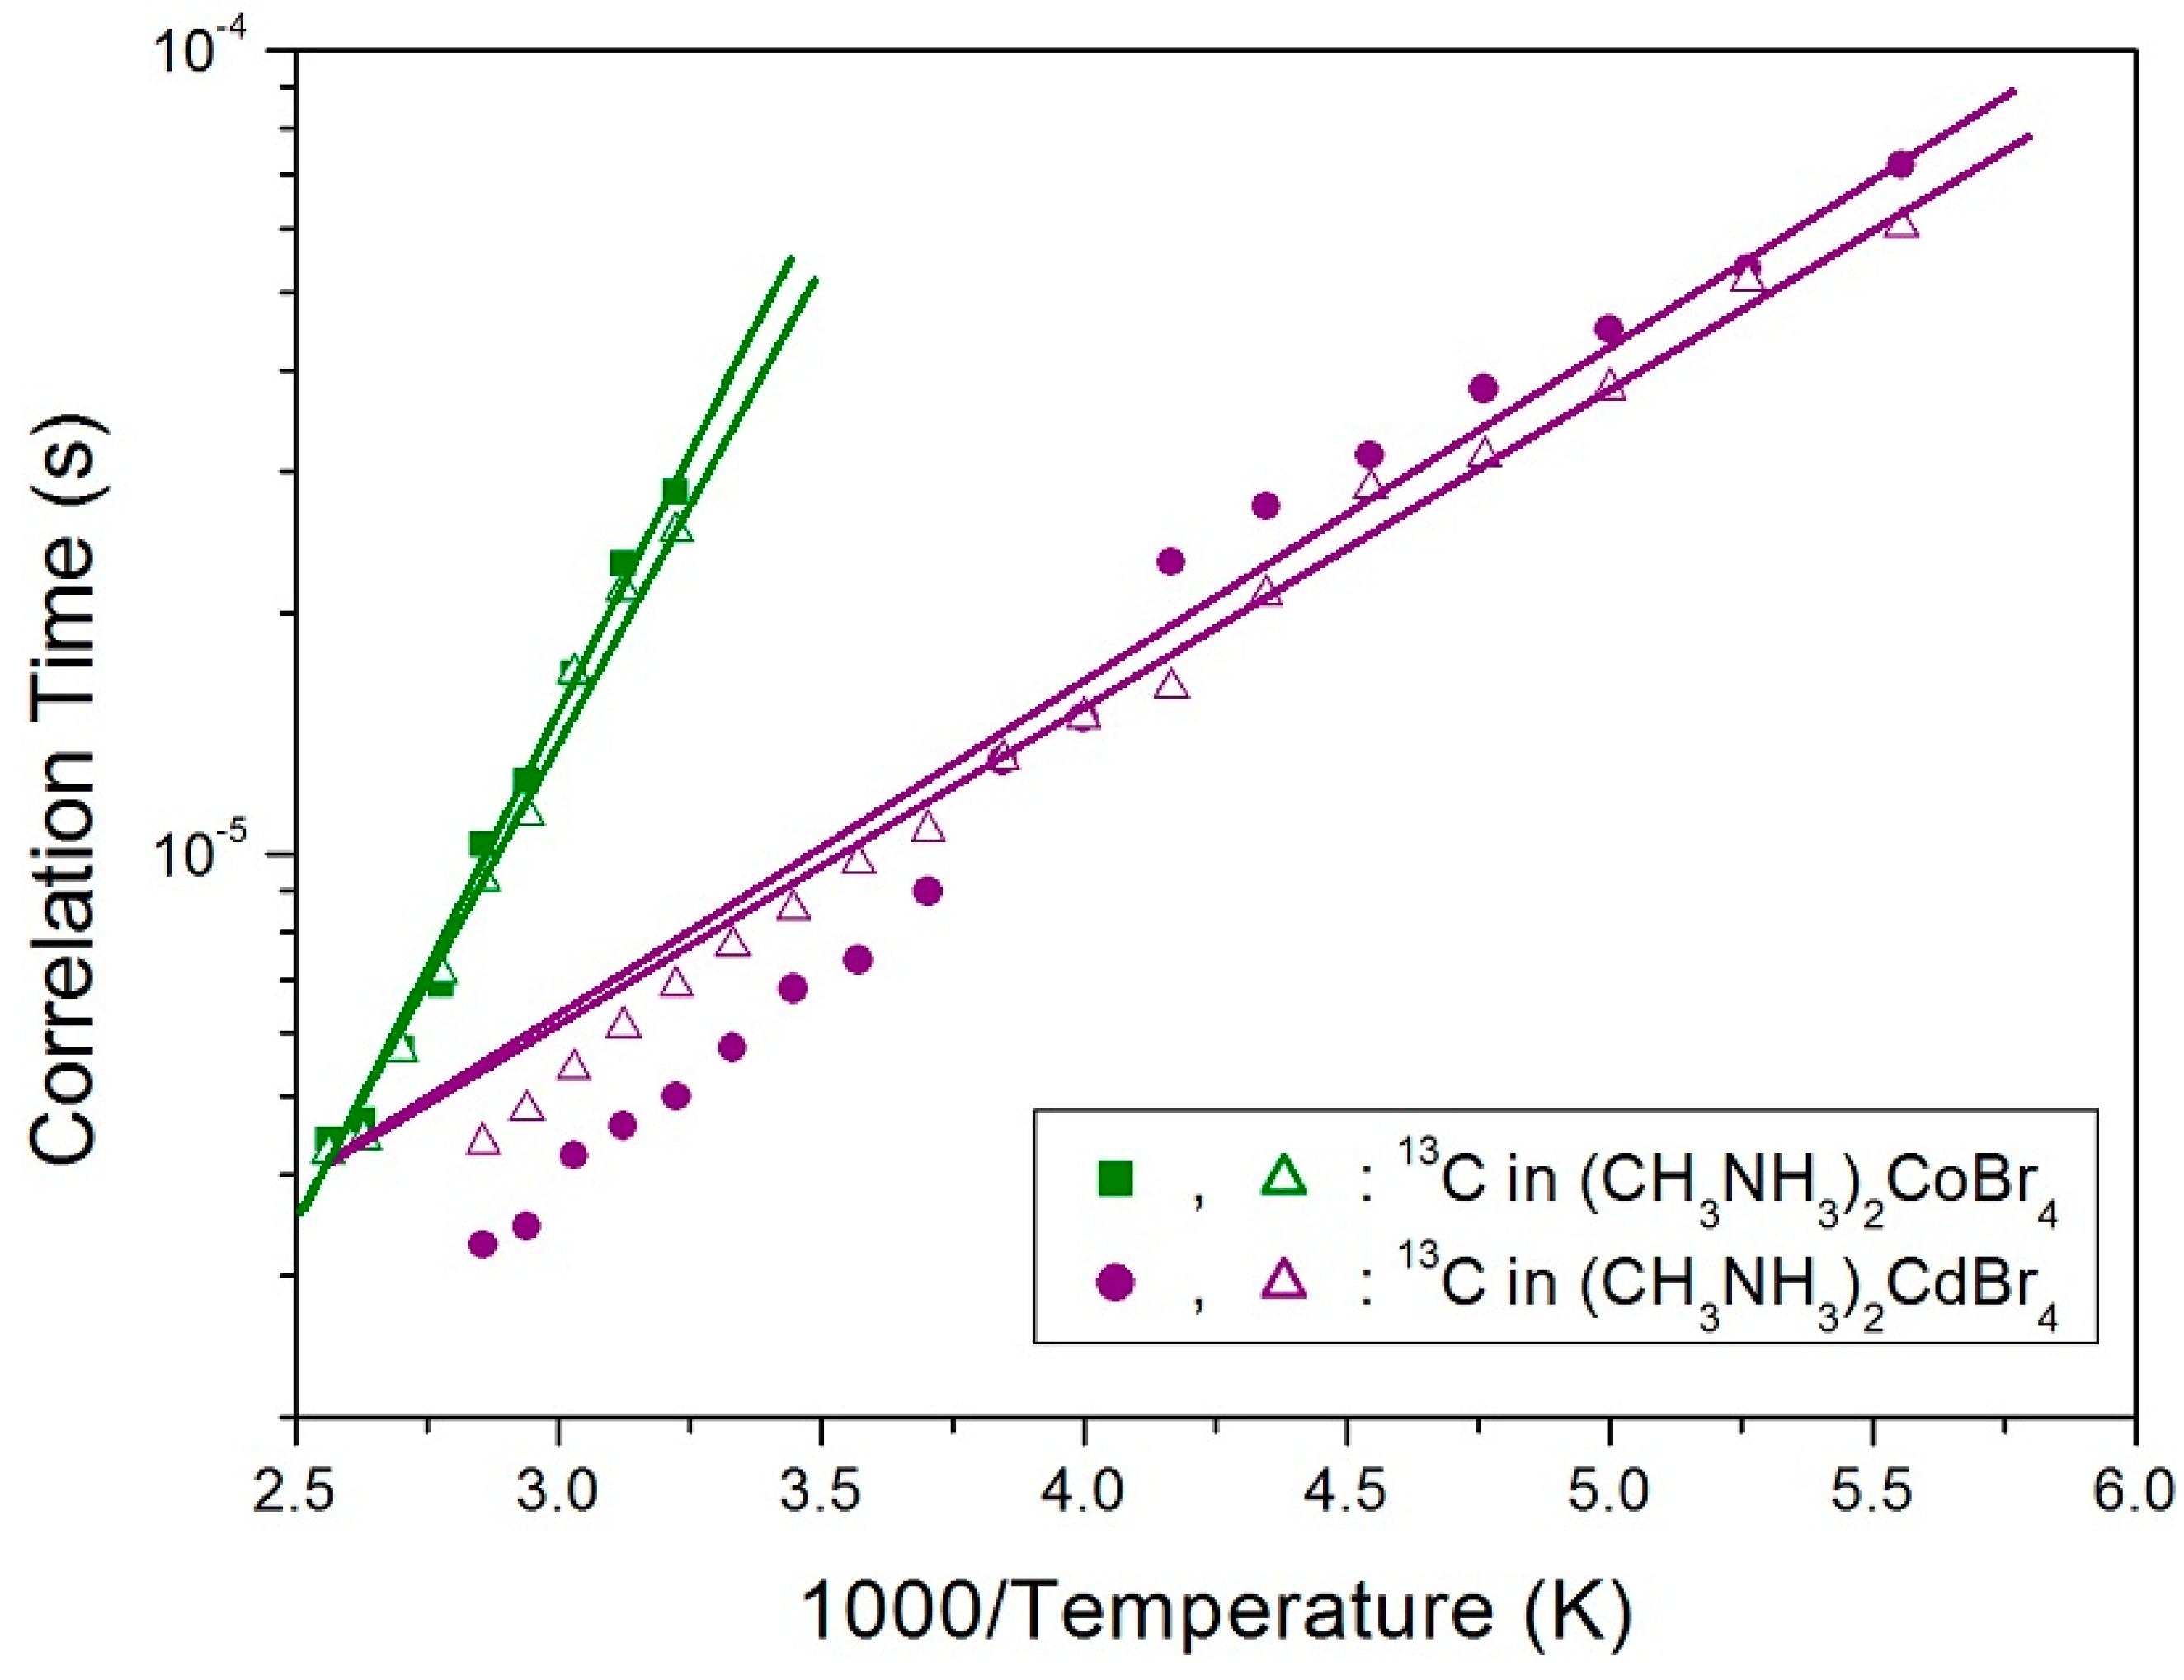
where τo is the preexponential factor, T is the temperature, R is the gas constant, and Ea is the activation energy. The activation energies for the tumbling motion of a-CH3 and b-CH3 in the case of (CH3NH3)2CoBr4 are obtained from the log τC vs. 1000/T curve, and are respectively equal to 24.51 ± 0.99 kJ/mol and 23.25 ± 1.30 kJ/mol, whereas the corresponding values in the case of (CH3NH3)2CdBr4 are 8.18 ± 0.37 kJ/mol and 7.65 ± 0.21 kJ/mol (see Figure 9). When paramagnetic Co2+ ions exist, 1/τC = 1/τr + 1/τM + 1/τe, where τr, τM, and τe, are the rotational correlation time, exchange correlation time, and electronic relaxation correlation time, respectively. The τr can represent molecular motion. For (CH3NH3)2CdBr4, there is no chemical exchange or paramagnetic terms, and so τC can directly reflect the molecular motion. In the case of (CH3NH3)2CoBr4, τe dominates the total correlation time, and thus, τC is not directly related to molecular motion.
τC = τoexp(−Ea/RT)
3. Materials and Methods
The (CH3NH3)2CoBr4 single crystals were grown based on the slow evaporation of an aqueous solution with a 2:1 ratio of CH3NH2∙HBr and CoBr2 at 300 K. Single crystals have a diamond shape and seagrass color.
The thermal properties and phase transition temperature were measured using a TGA (TA, DSC 25) instrument at a heating rate of 10 °C/min. The TGA and DSC curves were measured in an N2 atmosphere, and the mass of the powder sample used in the experiment was 9.22 mg.
The solid-state MAS NMR spectra and the spin–lattice relaxation time T1ρ in the rotating frame of (CH3NH3)2CoBr4 crystals were recorded on a Bruker 400 DSX NMR spectrometer (Bruker, Leipzig, Germany) at the Korean Basic Science Institute at the Western Seoul Center. Solid samples were inserted into 4 mm diameter zirconia rotors. The samples were spun at a sufficient speed to avoid spinning sidebands overlapping. The chemical shifts were defined with respect to tetramethylsilane (TMS). The 1H T1ρ values were measured using a π/2-τ pulse sequence by varying the duration of the spin-locking pulses. The 13C T1ρ values were measured based on the variation of the duration of the 13C spin-locking pulse. The usual experimental approach assumes the use of cross-polarization from protons to enhance the 13C sensitivity. The widths of the π/2 pulses for 1H and 13C were 4.1 μs and 4.2 μs, respectively. The T1ρ values were measured in the temperature range of 180–430 K due to limitations of the experimental equipment associated with the measurements of the spectra and T1ρ outside of this range. The sample temperatures were held constant by controlling the helium gas flow and the heater current [25,26].
4. Conclusions
The thermal properties and phase transition temperature of (CH3NH3)2CoBr4 crystals grown based on the slow evaporation method were investigated with TGA, DSC, and optical polarizing microscopy. The phase transition and partial decomposition temperatures were observed at 460 K and 572 K, respectively. The high-temperature phenomenon above 572 K was not related to a physical change like the structural phase transition. Instead, it was related to a chemical change, such as thermal decomposition.
The paramagnetic interactions of (CH3NH3)2CoBr4, associated with the role of the (CH3NH3)+ cations were studied by 1H-NMR and 13C-NMR as a function of temperature. The 1H and 13C MAS NMR were used to probe the dynamics of cations in (CH3NH3)2CoBr4 and (CH3NH3)2CdBr4. The chemical shift by the MAS NMR depended on the local field at the site of the resonating nucleus in crystals. The effect of these crystals on the 1H and 13C-NMR chemical shifts was investigated using temperature-dependent NMR experiments. The contributions to the 13C-NMR chemical shifts are correlated with the distribution of spin density in the ligand moiety.
The temperature dependence of the T1ρ values for 1H reflect the modulation of the inter-NH3 and inter-CH3 dipolar interactions due to the (CH3NH3)+ cations. The variation of T1ρ for 13C yielded a minimum, and it is apparent that the T1ρ values for 13C are governed by tumbling motions. Moreover, the paramagnetic dopant led to the shortening of their T1ρ values. Accordingly, it has been shown that the T1ρ value is inversely proportional to the square of the magnetic moment of the paramagnetic ion [27]. The T1ρ values of 1H and 13C of the (CH3NH3)2CoBr4 crystals, which contain paramagnetic ions, are much shorter than those of the (CH3NH3)2CdBr4 crystals, which do not contain paramagnetic ions.
The (CH3NH3)2CoBr4 and (CH3NH3)2CdBr4 crystals are of the (CH3NH3)2MX4 type, whereas their individual dynamics differ significantly from the dynamic of the cations. The differences between the T1ρ of the (CH3NH3)2MBr4 crystals (M = Co and Cd) are due to the differences between the electron structures of their Co2+ and Cd2+ ions. These ions screen the nuclear charge from the motion of the outer electrons. The Co2+ has unpaired d electrons, whereas Cd2+ has filled d shells. Their NMR properties stem from the differences between the chemical properties of paramagnetic Co2+ and non-paramagnetic Cd2+ ions. Furthermore, the NMR relaxation of diamagnetic Cd2+ ions is most probably driven by dipolar interactions, whereas the relaxation of paramagnetic Co2+ ions is mostly driven by interactions with the paramagnetic center.
Author Contributions
A.R.L. interpreted the TGA, DSC, NMR measurements, and designed the research and wrote the manuscript. S.H.K. performed the NMR experiments.
Funding
This research was supported by the Basic Science Research program through the National Research Foundation of Korea (NRF), funded by the Ministry of Education (2018R1D1A1B07041593).
Conflicts of Interest
The authors declare no conflict of interest.
References
- Chen, Y.; Li, L.; Yerramilli, A.S.; Qu, W.; Song, Y.; Li, N.; Shen, Y.; Alford, T.L. Introduction of nitrogen gas flow and precursor aging process to improve the efficiency of the lead acetate derived CH3NH3PbI3 perovskite solar cells. Sol. Energy Mater. Sol. Cells. 2019, 190, 49–56. [Google Scholar] [CrossRef]
- Elseman, A.M.; Shalan, A.E.; Sajid, S.; Rashad, M.M.; Hassan, A.M.; Li, M. Copper-substituted lead perovskite materials constructed with different halides for working (CH3NH3)2CuX4-based perovskite solar cells from experimental and theoretical view. ACS Appl. Mater. Interfaces. 2018, 10, 11699. [Google Scholar] [CrossRef] [PubMed]
- Aramburu, J.A.; Garcia-Fernandez, P.; Mathiesen, N.R.; Garcia-Lastra, J.M.; Moreno, M. Changing the usual interpretation of the structure and ground state of Cu2+-layered perovskites. J. Phys. Chem. C 2018, 122, 5071–5082. [Google Scholar] [CrossRef]
- Ahmad, K.; Ansari, S.N.; Natarajan, K.; Mobin, S.M. Design and synthesis of 1D-polymeric chain based [(CH3NH3)3Bi2Cl9]n perovskite: A new light absorber material for lead free perovskite solar cells. Solar Cell 2018, 1, 2405–2409. [Google Scholar] [CrossRef]
- Kubicki, D.J.; Prochowicz, D.; Hofstetter, A.; Pechy, P.; Zakeeruddin, S.M.; Gratzel, M.; Emsley, L. Cation dynamics in mixed-cation (MA)x(FA)1-xPbI3 hybrid perovskites from solid-state NMR. J. Am. Chem. Soc. 2017, 139, 10055–10061. [Google Scholar] [CrossRef] [PubMed]
- Jahandar, M.; Heo, J.H.; Song, C.E.; Kong, K.J.; Shin, W.S.; Lee, J.C.; Im, S.H.; Moon, S.J. Highly efficient metal halide substituted CH3NH3I(PbI2)1-x(CuBr2)x planar perovskite solar cells. Nano Energy 2016, 27, 330–339. [Google Scholar] [CrossRef]
- Novotny, J.; Sojka, M.; Komorovsky, S.; Necas, M.; Marek, R. Interpreting the paramagnetiC-NMR spectra of potential Ru(III) metallodrugs: Synergy between experiment and relativistic DFT calculations. J. Am. Chem. Soc. 2016, 138, 8432–8445. [Google Scholar] [CrossRef]
- Cui, X.P.; Jiang, K.J.; Huang, J.H.; Zhang, Q.Q.; Su, M.J.; Yang, L.M.; Song, Y.L.; Zhou, X.Q. Cupric bromide hybrid perovskite heterojunction solar cells. Synthetic Metals 2015, 209, 247–250. [Google Scholar] [CrossRef]
- Chen, Q.; Marco, N.D.; Yang, Y.; Song, T.B.; Chen, C.C.; Zhau, M.; Hong, Z.; Zhou, H.; Yang, Y. Under the spotlight: The organic-inorganic hybrid halide perovskite for optoelectronic applications. Nano Today 2015, 10, 355–396. [Google Scholar] [CrossRef]
- Rao, C.N.R.; Cheetham, A.K.; Thirumurugan, A. Hybrid inorganic-organic materials: A new family in condensed matter physics. J. Phys. Condens. Matter 2008, 20, 159801. [Google Scholar]
- Yadav, R.; Swain, D.; Kundu, P.P.; Nair, H.S.; Narayana, C.; Elizabeth, S. Dielectric and Raman investigations of structural phase transitions in (C2H5NH3)2CdCl4. Phys. Chem. Chem. Phys. 2015, 17, 12207–12214. [Google Scholar] [CrossRef] [PubMed]
- Pabst, I.; Fuess, H.; Bats, J.W. Structure of monomethylammonium tetrachlorocuprate at 297 and 100 K. Acta crystallogr. C 1987, 43, 413–416. [Google Scholar] [CrossRef]
- Babu, R.; Vardhaman, A.K.; Dhavale, V.M.; Giribabu, L.; Singh, S.P. MA2CoBr4: Lead-free cobalt-based perovskite for electrochemical conversion of water to oxygen. Chem. Commun. 2019, 55, 6779–6782. [Google Scholar] [CrossRef] [PubMed]
- Daub, M.; Stroh, R.; Hillebrecht, H. Synthesis, Crystal structure, and optical properties of (CH3NH3)2CoX4 (X = Cl, Br, I, Cl0.5Br0.5, Cl0.5I0.5, Br0.5I0.5). Z. Anorg. Allg. Chem. 2016, 642, 268–274. [Google Scholar] [CrossRef]
- Roccanova, R.; Ming, W.; Whiteside, V.R.; McGuire, M.A.; Sellers, I.R.; Du, H.H.; Saparov, B. Synthesis, crystal and electronic structures, and optical properties of (CH3NH3)2CdX4 (X = Cl, Br, I). Inorg. Chem. 2017, 56, 13878–13888. [Google Scholar] [CrossRef] [PubMed]
- Altermatt, D.; Arend, H.; Niggli, A.; Petter, W. New tetrahedrally coordinated A2CdBr4 compounds (A = Cs, CH2NH3). Mater. Res. Bull. 1979, 14, 1391–1396. [Google Scholar] [CrossRef]
- Lim, A.R. Molecular dynamics of cations and anions by 1H MAS NMR, 13C CP/MAS NMR, 14N NMR, and 113Cd NMR in hybrid organic-inorganic (CH3NH3)2CdBr4. J. Mol. Structure 2018, 1167, 255–260. [Google Scholar] [CrossRef]
- Koenig, J.L. Spectroscopy of Polymers; Elsevier: New York, NY, USA, 1999. [Google Scholar]
- Mcbrierty, V.J.; Packer, K.J. Nuclear Magnetic Resonance in Solid Polymers; Cambridge University Press: Cambridge, UK, 1993. [Google Scholar]
- Abragam, A. The Principles of Nuclear Magnetism; Oxford University Press: Oxford, UK, 1961. [Google Scholar]
- Charles, J.P.; Jacqlynn, B. The Aldrich Library of 13C and 1H FT NMR Spectra; Aldrich Chemical Company: Saint Louis, MI, USA, 1993. [Google Scholar]
- Bloembergen, N.; Purcell, E.M.; Pound, R.V. Relaxation effects in nuclear magnetic resonance absorption. Phys. Rev. 1948, 73, 679–712. [Google Scholar] [CrossRef]
- Lim, A.R. Role of NH4 ions in successive phase transitions of perovskite type (NH4)2ZnX4 (X= Cl, Br) by 1H MAS NMR and 14N NMR. RSC Advances 2018, 8, 11316–11323. [Google Scholar] [CrossRef]
- Solomon, I. Relaxation processes in a system of two spins. Phys. Rev. B 1955, 99, 559–565. [Google Scholar] [CrossRef]
- Aliev, A.E.; Harris, K.D.M. Simple technique for temperature calibration of a MAS probe for solid-state NMR spectroscopy. Mag. Reson. Chem. 1994, 32, 366–369. [Google Scholar] [CrossRef]
- Langer, B.; Schnell, I.; Spiess, H.W.; Gimmer, A.-R. Temperature calibration under ultrafast MAS conditions. J. Mag. Reson. 1999, 138, 182–186. [Google Scholar] [CrossRef] [PubMed]
- Kubicki, D.J.; Prochowicz, D.; Pinon, A.; Stevanato, G.; Hofstetter, A.; Zakeeruddin, S.M.; Gratzel, M.; Emsley, L. Doping and phase segregation in Mn2+- and Co2+- doped lead halide perovskite from 133Cs and 1H-NMR relaxation enhancement. J. Mater. Chem. A 2019, 7, 2326–2333. [Google Scholar] [CrossRef]
Sample Availability: Samples of the compounds (CH3NH3)2CoBr4 are available from the authors. |
Figure 1.
Thermogravimetric analysis (TGA) curve of (CH3NH3)2CoBr4 (inset: states of the crystal at temperatures of (a) 300 K, (b) 400 K, (c) 500 K, (d) 550 K, and (e) 570 K).
Figure 1.
Thermogravimetric analysis (TGA) curve of (CH3NH3)2CoBr4 (inset: states of the crystal at temperatures of (a) 300 K, (b) 400 K, (c) 500 K, (d) 550 K, and (e) 570 K).

Figure 2.
Differential scanning calorimetry (DSC) curve of (CH3NH3)2CoBr4.

Figure 3.
1H-NMR spectrum for (CH3NH3)2CoBr4 crystal at 410 K. The open circles are the marked sidebands for CH3 and the asterisks are the marked sidebands for NH3.
Figure 3.
1H-NMR spectrum for (CH3NH3)2CoBr4 crystal at 410 K. The open circles are the marked sidebands for CH3 and the asterisks are the marked sidebands for NH3.

Figure 4.
Recovery traces for 1H-NMR spectrum in (CH3NH3)2CoBr4 as a function of delay time from 1 μs to 20 ms.
Figure 4.
Recovery traces for 1H-NMR spectrum in (CH3NH3)2CoBr4 as a function of delay time from 1 μs to 20 ms.

Figure 5.
1H spin–lattice relaxation times in (CH3NH3)2CoBr4 and (CH3NH3)2CdBr4 as a function of inverse temperature.
Figure 5.
1H spin–lattice relaxation times in (CH3NH3)2CoBr4 and (CH3NH3)2CdBr4 as a function of inverse temperature.

Figure 6.
13C-NMR spectrum in (CH3NH3)2CoBr4 at 300 K. The two arrows denote the signals of the two crystallographically different CH3 moieties. The spinning sidebands are marked with open circles and asterisks.
Figure 6.
13C-NMR spectrum in (CH3NH3)2CoBr4 at 300 K. The two arrows denote the signals of the two crystallographically different CH3 moieties. The spinning sidebands are marked with open circles and asterisks.

Figure 7.
13C-NMR chemical shifts of (CH3NH3)2CoBr4 and (CH3NH3)2CdBr4 as a function of temperature.
Figure 7.
13C-NMR chemical shifts of (CH3NH3)2CoBr4 and (CH3NH3)2CdBr4 as a function of temperature.

Figure 8.
13C spin–lattice relaxation times of (CH3NH3)2CoBr4 and (CH3NH3)2CdBr4 as a function of inverse temperature.
Figure 8.
13C spin–lattice relaxation times of (CH3NH3)2CoBr4 and (CH3NH3)2CdBr4 as a function of inverse temperature.

Figure 9.
Arrhenius plots of the natural logarithm of the correlation times for each of the carbons of a-CH3 and b-CH3 in (CH3NH3)2CoBr4 and (CH3NH3)2CdBr4 as a function of inverse temperature.
Figure 9.
Arrhenius plots of the natural logarithm of the correlation times for each of the carbons of a-CH3 and b-CH3 in (CH3NH3)2CoBr4 and (CH3NH3)2CdBr4 as a function of inverse temperature.

© 2019 by the authors. Licensee MDPI, Basel, Switzerland. This article is an open access article distributed under the terms and conditions of the Creative Commons Attribution (CC BY) license (http://creativecommons.org/licenses/by/4.0/).
Share and Cite
MDPI and ACS Style
Lim, A.R.; Kim, S.H. Study on Paramagnetic Interactions of (CH3NH3)2CoBr4 Hybrid Perovskites Based on Nuclear Magnetic Resonance (NMR) Relaxation Time. Molecules 2019, 24, 2895. https://0-doi-org.brum.beds.ac.uk/10.3390/molecules24162895
AMA Style
Lim AR, Kim SH. Study on Paramagnetic Interactions of (CH3NH3)2CoBr4 Hybrid Perovskites Based on Nuclear Magnetic Resonance (NMR) Relaxation Time. Molecules. 2019; 24(16):2895. https://0-doi-org.brum.beds.ac.uk/10.3390/molecules24162895
Chicago/Turabian StyleLim, Ae Ran, and Sun Ha Kim. 2019. "Study on Paramagnetic Interactions of (CH3NH3)2CoBr4 Hybrid Perovskites Based on Nuclear Magnetic Resonance (NMR) Relaxation Time" Molecules 24, no. 16: 2895. https://0-doi-org.brum.beds.ac.uk/10.3390/molecules24162895