Article

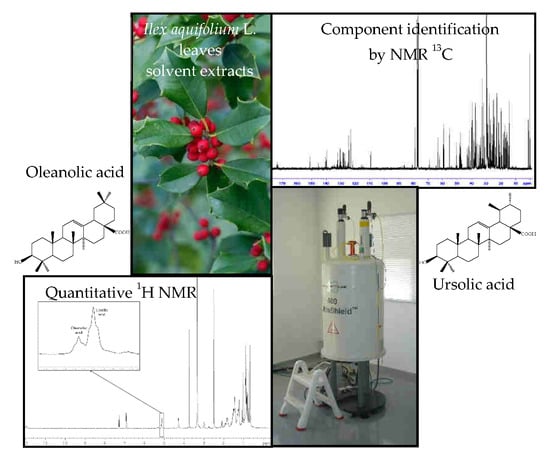
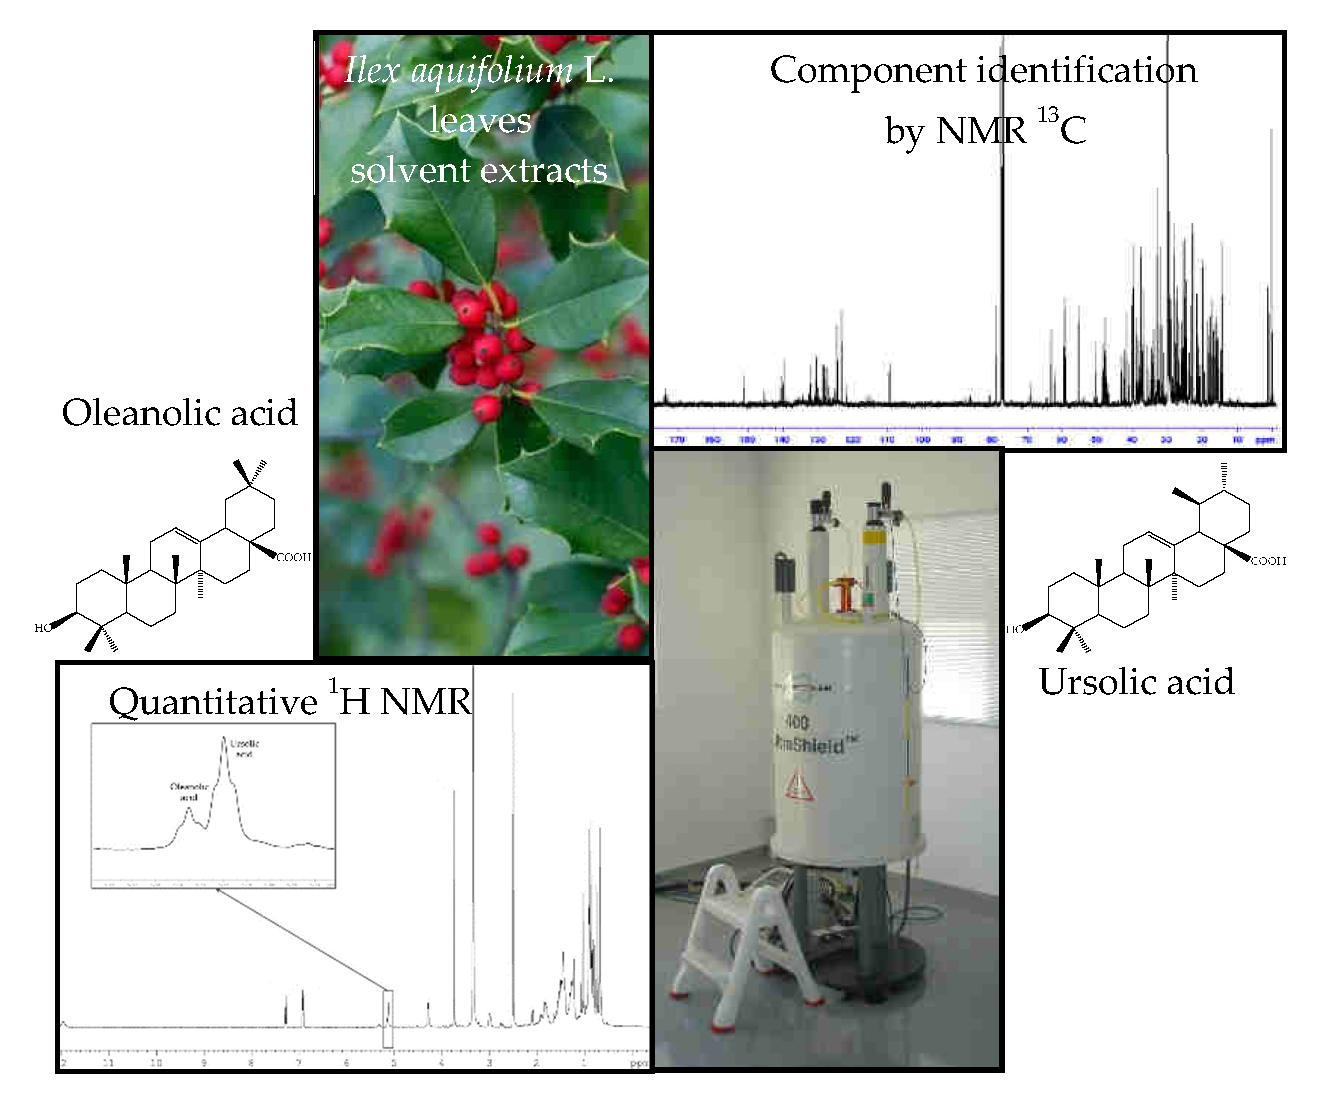
Identification and Quantitation of Ursolic and Oleanolic Acids in Ilex aquifolium L. Leaf Extracts Using 13C and 1H-NMR Spectroscopy

Université de Corse-CNRS, UMR 6134 SPE, Equipe Chimie et Biomasse, Route des Sanguinaires, F- 20000 Ajaccio, France
*
Author to whom correspondence should be addressed.
Submission received: 25 October 2019 / Revised: 27 November 2019 / Accepted: 29 November 2019 / Published: 3 December 2019

Abstract

:
Leaves of Ilex aquifolium L. have been used for their therapeutic properties. In previous studies, components contained in the leaves were first isolated by various chromatographic techniques. Then, quantitation of oleanolic and ursolic acids, which are responsible for the biological and therapeutic activities of the plant, was performed by HPLC, HPTLC, and somewhat by GC-MS. Our objective was to develop a simple method that allows the identification of compounds contained in the leaves of Corsican I. aquifolium and to quantify ursolic and oleanolic acids. Leaves were successively extracted with hexane and dichloromethane. The extracts were chromatographed on silica gel and the fractions of column chromatography submitted to 13C-NMR analysis, following a computerized method developed in the laboratory. 13C-NMR allowed the identification of various triterpenes including ursolic acid and oleanolic acid. Quantitation of both acids was achieved, for the first time, by 1H-NMR after validation of the method (accuracy, precision, linearity, limit of detection and limit of quantitation). Ursolic and oleanolic acids accounted for 55.3% and 20.8% of the dichloromethane extract, respectively. This represents 1.3% and 0.5% of the mass of dried leaves. 1H-NMR spectroscopy appeared as a powerful tool for a rapid quantitation of biologically active compounds from I. aquifolium.

Graphical Abstract

1. Introduction

Recognizing known substances by analytical methods is widespread in the flavor and fragrance industry as well as in the pharmaceutical industry. For instance, identification of volatile components contained in essential oils is routinely achieved by gas chromatography-mass spectrometry (GC-MS) in combination with retention indices (RIs) on two chromatographic columns of different polarity. Identification of heavy compounds in solvent extracts is usually performed by high performance liquid chromatography with various detector modes, coupled with MS or MS-MS (HPLC-MS or HPLC-MS-MS). High performance thin layer chromatography (HPTLC) has been punctually employed as well as GC after acetylation and/or silylation steps.
Otherwise, we developed a computerized method at the University of Corsica that allows the identification of individual components of a natural mixture (essential oil, vegetable oil, bio-oil, and solvent extract) starting from its 13C-NMR spectrum. In a second step, quantitation of some compounds could be performed by 13C-NMR or by 1H-NMR. The aim of the present study was to investigate the composition of leaf extracts from Corsican Ilex aquifolium L., using various NMR methods.
I. aquifolium, which is also known as common holly, is a shrub or a small tree with persistent foliage. Its glowing dark green leaves serve as an ornament for Christmas. Flowers that are small and white or pink and odoriferous appear between April and July. Fruits are red berries, about 8 mm diameter, that grow during the August-December period. In the folk medicine, leaves of I. aquifolium have been used for their therapeutic properties. They are considered as an antipyretic, astringent, and diuretic. They were also used to treat intermittent fevers, rheumatisms, or as expectorant agents [1,2]. Otherwise, leaves and fruits of I. aquifolium have been used to treat cancers of liver, stomach and intestines as well as jaundice and malaria [3,4]. Various I. aquifolium leaf extracts (hexane, chloroform, ethyl acetate, and ethanol) displayed moderate antibacterial activities [2]. However, I. aquifolium displays a high level of toxicity. For instance, it is reported that children have been poisoned after ingesting common holly fruits and had symptoms such as diarrhea, vomiting, and gastro-intestinal disorders caused by a cyano-glycoside, 2-β-d-glucopyranosyloxy-p-hydroxy-6,7-dihydromandelonitrile [5].
Several papers reported on the identification of compounds responsible for the biological activity of I. aquifolium extracts. Phytochemicals that belonged to various families have been isolated and identified: amino-acids, saccharides, carotenoids [1], phenol derivatives [1,3,6], fatty acids [1,7], flavonoids [8], and anthocyanes [9]. Lastly, the occurrence of various triterpenes has been reported, such as α-amyrin, β-amyrin, uvaol, erythrodiol, and two triterpene acids such as oleanolic acid and ursolic acid [1,7].
Various studies carried out on oleanolic acid (OA) and/or ursolic acid (UA) demonstrated a wide range of biological activities that have been reviewed including antibacterial, antifungal, anti-tumoral, antiviral, anti-inflammatory, anti-oxidant, anti-cancer, anti-hepatotoxic, anti-hyperglycemic, antileucemic, antimutagene, antipyretic, antidiabetic, and anti-hypertension activities [10,11,12,13,14,15]. Furthermore, UA also possesses an anti-wrinkle activity comparable to that of retinoids, and, therefore, it is appreciated in domains of cosmetic and oncology areas [16].
With respect to their biological and therapeutic activities, identification and quantitation of UA and OA in plant extracts have been investigated following the same scheme. Practically in all papers, one or both acids were first isolated using repetitive chromatography and identified by comparison with spectroscopic data reported in the literature [17]. Then, quantitation of both acids in the plant extract was achieved by chromatographic techniques reviewed by Xu et al. [18]. Recent examples are reported below.
-
HPLC (or reversed-phase RP-HPLC) with various detector modes (UV, evaporative light scattering detection, photodiode array detection) appeared as the most employed technique for quantitation of UA and/or OA in plant extracts from Lantana camara [19], Salvia chinensis [20], Thymus ssp [21], and Nyctanthes arbor-tristis [22].
-
Otherwise, co-quantitation of OA and UA was achieved by LC-MS in oregano (Origanum spp.) [23] and in virgin olive oil [24]. An improved scheme involving quantitation using an LC-MS-MS procedure preceded by a qualitative screening using silylation and GC-MS was developed [25].
-
HPTLC has been employed in a few studies for quantitation of UA and/or OA in extracts of, inter alia, Lantana camara [26] and Eucalyptus globulus [27].
-
Lastly, both acids have been quantified by GC (FID) after silylation and acetylation steps in plant extracts and in commercial botanicals used as food supplement ingredients [7,28].
-
Apart from chromatographic techniques, NMR has been punctually used for quantitation of UA and/or OA in plant extracts. OA has been quantified in a precipitate obtained during the industrial extraction of the leaves of Olea europaea using 13C-NMR spectroscopy [29]. Otherwise, the combined use of proton-carbon heteronuclear single-quantum coherence (HSQC) and proton-carbon heteronuclear multiple-bond correlation (HMBC), allowed the identification and quantitation of OA and UA in plant extracts of the Lamiaceae and Oleaceae family [30].
It appears from this review of the literature that solvent extracts of I. aquifolium display a therapeutic interest useful in various domains such as microbiology, cosmetics, and oncology. Among phytochemicals contained in I. aquifolium extracts, UA and OA play an important role.
Identification and quantitation of the two triterpene acids in various plant extracts have been undertaken as follows: isolation of each acid by repeated chromatography, identification by spectroscopic techniques, and then quantitation by HPLC or TLC and punctually GC-MS after derivatization [18]. All these techniques are known to give accurate results but they are also time-consuming.
In the course of our on-going work concerning the valorization of medicinal and aromatic plants growing wild in Corsica, we got interested by I. aquifolium that is abundant in Corsican forests, and the possibility to use it as a source of UA and/or OA. Therefore, in order to appreciate the contents of UA and OA produced by I. aquifolium, we drew the following scheme based on a novel approach by combining (i) the identification of neutral and acid triterpenes present in extracts from leaves of I. aquifolium by combination of column chromatography (CC) and 13C-NMR without isolation or purification of the compounds, following an in-house procedure and (ii) quantitation of UA and OA by 1H-NMR. The technique is not yet investigated for the two acids, but it allows a short time of occupancy of the spectrometer.

2. Results and Discussion

Leaves of I. aquifolium harvested in Corsica have been successively extracted with hexane and then with dichloromethane. This two-step procedure was initiated in order to separate as well as possible medium polar triterpenes (esters, aldehydes, and alcohols) from more polar triterpenes (acids). Every extract has been submitted to 13C-NMR analysis and then chromatographed on silica gel. All fractions of chromatography were, in turn, analyzed by the same method.
13C-NMR analysis of triterpene mixtures has been done following a computerized procedure initiated and developed at the University of Corsica. This experimental procedure was successfully employed for identifying and quantifying neutral triterpenes and triterpene acids in a dichloromethane extract of cork (Quercus suber) [31], and in a hexane extract from leaves of Olea europea [29]. In short, identification of the components was carried out by comparing chemical shift values in the mixture spectrum with those of reference spectra compiled in two libraries devoted to triterpenes, using in-house software (Figure 1). The first spectral data library was constructed with spectra recorded in the laboratory while the second one was built with spectral data picked up in recent literature (spectra recorded with diluted samples). Each compound was identified by taking into account three parameters that were directly available from the computer program: (i) the number of observed signals with respect to what was expected, (ii) the difference between the chemical shift of each signal in the mixture and in the reference (Δδ), and (iii) the number of overlapping signals of carbons belonging to two components that fortuitously possess the same chemical shifts [29,31]. If necessary, the occurrence of “false positive” could be avoided by taking into account the relative intensities of the non-overlapped signals of protonated carbons of a given component. A component is considered identified if 50% of its signals are observed and they belong to that compound.

2.1. Phytochemicals Contained in I. aquifolium Leaf Extracts

2.1.1. Hexane Extract from Leaves of I. aquifolium

Leaves of I. aquifolium, previously crushed in liquid nitrogen, have been extracted with boiling hexane. Solvent has been removed under reduced pressure leading to the hexane extract with a 1.9% yield (w/w vs. dry material). Analysis of the crude extract by 13C-NMR (CDCl3) led to the identification of four oxygenated triterpenes: α-amyrin, β-amyrin, lupeol, and uvaol (Figure 2, Table S1). It could be pointed out that, despite the similarity of the structures, their identification does not suffer any doubt since, for every compound, two-thirds of the observed signals belonged solely to that compound.
In the NMR spectrum of the crude hexane extract, various signals with appreciable intensities remained unassigned: (i) two signals around 170 ppm accompanied by two signals around 80 ppm, (ii) a series of signals at approximately 14.1 ppm, 22.7 ppm, 29.7 ppm, and 31.9 ppm characteristic of saturated fatty acid chains coupled with signals at 128–132 ppm belonging to unsaturated fatty acid chains [32,33]. These chemical shift values are associated with the identification of α-amyrin and β-amyrin, which suggested the occurrence of amyrin derivatives that bear various fatty acid esters at C3. In parallel, the presence of a methine signal (confirmed by the distortionless enhancement by polarization transfer - DEPT - spectrum) at 207.5 ppm suggested the occurrence of an aldehydic compound. Therefore, the crude extract was chromatographed on silica gel, which leads to 12 fractions H1–H12. All fractions were submitted to 13C-NMR analysis.
-
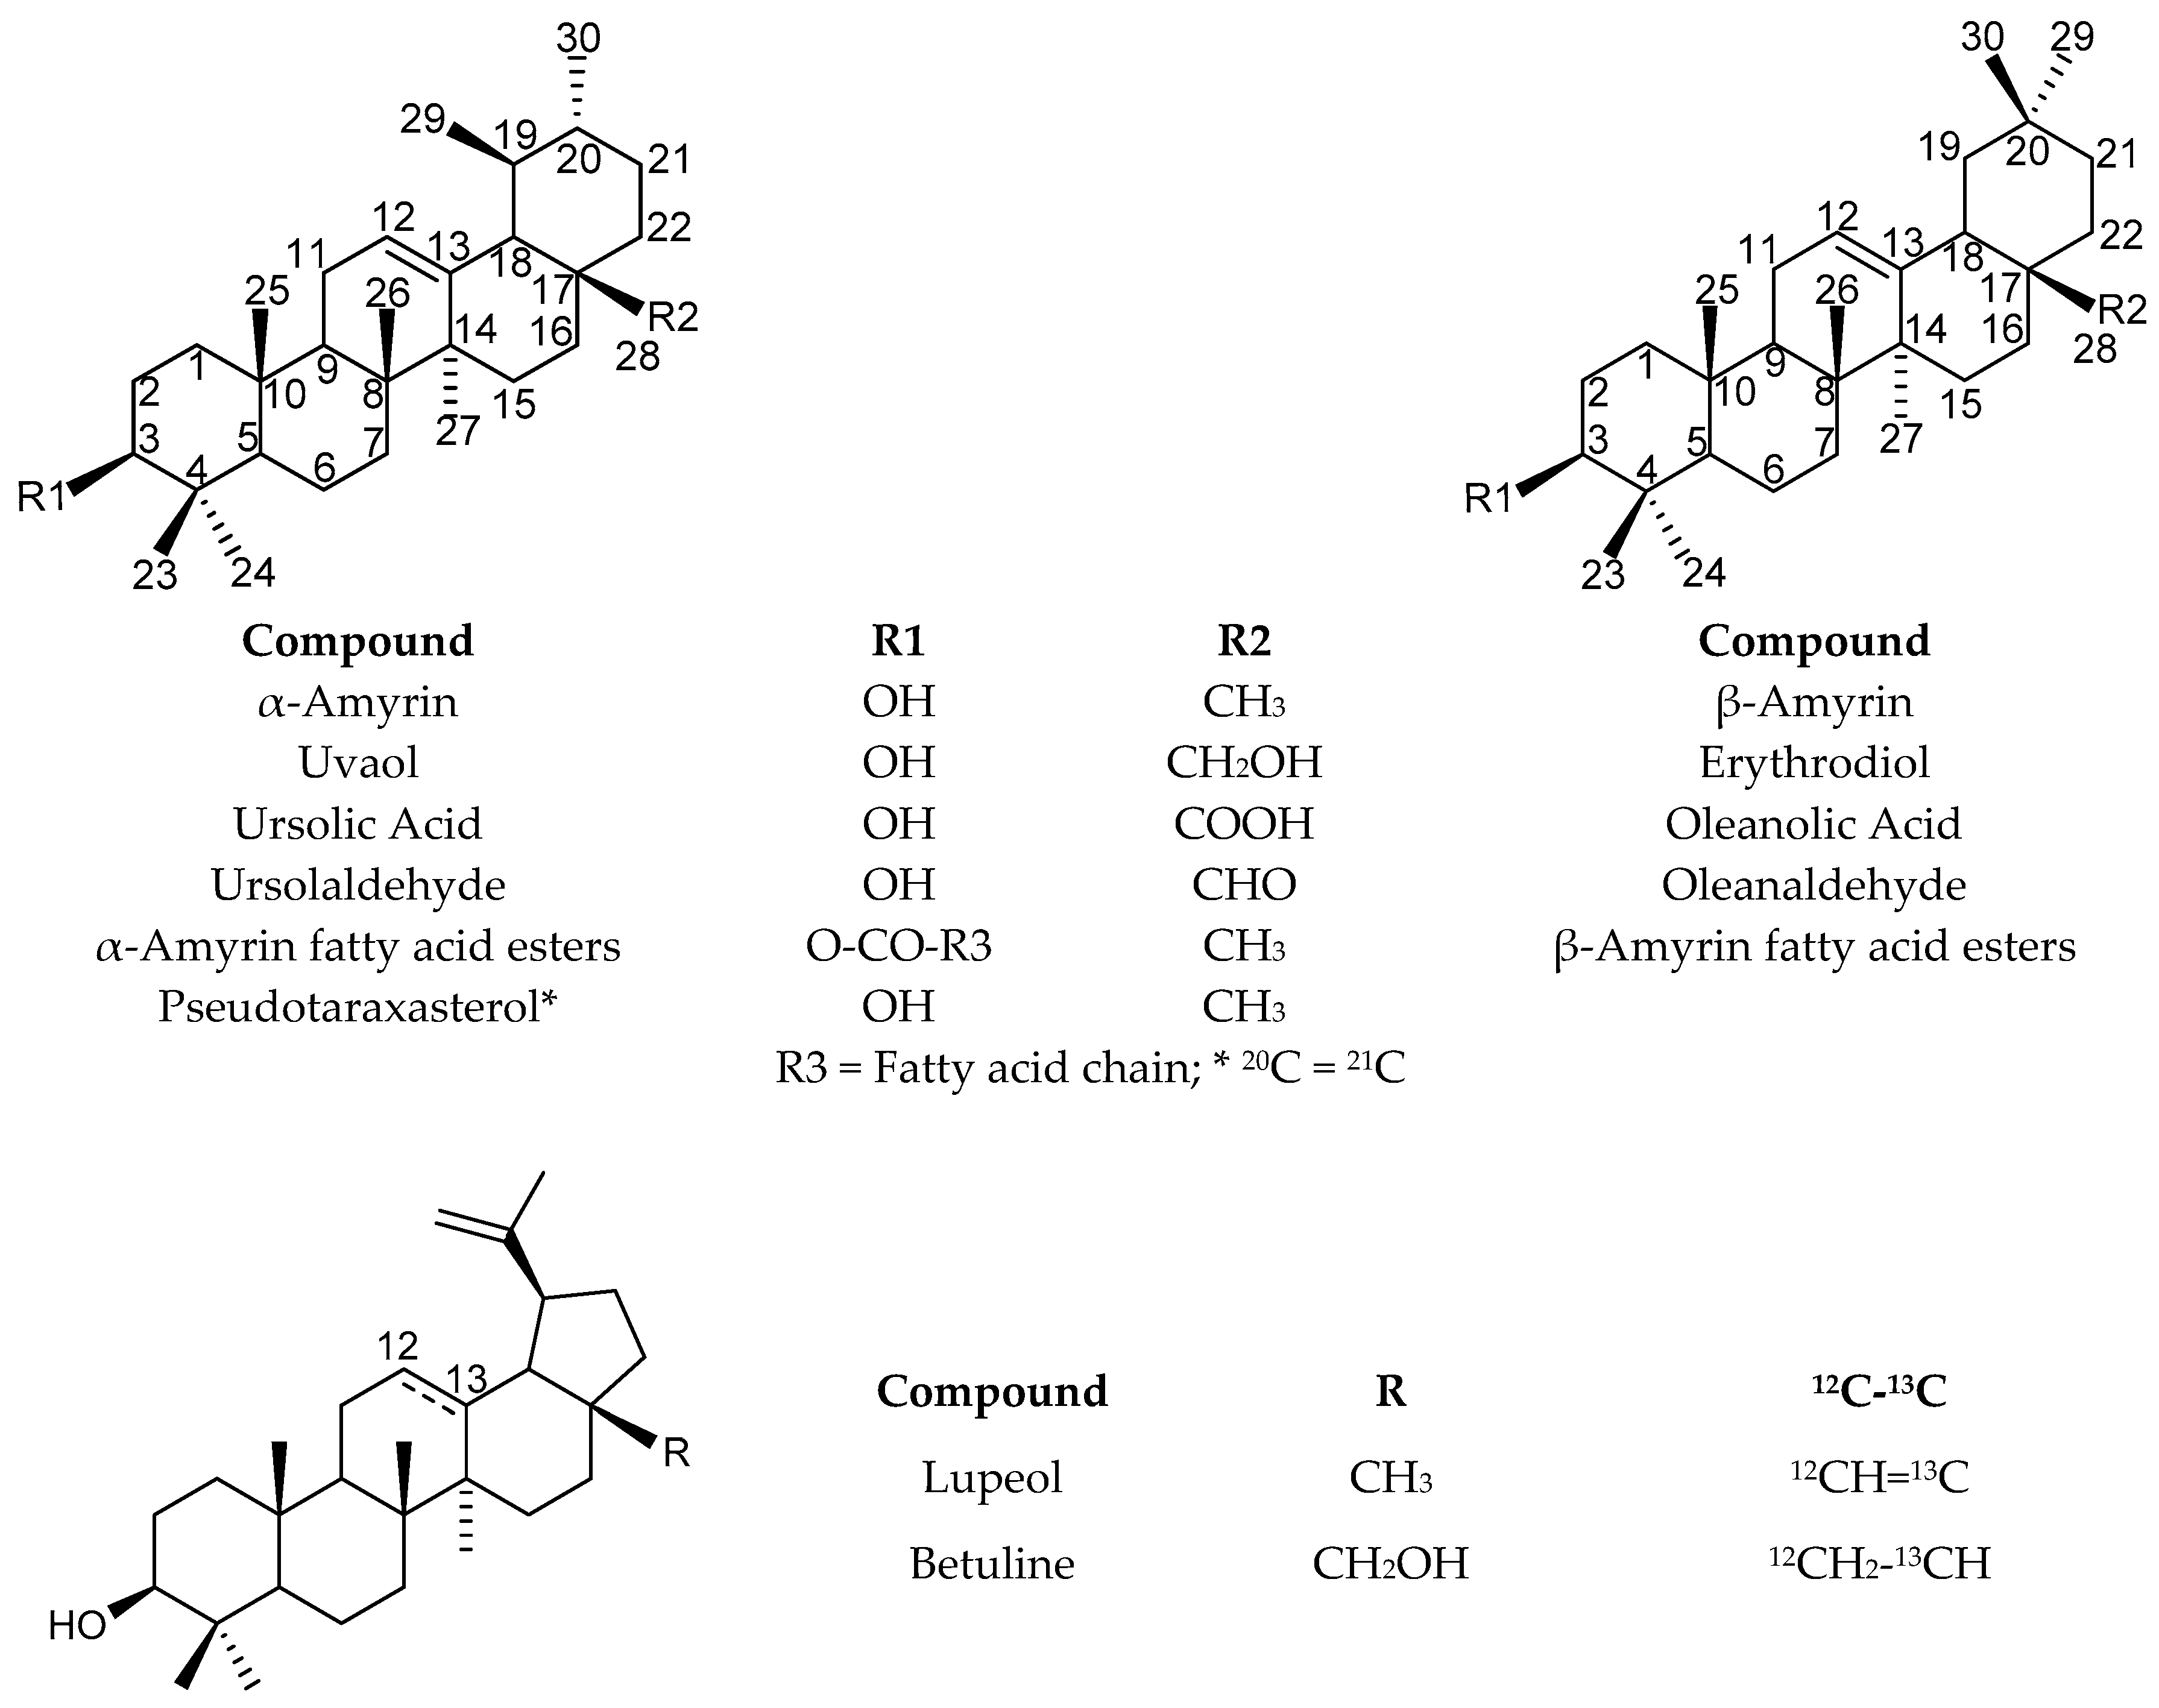
NMR spectra of fractions H2–H4 displayed the signals of all carbons of α-amyrin and β-amyrin as well as those of saturated and unsaturated fatty acid chains. In order to evaluate the nature of these fatty acid chains, a fraction H2 of CC was submitted to trans-esterification. Basic hydrolysis was followed by methylation (BF3-Methanol). The organic layer was submitted to GC (Retention indices) and GC-MS analyses. Five methyl esters have been identified with characteristic chains of palmitic acid (C16:0; 54.1%), linolenic acid (C18:3; 13.2%), oleic acid (C18:1; 11.3%), linoleic acid (C18:2; 10.0%), and stearic acid (C18:0; 3.0%).
-
Fraction H5 contained α-amyrin, β-amyrin, and lupeol previously identified in the crude extract as well as pseudotaraxasterol, which is present at a lower extent.
-
Fraction H7 contained betuline, erythrodiol, and uvaol where the latter is already identified in the crude extract and also present in fraction H8 where it constituted the major component.
-
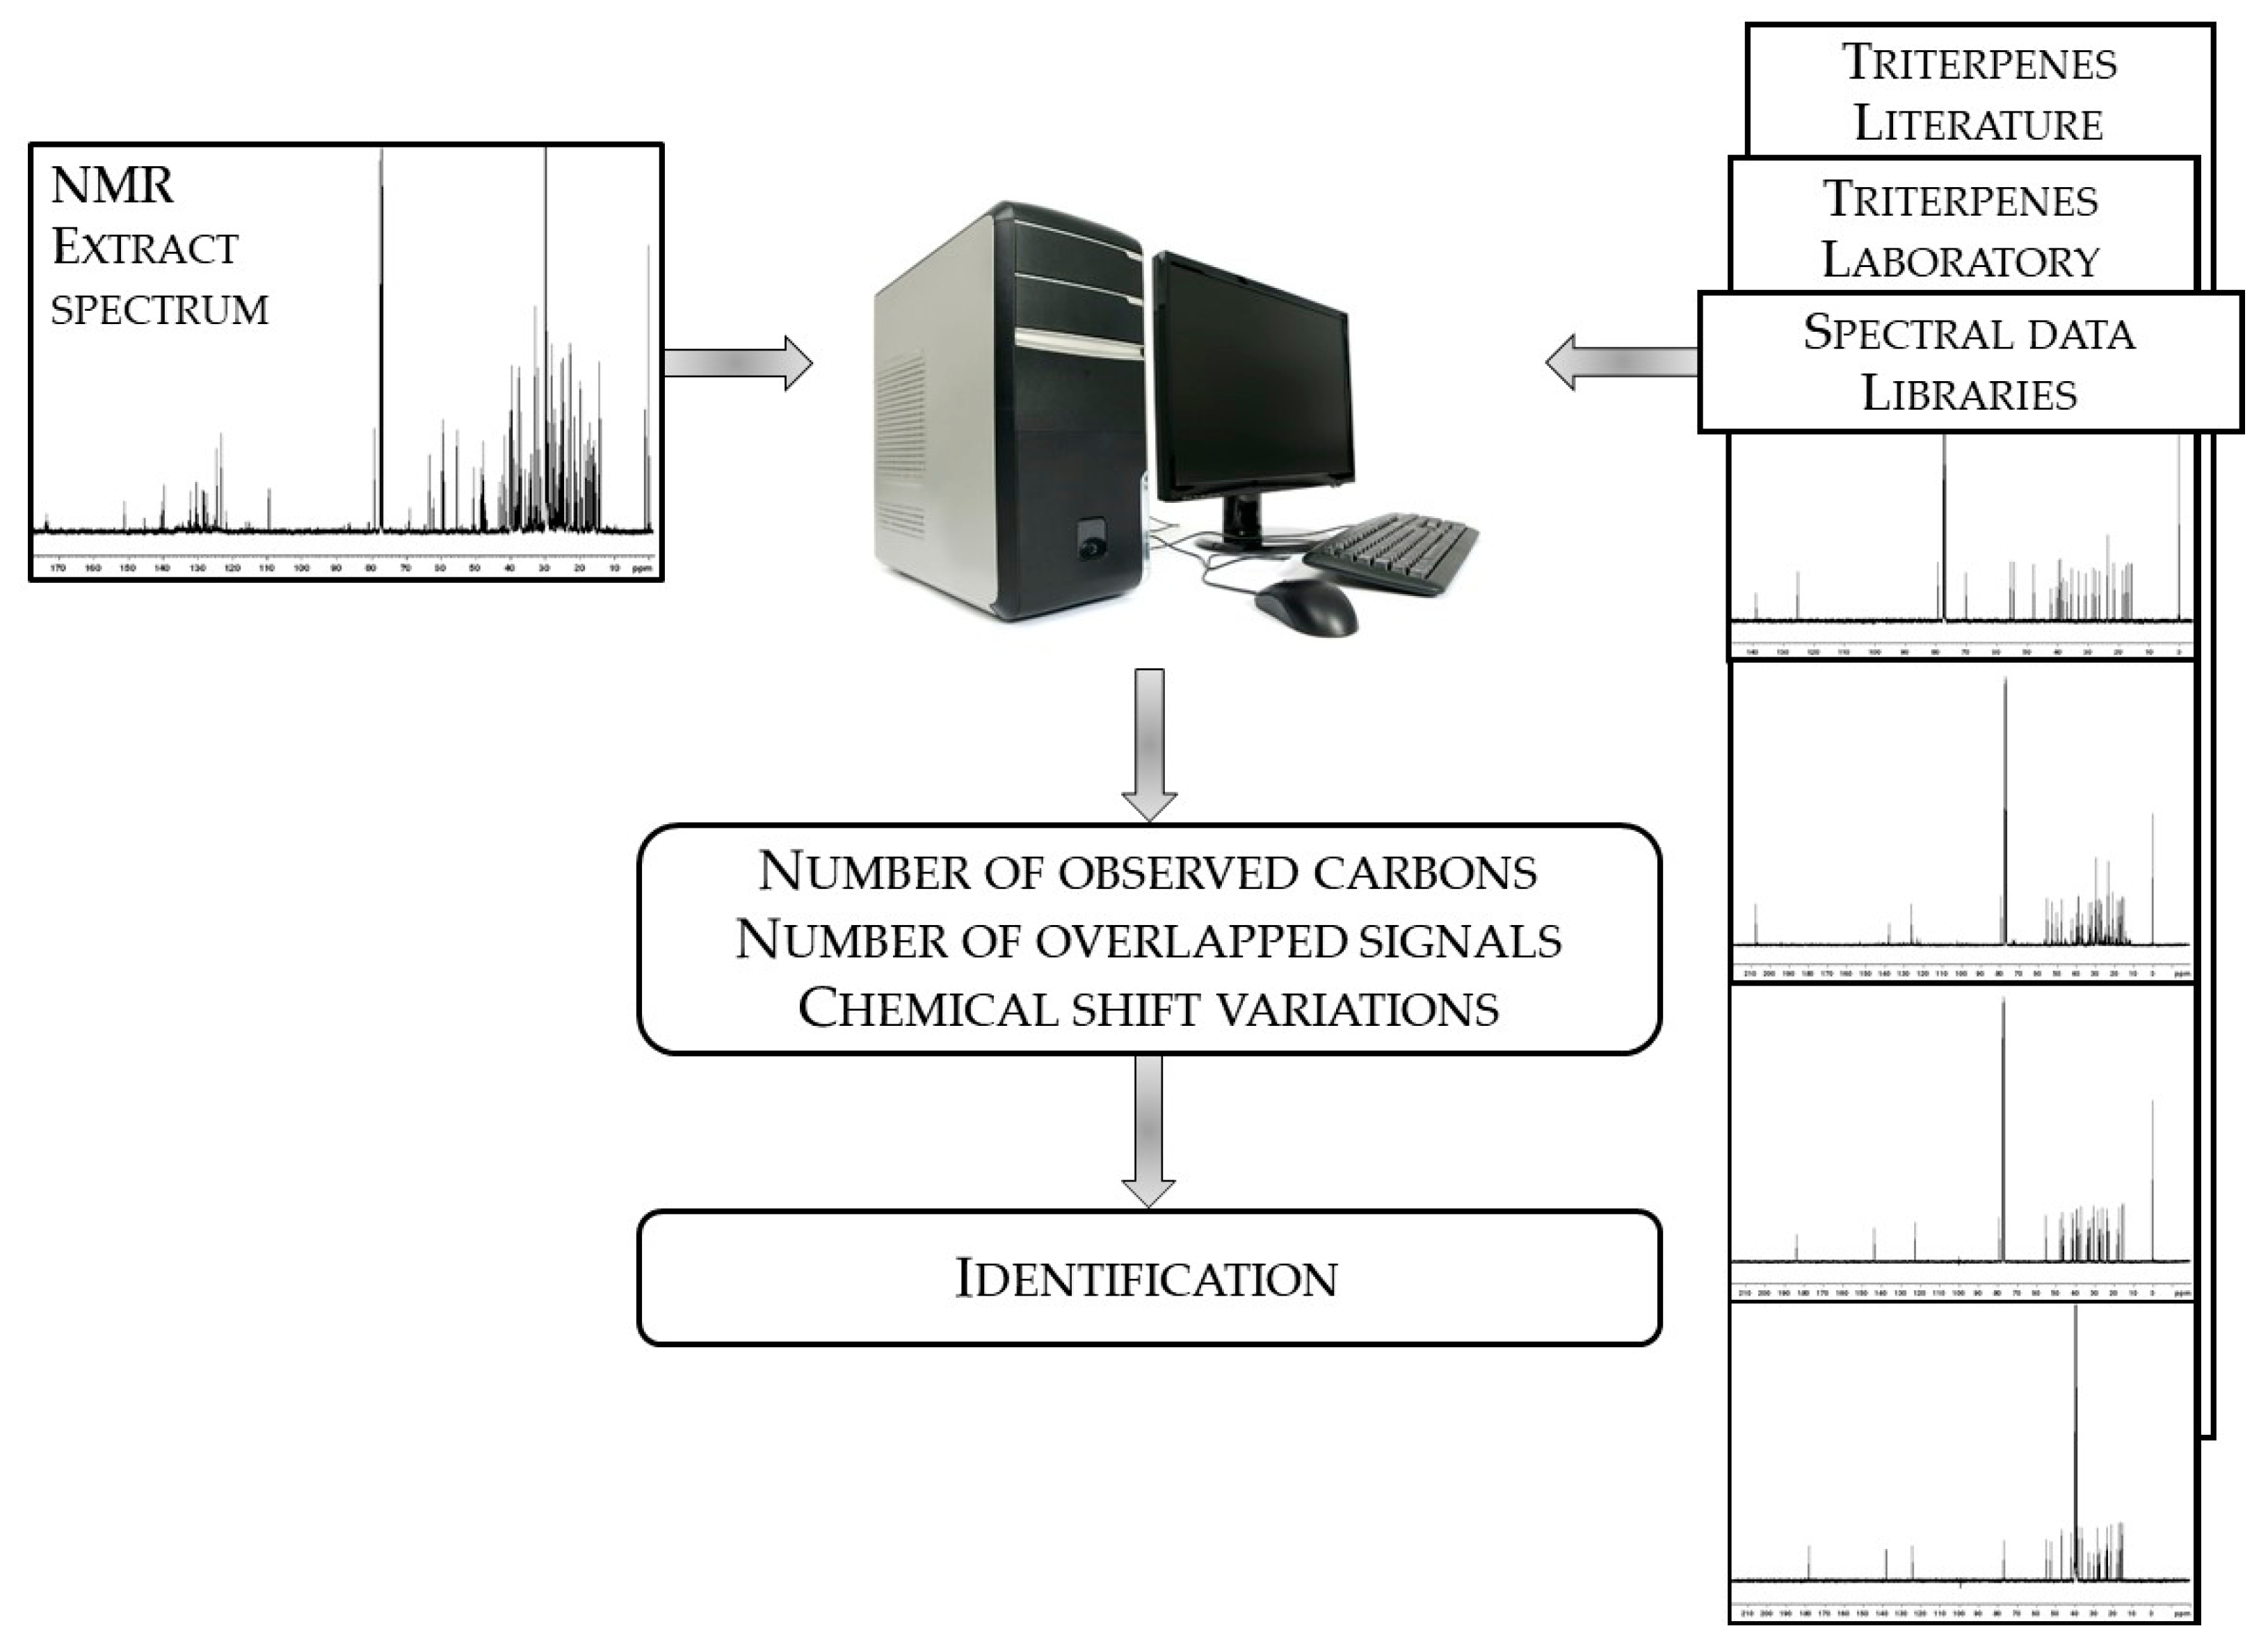
Fraction H6 contained α-amyrin, β-amyrin, and lupeol as well as β-sitosterol not yet identified. The 13C-NMR spectrum of that fraction exhibited a series of signals with appreciable intensities including the aldehydic signal (207.5 ppm). Therefore, the fraction H6 has been chromatographed once again, which leads to sub-fractions H6.1-H6.7. Our attention was focused on fraction H6.3. Its 13C-NMR spectrum displayed two series of 30 signals. The chemical shifts of the major component were similar to those of α-amyrin with a few exceptions: one signal belonged to a carbon linked to a hydroxyl group while one methyl signal was missing and replaced by the aldehydic signal. Search in the literature led us to ursolaldehyde whose 13C-NMR spectrum has been reported by Kim et al. [34]. The second series of 30 signals displayed higher intensities on the spectrum of sub-fraction H6.2. Using the same procedure as above, oleanaldehyde was identified by comparison with the chemical shift values reported by Zhang et al. [35]. All the signals belonging to both molecules were observed. The chemical shift differences (Δδ) measured on the spectrum and those reported in the literature are inferior or equal to 0.12 ppm for most carbons, except for those of aldehydic carbons (about 0.20 ppm). It could be pointed out that, despite the similarities of the structures, only four signals out of 30 of oleanaldehyde overlapped with those of ursolaldehyde.
In the hexane extract of leaves from I. aquifolium growing wild in Corsica, the following triterpenes have been identified: α-amyrin, β-amyrin, fatty acid esters of amyrins, lupeol, uvaol, betuline, erythrodiol, pseudotaraxasterol, ursolaldehyde, and oleanaldehyde, as well as a steroid, β-sitosterol (Figure 2). α-Amyrin, β-amyrin, and uvaol have been previously identified in the leaves of I. aquifolium of Italian origin [7]. Some fatty acid esters of α-amyrin and β-amyrin have been reported including palmitic acid, linoleic acid, and linolenic acid [36]. Ursolaldehyde and oleanaldehyde have been identified in extract from leaves of I. aquifolium from the Netherlands [37]. In contrast, lupeol as well as amyrin oleic acid ester and amyrin stearic acid ester are reported for the first time.

2.1.2. Dichloromethane Extract from Leaves of I. aquifolium

Leaves of I. aquifolium previously extracted by hexane have been extracted by boiling dichloromethane (Soxhlet). Solvent was removed at reduced pressure, which leads to the extract (yield = 2.3% w/w vs. dry material). The dichloromethane extract was analyzed by 13C-NMR (CDCl3). Amyrin esters (α-isomers and β-isomers) have been identified as minor components, accompanied by OA. However, the extract being not completely soluble in CDCl3, NMR experiments were performed in deuterated dimethylsulfoxyde (DMSO-d6). In parallel, the spectra of pure (commercial) OA and UA were also recorded in DMSO-d6. The chemical shift assignments for these compounds have been reported [17]. The chemical shift values of the two major components of the dichloromethane extract fitted perfectly with those of reference compounds (Table S2). According to the relative intensities of the signals of identified components, the dichloromethane extract of leaves from Corsican I. aquifolium contained ursolic acid as a major component, which was followed by oleanolic acid and a few minor components such as α-amyrin and β-amyrin esters and β-sitosterol (Figure 2). The occurrence of UA and OA in leaf extract from Ilex species, including I. aquifolium, has been previously reported [1,7,37].
Quantitation of neutral and acidic triterpenes, including OA, in various extracts has been achieved in our laboratory using 13C-NMR. Although various parameters (such as nature of solvent, concentration and pulse sequence) were optimized, it took about two hours to record a spectrum (4.7 Tesla, 10 mm probe or 9.4 Tesla, 5 mm probe) [29,31]. In parallel, the content of lignans in Cedrus atlantica resins has been conducted using 1H-NMR with a time of occupancy of the spectrometer at the minute level [38]. Therefore, quantitation of OA and UA in dichloromethane leaf extract from I. aquifolium has been undertaken with this last technique.

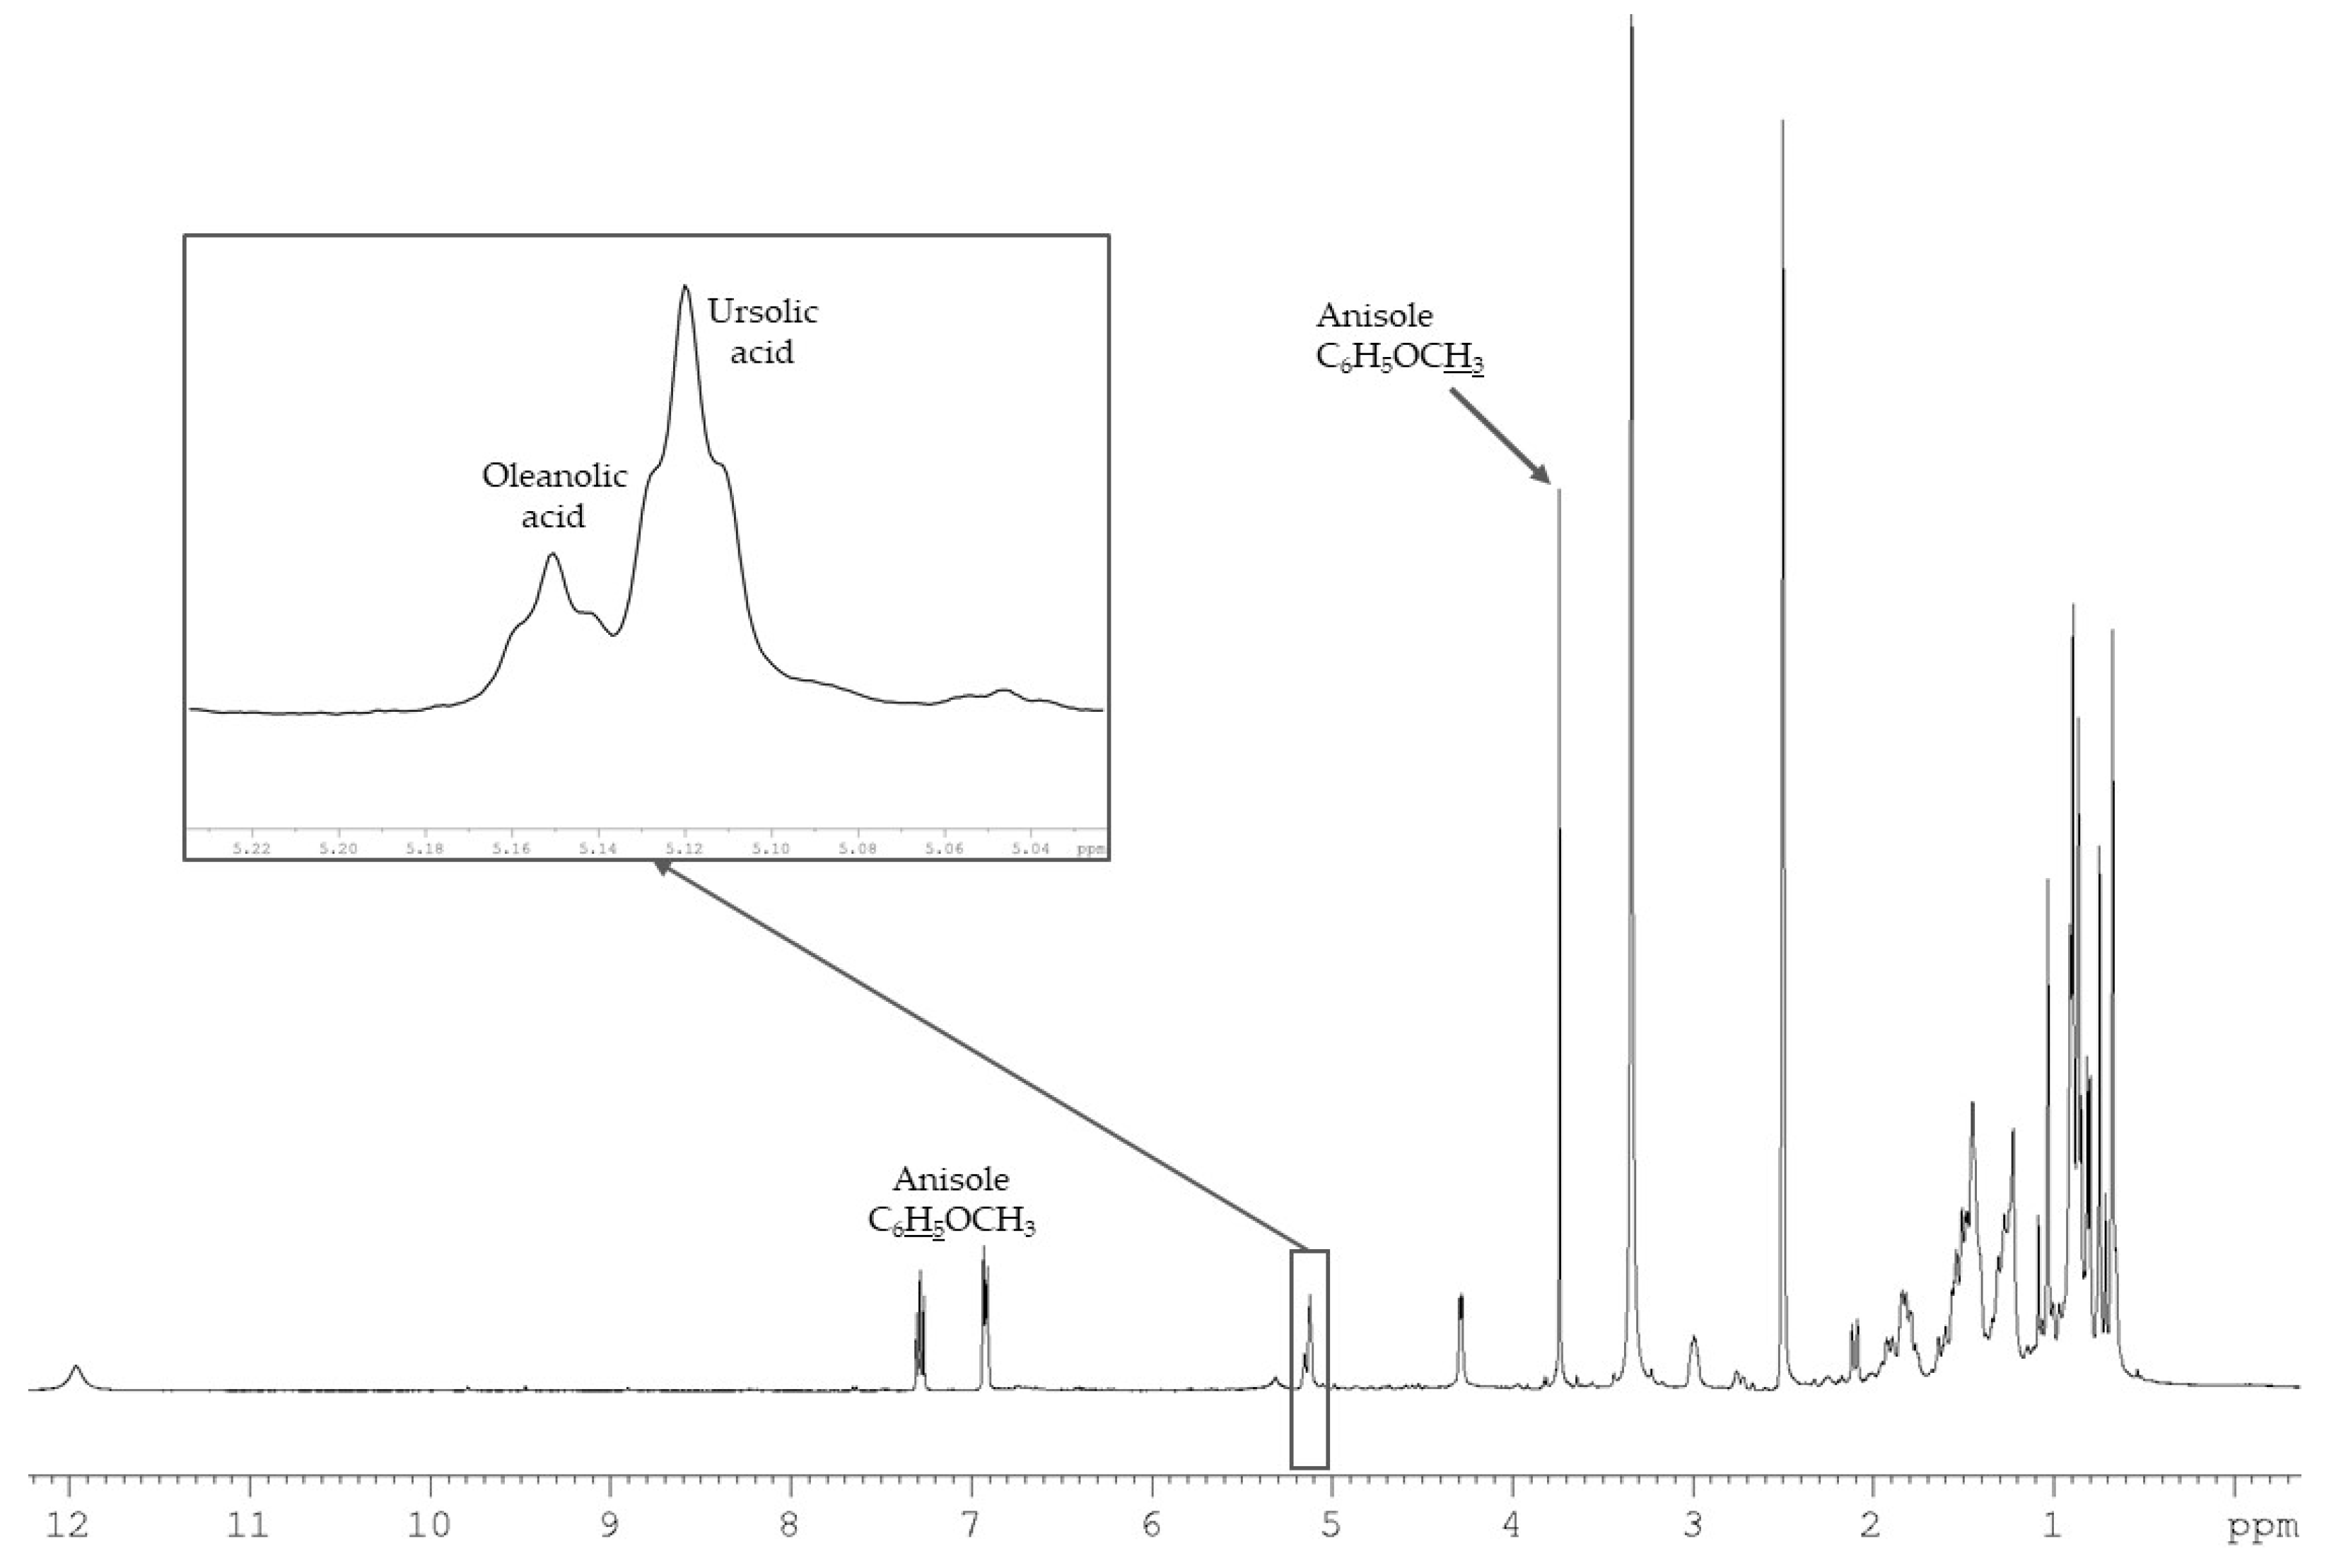
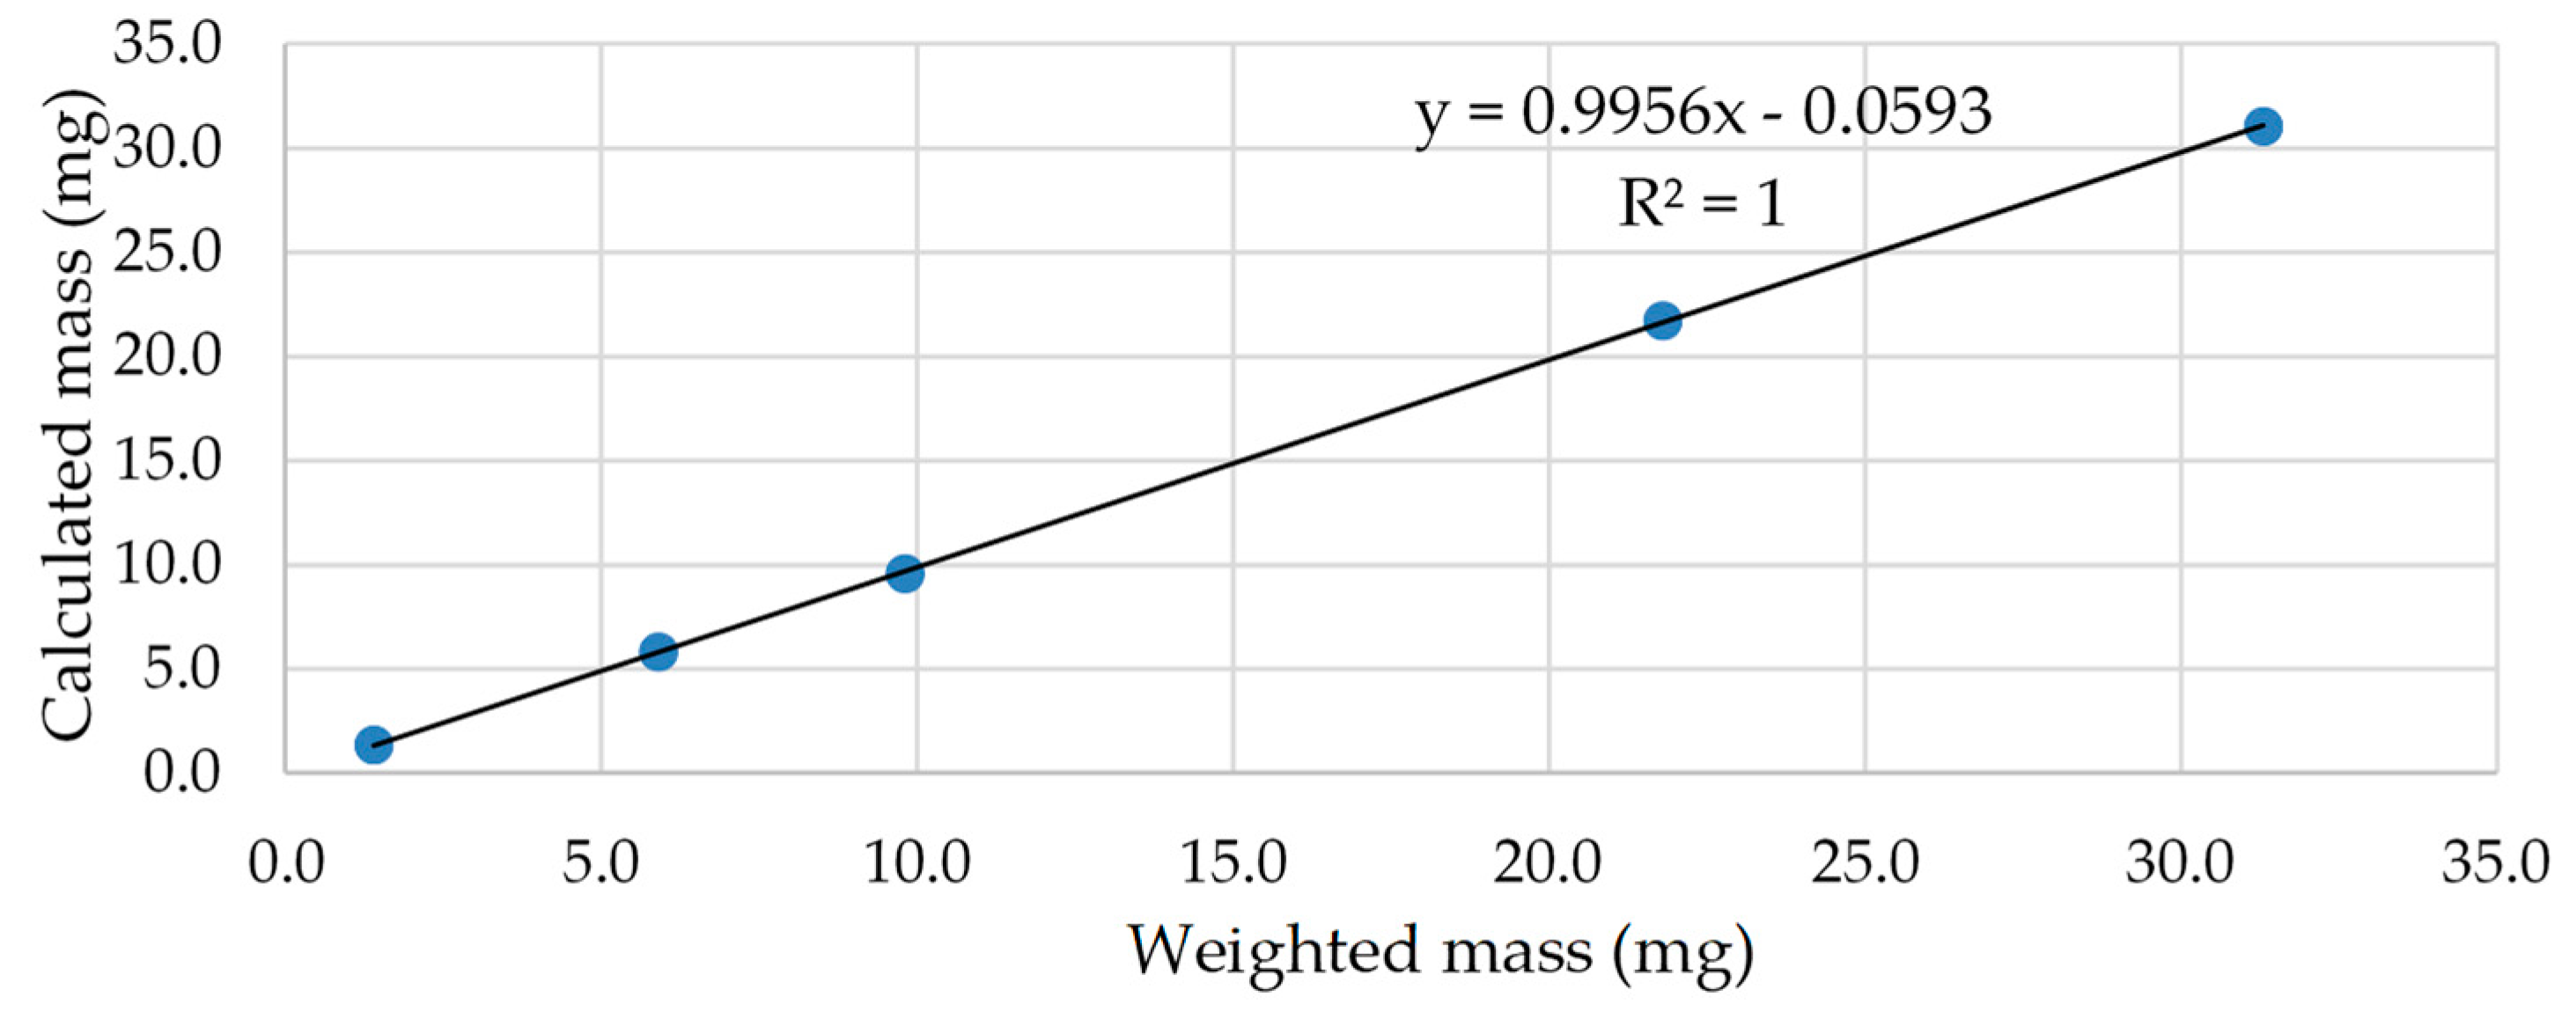
2.2. Quantitative Analysis of Ursolic Acid and Oleanolic Acid in I. aquifolium Dichloromethane Extract Using 1H-NMR

Whatever the technique used, quantitation of a given component in a mixture requires the comparison of the area(s) of one (or various) signal(s) of that compound with that of a reference compound (internal calibration) or using calibration straight lines (external calibration). Using NMR spectroscopy, it is possible to quantify a component by integration of one of its signals since the area value is proportional to the number of nuclei. Using internal calibration requires a homogenous answer of selected nuclei of the compound and of internal reference. Two parameters are responsible of the uniform or non-uniform answer of nuclei: (i) longitudinal relaxation time (T1) of nuclei and (ii) differences in the Nuclear Overhauser Enhancement (NOE) between selected nuclei of the component and those of the reference.
Despite the similarity of the structures of UA and OA, it is remarkable that the signals of the ethylenic protons of both acids are sufficiently differentiated (triplets at δ = 5.12 ppm and 5.15 ppm, respectively) (Figure 3). They are sufficiently resolved and they do not overlap with those of minor components. Therefore, they could be used to quantify both triterpene acids in dichloromethane extract. Ursolic acid, which is the main component according to the intensities of signals in the 13C-NMR spectrum of the dichloromethane extract, has been chosen as a reference compound for validation of the method. DMSO-d6 has been chosen as a solvent and anisole (methoxybenzene) as an internal reference. Signals of its methoxy group (3.73 ppm, singlet) as well as those of aromatic protons (6.87 ppm, 6.91 ppm, 7.27 ppm) do not overlap with those of most triterpenes.
T1 value of ethylenic proton of ursolic acid has been measured by the inversion recovery method (T1 = 0.1 s, DMSO-d6) and compared to those of the methoxy group of anisole (T1 = 0.7 s, DMSO-d6).
According to Becker et al. [39], we determined and plotted the percentage of recovered signal S:N (%), as a function of the pulse angle α, for the carbons with T1 = 0.1 s and 0.7 s (values for selected protons of UA and an internal standard). We observed that this difference is extremely low for a flip angle of 30°.
We checked if the usual pulse sequence used for recording 1H-NMR spectra (flip angle = 30°, total recycling time = 3.56 s, see Experimental) was appropriate for quantitation of UA in dichloromethane extract of I. aquifolium leaves.
Accuracy, precision, and response linearity of such a procedure was validated by several experiments carried out using commercial UA (purity: 95%) as reported below, while taking into account the relative areas of ethylenic proton of ursolic acid, on the one hand, and the three protons of the methoxy group of anisole, on the other hand. The contents of UA were calculated with Formula (1).
m U A = 3   × A U A × M U A × m A × P A A A × M A × P U A
mUA = calculated mass (mg) of ursolic acid, AUA and MUA = area of the ethylenic signal and molecular weight (456 g mol−1) of ursolic acid, mA, MA, and AA = amount (mg), molecular weight (108 g mol−1), and area of the signal of methoxy group of anisole, fixed at 1.0000 in all experiments. Factor 3 is due to the integration of the three protons of the methoxy group of anisole. PA and PUA = purity of anisole (0.99) and UA (0.95), respectively.
Accuracy of the quantitative procedure was checked by comparing the amounts of pure UA, diluted in DMSO-d6, at different concentrations (1.4–30.9 mg of UA in presence of 1.2 mg of anisole, in 0.5 mL DMSO-d6) and measured by NMR, with the weighted ones (Table 1). The relative error ranged between −1.0% and +1.7%, which is acceptable for a spectroscopic method.
In order to check the precision, three spectra of the same sample containing ursolic acid and anisole have been recorded with the same experimental conditions. The mass of UA has been calculated using Formula (1). The measured area of UA ethylenic proton with respect to that of the methoxy group of anisole, fixed at 1.0000, were practically constant (1.3006–1.3151). The relative error between the calculated mass of UA and the weighted one varied between −1.0% and 0.0% (Table 2).
Response linearity has been evaluated by plotting the measured mass of ursolic acid versus the weighted one in the diagram below and it looks perfectly correct with R2 = 1 (Figure 4).
Lastly, the limit of detection (LOD) and the limit of quantitation (LOQ) (see Experimental) have been measured at 0.14 mg and 2.37 mg, respectively.
The quantitation of ursolic acid using 1H-NMR being validated, this technique has been used to evaluate the content of UA in I. aquifolium dichloromethane leaf extract and it has been extrapolated to OA, which is a structurally close isomer (Table 3, Figure 2). UA accounted for 55.3% of the dichloromethane extract, followed by OA, 20.8%. Both triterpene acids represented more than two thirds of the extract. Therefore, the investigated leaves from I. aquifolium contained 1.3% of ursolic acid and 0.5% of oleanolic acid.
For comparison with our results, UA and OA have been found in various plant extracts.
-
OA is widely distributed in food and plants. Medicinal plants such as Lantana camara are rich sources of OA (0.21–0.58% in flowers, 1.14–1.67% in roots) [26]. Common culinary spices (thyme, clove plants) and fruit plants (apple, loquat, elderberry, and sage) are also sources of OA [40]. Overall, OA can easily be obtained in high yield (up to 3.1%) from olive tree leaves, which is its main commercial source [40].
-
In parallel, UA is widely distributed especially in higher plants [41]. For instance, it is present in bearberry leaves (1.24%) [40], in dry flowers of loquat tree (0.22–0.27%) [42], in apple peels (1.43% [40]; 0.71% [43], at around 50 mg per medium sized fruit) [44]). UA has been also found in the leaves of Ilex paraguariensis (0.26%) [45]. Concerning I. aquifolium, leaves collected in winter near Camaiore (Lucca, Italy) were extracted successively with light petroleum ether and acetone. UA and OA were the principal constituents of the acetone extract and their relative amounts (%) were evaluated by GC of the corresponding methyl esters trimethylsilyl ethers. UA and OA accounted for 3.34% and 0.067%, respectively, with respect to the dried leaves. However, true quantitation was not performed [7].

3. Material and Methods

3.1. Plant Material and Solvent Extractions

Leaves from I. aquifolium have been harvested in December 2017, in the Isolacciu di Fium’Orbu forest (North-East Corsica, France) and kept at −60 °C. Leaves (98 g) have been crushed in liquid nitrogen and then successively extracted with hexane (600 mL, 18 h, Soxhlet apparatus) and dichloromethane (600 mL, 5 h, Soxhlet apparatus). Solvent has been removed under reduced pressure yielding 1.836 g of hexane extract and 2.281 g of dichloromethane extract, respectively.

3.2. Column Chromatography on Silica Gel (CC)

3.2.1. Hexane Extract

An aliquot (0.997 g) of hexane extract from I. aquifolium leaves has been chromatographed on silica gel (63–200 μm, 60 Å, 25 g), with a gradient of solvent (pentane/diethyl Ether from 100/0 to 0/100), yielding 12 fractions (H1–H12): H1 (100/0; 24 mg), H2 (100/0; 239 mg), H3 (75/25; 17 mg), H4 (75/25; 55 mg), H5 (75/25; 209 mg), H6 (50/50; 95 mg), H7 (50/50; 113 mg), H8 (25/75; 46 mg), H9 (25/75; 17 mg), H10 (0/100; 6 mg), H11 (0/100; 8 mg), and H12 (0/100; 71 mg).
Fraction H6 (84 mg) has been chromatographed once more over silica gel (35–70 μm, 4.0 g) with a gradient of solvent (pentane/diethyl Ether from 60/40 to 0/100) yielding seven sub-fractions (H6.1–H6.7): H6.1 (60/40; 14 mg), H6.2 (60/40; 15 mg), H6.3 (60/40; 14 mg), H6.4 (60/40; 6 mg), H6.5 (50/50; 8 mg), H6.6 (25/75; 6 mg), and H6.7 (0/100; 5 mg).

3.2.2. Dichloromethane Extract

An aliquot (1.075 g) of dichloromethane extract from I. aquifolium leaves has been chromatographed on silica gel (63–200 μm, 60 Å, 25 g), with a gradient of solvent (pentane/diethyl Ether from 100/0 to 0/100) yielding nine fractions (D1–D9): D1 (98/2; 215 mg), D2 (92/8; 50 mg), D3 (80/20; 16 mg), D4 (50/50; 69 mg), D5 (50/50; 36 mg), D6 (0/100; 133 mg), D7 (0/100; 129 mg), D8 (0/100; 108 mg), and D9 (0/100; 62 mg).
Fraction D6 (78 mg) has been again chromatographed over silica gel (35–70 μm, 5 g) with a gradient of solvent (pentane/diethyl Ether from 75/25 to 0/100) yielding six sub-fractions (D6.1–D6.6): D6.1 (75/25; 4 mg), D6.2 (75/25; 6 mg), D6.3 (75/25; 16 mg), D6.4 (80/20; 10 mg), D6.5 (80/20; 9 mg), and D6.6 (0/100; 1 mg).

3.3. Hydrolysis of α-Amyrin and β-Amyrin Esters. Synthesis of Fatty Acid Methyl Esters

An aliquot of fraction H2 (103 mg) has been added to a solution of ethanolic potassium hydroxide (100 mg KOH/2 mL EtOH) and refluxed for 1.5 h. Then, brine (6 mL) has been added and the mixture extracted with pentane (2 × 10 mL). The aqueous layer has been acidified with HCl (1.2 M) until pH = 1 and extracted with pentane (2 × 10 mL). The organic layer has been dried on anhydrous MgSO4 and filtered. The solvent has been removed and yielded 41 mg of fatty acids. Fatty acids have been subjected to BF3/Methanol (5 mL) esterification. Brine (20 mL) was added and the mixture was extracted with pentane (3 × 10 mL). The organic layer has been dried on anhydrous MgSO4 and filtered. The solvent was removed under reduced pressure and yielded 36 mg of fatty acid methyl esters, which have been subjected to GC and GC-MS analysis (see below).

3.4. Analytical GC

Analyses were carried out with a Clarus 500 Perkin Elmer apparatus equipped with two flame ionization detectors (FID), and two fused-silica capillary columns (50 m, 0.22 mm i.d., film thickness 0.25 μm), BP-1 (polydimethylsiloxane), and BP-20 (polyethylene glycol). The oven temperature was programmed from 60 °C to 220 °C at 2 °C/min and then held isothermal at 220 °C for 20 min. The injector temperature was 250 °C. The detector temperature was 250 °C. The carrier gas was hydrogen (1.0 mL/min). The split was 1/60 and the injected volume was 0.5 μL. The relative contents of the oil constituents were expressed as a percentage obtained by peak-area normalization without using correction factors.

3.5. GC-MS Analysis

The fatty acid methyl esters were analyzed with a Perkin–Elmer TurboMass detector (quadrupole), directly coupled to a Perkin–Elmer Autosystem XL equipped with a fused-silica capillary column (50 m, 0.22 mm i.d., film thickness 0.25 μm), BP-1 (polydimethylsiloxane). The carrier gas was helium at 0.8 mL/min. The split was 1/75 and the injection volume was 0.5 μL. The injector temperature was 250 °C. The oven temperature was programmed from 60 °C to 220 °C at 2 °C/min and then held isothermal (20 min). The ion source temperature was 250 °C. The energy ionization was 70 eV. The electron ionization mass spectra were acquired over the mass range 40–400 Da.

3.6. NMR Spectroscopy

All NMR spectra were recorded on a Bruker AVANCE 400 Fourier Transform spectrometer, operating at 400.132 MHz for 1H and 100.623 MHz for 13C, equipped with a 5-mm probe, in deuterated chloroform (CDCl3) or deuterated dimethylsulfoxide (DMSO-d6), with all chemical shifts referred to as internal tetramethylsilane (TMS) for spectra recorded in CDCl3 and to the signal of solvent (39.39 ppm for 13C and 2.50 ppm for 1H) for spectra recorded in DMSO-d6.
13C-NMR spectra of extracts and fractions of chromatography were recorded with the following parameters: flip angle 45°, acquisition time, 2.66 s for 128 K data table with a spectral width of 25,000 Hz (250 ppm), relaxation delay D1 = 0.1 s (total recycling time = 2.76 s), CPD mode decoupling, and digital resolution, 0.183 Hz/pt. The number of accumulated scans was 1000–3000, depending on the available amount of solvent extract or fraction of chromatography (1–50 mg of mixture in 0.5 mL of solvent). Solvent: CDCl3 for extracts (hexane and dichloromethane) and fractions of CC (H1–H12, H6.1–H6.7 and D1–D4), DMSO-d6 for dichloromethane extract, and fractions D5–D9 of CC.
DEPT spectra were recorded with the same parameters, except flip angle (135°).
1H-NMR spectra for quantitation of UA and OA were recorded with the following parameters: flip angle 30°, acquisition time, 2.56 s for 32 K data table with a spectral width of 6410 Hz (16 ppm), and relaxation delay D1 = 1 s (total recycling time = 3.56 s).
Longitudinal relaxation delays: The T1 values of the 1H nuclei were determined by the inversion-recovery method, using the standard sequence: 180°-τ-90°-D1, with a relaxation delay D1 of 5 s for 1H. Each delay of inversion (τ) was, thus, taken into account for the computation of the corresponding T1 using the function Ip = I0 + p.eτ/T1
Limits of detection and quantitation: The limits of detection (LOD) and quantitation (LOQ) were determined experimentally using signal-to-noise ratio (S:N). According to Cerceau et al. [46], the concentration for S:N = 10 and for S:N = 150 were set as LOD and LOQ, respectively. Appropriate mass of ursolic acid (1.4–30.9 mg) was introduced in the NMR tube. In addition, 0.5 mL of DMSO-d6 was added to each of these tubes. Spectra were recorded with 16 scans.

3.7. Identification of Individual Components

Both extracts (hexane and dichloromethane) as well as all the fractions of CC were analyzed by 13C-NMR, following a computerized procedure developed at the University of Corsica (see results) [30,32]. Neutral triterpenes and triterpene acids were identified by comparing their carbon chemical shifts with those of references compiled in the in-house library (which contains about 50 compounds bearing steroidal structures or pentacyclic structures of oleanane, ursane, or lupane families and that is continuously enriched) or literature data (about 550 compounds). Carbon chemical shifts of amyrin fatty acid esters were compared with literature data [35,36]. Fatty acid methyl esters were analyzed by GC (FID), GC-MS, and 13C-NMR by comparing retention indices (RIs), mass spectra, and carbon chemical shifts with those of references compiled in the in-house libraries or literature data.

4. Conclusions

In conclusion, leaves of I. aquifolium may be considered a source of ursolic acid while oleanolic acid may be considered a side-product. The plant is abundant on the one hand. Non polar and medium-polar components may be almost completely eliminated by a first extraction with hexane. Biologically active compounds, ursolic acid, and oleanolic acid could be easily extracted with dichloromethane and their contents in the extract have been measured, for the first time, by 1H-NMR spectroscopy. Taking into account the various biological activities of ursolic acid, reported in the folk medicine and in recent studies (such as antibacterial, antifungal, antiviral, anti-inflammatory, anti-oxidant, anti-wrinkle, anticancer, anti-hepatotoxic, antipyretic, and antidiabetic), and the fair content of that compound in the leaves of I. aquifolium, we can assume that this plant could be appreciated in domains of pharmacology, pharmacognosy, cosmetology, and oncology.
Otherwise, NMR spectroscopy appeared as a powerful tool for (i) the identification of individual components of solvent extracts from plants (13C-NMR) (ii) quantitation of biologically active compounds (1H-NMR) with a short time of occupancy of the spectrometer that allows us to use this technique for quality control.

Supplementary Materials

The following are available online. Table S1: Listing of the chemical shift values compiled in the 13C-NMR spectrum of the Ilex aquifolium hexane extract allowing the identification of α-amyrin, β-amyrin, lupeol and uvaol., Table S2: Listing of the chemical shift values compiled in the 13C-NMR spectrum of the Ilex aquifolium dichloromethane extract allowing the identification of ursolic and oleanolic acids.

Author Contributions

A.B. and M.P. conceived and designed the experiments. D.P. performed sampling, extractions, and purification. A.B., M.P., and D.P. performed GC, GC-MS, and NMR experiments. M.P., A.B., D.P. and J.C. contributed to the data analysis and to the preparation of the manuscript.

Funding

This research received no external funding.

Acknowledgments

The authors are indebted to the Collectivité de Corse (CdC) for the research grant (D.P.).

Conflicts of Interest

The authors declare no conflict of interest.

References

  1. Alikaridis, F. Natural constituents of Ilex species. J. Ethnopharmacol. 1987, 20, 121–144. [Google Scholar] [CrossRef]
  2. Erdemoglu, N.; Iscan, G.; Sener, B.; Palittapongarnpim, P. Antibacterial, antifungal, and antimycobacterial activity of Ilex aquifolium leaves. Pharm. Biol. 2009, 47, 697–700. [Google Scholar] [CrossRef]
  3. Nahar, L.; Russell, W.R.; Middleton, M.; Shoeb, M.; Sarker, S.D. Antioxidant phenylacetic acid derivatives from the seeds of Ilex aquifolium. Acta Pharm. 2005, 55, 187–193. [Google Scholar] [PubMed]
  4. Jalali, H.; Mozaffari Nejad, A.S.; Ebadi, A.G.; Laey, G. Ethnobotany and folk pharmaceutical properties of major trees or shrubs in northeast of Iran. Asian J. Chem. 2009, 21, 5632–5638. [Google Scholar]
  5. Willems, M. A cyanogenic glucoside from Ilex aquifolium. Phytochemistry 1988, 27, 1852–1853. [Google Scholar] [CrossRef]
  6. Hao, D.; Gu, X.; Xiao, P.; Liang, Z.; Xu, L.; Peng, Y. Research progress in the phytochemistry and biology of Ilex pharmaceutical resources. Acta Pharmacol. Sin. 2013, 3, 8–19. [Google Scholar] [CrossRef] [Green Version]
  7. Catalano, S.; Marsili, A.; Morelli, I.; Pistelli, L.; Scartoni, V. Constituents of the leaves of Ilex aquifolium L. Planta Med. 1978, 33, 416–417. [Google Scholar] [CrossRef]
  8. Bate-Smith, E.C. The phenolic constituents of plants and their taxonomic significance. J. Linn. Soc. (Bot.) 1962, 58, 95–173. [Google Scholar]
  9. Ishikura, N. Paper chromatographic analysis of anthocyanins in the red epicarp of Ilex aquifolium. Bot. Mag. Tokyo 1971, 84, 113–117. [Google Scholar] [CrossRef] [Green Version]
  10. Liu, J. Pharmacology of oleanolic acid and ursolic acid. J. Ethnopharmacol. 1995, 49, 57–68. [Google Scholar] [CrossRef]
  11. Fontanay, S.; Grare, M.; Mayer, J.; Finance, C.; Duval, R.E. Ursolic, oleanolic and betulinic acids: Antibacterial spectra and selectivity indexes. J. Ethnopharmacol. 2008, 120, 272–276. [Google Scholar] [CrossRef] [PubMed]
  12. Ikeda, Y.; Murakami, A.; Ohigashi, H. Ursolic acid: An anti- and pro-inflammatory triterpenoid. Mol. Nutr. Food Res. 2008, 52, 26–42. [Google Scholar] [CrossRef]
  13. Sultana, N. Clinically useful anticancer, antitumor, and antiwrinkle agent, ursolic acid and related derivatives as medicinally important natural product. J. Enzyme Inhib. Med. Chem. 2011, 26, 616–642. [Google Scholar] [CrossRef] [PubMed]
  14. Wozniak, L.; Skapska, S.; Marszalek, K. Ursolic acid - A pentacyclic triterpenoid with a wide spectrum of pharmacological activities. Molecules 2015, 20, 20614–20641. [Google Scholar] [CrossRef] [PubMed] [Green Version]
  15. Ayeleso, T.B.; Matumba, M.G.; Mukwevho, E. Oleanolic acid and its derivatives: Biological activities and therapeutic potential in chronic diseases. Molecules 2017, 22, 1915. [Google Scholar] [CrossRef] [PubMed] [Green Version]
  16. Both, D.M.; Goodtzova, K.; Yarosh, D.B.; Brown, D.A. Liposome-encapsulated ursolic acid increases ceramides and collagen in human skin cells. Arch. Dermatol. Res. 2002, 293, 569–575. [Google Scholar] [CrossRef] [PubMed]
  17. Seebacher, W.; Simic, N.; Weis, R.; Saf, R.; Kunert, O. Complete assignments of 1H and 13C-NMR resonances of oleanolic acid, 18α-oleanolic acid, ursolic acid and their 11-oxo derivatives. Magn. Reson. Chem. 2003, 41, 636–638. [Google Scholar] [CrossRef]
  18. Xu, C.; Wang, B.; Pu, Y.; Tao, J.; Zhang, T. Techniques for the analysis of pentacyclic triterpenoids in medicinal plants. J. Sep. Sci. 2018, 41, 6–19. [Google Scholar] [CrossRef] [Green Version]
  19. Verma, S.C.; Jain, C.L.; Nigami, S.; Padhi, M.M. Rapid extraction, isolation, and quantification of oleanolic acid from Lantana camara L. roots using microwave and HPLC–PDA techniques. Acta Chromatogr. 2013, 25, 181–199. [Google Scholar] [CrossRef]
  20. Jiang, Q.; Zou, S.Q. Determination of five triterpenic acids from Salvia chinensis of different parts by RP-HPLC-PDA. China J. Chin. Mater. Med. 2014, 39, 4379–4382. [Google Scholar]
  21. Mirjalili, M.H.; Ayyari, M.; Bakhtiar, Z.; Moridi Farimani, M.; Sonboli, A. Quantification of betulinic, oleanolic and ursolic acids as medicinally important triterpenoids in some Thymus species from Iran. Res. J. Pharmacognosy 2016, 3, 23–28. [Google Scholar]
  22. Vaidya, V.V.; Pradhan, P.M.; Shinde, M.A. High performance liquid chromatography method for simultaneous quantification of oleanolic acid, lupeol and β-sitosterol from Nyctanthes arbor-tristis and its marketed formulation. Int. J. Res. Pharm. Chem. 2017, 7, 387–393. [Google Scholar]
  23. Shen, D.; Pan, M.H.; Wu, Q.L.; Park, C.H.; Juliani, H.R.; Ho, C.T.; Simon, J.E. LC-MS method for the simultaneous quantitation of the anti-inflammatory constituents in oregano (Origanum species). J. Agric. Food Chem. 2010, 58, 7119–7125. [Google Scholar] [PubMed]
  24. Olmo-García, L.; Bajoub, A.; Monasterio, R.P.; Fernández-Gutiérrez, A.; Carrasco-Pancorbo, A. Development and validation of LC-MS-based alternative methodologies to GC-MS for the simultaneous determination of triterpenic acids and dialcohols in virgin olive oil. Food Chem. 2018, 239, 631–639. [Google Scholar] [CrossRef] [PubMed]
  25. Moldoveanu, S.; Scott, W.A. Analysis of four pentacyclic triterpenoid acids in several bioactive botanicals with gas and liquid chromatography and mass spectrometry detection. J. Sep. Sci. 2016, 39, 324–332. [Google Scholar] [CrossRef] [PubMed]
  26. Pandey, D.K.; Malik, T.; Banik, R.M. Validated HPTLC method for quantification of variability in content of oleanolic acid in different variety of Lantana camara. Pharmacologia 2013, 4, 126–131. [Google Scholar]
  27. Gupta, A.; Maheta, P.; Chauhan, R.; Pandey, S.; Singh Yadav, J.; Shah, S. Simultaneous quantification of bioactive triterpene acids (ursolic acid and oleanolic acid) in different extracts of Eucalyptus globulus (L.) by HPTLC method. Pharmacogn. J. 2018, 10, 179–185. [Google Scholar]
  28. Caligiani, A.; Malavasi, G.; Palla, G.; Marseglia, A.; Tognolini, M.; Bruni, R. A simple GC-MS method for the screening of betulinic, corosolic, maslinic oleanolic and ursolic acid contents in commercial botanicals used as food supplement ingredients. Food Chem. 2013, 136, 735–741. [Google Scholar] [CrossRef]
  29. Duquesnoy, E.; Castola, V.; Casanova, J. Identification and quantitative determination of triterpenes in the hexane extract of Olea europaea L. leaves using 13C-NMR spectroscopy. Phytochem. Anal. 2007, 18, 347–353. [Google Scholar] [CrossRef]
  30. Kontogianni, V.G.; Exarchou, V.; Troganis, A.; Gerothanassis, I.P. Rapid and novel discrimination and quantification of oleanolic and ursolic acids in complex plant extracts using two-dimensional nuclear magnetic resonance spectroscopy-Comparison with HPLC methods. Anal. Chim. Acta 2009, 635, 188–195. [Google Scholar]
  31. Castola, V.; Bighelli, A.; Casanova, J. Direct qualitative and quantitative analysis of triterpenes using 13C-NMR spectroscopy exemplified by dichloromethanic extracts of cork. Appl. Spectrosc. 1999, 53, 344–350. [Google Scholar] [CrossRef]
  32. Gunstone, F.D.; Pollard, M.R.; Scrimgeour, C.M.; Vedanayagam, H.S. Fatty acids. Part 50. 13C Nuclear Magnetic Resonance studies of olefinic fatty acids and esters. Chem. Phys. Lipids 1977, 18, 115–129. [Google Scholar] [CrossRef]
  33. Alexandri, E.; Ahmed, R.; Siddiqui, H.; Choudhary, M.I.; Tsiafoulis, C.G.; Gerothanassis, I.P. High resolution NMR spectroscopy as a structural and analytical tool for unsaturated lipids in solution. Molecules 2017, 22, 1663. [Google Scholar] [CrossRef]
  34. Kim, D.H.; Han, K.M.; Chung, I.S.; Kim, D.K.; Kim, S.H.; Kwon, B.M.; Jeong, T.S.; Park, M.H.; Ahn, E.M.; Baek, N.I. Triterpenoids from the flower of Campsis grandiflora K. Schum. as human AcyI-CoA: Cholesterol acyltransferase inhibitors. Arch. Pharm. Res. 2005, 28, 550–556. [Google Scholar] [CrossRef]
  35. Zhang, Y.; Jayaprakasam, B.; Seeram, N.P.; Olson, L.K.; DeWitt, D.; Nair, M.G. Insulin secretion and cyclooxygenase enzyme inhibition by cabernet sauvignon grape skin compounds. J. Agric. Food Chem. 2004, 52, 228–233. [Google Scholar] [CrossRef]
  36. Niemann, G.J.; Baas, W.J. The composition of the lipid constituents of Ilex aquifolium L. (Aquifoliaceae) in relation to the age of the leaf. I. The leaf wax. J. Plant. Physiol. 1985, 118, 219–226. [Google Scholar] [CrossRef]
  37. Van Genderen, H.H.; Jaarsma, J. Triterpenes and alkanes in developing variegated and albino leaves of Ilex aquifolium L. (Aquifoliaceae). Plant. Sci. 1990, 72, 165–172. [Google Scholar] [CrossRef]
  38. Nam, A.M.; Paoli, M.; Castola, V.; Casanova, J.; Bighelli, A. Identification and quantitative determination of lignans in Cedrus atlantica resins using 13C-NMR spectroscopy. Nat. Prod. Commun. 2011, 6, 379–385. [Google Scholar] [CrossRef] [Green Version]
  39. Becker, E.D.; Ferretti, J.A.; Gambhir, P.N. Selection of optimum parameters for pulse Fourier transform nuclear magnetic resonance. Anal. Chem. 1979, 51, 1413–1420. [Google Scholar] [CrossRef]
  40. Jäger, S.; Trojan, H.; Kopp, T.; Laszczyk, M.N.; Scheffler, A. Pentacyclic triterpene distribution in various plants–rich sources for a new group of multi-potent plant extracts. Molecules 2009, 14, 2016–2031. [Google Scholar] [CrossRef] [Green Version]
  41. Babalola, I.T.; Shode, F.O. Ubiquitous ursolic acid: A potential pentacyclic triterpene natural product. J. Pharmacogn. Phytochem. 2013, 2, 214–222. [Google Scholar]
  42. Zhou, C.; Chen, K.; Sun, C.; Chen, Q.; Zhang, W.; Li, X. Determination of oleanolic acid, ursolic acid and amygdalin in the flower of Eriobotrya japonica Lindl. by HPLC. Biomed. Chromatogr. 2007, 21, 755–761. [Google Scholar] [CrossRef] [PubMed]
  43. Yamaguchi, H.; Noshita, T.; Kidachi, Y.; Umetsu, H.; Hayashi, M.; Komiyama, K.; Funayama, S.; Ryoyama, K. Isolation of ursolic acid from apple peels and its specific efficacy as a potent antitumor agent. J. Health Sci. 2008, 54, 654–660. [Google Scholar] [CrossRef] [Green Version]
  44. Frighetto, R.T.S.; Welendorf, R.M.; Nigro, E.N.; Frighetto, N.; Siani, A.C. Isolation of ursolic acid from apple peels by high speed counter-current chromatography. Food Chem. 2008, 106, 767–771. [Google Scholar] [CrossRef]
  45. Gnoatto, S.C.; Dassonville-Klimpt, A.; Da Nascimento, S.; Galéra, P.; Boumediene, K.; Gosmann, G.; Sonnet, P.; Moslemi, S. Evaluation of ursolic acid isolated from Ilex paraguariensis and derivatives on aromatase inhibition. Eur. J. Med. Chem. 2008, 43, 1865–1877. [Google Scholar] [CrossRef]
  46. Cerceau, C.I.; Barbosa, L.C.A.; Alvarenga, E.S.; Ferreira, A.G.; Thomasi, S.S. A validated 1H-NMR method for quantitative analysis of α-bisabolol in essential oils of Eremanthus erythropappus. Talanta 2016, 161, 71–79. [Google Scholar] [CrossRef]
Sample Availability: Samples of the compounds are not available from the authors.
Figure 1. Method for identification of components in solvent extract from leaves of Ilex aquifolium.
Molecules 24 04413 g001
Figure 2. Structures of pentacyclic triterpenes contained in leaves of I. aquifolium extracts.
Molecules 24 04413 g002
Figure 3. Partial 1H-NMR spectrum of Ilex aquifolium dichloromethane leaf extract.
Molecules 24 04413 g003
Figure 4. Response linearity of quantitation of ursolic acid using 1H NMR.
Molecules 24 04413 g004
Table 1. Accuracy of ursolic acid (UA) measurements by NMR.
Exp n°Anisole AreaMass of Anisole (mg)UA AreaWeighted Mass (mg)Calculated Mass (mg)RE%
11.00001.20.08571.41.40.0
21.00001.20.37825.96.01.7
31.00001.20.61879.89.80.0
41.00001.21.300620.820.6−1.0
51.00001.21.929730.930.6−1.0
UA = Selected signal of UA at 5.12 ppm, calculated mass, according to Formula (1); RE: relative error.
Table 2. Precision of ursolic acid (UA) measurements by NMR.
Test 1Test 2Test 3
Weighted mass of UA (mg)20.820.820.8
UA Area1.30061.31511.3077
Calculated mass of UA (mg)20.620.820.7
RE (%)−1.00.0−0.5
UA Area: area of the signal of the ethylenic proton of UA with respect to that of methoxy protons of anisole fixed at 1.0000; RE: relative error.
Table 3. Quantitation of ursolic acid (UA) and oleanolic acid (OA) in the dichloromethane leaf extract from Ilex aquifolium.
Ursolic AcidOleanolic Acid
AUA0.4380AOA0.1658
mUA (mg)8.7mOA (mg)3.3
UA content (%)55.3OA content (%)20.8
Mass of extract: 15.9 mg. Area of the signal of methoxy group of anisole is fixed at 1.0000 in all experiments, amount of anisole (mA) = 1.5 mg, purity of anisole: 0.99, molecular weight of UA and OA: 456 g mol−1, molecular weight of anisole: 108 g mol−1, AUA and AOA: areas of the signal belonging to the ethylenic proton of UA (5.12 ppm) and of OA (5.15 ppm), respectively, mUA and mOA: calculated mass (mg) of UA and OA, respectively, according to Formula (1).

