Supercritical CO2 Extraction of Extracted Oil from Pistacia lentiscus L.: Mathematical Modeling, Economic Evaluation and Scale-Up

 ,
,
Abstract
:1. Introduction
2. Materials and Methods
2.1. Materials
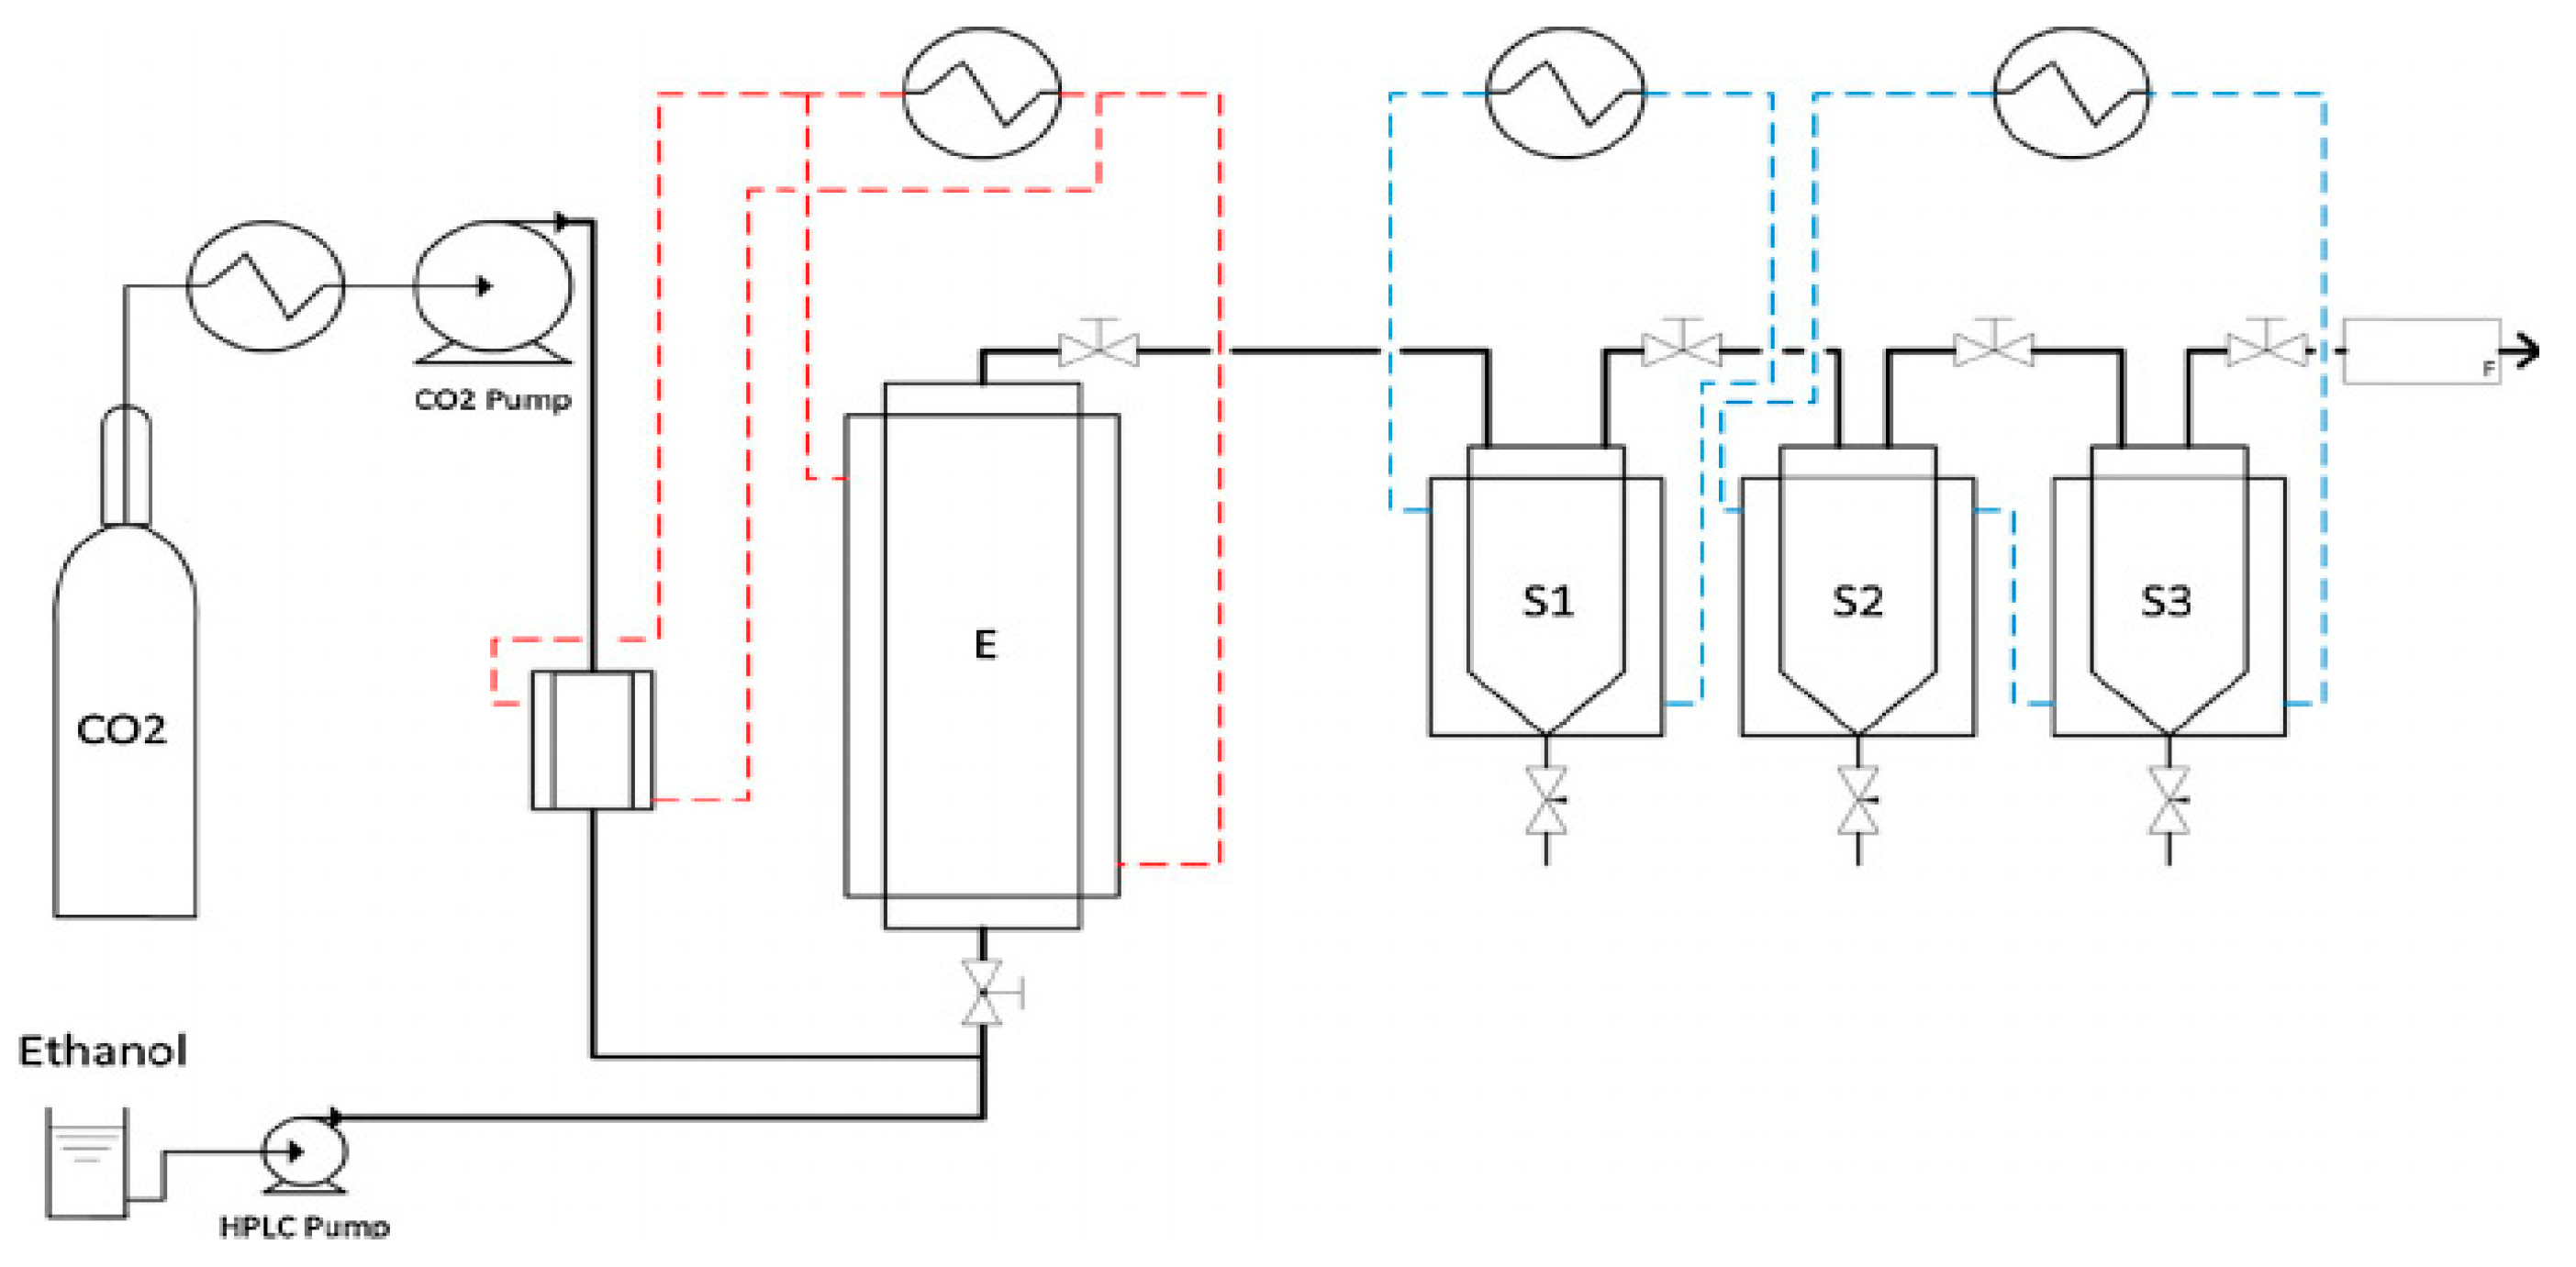
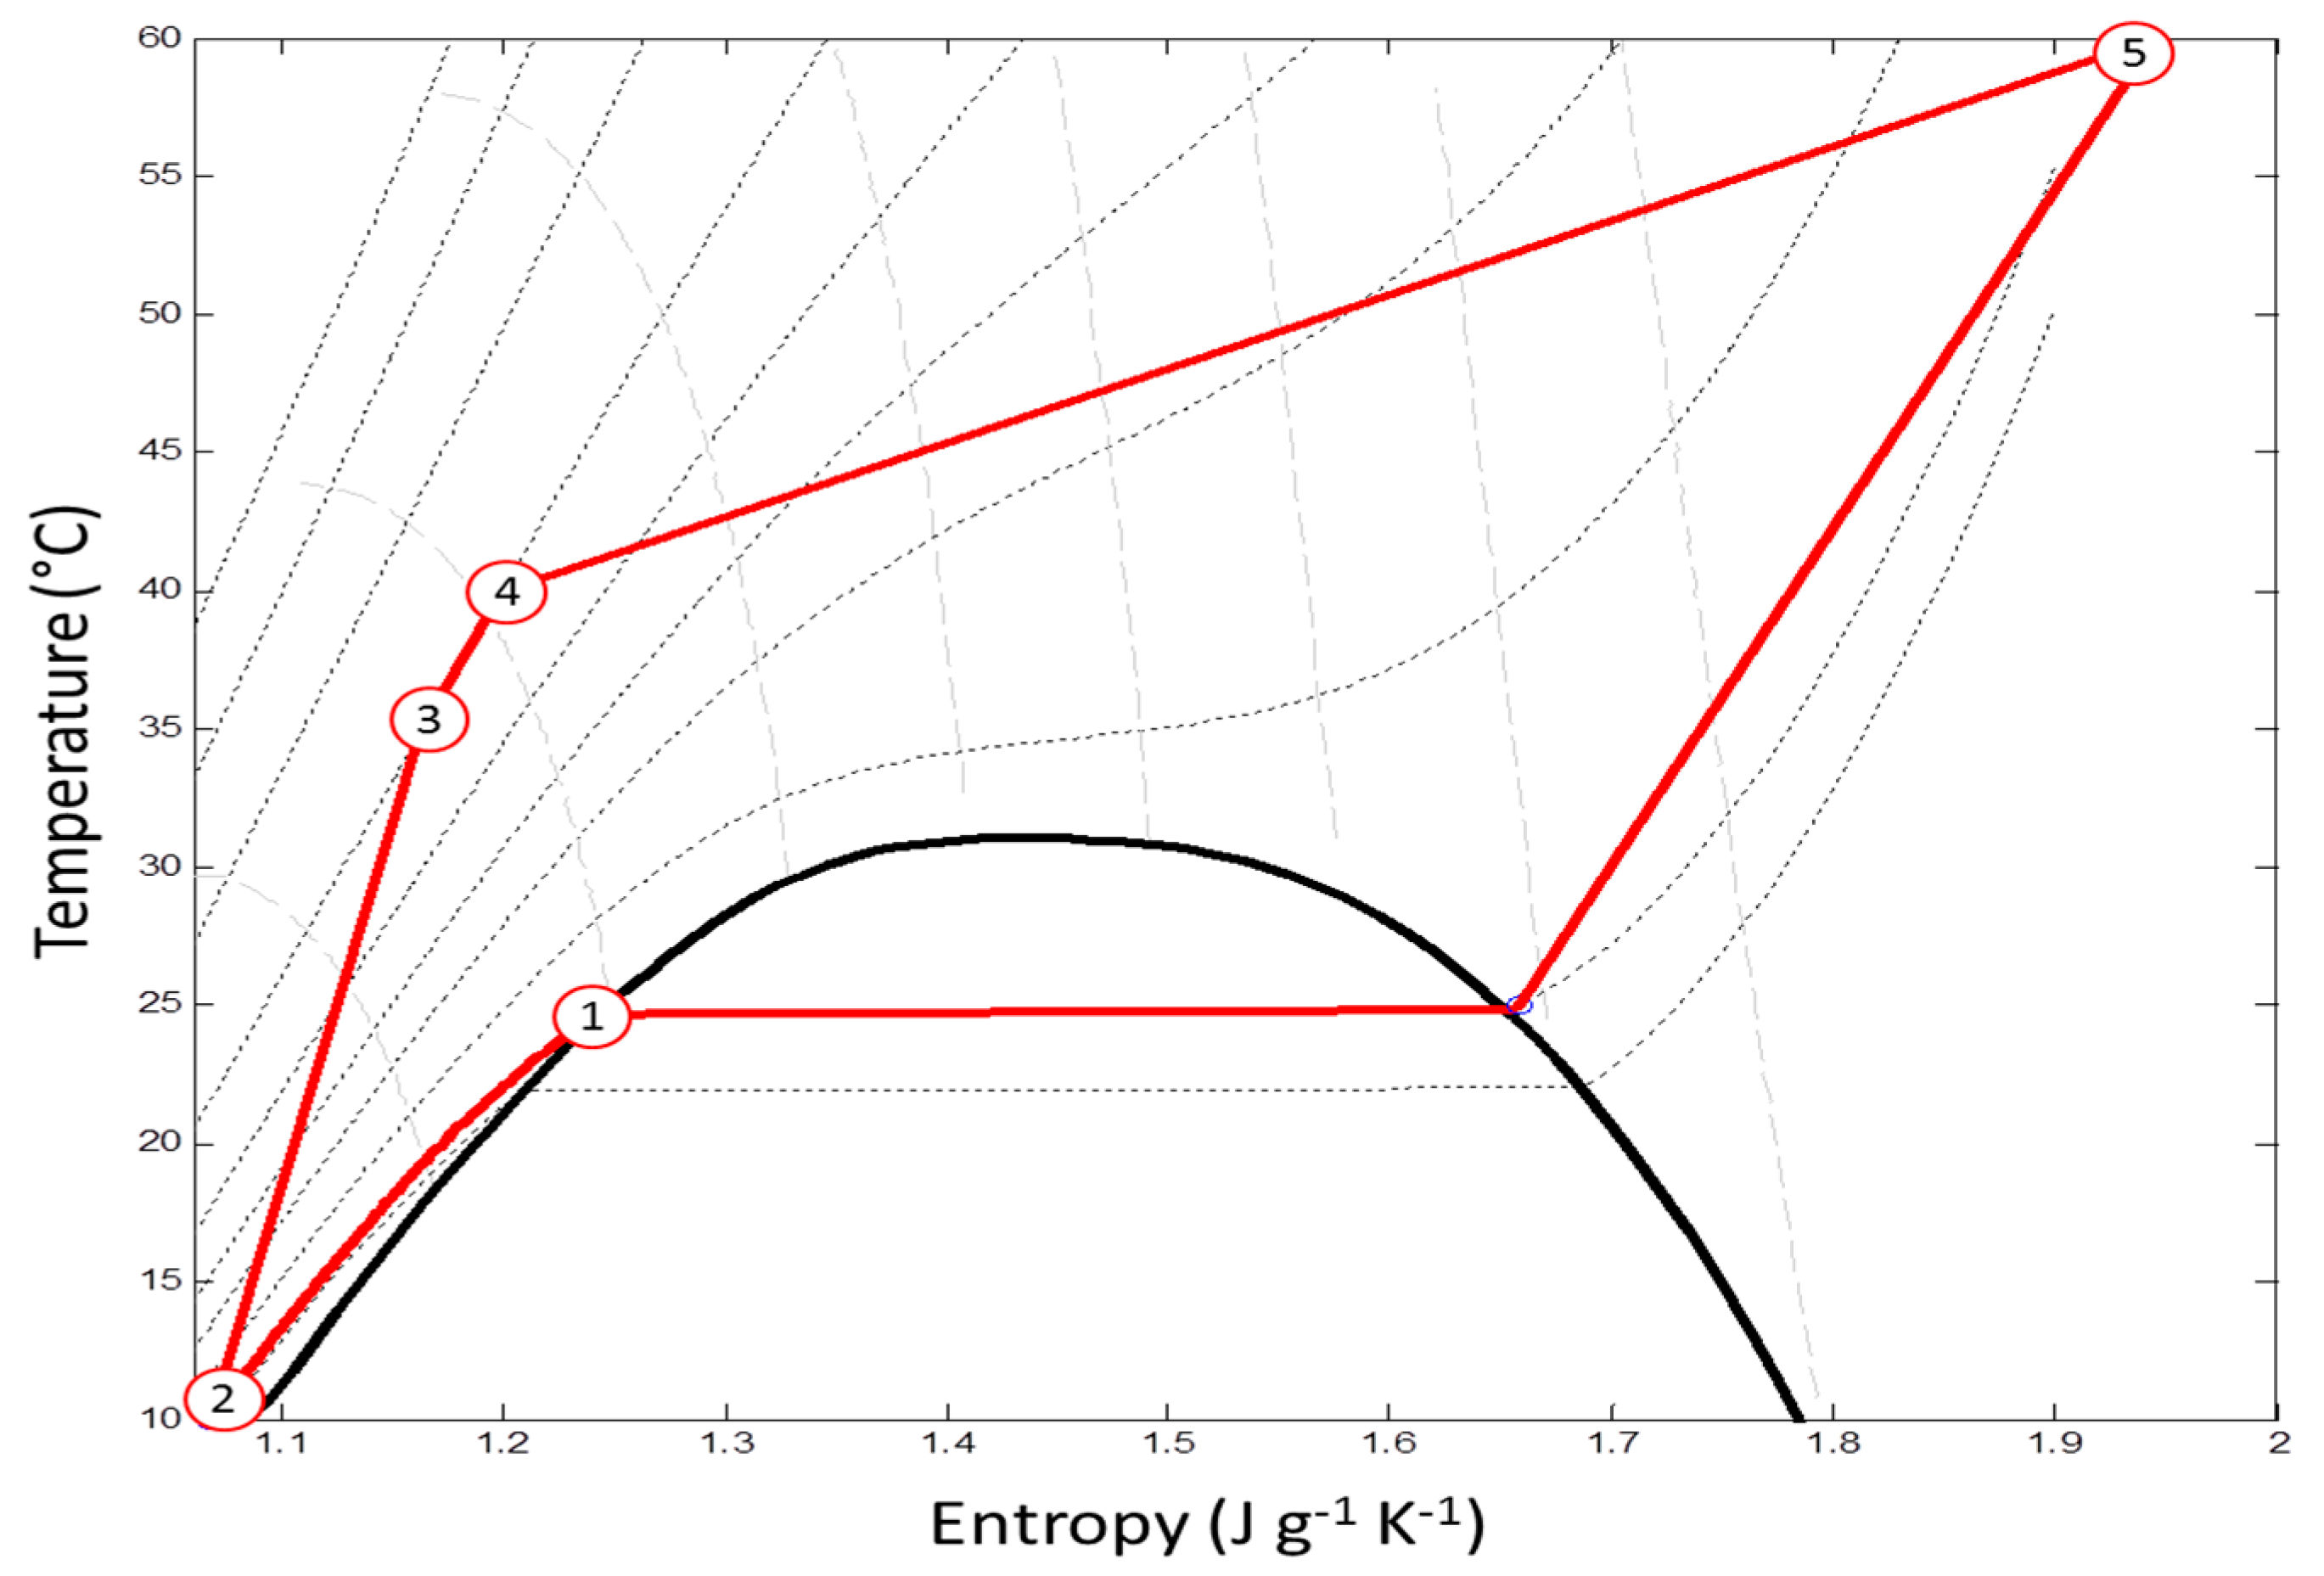
2.2. The Procedure of Supercritical Fluid Extraction
2.3. Analysis
Gas Chromatography-Flame Ionization Detector/Mass Spectrometry (GC-FID/MS)
2.4. Response Surface Methodology (RSM)
2.5. Modeling of the Supercritical Extraction Process
2.6. Cost Estimation of Processes and Scale-Up
3. Results and Discussion
3.1. Study the Effect of Operating Conditions on the Yield Using RSM
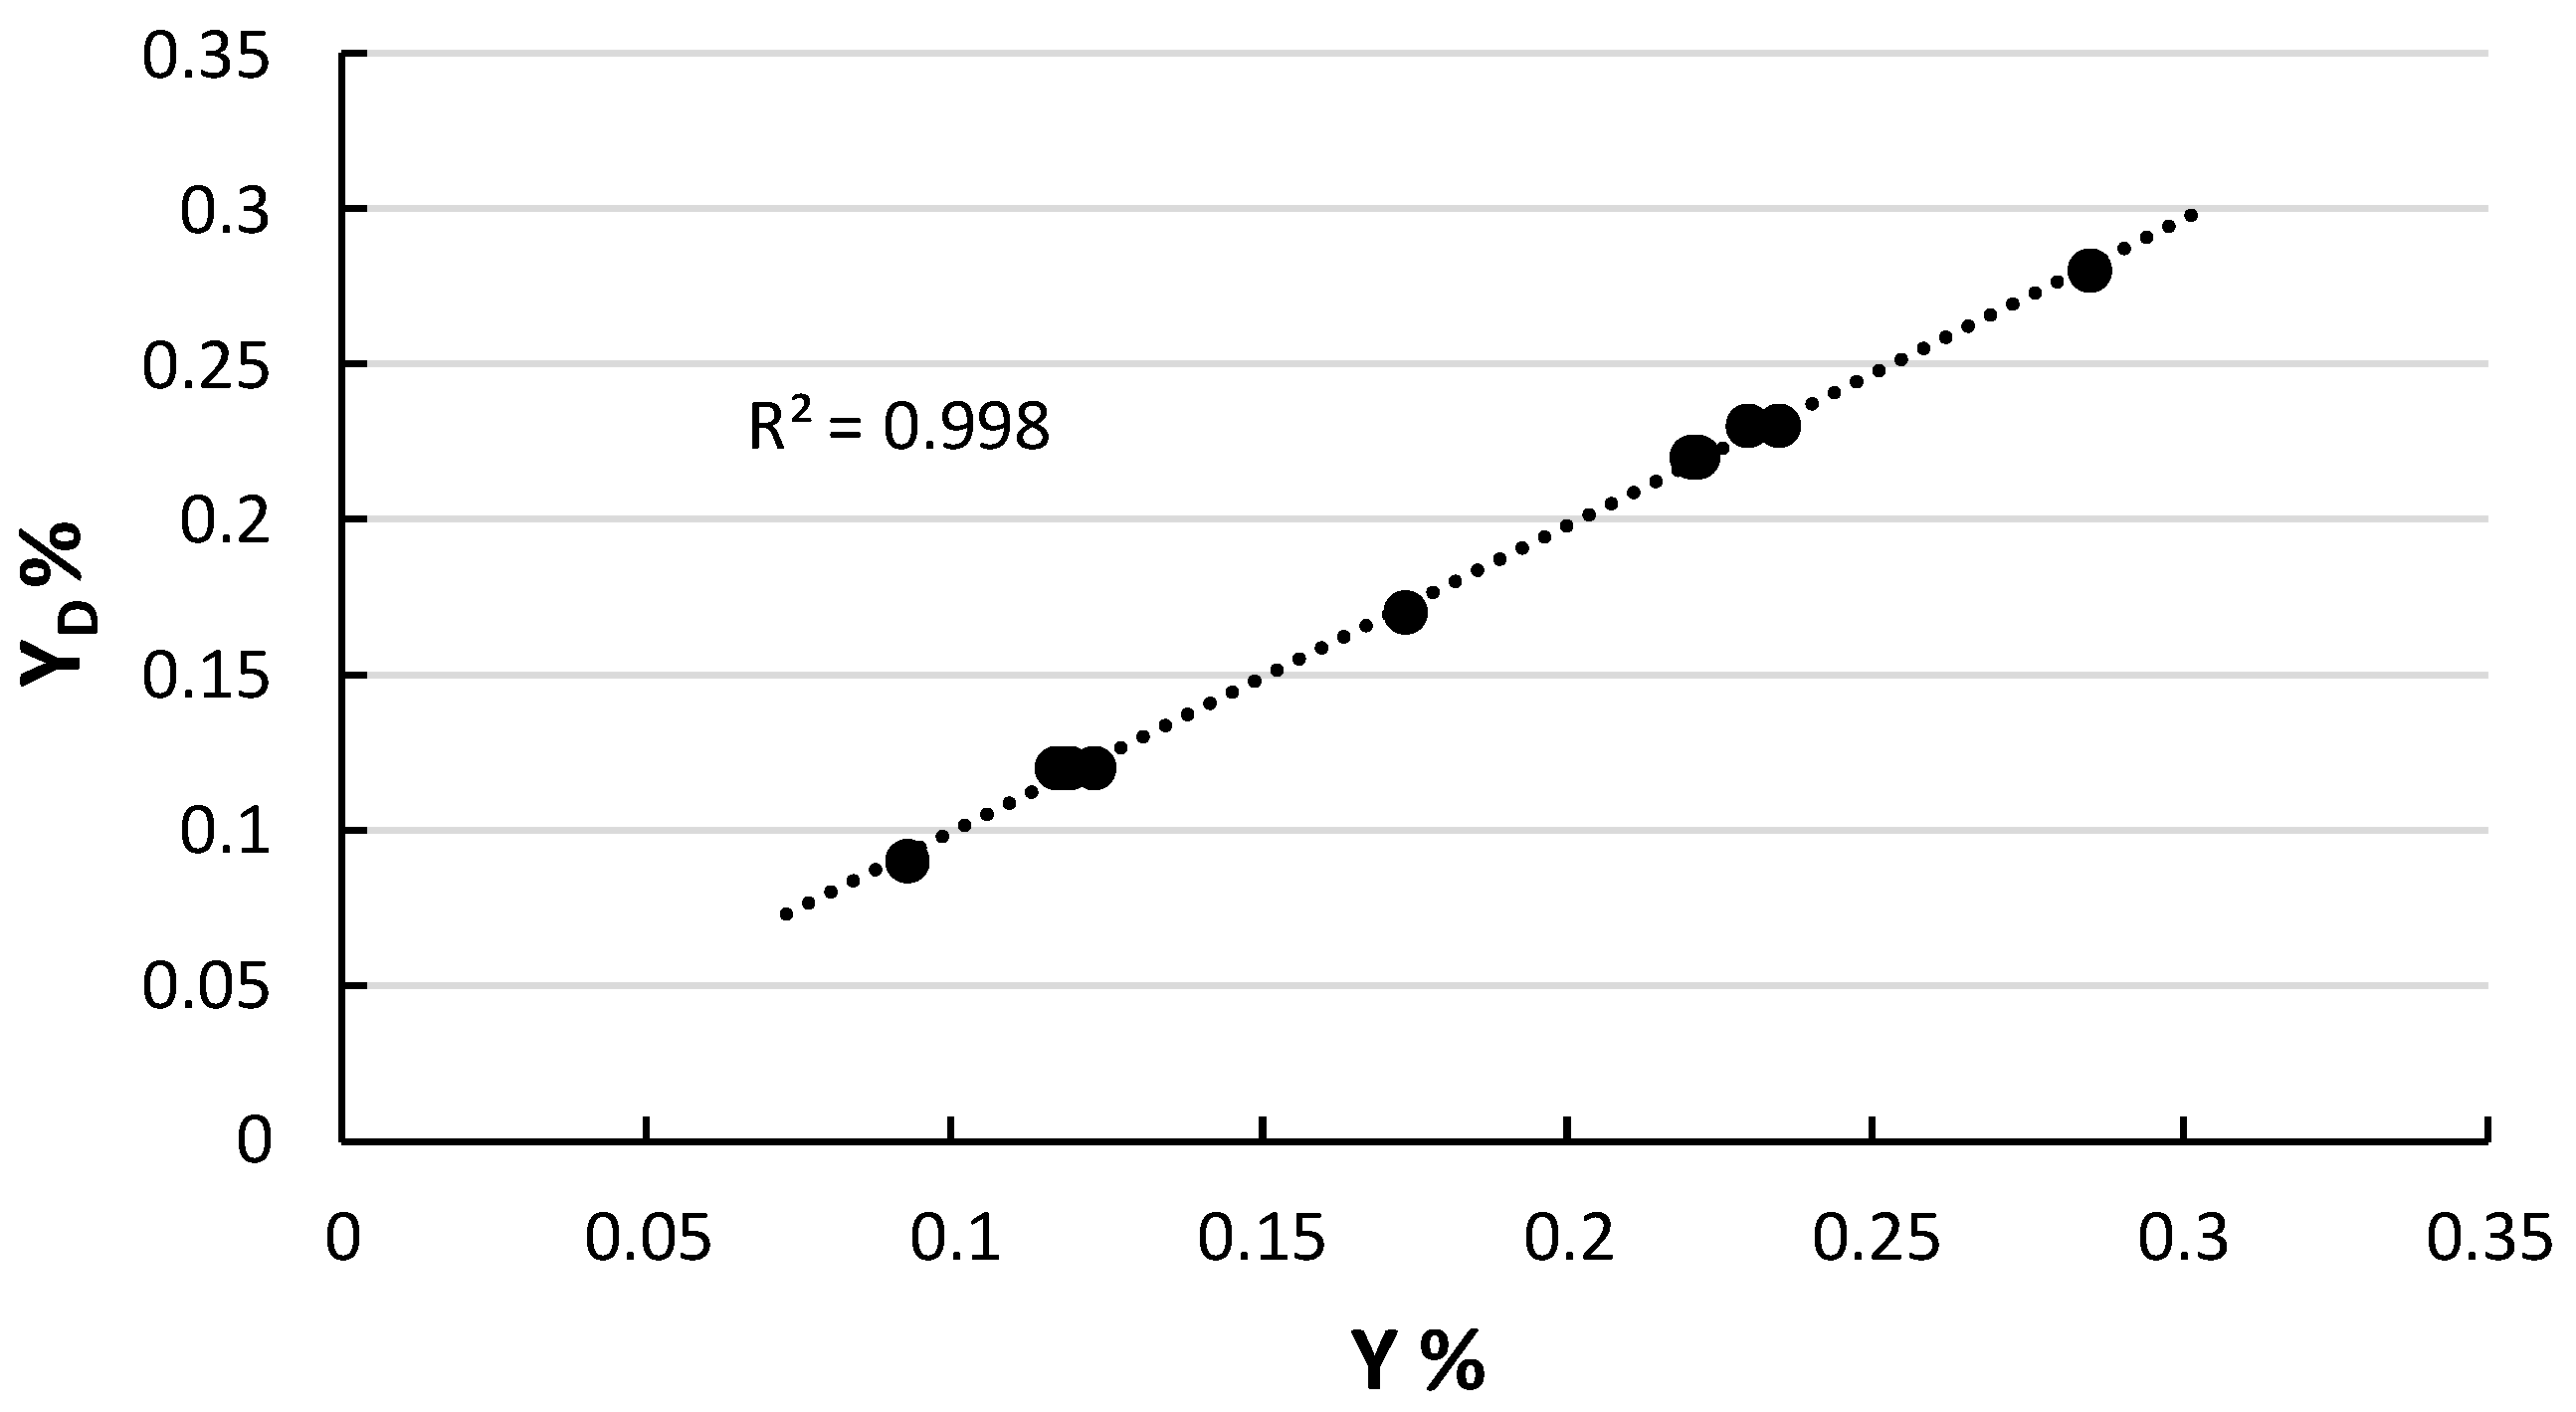
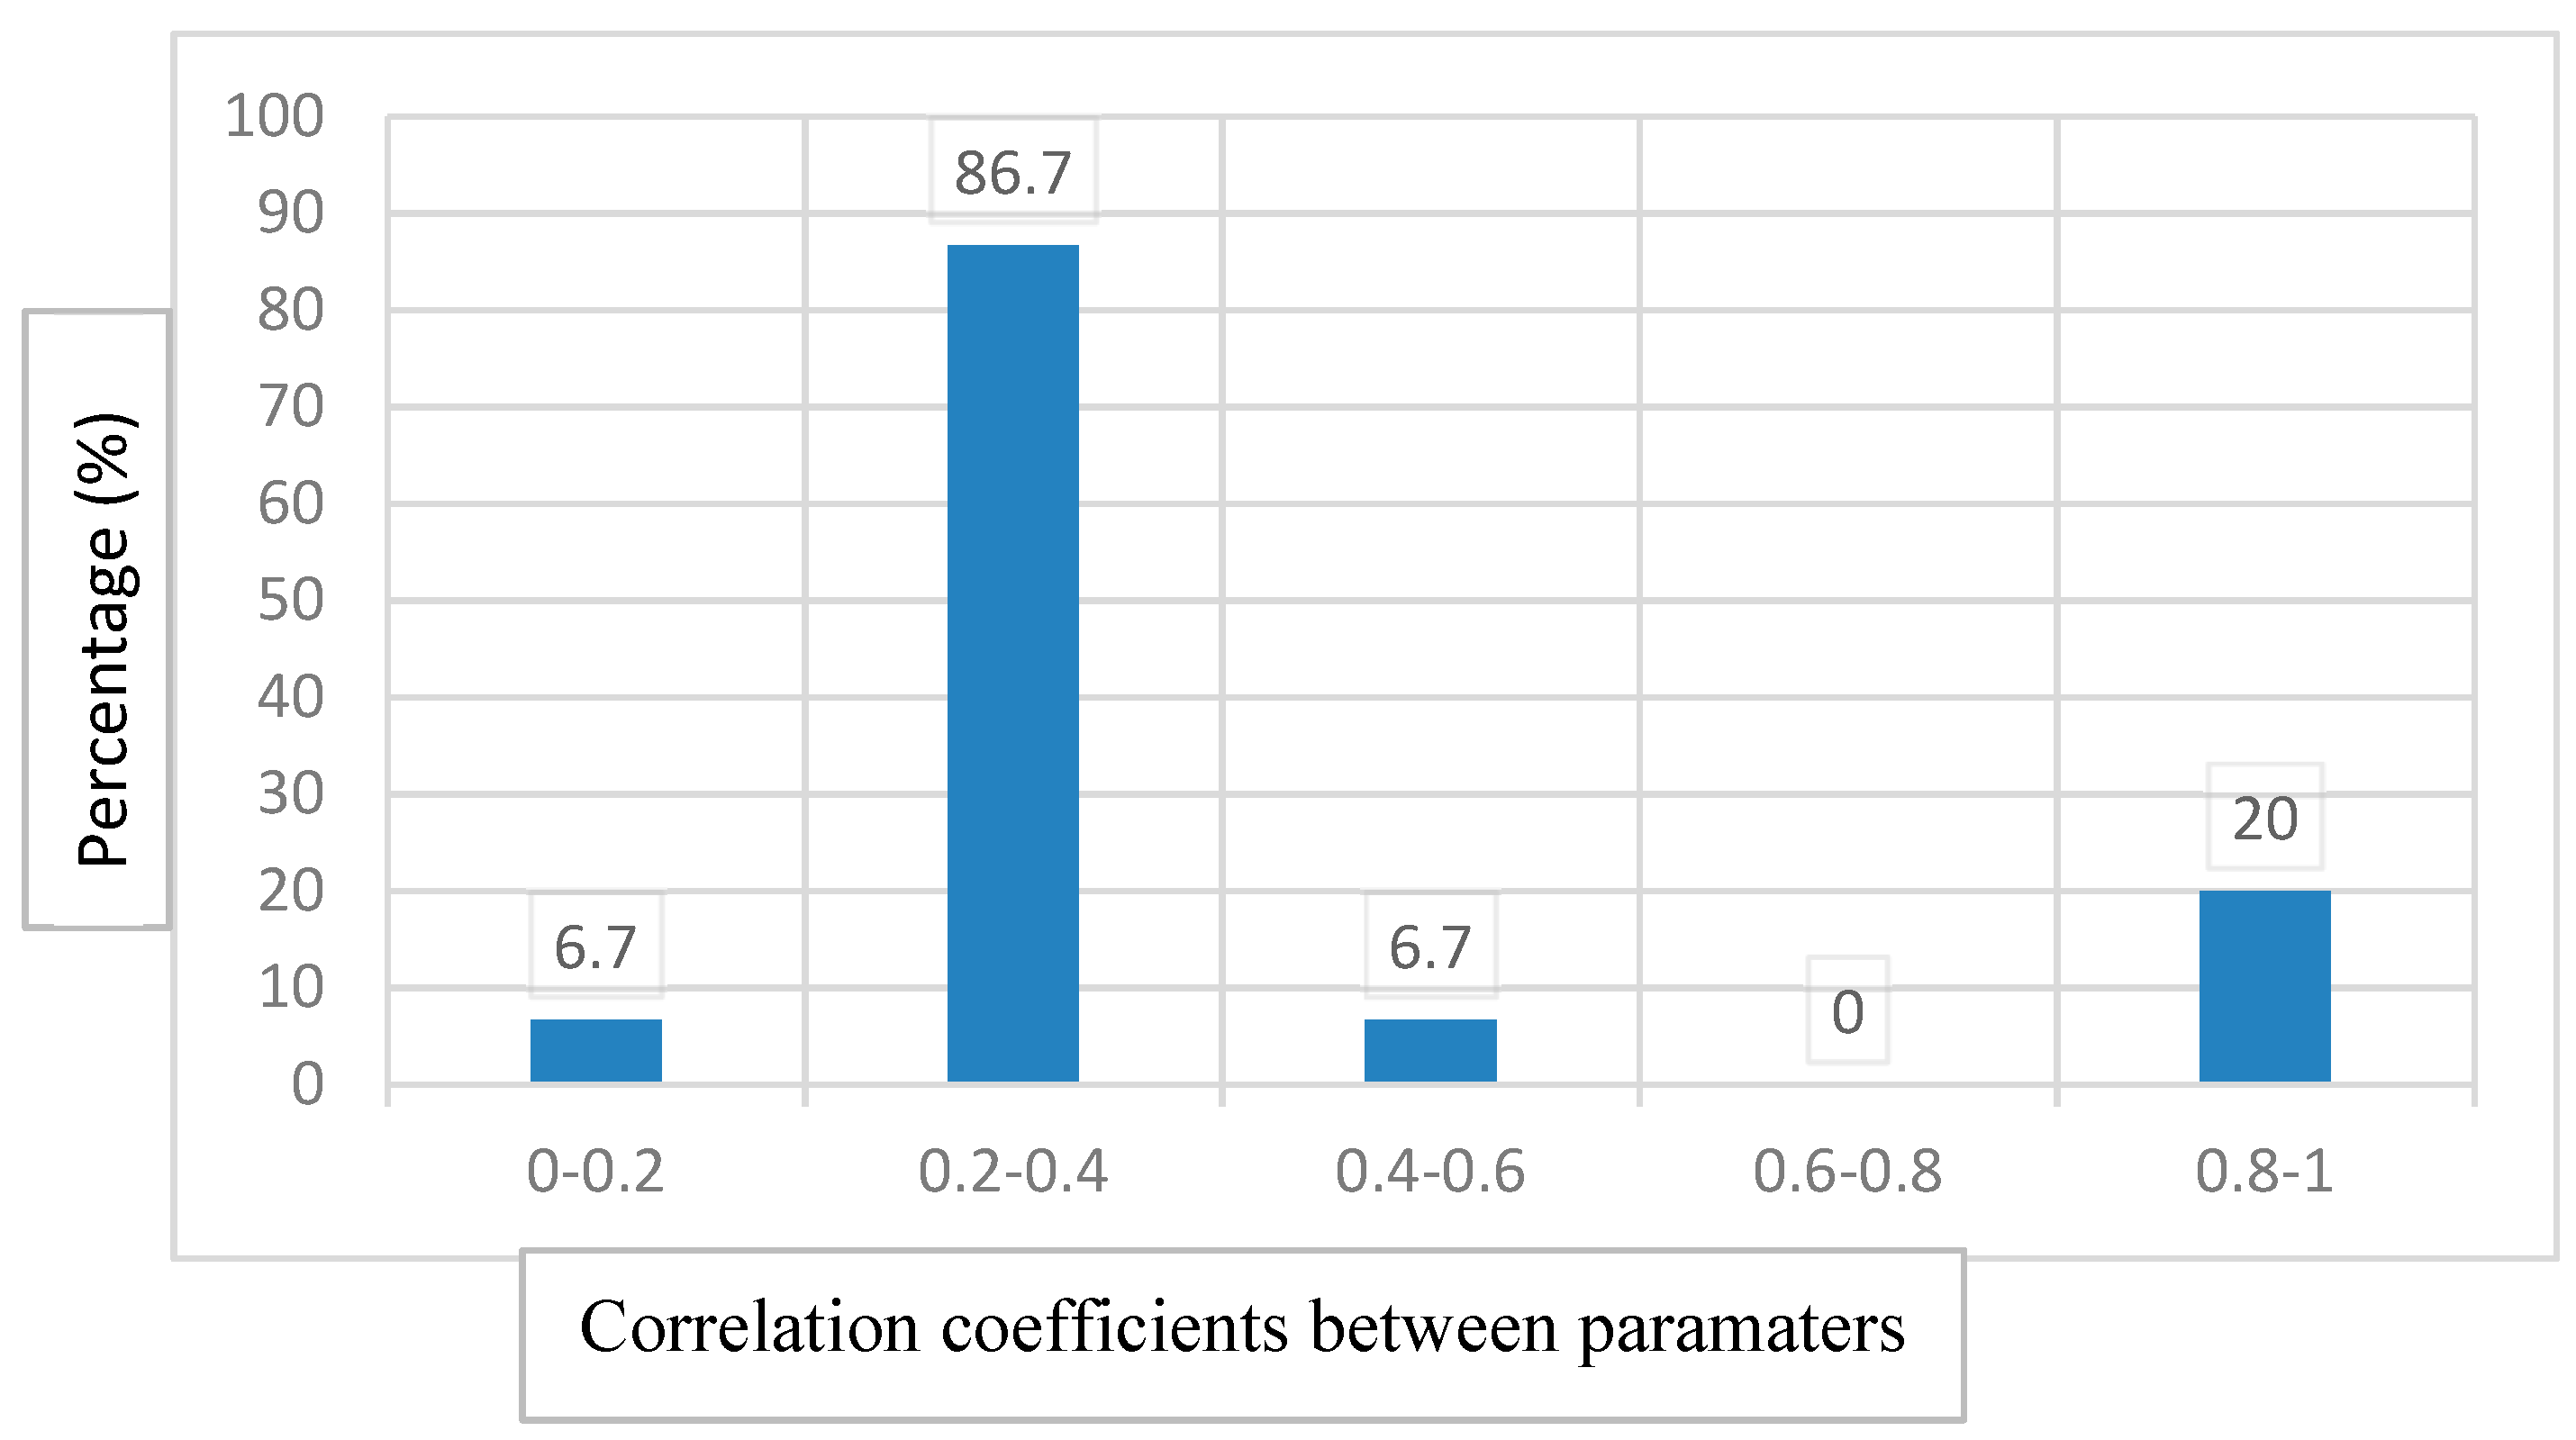
3.2. Analysis and Validation of Experimental Design
3.3. Effect of Operating Conditions on the Mass Transfer
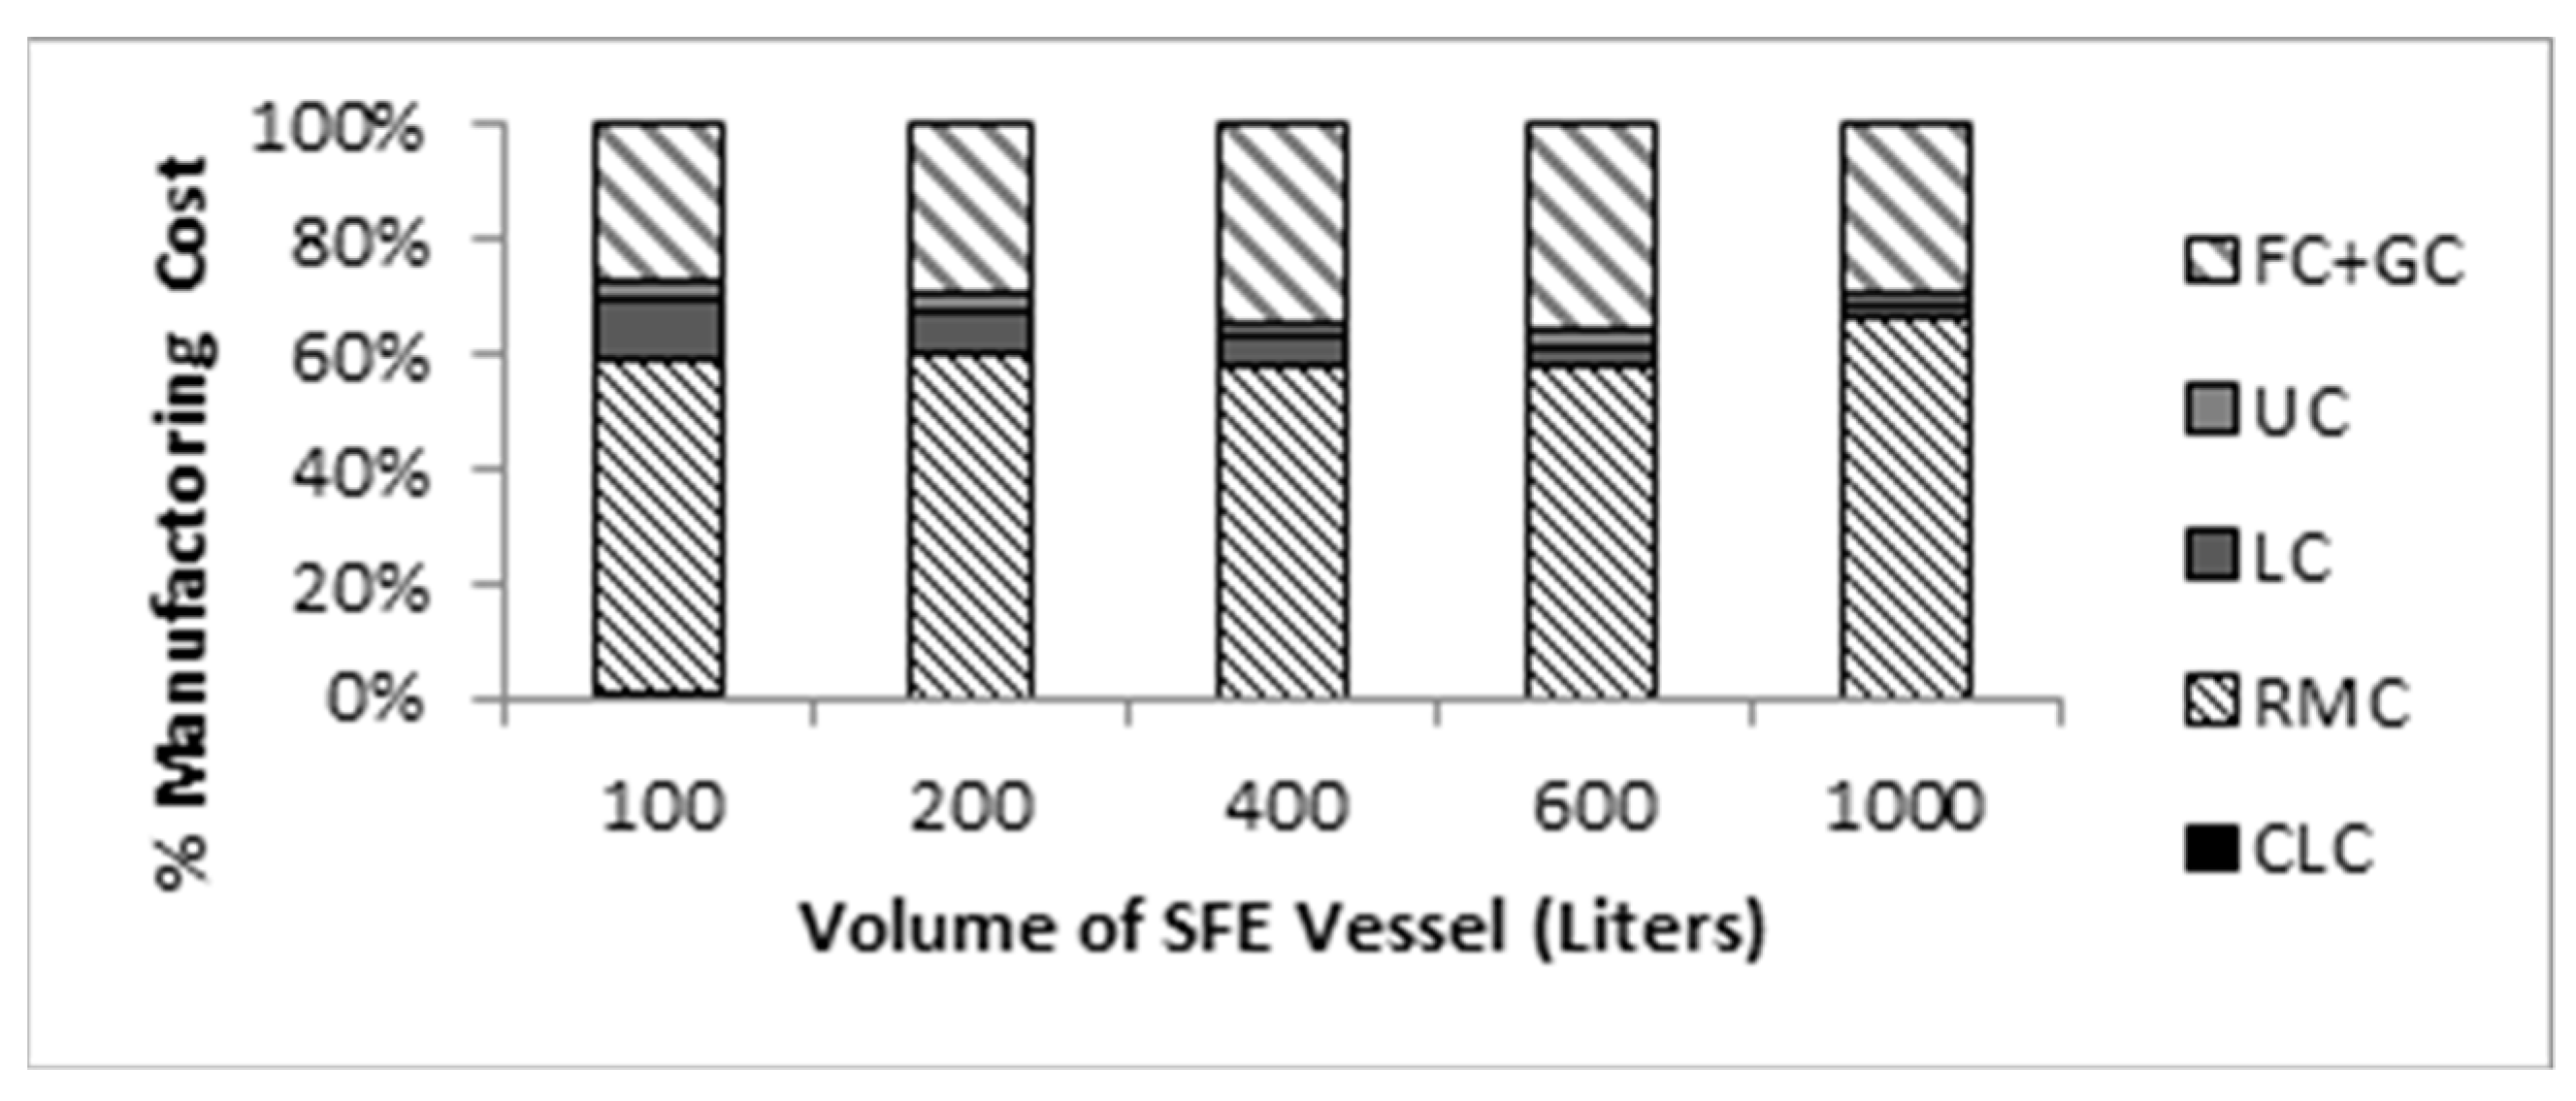
3.4. Cost Estimation of Processes and Scale-Up
4. Conclusions
Author Contributions
Funding
Acknowledgments
Conflicts of Interest
Appendix A

| Compounds | RI | Exp.1 | Exp.2 | Exp.3 | Exp.4 | Exp.5 | Exp.6 | Exp.7 | Exp.8 | Exp.9 | Exp.10 |
|---|---|---|---|---|---|---|---|---|---|---|---|
| Tricyclene | 924 | 1.05 | 0.9 | 0.48 | 0.58 | 0.48 | 1.2 | 0.75 | 0.64 | 0.46 | 0.14 |
| α-pinene | 939 | 33.3 | 30.0 | 34.21 | 30.1 | 33.21 | 32.1 | 34.31 | 31.1 | 32.41 | 32.1 |
| Z-3-hexenol | 855 | 0.12 | 0.15 | 0.32 | 0.22 | 0.23 | 0.11 | 0.86b | 0.82 | 0.64 | 0.32 |
| E-2-hexenol | 856 | 0.09 | 0.01 | 0 | 0 | 0 | 0 | 0.033 | 0.08 | 0.03 | 0.01 |
| Hexanol | 865 | 0.25 | 0.36 | 0.31 | 0.51 | 0.41 | 0.45 | 0.63 | 0.84 | 0.65 | 0.8 |
| E-2-hexenal | 850 | 0.19 | 0.12 | 0.28 | 0.48 | 0.58 | 0.58 | 0.65 | 0.67 | 0.91 | 0.56 |
| α-thujene | 928 | 0.2 | 0.21 | 0.41 | 0.21 | 0.31 | 0.24 | 0.56 | 0.58 | 0.56 | 0.88 |
| Camphor | 954 | 1.6 | 1.8 | 1.45 | 1.05 | 1.65 | 1.15 | 1.66 | 1.53 | 2.06 | 1.43 |
| xxCamphene | 954 | 0.89 | * | 1.2 | 1.02 | 1.42 | 1.12 | 1.22 | 1.08 | 1.02 | 0.66 |
| Sabinene | 975 | 0.19 | 0.22 | 0.22 | 0.32 | 0.42 | 0.22 | 0.56 | 0.13 | 0.64 | 0.23 |
| β-pinene | 980 | 2.04 | 2.54 | 2.17 | 2.07 | 2.37 | 2.17 | 2.81 | 2.83 | 2.25 | 2.12 |
| Myrcene | 991 | 0.24 | 0.26 | 0.17 | 0.27 | 0.37 | 0.17 | 0.4 | 0.24 | 0.3 | 0.14 |
| α-phellandrène | 1006 | 0.24 | 0.25 | 0.3 | 0.22 | 0.32 | 0.28 | 0.24 | 0.14 | 0.18 | 0.24 |
| ∆-3-carene | 1011 | 0.22 | 0.12 | 0 | 0 | 0 | 0 | 0 | 0 | 0 | 0 |
| p-cymene | 1026 | 1.7 | 2.7 | 3.04 | 3.54 | 2.95 | 3.84 | 2.6 | 3.01 | 2.05 | 3.11 |
| Limonene | 1030 | 1.19 | 1.89 | 2.01 | 2.41 | 2.21 | 2.51 | 2.02 | 1.55 | 2.12 | 1.95 |
| 1-8-cineole | 1033 | 5.1 | 6.1 | 6.02 | 6.62 | 5.85 | 6.42 | 5.66 | 6.11 | 5.06 | 7.11 |
| (E)-β-Ocimene | 1050 | 0.52 | 0.82 | 0.82 | 0.62 | 0.92 | 0.72 | 0.78 | 0.62 | 0.44 | 0.44 |
| γ-terpinene | 1053 | 0.5 | 0.66 | 0.56 | 0.36 | 0.33 | 0.56 | 0.12 | 0.12 | 0.18 | 0.44 |
| Oxyde de Cis-linalool | 1074 | 0.94 | 1.4 | 1.79 | 1.49 | 1.09 | 1.44 | 1.72 | 1.68 | 1.02 | 1.38 |
| Oxyde de Trans linalool | 1088 | 0.6 | 0.8 | 0.98 | 0.58 | 0.88 | 0.58 | 0.85 | 0.66 | 0.75 | 0.76 |
| Terpinolene | 1092 | 0.06 | 0.16 | 0.48 | 0.68 | 0.58 | 0.74 | 0.64 | 0.92 | 0.2 | 0.82 |
| Linalool | 1098 | 2.59 | 2.89 | 2.89 | 2.29 | 2.69 | 2.19 | 2.94 | 2.06 | 2.86 | 2.26 |
| Borneol | 1165 | 3.92 | 3.12 | 4.62 | 4.02 | 4.22 | 4.12 | 4.45 | 4.16 | 4.85 | 4.66 |
| Terpinene-4-ol | 1178 | 13.04 | 13.24 | 13.08 | 13.68 | 13.02 | 12.01 | 12.77 | 12.06 | 13.12 | 12.16 |
| α-terpineol | 1189 | 4.61 | 4.01 | 4.58 | 4.88 | 4.12 | 4.21 | 4.06 | 4.67 | 4.68 | 4.55 |
| Geraniol | 1255 | 0.69 | 0.89 | 0.79 | 0.99 | 0.59 | 0.59 | 0.69 | 0.4 | 0.55 | 0.65 |
| Acetate de bornyle | 1295 | 2.82 | 2.12 | 2.02 | 2.12 | 2.01 | 2.19 | 2.78 | 2.85 | 2.08 | 2.15 |
| Tridecane | 1300 | 0.08 | 0.08 | 0.03 | 0.05 | 0.05 | 0.06 | 0.04 | 0.06 | 0.03 | 0.05 |
| Linalyl de proprionate | 1325 | 1.55 | 1.55 | 1.95 | 1.85 | 1.55 | 2.01 | 1.84 | 1.27 | 1.12 | 1.2 |
| Acetate d’α terpenyle | 1344 | 0.73 | 0.73 | 0.63 | 0.69 | 0.77 | 0.74 | 0.88 | 0.98 | 0.18 | 0.48 |
| α-cubebene | 1351 | 0.04 | 0.04 | 0.26 | 0.33 | 0.46 | 0.53 | 0.77 | 0.67 | 0.47 | 0.7 |
| Copaene | 1372 | 0.77 | 0.96 | 0.86 | 0.66 | 0.85 | 0.67 | 0.66 | 0.61 | 0.44 | 0.81 |
| Β-elemene | 1391 | 0.83 | 0.78 | 0.93 | 0.9 | 1.2 | 1.1 | 1.43 | 1.31 | 1.13 | 1.41 |
| β-caryophyllene | 1434 | 4.02 | 4.92 | 4.22 | 4.82 | 4.88 | 4.03 | 4.12 | 4.43 | 4.01 | 4.93 |
| α-humulene | 1454 | 0.64 | 0.64 | 0.29 | 0.31 | 0.25 | 0.42 | 0.43 | 0.71 | 0.12 | 0.91 |
| Allo-aromandrene | 1474 | 0.51 | 0.11 | 0.21 | 0.31 | 0.21 | 0.61 | 0.24 | 0.51 | 0.41 | 0.15 |
| Delta muurolene | 476 | 0.11 | 0.41 | 0.66 | 0.65 | 0.86 | 0.78 | 0.94 | 0.31 | 0.44 | 0.39 |
| GermacreneD | 1480 | 0.12 | 0.31 | 0.72 | 0.77 | 0.62 | 0.84 | 0.91 | 0.55 | 0.77 | 0.65 |
| Nonadecanone | 1900 | 0.04 | 0.08 | 0 | 0 | 0 | 0 | 0.02 | 0.04 | 0 | 0.05 |
Appendix B
| Experiment | P (bar) | dP.104 (m) | G (dimensionless) | kfa0 102 (s−1) | ksa0 105 (s−1) | ys 104 (kg kg−1) | kf 106 (m s−1) | ks 109 (m s−1) | DAB 109 (m2 s−1) | Sh | Re | Sc | r2 | RMSE 102 | |
|---|---|---|---|---|---|---|---|---|---|---|---|---|---|---|---|
| 1 | 220 | 0.604 | 6.5 | 0.36 | 1.41 | 7.48 | 4.1 | 3.25 | 0.172 | 8.63 | 0.24 | 7.33 | 11.06 | 98.478 | 3.73 |
| 2 | 220 | 0.602 | 2.2 | 0.61 | 6.56 | 7.01 | 5.2 | 5.12 | 5.47 | 8.63 | 0.13 | 2.47 | 11.06 | 99.352 | 2.41 |
| 3 | 80 | 1.202 | 6.5 | 0.39 | 0.114 | 0.182 | 0.9 | 0.263 | 0.420 | 0.38 | 0.45 | 53.53 | 2.11 | 99.716 | 1.73 |
| 4 | 80 | 1.209 | 6.5 | 0.36 | 0.114 | 0.107 | 0.9 | 0.263 | 0.246 | 0.38 | 0.45 | 53.83 | 2.11 | 99.632 | 1.96 |
| 5 | 80 | 0.602 | 2.2 | 0.52 | 0.355 | 9.28 | 2.2 | 0.277 | 7.24 | 0.38 | 0.16 | 9.08 | 2.11 | 99.297 | 2.62 |
| 6 | 80 | 0.603 | 6.5 | 0.44 | 7.63 | 7.58 | 2.6 | 0.176 | 0.175 | 0.38 | 0.30 | 26.84 | 2.11 | 98.302 | 3.77 |
| 7 | 140 | 1.204 | 6.5 | 0.35 | 2.67 | 7.83 | 1.5 | 6.16 | 0.180 | 0.107 | 0.37 | 18.37 | 7.98 | 98.548 | 3.85 |
| 8 | 180 | 0.913 | 2.2 | 0.62 | 9.19 | 2.75 | 2.4 | 7.17 | 2.15 | 9.40 | 0.17 | 4.12 | 9.67 | 98.268 | 3.37 |
| 9 | 180 | 0.904 | 2.2 | 0.54 | 9.14 | 2.32 | 2.9 | 7.13 | 1.81 | 9.40 | 0.17 | 4.08 | 9.67 | 98.421 | 3.00 |
| 10 | 180 | 0.908 | 6.5 | 0.23 | 1.97 | 0.108 | 1.8 | 4.53 | 2.49 | 9.40 | 0.31 | 12.10 | 9.67 | 99.381 | 2.73 |
| Experiment | P (bar) | dP.104 (m) | G (dimensionless) | kfa0 102 (s−1) | ksa0 105 (s−1) | ys 104 (kg kg−1) | kf 106 (m s−1) | ks 109 (m s−1) | DAB 109 (m2 s−1) | Sh | Re | Sc | r2 | RMSE 102 | |
|---|---|---|---|---|---|---|---|---|---|---|---|---|---|---|---|
| 1 | 220 | 0.604 | 6.5 | 0.36 | 1.46 | 7.48 | 4.1 | 3.36 | 0.172 | 9.06 | 0.24 | 7.33 | 10.54 | 98.477 | 3.73 |
| 2 | 220 | 0.602 | 2.2 | 0.61 | 6.77 | 7.01 | 5.2 | 5.29 | 5.47 | 9.06 | 0.13 | 2.47 | 10.54 | 99.352 | 2.41 |
| 3 | 80 | 1.202 | 6.5 | 0.39 | 0.118 | 0.182 | 0.9 | 0.273 | 0.420 | 0.402 | 0.44 | 53.53 | 2.00 | 99.716 | 1.73 |
| 4 | 80 | 1.209 | 6.5 | 0.36 | 0.119 | 0.107 | 0.9 | 0.274 | 0.247 | 0.402 | 0.44 | 53.83 | 2.00 | 99.632 | 1.96 |
| 5 | 80 | 0.602 | 2.2 | 0.52 | 0.369 | 9.28 | 2.2 | 0.288 | 7.24 | 0.402 | 0.16 | 9.08 | 2.00 | 99.297 | 2.62 |
| 6 | 80 | 0.603 | 6.5 | 0.44 | 7.93 | 7.58 | 2.6 | 0.183 | 0.175 | 0.402 | 0.30 | 26.84 | 2.00 | 98.301 | 3.77 |
| 7 | 140 | 1.204 | 6.5 | 0.35 | 2.77 | 7.84 | 1.5 | 6.39 | 0.180 | 0.113 | 0.37 | 18.37 | 7.55 | 98.541 | 3.85 |
| 8 | 180 | 0.913 | 2.2 | 0.62 | 9.51 | 2.75 | 2.4 | 7.42 | 2.15 | 9.90 | 0.16 | 4.12 | 9.18 | 98.268 | 3.37 |
| 9 | 180 | 0.904 | 2.2 | 0.54 | 9.46 | 2.32 | 2.9 | 7.38 | 1.81 | 9.90 | 0.16 | 4.08 | 9.18 | 98.421 | 3.00 |
| 10 | 180 | 0.908 | 6.5 | 0.23 | 2.04 | 0.108 | 1.8 | 4.69 | 2.49 | 9.90 | 0.31 | 12.10 | 9.18 | 99.381 | 2.73 |
| Experiment | P (bar) | dP.104 (m) | G (dimensionless) | kfa0 102 (s−1) | ksa0 105 (s−1) | ys 104 (kg kg−1) | kf 106 (m s−1) | ks 109 (m s−1) | DAB 109 (m2 s−1) | Sh | Re | Sc | r2 | RMSE 102 | |
|---|---|---|---|---|---|---|---|---|---|---|---|---|---|---|---|
| 1 | 220 | 0.604 | 6.5 | 0.37 | 73.6 | 7.35 | 4.1 | 1.70 | 0.169 | 99.1 | 0.11 | 7.33 | 0.96 | 98.472 | 3.74 |
| 2 | 220 | 0.602 | 2.2 | 0.61 | 1.72 | 7.01 | 5.2 | 1.34 | 5.47 | 22.9 | 0.09 | 2.47 | 4.16 | 99.355 | 2.40 |
| 3 | 80 | 1.202 | 6.5 | 0.40 | 8.70 | 0.182 | 0.9 | 0.201 | 0.419 | 1440 | 0.14 | 53.53 | 0.06 | 99.718 | 1.73 |
| 4 | 80 | 1.209 | 6.5 | 0.37 | 8.95 | 0.107 | 0.9 | 0.206 | 0.246 | 1470 | 0.13 | 53.83 | 0.05 | 99.626 | 1.98 |
| 5 | 80 | 0.602 | 2.2 | 0.52 | 3.42 | 9.30 | 2.2 | 2.67 | 7.25 | 65.00 | 0.13 | 9.08 | 1.24 | 99.357 | 2.5 |
| 6 | 80 | 0.603 | 6.5 | 0.45 | 4.03 | 7.58 | 2.6 | 9.29 | 0.175 | 597.0 | 0.12 | 26.84 | 0.13 | 98.322 | 3.75 |
| 7 | 140 | 1.204 | 6.5 | 0.37 | 1.26 | 7.71 | 1.5 | 2.90 | 0.178 | 215.0 | 0.14 | 18.37 | 0.40 | 98.663 | 3.69 |
| 8 | 180 | 0.913 | 2.2 | 0.66 | 77.3 | 2.31 | 2.4 | 6.03 | 1.81 | 15.60 | 0.14 | 4.12 | 5.84 | 99.137 | 2.38 |
| 9 | 180 | 0.904 | 2.2 | 0.59 | 92.9 | 1.91 | 2.9 | 7.25 | 1.49 | 17.8 | 0.14 | 4.08 | 5.11 | 99.019 | 3.26 |
| 10 | 180 | 0.908 | 6.5 | 0.23 | 2.64 | 0.108 | 1.8 | 6.10 | 0.25 | 318.0 | 0.10 | 12.10 | 0.29 | 99.381 | 2.73 |
References
- Hatano, T.; Kagawa, H.; Yasuhara, T.; Okuda, T. Two new flavonoids and other constituents in licorice root: Their relative astringency and radical scavenging effects. Chem. Pharm. Bull. 1988, 6, 2090–2097. [Google Scholar]
- Dedoussis, G.V.Z.; Kaliora, A.C.; Psarras, S.; Chiou, A.; Mylona, A.; Papadopoulos, N.G.; Andrikopoulos, N.K. Antiatherogenic effect of Pistacia lentiscus via GSH restoration and downregulation of CD36 mRNA expression. Atherosclerosis 2004, 174, 293–303. [Google Scholar] [CrossRef] [PubMed]
- Berboucha, M.; Ayouni, K.; Atmani, D.; Atmani, D.; Benboubetra, M. Kinetic Study on the Inhibition of Xanthine Oxidase by Extracts from Two Selected Algerian Plants Traditionally Used for the Treatment of Inflammatory Diseases. J. Med. Food. 2010, 13, 896–904. [Google Scholar] [CrossRef] [PubMed]
- Mahmoudi, M.; Ebrahimzadeh, M.A.; Nabavi, S.F.; Hafezi, S.; Nabavi, S.M.; Eslami, S.H. Anti-Inflammatory and Antioxidant Activities of Ethanolic. Eur. Rev. Med. Pharmacol. Sci. 2010, 1, 765–769. [Google Scholar]
- Remila, S.; Atmani-Kilani, D.; Delemasure, S.; Connat, J.L.; Azib, L.; Richard, T.; Atmani, D. Antioxidant, cytoprotective, anti-inflammatory and anticancer activities of Pistacia lentiscus (Anacardiaceae) leaf and fruit extracts. Eur. J. Integr. Med. 2015, 7, 274–286. [Google Scholar] [CrossRef]
- Munné-Bosch, S.; Peñuelas, J. Photo- and antioxidative protection during summer leaf senescence in Pistacia lentiscus L. grown under mediterranean field conditions. Ann. Bot. 2003, 92, 385–391. [Google Scholar] [CrossRef] [Green Version]
- Abdelwahed, A.; Bouhlel, I.; Skandrani, I.; Valenti, K.; Kadri, M.; Guiraud, P.; Steiman, R.; Mariotte, A.M.; Ghedira, K.; Laporte, F.; et al. Study of antimutagenic and antioxidant activities of Gallic acid and 1,2,3,4,6-pentagalloylglucose from Pistacia lentiscus. Confirmation by microarray expression profiling. Chem. Biol. Interact. 2007, 165, 1–13. [Google Scholar] [CrossRef]
- Barra, A.; Coroneo, V.; Dessi, S.; Cabras, P.; Angioni, A. Characterization of the Volatile Constituents in the Essential Oil of Pistacia lentiscus L. from Different Origins and Its Antifungal and Antioxidant Activity. J. Agric. Food Chem. 2007, 55, 7093–7098. [Google Scholar] [CrossRef]
- Benhammou, N.; Atik, F.; Panovska, T.K. Antioxidant and antimicrobial activities of the Pistacia lentiscus and Pistacia atlantica extracts. African J. Pharm. Pharmacol. 2008, 2, 22–28. [Google Scholar]
- Gardeli, C.; Vassiliki, P.; Athanasios, M.; Kibouris, T.; Komaitis, M. Essential oil composition of Pistacia lentiscus L. and Myrtus communis L.: Evaluation of antioxidant capacity of methanolic extracts. Food Chem. 2008, 107, 1120–1130. [Google Scholar] [CrossRef]
- Tassou, C.C.; Nychas, G.J.E. Antimicrobial activity of the essential oil of mastic gum (Pistacia lentiscus var. chia) on Gram positive and Gram negative bacteria in broth and in Model Food System. Int. Biodeterior. Biodegrad. 1995, 36, 411–420. [Google Scholar] [CrossRef]
- Iauk, L.; Ragusa, S.; Rapisarda, A.; Franco, S.; Nicolosi, V.M. In vitro antimicrobial activity of Pistacia lentiscus L. extracts: Preliminary report. J. Chemother. 1996, 8, 207–209. [Google Scholar] [CrossRef] [PubMed]
- Magiatis, P.; Melliou, E.; Skaltsounis, A.-L.; Chinou, I.B.; Mitaku, S. Chemical Composition and Antimicrobial Activity of the Essential Oils of Pistacia lentiscus var. chia. Planta Med. 1999, 65, 749–752. [Google Scholar] [CrossRef] [PubMed]
- Villar, A.; Sanz, M.J.; Paya, M. Hypotensive effect of Pistacia lentiscus L. Int. J. Crude Drug Res. 1987, 25, 1–3. [Google Scholar] [CrossRef]
- Sanz, M.J.; Terencio, M.C.; Paya, M. Isolation and hypotensive activity of a polymeric procyanidian fraction from Pistacia lentiscus L. Pharmazie 1992, 47, 466–470. [Google Scholar]
- Alma, M.H.; Nitz, S.; Kollmannsberger, H.; Digrak, M.; Efe, F.T.; Yilmaz, N. Chemical composition and antimicrobial activity of the essential oils from the gum of Turkish Pistachio (Pistacia vera L.). J. Agric. Food Chem. 2004, 52, 3911–3914. [Google Scholar] [CrossRef]
- Nahida, A.S.; Siddiqui, A.N. Pistacia lentiscus: A review on phytochemistry and pharmacological properties. Int. J. Pharm. Pharm. Sci. 2012, 4, 16–20. [Google Scholar]
- Landau, S.; Muklada, H.; Markovics, A.; Azaizeh, H. Traditional Uses of Pistacia lentiscus in Veterinary and Human Medicine. In Medicinal and Aromatic Plants of the Middle-East; Yaniv, Z., Dudai, N., Eds.; Springer: Dordrecht, The Netherland, 2014; Volumn 2, pp. 163–180. [Google Scholar]
- Boukeloua, A.; Belkhiri, A.; Yilmaz, M.A.; Temel, H.; Sabatini, S. Chemical profiling and total thickness-excised wound-healing activity of Pistacia lentiscus L. fruits growing in Algeria. Cogent Biol. 2016, 2, 1182611. [Google Scholar] [CrossRef]
- Ben Khedir, S.; Bardaa, S.; Chabchoub, N.; Moalla, D.; Sahnoun, Z.; Rebai, T. The healing effect of pistacia lentiscus fruit oil on laser burn. Pharm. Biol. 2017, 55, 1407–1414. [Google Scholar] [CrossRef] [Green Version]
- Chow, E.T.; Wei, L.S.; Devor, R.E.; Steinberg, M.P. Performance of ingredients in a soybean whipped topping: A response surface analysis. J. Food Sci. 1988, 53, 1761–1765. [Google Scholar] [CrossRef]
- Rezzoug, S.A.; Boutekedjiret, C.; Allaf, K. Optimization of operating conditions of rosemary essential oil extraction by a fast controlled pressure drop process using response surface methodology. J. Food Eng. 2005, 71, 9–17. [Google Scholar] [CrossRef]
- Kiewicz, K.; Konkol, M.; Rój, E. The Application of Supercritical Fluid Extraction in Phenolic Compounds Isolation from Natural Plant Materials. Molecules 2018, 23, 2625. [Google Scholar]
- Benincasa, C.; Santoro, I.; Nardi, M.; Alfredo, C.; Giovanni, S. Eco-Friendly Extraction and Characterisation of Nutraceuticals from Olive Leaves. Molecules 2019, 24, 3481. [Google Scholar] [CrossRef] [PubMed] [Green Version]
- Mejri, J.; Aydi, A.; Abderrabba, M.; Mejri, M. Asian Journal of Green Chemistry Review Article Emerging extraction processes of essential oils: A review. Asian J. Green Chem. 2018, 2, 246–267. [Google Scholar]
- Oliveira, E.L.G.; Silvestre, A.J.D.; Silva, C.M. Review of kinetic models for supercritical fluid extraction. Chem. Eng. Res. Des. 2011, 89, 1104–1117. [Google Scholar] [CrossRef]
- Del Valle, J.M.; De La Fuente, J.C. Supercritical CO2 Extraction of Oilseeds: Review of Kinetic and Equilibrium Models. Crit. Rev. Food Sci. Nutr. 2006, 46, 131–160. [Google Scholar] [CrossRef]
- Sovová, H. Mathematical model for supercritical fluid extraction of natural products and extraction curve evaluation. J. Supercrit. Fluids 2005, 33, 35–52. [Google Scholar] [CrossRef]
- Sovova, H. Rate of the Vegetable Oil Extraction with Supercritical CO2-I Modeling of Extraction Curves. Chem. Eng. Sci. 1994, 49, 409–414. [Google Scholar] [CrossRef]
- Stastova, J.; Jez, J.; Bartlova, M.; Sovova, H. Rate of the Vegetable Oil Extraction With Supercritical CO2-Iii. Extraction From Sea Buckthorn. Chem. Eng. Sci. 1996, 51, 4347–4352. [Google Scholar] [CrossRef]
- Congiu, R.; Falconieri, D.; Marongiu, B.; Piras, A.; Porcedda, S. Extraction and isolation of Pistacia lentiscus L. essential oil by supercritical CO2. Flavour Fragr. J. 2002, 17, 239–244. [Google Scholar] [CrossRef]
- Maldao-Martins, M.; Beirao-da-Costa, S.; Neves, C.; Cavaleiro, C.; Salgueiro, L.; Beirao-da-Costa, M.L. Olive Oil Flavoured by the Essential Oils of Mentha x Piperita and Thymus mastichina L. Food Qual. Prefer. 2004, 15, 447–452. [Google Scholar] [CrossRef]
- Guillou, A.A.; Floros, J.D. Multiresponse Optimization Minimizes Salt in Natural Cucumber Fermentation and Storage. J. Food Sci. 1993, 58, 1381–1389. [Google Scholar] [CrossRef]
- Montgomery, D.C. Design and Analysis of Experiments, 2nd ed.; Willey: New York, NY, USA, 1991. [Google Scholar]
- Meilgaard, M.; Civille, G.V.; Carr, B.T. Sesory Evalution Techniques, 2nd ed.; CRC Press Inc.: Boca Raton, FL, USA, 1991. [Google Scholar]
- Zermane, A.; Abdeslam-Hassan, M.; Ouassila, L.; Barth, D. Extraction and Modeling of Algerian Rosemary Essential Oil Using Supercritical CO2: Effect of Pressure and Temperature. Energy Procedia 2012, 18, 1038–1046. [Google Scholar]
- Francisco, J.D.C.; Sivik, B. Solubility of three monoterpenes, their mixtures and eucalyptus leaf oils in dense carbon dioxide. J. Supercrit. Fluids 2002, 23, 11–19. [Google Scholar] [CrossRef]
- Kopcak, U.; Mohamed, R.S. Caffeine solubility in supercritical carbon dioxide/co-solvent mixtures. J. Supercrit. Fluids 2005, 34, 209–214. [Google Scholar] [CrossRef]
- Anderson, K.E.; Siepmann, J.I. Solubility in Supercritical Carbon Dioxide: Importance of the Poynting Correction and Entrainer Effects. J. Phys. Chem. B 2008, 112, 11374–11380. [Google Scholar] [CrossRef]
- Fiori, L.; Calcagno, D.; Costa, P. Sensitivity analysis and operative conditions of a supercritical fluid extractor. J. Supercrit. Fluids 2007, 41, 31–42. [Google Scholar] [CrossRef]
- Fiori, L.; Lavelli, V.; Duba, K.S.; Sri Harsha, P.S.C.; Ben Mohamed, H.; Guella, G. Supercritical CO2 extraction of oil from seeds of six grape cultivars: Modeling of mass transfer kinetics and evaluation of lipid profiles and tocol contents. J. Supercrit. Fluids 2014, 94, 71–80. [Google Scholar] [CrossRef]
- Linstrom, P.J.; Mallard, W.G. NIST Chemistry WebBook, NIST Standard Reference Database Number 69. Natl. Inst. Stand. Technol. Gaithersburg 2011. Available online: https://webbook.nist.gov/chemistry/ (accessed on 21 September 2019).
- Shimoyama, Y.; Tokumoto, H.; Matsuno, T.; Iwai, Y. Analysis of cosolvent effect on supercritical carbon dioxide extraction for α-pinene and 1,8-cineole. Chem. Eng. Res. Des. 2010, 88, 1563–1568. [Google Scholar] [CrossRef]
- Silva, C.M.; Filho, C.A.; Quadri, M.B.; Macedo, E.A. Binary diffusion coefficients of α-pinene and β-pinene in supercritical carbon dioxide. J. Supercrit. Fluids 2004, 32, 167–175. [Google Scholar] [CrossRef]
- Shi, J.; Kakuda, Y.; Zhou, X.; Mittal, G.; Pan, Q. Correlation of mass transfer coefficient in the extraction of plant oil in a fixed bed for supercritical CO2. J. Food Eng. 2007, 78, 33–40. [Google Scholar] [CrossRef]
- Taher, H.; Al-Zuhair, S.; Al-Marzouqi, A.H.; Haik, Y.; Farid, M. Mass transfer modeling of Scenedesmus sp. lipids extracted by supercritical CO2. Biomass Bioenergy 2014, 70, 530–541. [Google Scholar] [CrossRef]
- Mongkholkhajornsilp, D.; Douglas, S.; Douglas, P.L.; Elkamel, A.; Teppaitoon, W.; Pongamphai, S. Supercritical CO2 extraction of nimbin from neem seeds-A modelling study. J. Food Eng. 2005, 71, 331–340. [Google Scholar] [CrossRef]
- Catchpole, O.J.; King, M.B. Measurement and Correlation of Binary Diffusion Coefficients in Near Critical Fluids. Ind. Eng. Chem. Res. 1994, 33, 1828–1837. [Google Scholar] [CrossRef]
- Lito, P.F.; Magalhães, A.L.; Gomes, J.R.B.; Silva, C.M. Universal model for accurate calculation of tracer diffusion coefficients in gas, liquid and supercritical systems. J. Chromatogr. A 2013, 1290, 1–26. [Google Scholar] [CrossRef] [PubMed]
- Rosa, P.T.V.; Meireles, M.A.A. Rapid estimation of the manufacturing cost of extracts obtained by supercritical fluid extraction. J. Food Eng. 2005, 67, 235–240. [Google Scholar] [CrossRef]
- Wüst Zibetti, A.; Aydi, A.; Arauco Livia, M.; Bolzan, A.; Barth, D. Solvent extraction and purification of rosmarinic acid from supercritical fluid extraction fractionation waste: Economic evaluation and scale-up. J. Supercrit. Fluids 2013, 83, 133–145. [Google Scholar] [CrossRef]
- Turton, R.; Bailie, R.C.; Whiting, W.B.; Shaeiwitz, J.A.; Bhattacharyya, D. Analysis, Synthesis, and Design of Chemical Processes; Prentice Hall: Upper Saddle River, NJ, USA, 2012; pp. 394–397. [Google Scholar]
- Carvalho, J.R.N.; Moura, L.S.; Rosa, P.T.V.; Meireles, M.A.A. Supercritical fluid extraction from rosemary (Rosmarinus officinalis): Kinetic data, extract’s global yield, composition, and antioxidant activity. J. Supercrit. Fluids 2005, 35, 197–204. [Google Scholar] [CrossRef]
- Duba, K.S.; Fiori, L. Supercritical CO2 extraction of grape seed oil: Effect of process parameters on the extraction kinetics. J. Supercrit. Fluids 2015, 98, 33–43. [Google Scholar] [CrossRef]
- Ayas, N.; Yilmaz, O. A shrinking core model and empirical kinetic approaches in supercritical CO2 extraction of safflower seed oil. J. Supercrit. Fluids 2014, 94, 81–90. [Google Scholar] [CrossRef]
- Özkal, S.G.; Yener, M.E.; Bayindirli, L. Mass transfer modeling of apricot kernel oil extraction with supercritical carbon dioxide. J. Supercrit. Fluids 2005, 35, 119–127. [Google Scholar] [CrossRef]
- Sánchez-Vicente, Y.; Cabañas, A.; Renuncio, J.A.R.; Pando, C. Supercritical fluid extraction of peach (Prunus persica) seed oil using carbon dioxide and ethanol. J. Supercrit. Fluids 2009, 49, 167–173. [Google Scholar] [CrossRef]
- Núñez, G.A.; Del Valle, J.M. Supercritical CO2 oilseed extraction in multi-vessel plants. 2. Effect of number and geometry of extractors on production cost. J. Supercrit. Fluids 2014, 92, 324–334. [Google Scholar] [CrossRef]
- Rocha-Uribe, J.A.; Novelo-Pérez, J.I.; Araceli Ruiz-Mercado, C. Cost estimation for CO2 supercritical extraction systems and manufacturing cost for habanero chili. J. Supercrit. Fluids 2014, 93, 38–41. [Google Scholar] [CrossRef]
- Fiori, L. Supercritical extraction of grape seed oil at industrial-scale: Plant and process design, modeling, economic feasibility. Chem. Eng. Process. Process Intensif. 2010, 49, 866–872. [Google Scholar] [CrossRef]
- ICIS. Ethanol Price Report—Chemical Pricing Information-ICIS Pricing. Available online: http://www.icispricing.com/il_shared/chemicals/Sub (accessed on 20 September 2013).
- Bampouli, A.; Kyriakopoulou, K.; Papaefstathiou, G.; Louli, V.; Krokida, M.; Magoulas, K. Comparison of different extraction methods of Pistacia lentiscus var. chia leaves: Yield, antioxidant activity and essential oil chemical composition. J. Appl. Res. Med. Aromat. Plants 2014, 1, 81–91. [Google Scholar] [CrossRef]
- Sim, J.; Reid, N. Statistical inference by confidence intervals: Issues of interpretation and utilization. Phys. Ther. 1999, 79, 186–195. [Google Scholar] [CrossRef]
- Harman, R.; Pronzato, L. Improvements on removing non-optimal support points in D-optimum design algorithms. Stat. Probab. Lett. 2007, 77, 90–94. [Google Scholar] [CrossRef] [Green Version]
- Zimmer, C. Experimental Design for Stochastic Models of Nonlinear Signaling Pathways Using an Interval-Wise Linear Noise Approximation and State Estimation. Public Libr. Sci. ONE 2016, 11, 1–37. [Google Scholar] [CrossRef] [Green Version]
- Nguyen, N.-K.; Miller, A.J. A review of some exchange alogrithms for constructng discrete D-optimal designs. Comput. Stat. Data Anal. 1992, 14, 489–498. [Google Scholar] [CrossRef]


| Experiments | P [bar] | dP [µm] | [kg h−1] * | [kg m−3] | [kg m s−1] |
|---|---|---|---|---|---|
| 1 | 220 | 650 | 0.604 | 857.20 | 8.18 |
| 2 | 220 | 220 | 0.602 | 857.20 | 8.18 |
| 3 | 80 | 650 | 1.202 | 277.90 | 2.23 |
| 4 | 80 | 650 | 1.209 | 277.90 | 2.23 |
| 5 | 80 | 220 | 0.602 | 277.90 | 2.23 |
| 6 | 80 | 650 | 0.603 | 277.90 | 2.23 |
| 7 | 140 | 650 | 1.204 | 763.27 | 6.51 |
| 8 | 180 | 220 | 0.913 | 819.51 | 7.45 |
| 9 | 180 | 220 | 0.904 | 819.51 | 7.45 |
| 10 | 180 | 650 | 0.908 | 819.51 | 7.45 |
| Variable | Symbol | Factor Level | |
|---|---|---|---|
| −1 | 1 | ||
| Pressure (bar) | x1 | 80 | 220 |
| CO2 flowrate (kg/h) | x2 | 0.6 | 1.2 |
| Average particle size (µm) | x3 | 220 | 650 |
| Extractor Vessel (liters) | H (m) | d (m) | H/d | Fixed Cost (FCI) (US $) |
|---|---|---|---|---|
| 100 | 2.01 | 0.252 | 8.0 | $853,975 |
| 200 | 2.54 | 0.317 | 8.0 | $1,378,550 |
| 400 | 3.19 | 0.399 | 8.0 | $2,225,400 |
| 600 | 3.66 | 0.457 | 8.0 | $2,944,900 |
| 1000 | 4.34 | 0.542 | 8.0 | $4,191,250 |
| Experiment | x1 P [bar] | x2 dP. [µm] | x3 | Yield [%] |
|---|---|---|---|---|
| 1 | 220 | 650 | 0.604 | 0.234 |
| 2 | 220 | 220 | 0.602 | 0.285 |
| 3 | 80 | 650 | 1.202 | 0.093 |
| 4 | 80 | 650 | 1.209 | 0.119 |
| 5 | 80 | 220 | 0.602 | 0.123 |
| 6 | 80 | 650 | 0.603 | 0.117 |
| 7 | 140 | 650 | 1.204 | 0.221 |
| 8 | 180 | 220 | 0.913 | 0.220 |
| 9 | 180 | 220 | 0.904 | 0.229 |
| 10 | 180 | 650 | 0.908 | 0.174 |
| Compounds | RI | Exp.1 | Exp.2 | Exp.3 | Exp.4 | Exp.5 | Exp.6 | Exp.7 | Exp.8 | Exp.9 | Exp.10 |
|---|---|---|---|---|---|---|---|---|---|---|---|
| α-pinene | 939 | 33.30 | 30.00 | 34.21 | 30.10 | 33.21 | 32.10 | 34.31 | 31.10 | 32.41 | 32.1 |
| Terpinene-4-ol | 1178 | 13.04 | 13.24 | 13.08 | 13.68 | 13.02 | 12.01 | 12.77 | 12.06 | 13.12 | 12.16 |
| 1-8-cineole | 1033 | 5.10 | 6.10 | 6.02 | 6.62 | 5.85 | 6.42 | 5.66 | 6.11 | 5.06 | 7.11 |
| α-terpineol | 1189 | 4.61 | 4.01 | 4.58 | 4.88 | 4.12 | 4.21 | 4.06 | 4.67 | 4.68 | 4.55 |
| β-caryophyllene | 1434 | 4.02 | 4.92 | 4.22 | 4.82 | 4.88 | 4.03 | 4.12 | 4.43 | 4.01 | 4.93 |
| Borneol | 1165 | 3.92 | 3.12 | 4.62 | 4.02 | 4.22 | 4.12 | 4.45 | 4.16 | 4.85 | 4.66 |
| Others | 36.01 | 38.61 | 31.27 | 35.88 | 34.70 | 37.11 | 34.63 | 37.47 | 35.87 | 34.49 |
| Experiment | x1 | x2 | x3 | YD (%) |
|---|---|---|---|---|
| 1 | 1.0000 | 1.0000 | −0.9934 | 0.23 |
| 2 | 1.0000 | −1.0000 | −1.0000 | 0.28 |
| 3 | −1.0000 | 1.0000 | 0.9769 | 0.09 |
| 4 | −1.0000 | 1.0000 | 1.0000 | 0.12 |
| 5 | −1.0000 | −1.0000 | −1.0000 | 0.12 |
| 6 | −1.0000 | 1.0000 | −0.9967 | 0.12 |
| 7 | −0.1429 | 1.0000 | 0.9835 | 0.22 |
| 8 | 0.4286 | −1.0000 | 0.0247 | 0.22 |
| 9 | 0.4286 | −1.0000 | −0.0049 | 0.23 |
| 10 | 0.4286 | 1.0000 | 0.0082 | 0.17 |
| Coefficient | Coefficient Value | Test Experiment | p-Value along with Confidence % |
|---|---|---|---|
| a0 | 0.183 | 12.43 | *** |
| a1 | 0.084 | 3.71 | * |
| a2 | 0.000 | 0.01 | 99.1% |
| a3 | −0.002 | −0.10 | 92.2% |
| a12 | −0.013 | −0.80 | 48.5% |
| a13 | 0.017 | 0.71 | 53.3% |
| a23 | 0.019 | 0.86 | 45.3% |
| Parameters | a1 | a2 | a3 | a12 | a13 | a23 |
|---|---|---|---|---|---|---|
| a1 | 1.0000 | −0.3039 | −0.3291 | 0.2608 | −0.3623 | −0.2981 |
| a2 | −0.3039 | 1.0000 | 0.3909 | −0.0455 | −0.2335 | −0.2095 |
| a3 | −0.3291 | 0.3909 | 1.0000 | −0.3748 | −0.3771 | 0.4994 |
| a12 | 0.2608 | −0.0455 | −0.3748 | 1.0000 | 0.2565 | −0.2247 |
| a13 | −0.3623 | −0.2335 | −0.3771 | 0.2565 | 1.0000 | −0.2563 |
| a23 | −0.2981 | −0.2095 | 0.4994 | −0.2247 | −0.2563 | 1.0000 |
| Exp. | P [bar] | dP [µm] | [kg.h−1] | G | ksa0.105 (s−1) | ||||
|---|---|---|---|---|---|---|---|---|---|
| 1st App. | 2nd App. | 1st App. | 2nd App. | ||||||
| Lito | Catchpole | AYDI A. | Lito | Catchpole | AYDI A. | ||||
| 1 | 220 | 650 | 0.604 | 0.36 | 0.36 | 0.37 | 7.48 | 7.48 | 7.35 |
| 2 | 220 | 220 | 0.602 | 0.61 | 0.61 | 0.61 | 7.01 | 7.01 | 7.01 |
| 3 | 80 | 650 | 1.202 | 0.39 | 0.39 | 0.40 | 0.182 | 0.182 | 0.182 |
| 4 | 80 | 650 | 1.209 | 0.36 | 0.36 | 0.37 | 0.107 | 0.107 | 0.107 |
| 5 | 80 | 220 | 0.602 | 0.52 | 0.52 | 0.52 | 9.28 | 9.28 | 9.30 |
| 6 | 80 | 650 | 0.603 | 0.44 | 0.44 | 0.45 | 7.58 | 7.58 | 7.58 |
| 7 | 140 | 650 | 1.204 | 0.35 | 0.35 | 0.37 | 7.83 | 7.84 | 7.71 |
| 8 | 180 | 220 | 0.913 | 0.62 | 0.62 | 0.66 | 2.75 | 2.75 | 2.31 |
| 9 | 180 | 220 | 0.904 | 0.54 | 0.54 | 0.59 | 2.32 | 2.32 | 1.91 |
| 10 | 180 | 650 | 0.908 | 0.23 | 0.23 | 0.23 | 0.108 | 0.108 | 0.108 |
| Exp. | P [bar] | dP [µm] | [kg.h−1] | kfa0.103 (s−1) | DAB. 109(m2 s−1) | ||||
|---|---|---|---|---|---|---|---|---|---|
| 1st App. | 2nd App. | 1st App. | 2nd App. | ||||||
| Lito | Catchpole | AYDI A. | Lito | Catchpole | AYDI A. | ||||
| 1 | 220 | 650 | 0.604 | 1.41 | 1.46 | 0.736 | 8.63 | 9.06 | 2.97 |
| 2 | 220 | 220 | 0.602 | 6.56 | 6.77 | 1.72 | 8.63 | 9.06 | 1.06 |
| 3 | 80 | 650 | 1.202 | 0.114 | 0.118 | 8.70 | 38.0 | 40.2 | 0.73 |
| 4 | 80 | 650 | 1.209 | 0.114 | 0.119 | 8.95 | 38.0 | 40.2 | 0.76 |
| 5 | 80 | 220 | 0.602 | 0.355 | 0.369 | 3.42 | 38.0 | 40.2 | 1.04 |
| 6 | 80 | 650 | 0.603 | 7.63 | 7.93 | 4.03 | 38.0 | 40.2 | 13.3 |
| 7 | 140 | 650 | 1.204 | 2.67 | 2.77 | 1.26 | 10.7 | 11.3 | 3.15 |
| 8 | 180 | 220 | 0.913 | 9.19 | 9.51 | 0.773 | 9.4 | 9.9 | 6.61 |
| 9 | 180 | 220 | 0.904 | 9.14 | 9.46 | 0.929 | 9.4 | 9.9 | 8.79 |
| 10 | 180 | 650 | 0.908 | 1.97 | 2.04 | 2.64 | 9.4 | 9.9 | 13.4 |
| Exp. | P [bar] | dP [µm] | [kg.h−1] | Sh | r2 | ||||
|---|---|---|---|---|---|---|---|---|---|
| 1st App. | 2nd App. | 1st App. | 2nd App. | ||||||
| Lito | Catchpole | AYDI A. | Lito | Catchpole | AYDI A. | ||||
| 1 | 220 | 650 | 0.604 | 0.24 | 0.24 | 0.96 | 98.478 | 98.477 | 98.472 |
| 2 | 220 | 220 | 0.602 | 0.13 | 0.13 | 4.16 | 99.352 | 99.352 | 99.355 |
| 3 | 80 | 650 | 1.202 | 0.45 | 0.44 | 0.06 | 99.716 | 99.716 | 99.718 |
| 4 | 80 | 650 | 1.209 | 0.45 | 0.44 | 0.05 | 99.632 | 99.632 | 99.626 |
| 5 | 80 | 220 | 0.602 | 0.16 | 0.16 | 1.24 | 99.297 | 99.297 | 99.357 |
| 6 | 80 | 650 | 0.603 | 0.30 | 0.30 | 0.13 | 98.302 | 98.301 | 98.322 |
| 7 | 140 | 650 | 1.204 | 0.37 | 0.37 | 0.40 | 98.548 | 98.541 | 98.663 |
| 8 | 180 | 220 | 0.913 | 0.17 | 0.16 | 5.84 | 98.268 | 98.268 | 99.137 |
| 9 | 180 | 220 | 0.904 | 0.17 | 0.16 | 5.11 | 98.421 | 98.421 | 99.019 |
| 10 | 180 | 650 | 0.908 | 0.31 | 0.31 | 0.29 | 99.381 | 99.381 | 99.381 |
| Volume (m3) | COM (US$/kg) | ||||
|---|---|---|---|---|---|
| Expected Oil Yield (%) | |||||
| 0.3 | 0.5 | 0.7 | 1.0 | 1.5 | |
| 0.1 | 999.63 | 599.78 | 428.41 | 299.89 | 199.93 |
| 0.2 | 942.63 | 565.58 | 403.99 | 282.79 | 188.53 |
| 0.4 | 952.04 | 571.22 | 408.02 | 285.61 | 190.41 |
| 0.6 | 945.12 | 567.07 | 405.05 | 283.53 | 189.02 |
| 1.0 | 813.95 | 488.37 | 348.83 | 244.18 | 162.79 |
© 2020 by the authors. Licensee MDPI, Basel, Switzerland. This article is an open access article distributed under the terms and conditions of the Creative Commons Attribution (CC BY) license (http://creativecommons.org/licenses/by/4.0/).
Share and Cite
Aydi, A.; Zibetti, A.W.; Al-Khazaal, A.Z.; ELADEB, A.; ADBERRABA, M.; BARTH, D. Supercritical CO2 Extraction of Extracted Oil from Pistacia lentiscus L.: Mathematical Modeling, Economic Evaluation and Scale-Up. Molecules 2020, 25, 199. https://0-doi-org.brum.beds.ac.uk/10.3390/molecules25010199
Aydi A, Zibetti AW, Al-Khazaal AZ, ELADEB A, ADBERRABA M, BARTH D. Supercritical CO2 Extraction of Extracted Oil from Pistacia lentiscus L.: Mathematical Modeling, Economic Evaluation and Scale-Up. Molecules. 2020; 25(1):199. https://0-doi-org.brum.beds.ac.uk/10.3390/molecules25010199
Chicago/Turabian StyleAydi, Abdelkarim, André Wüst Zibetti, Abdulaal Z. Al-Khazaal, Aboulbaba ELADEB, Manef ADBERRABA, and Danielle BARTH. 2020. "Supercritical CO2 Extraction of Extracted Oil from Pistacia lentiscus L.: Mathematical Modeling, Economic Evaluation and Scale-Up" Molecules 25, no. 1: 199. https://0-doi-org.brum.beds.ac.uk/10.3390/molecules25010199