
Measurement of Glutathione as a Tool for Oxidative Stress Studies by High Performance Liquid Chromatography


Abstract
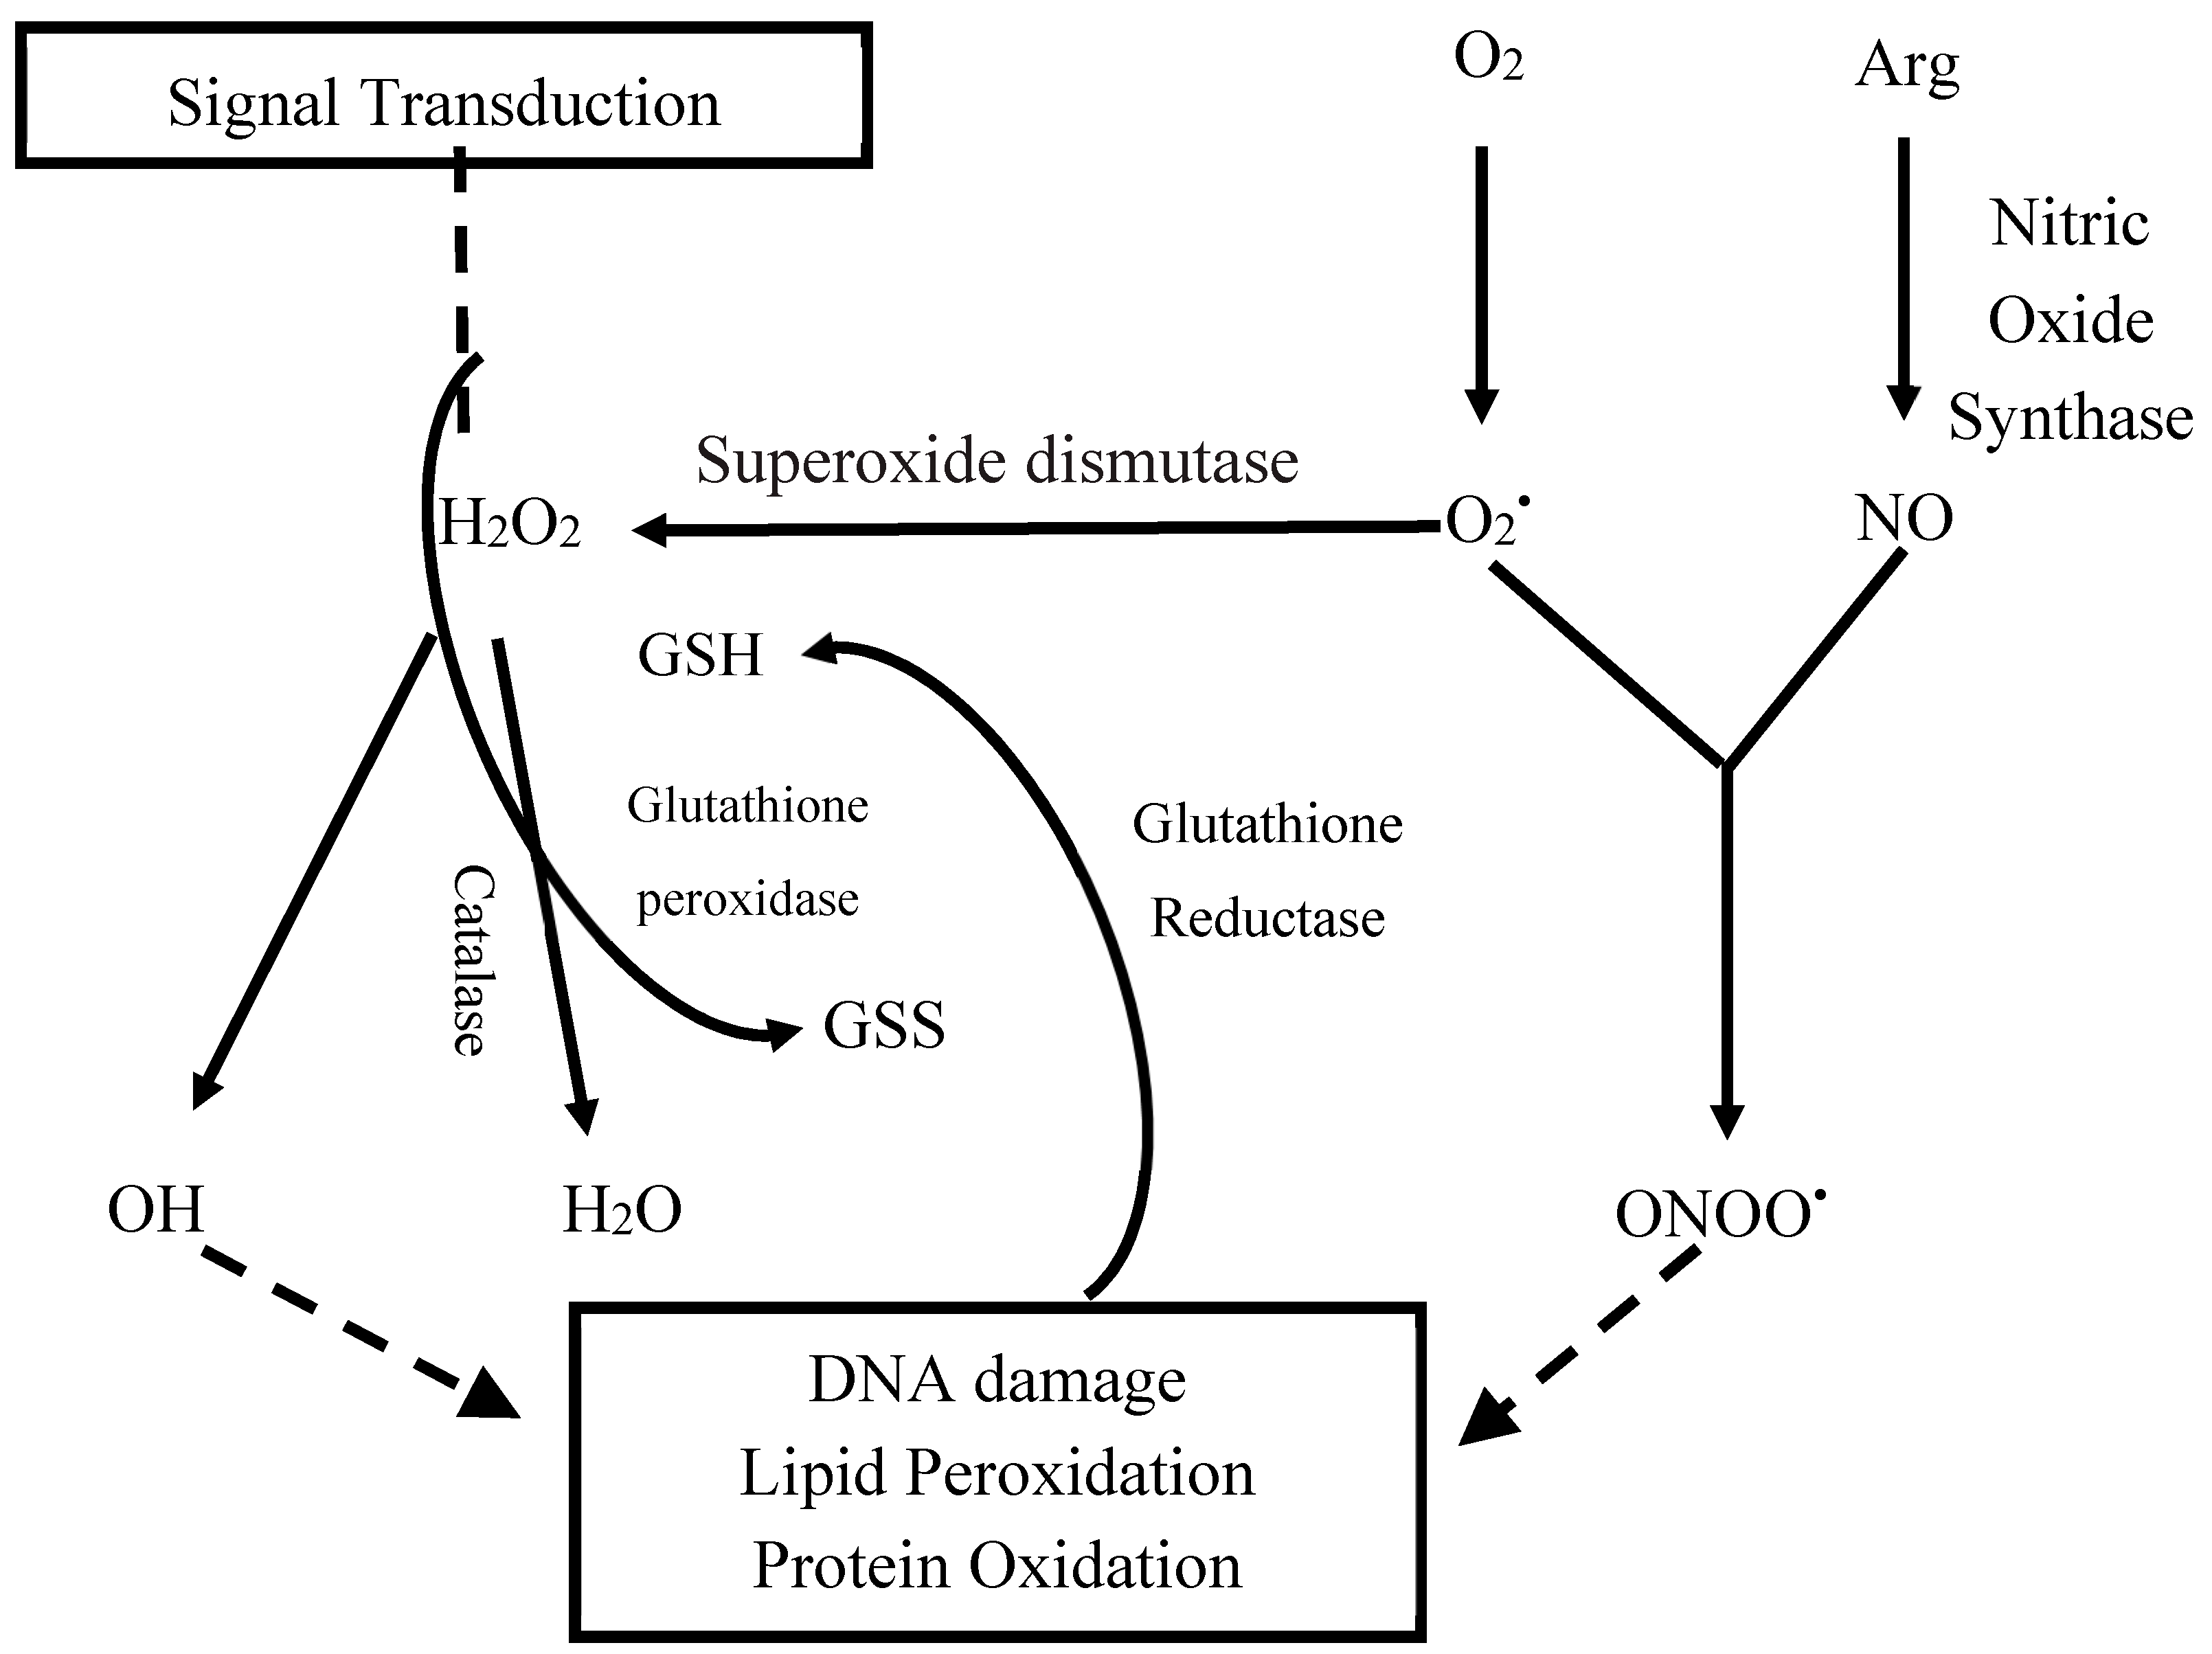
:1. Introduction
2. Results
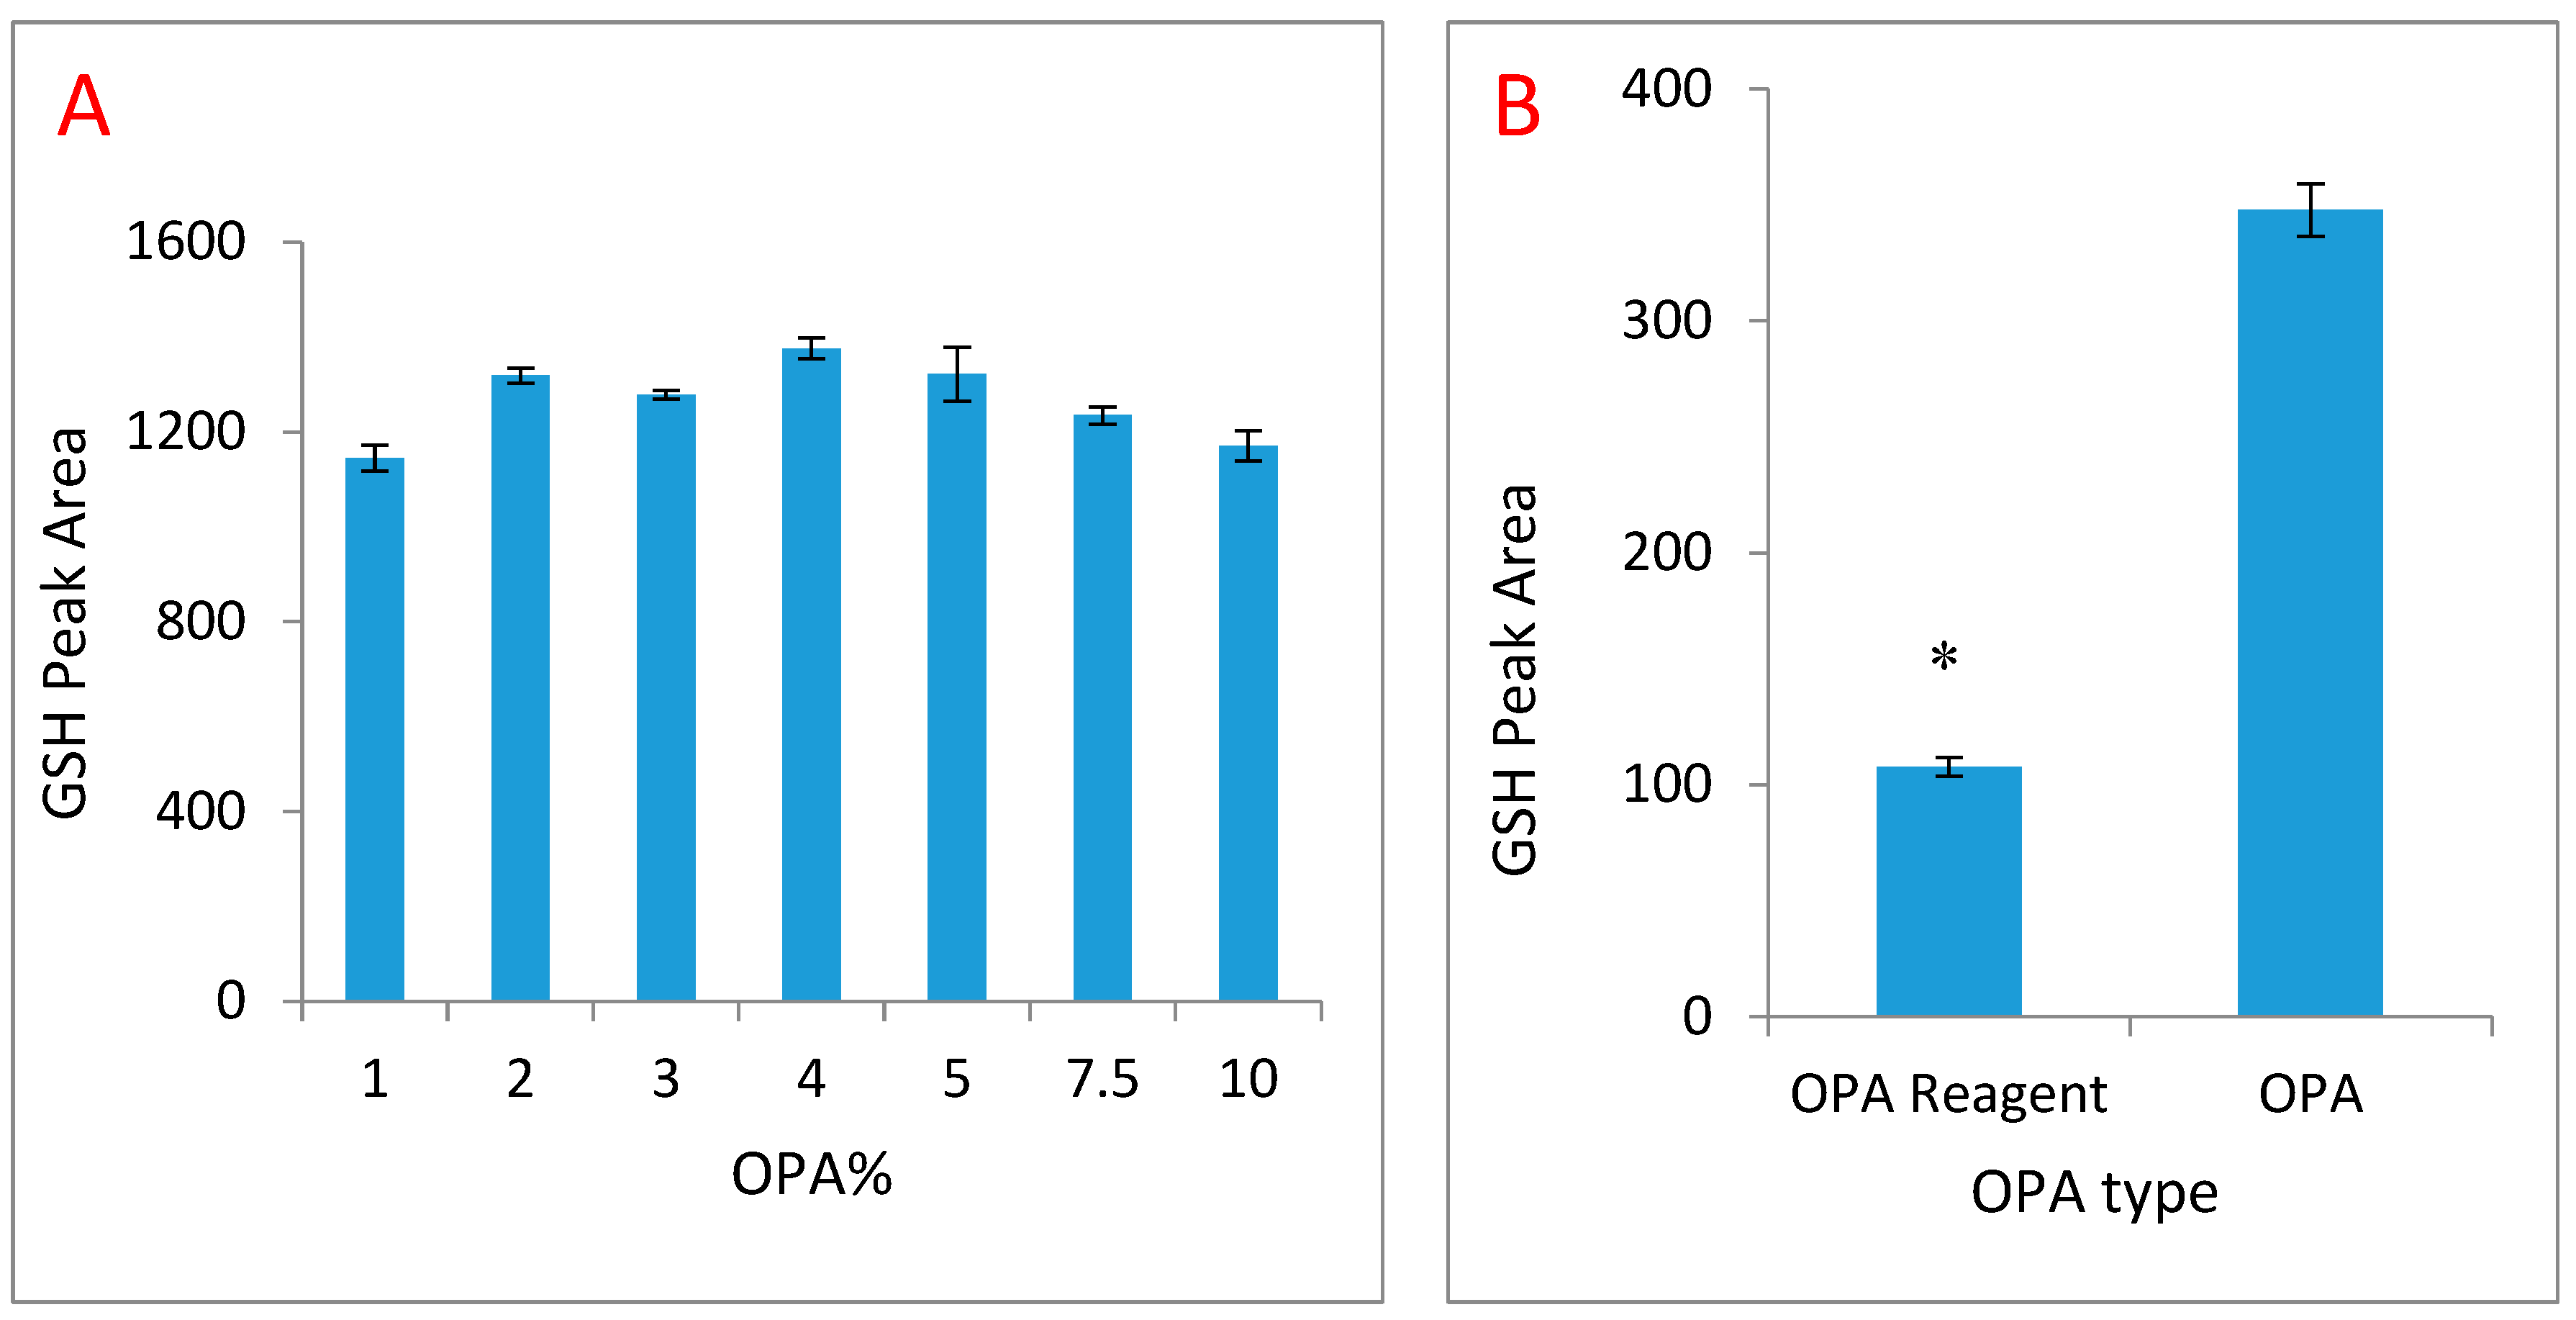
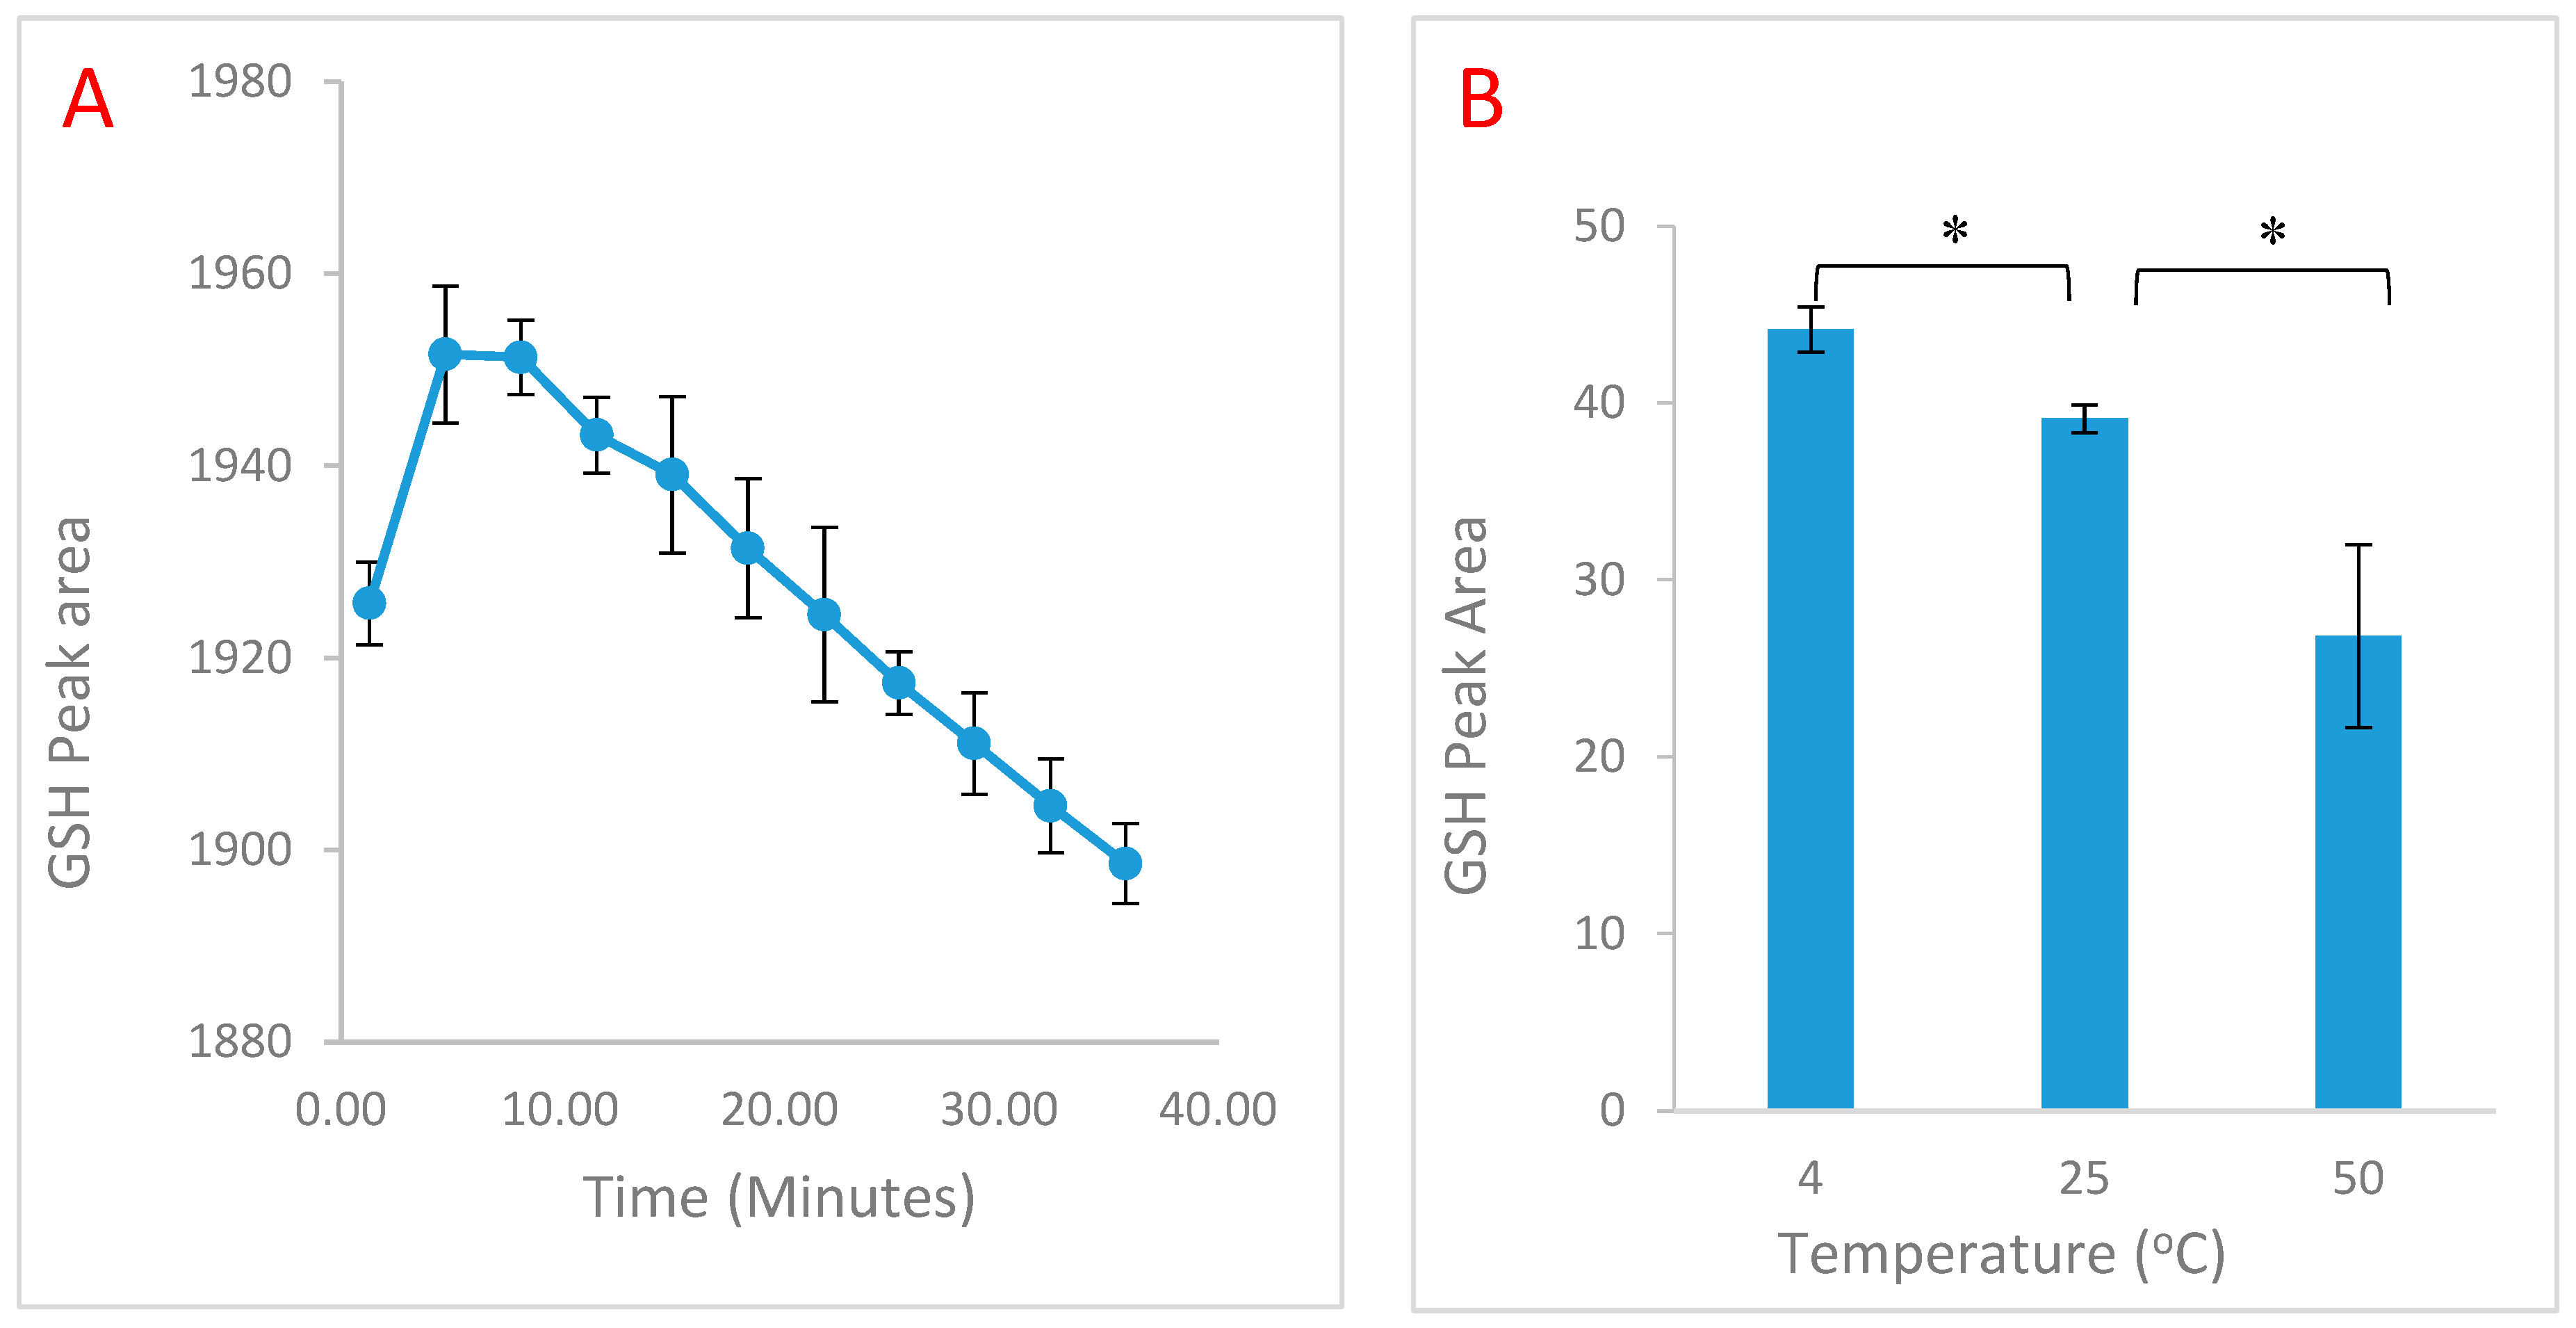
2.1. Time and Temperature Optimisation
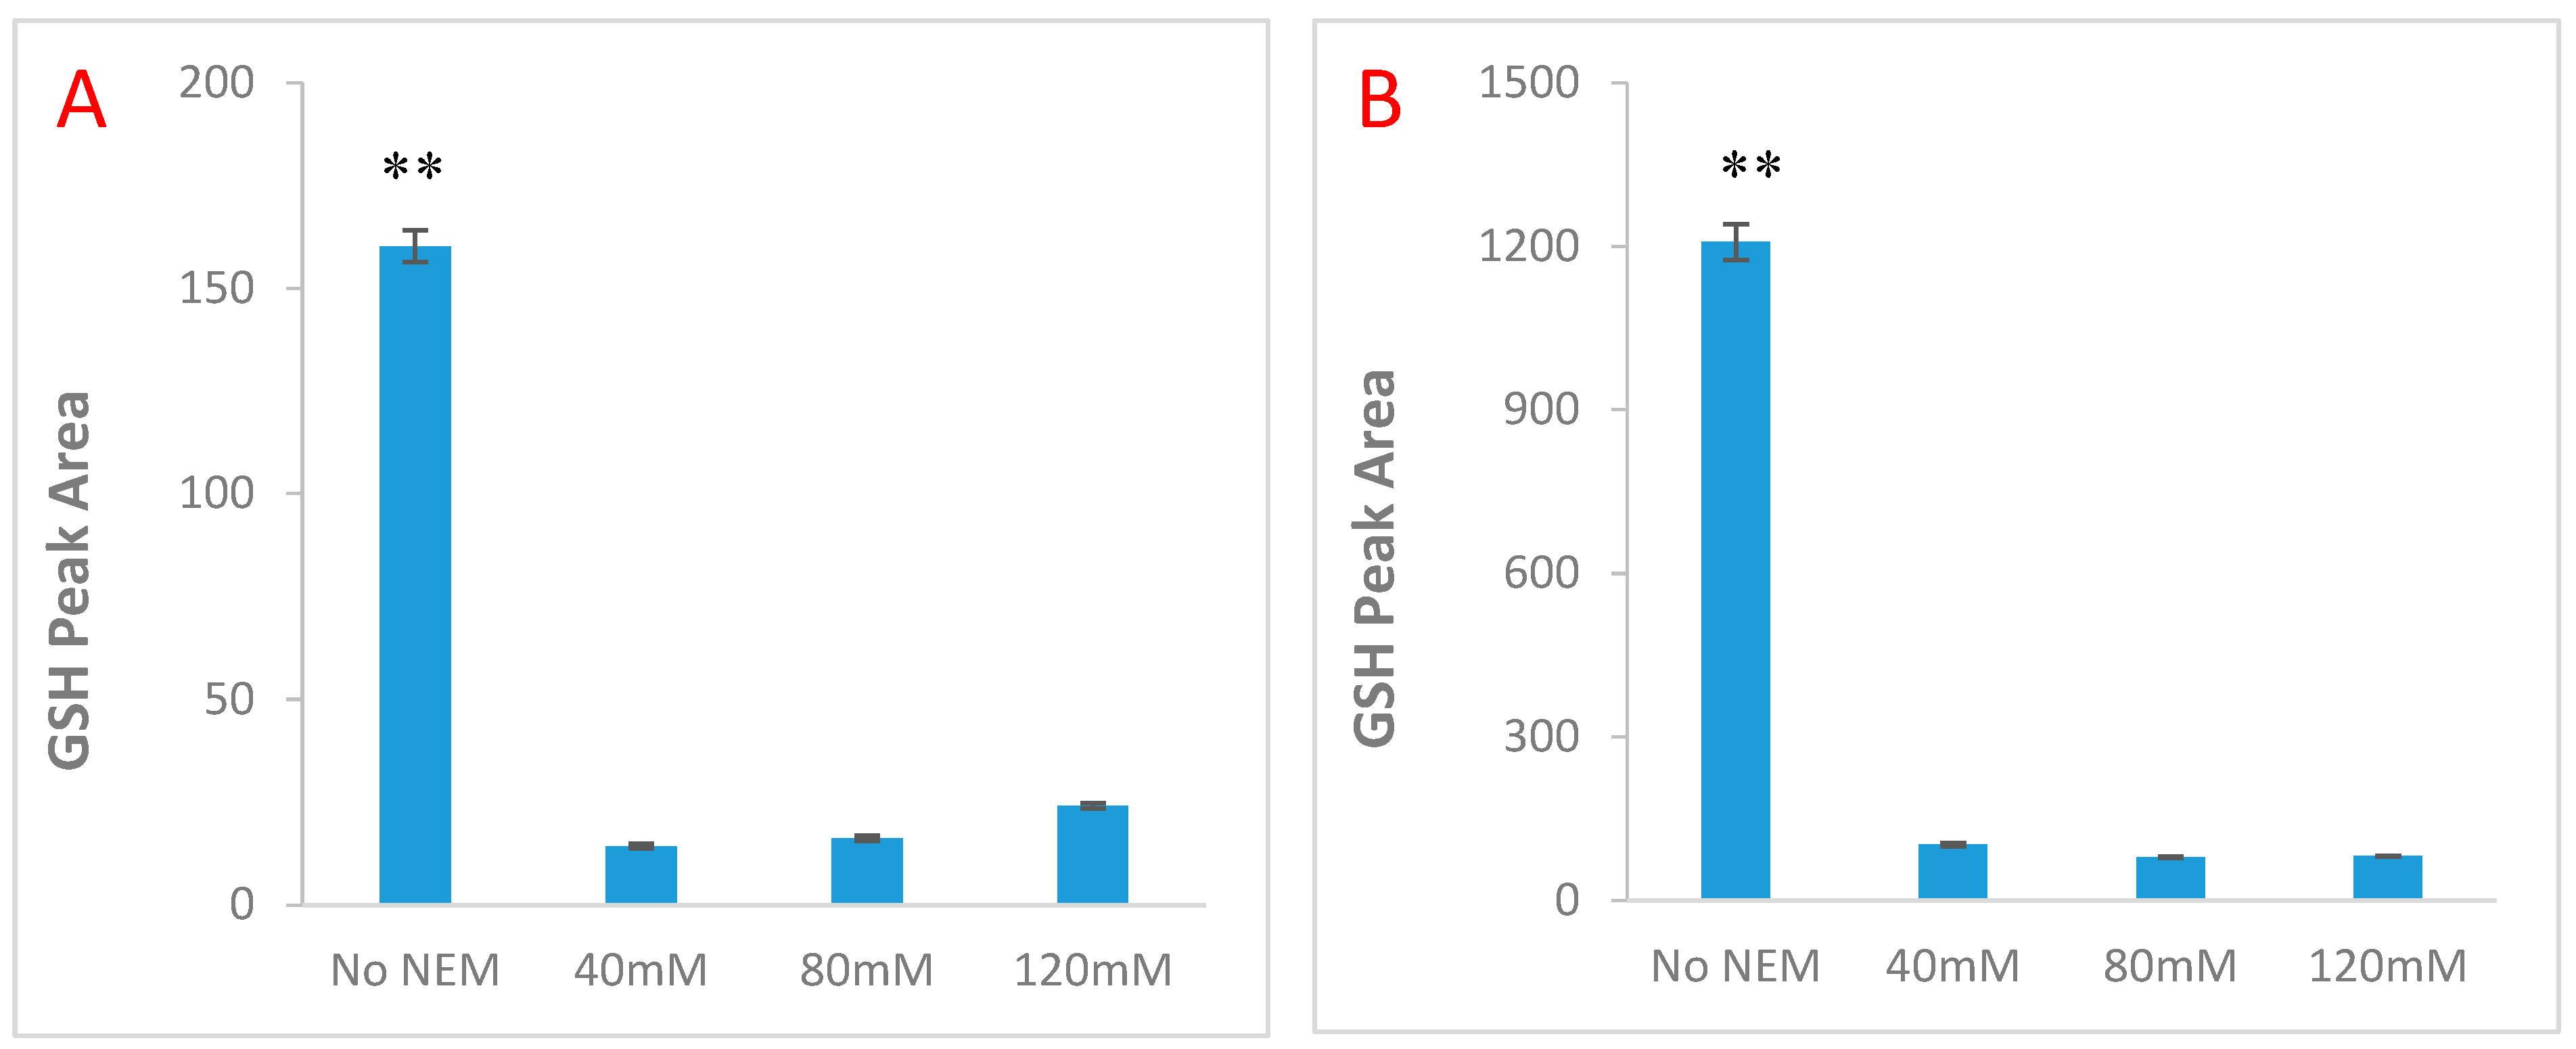
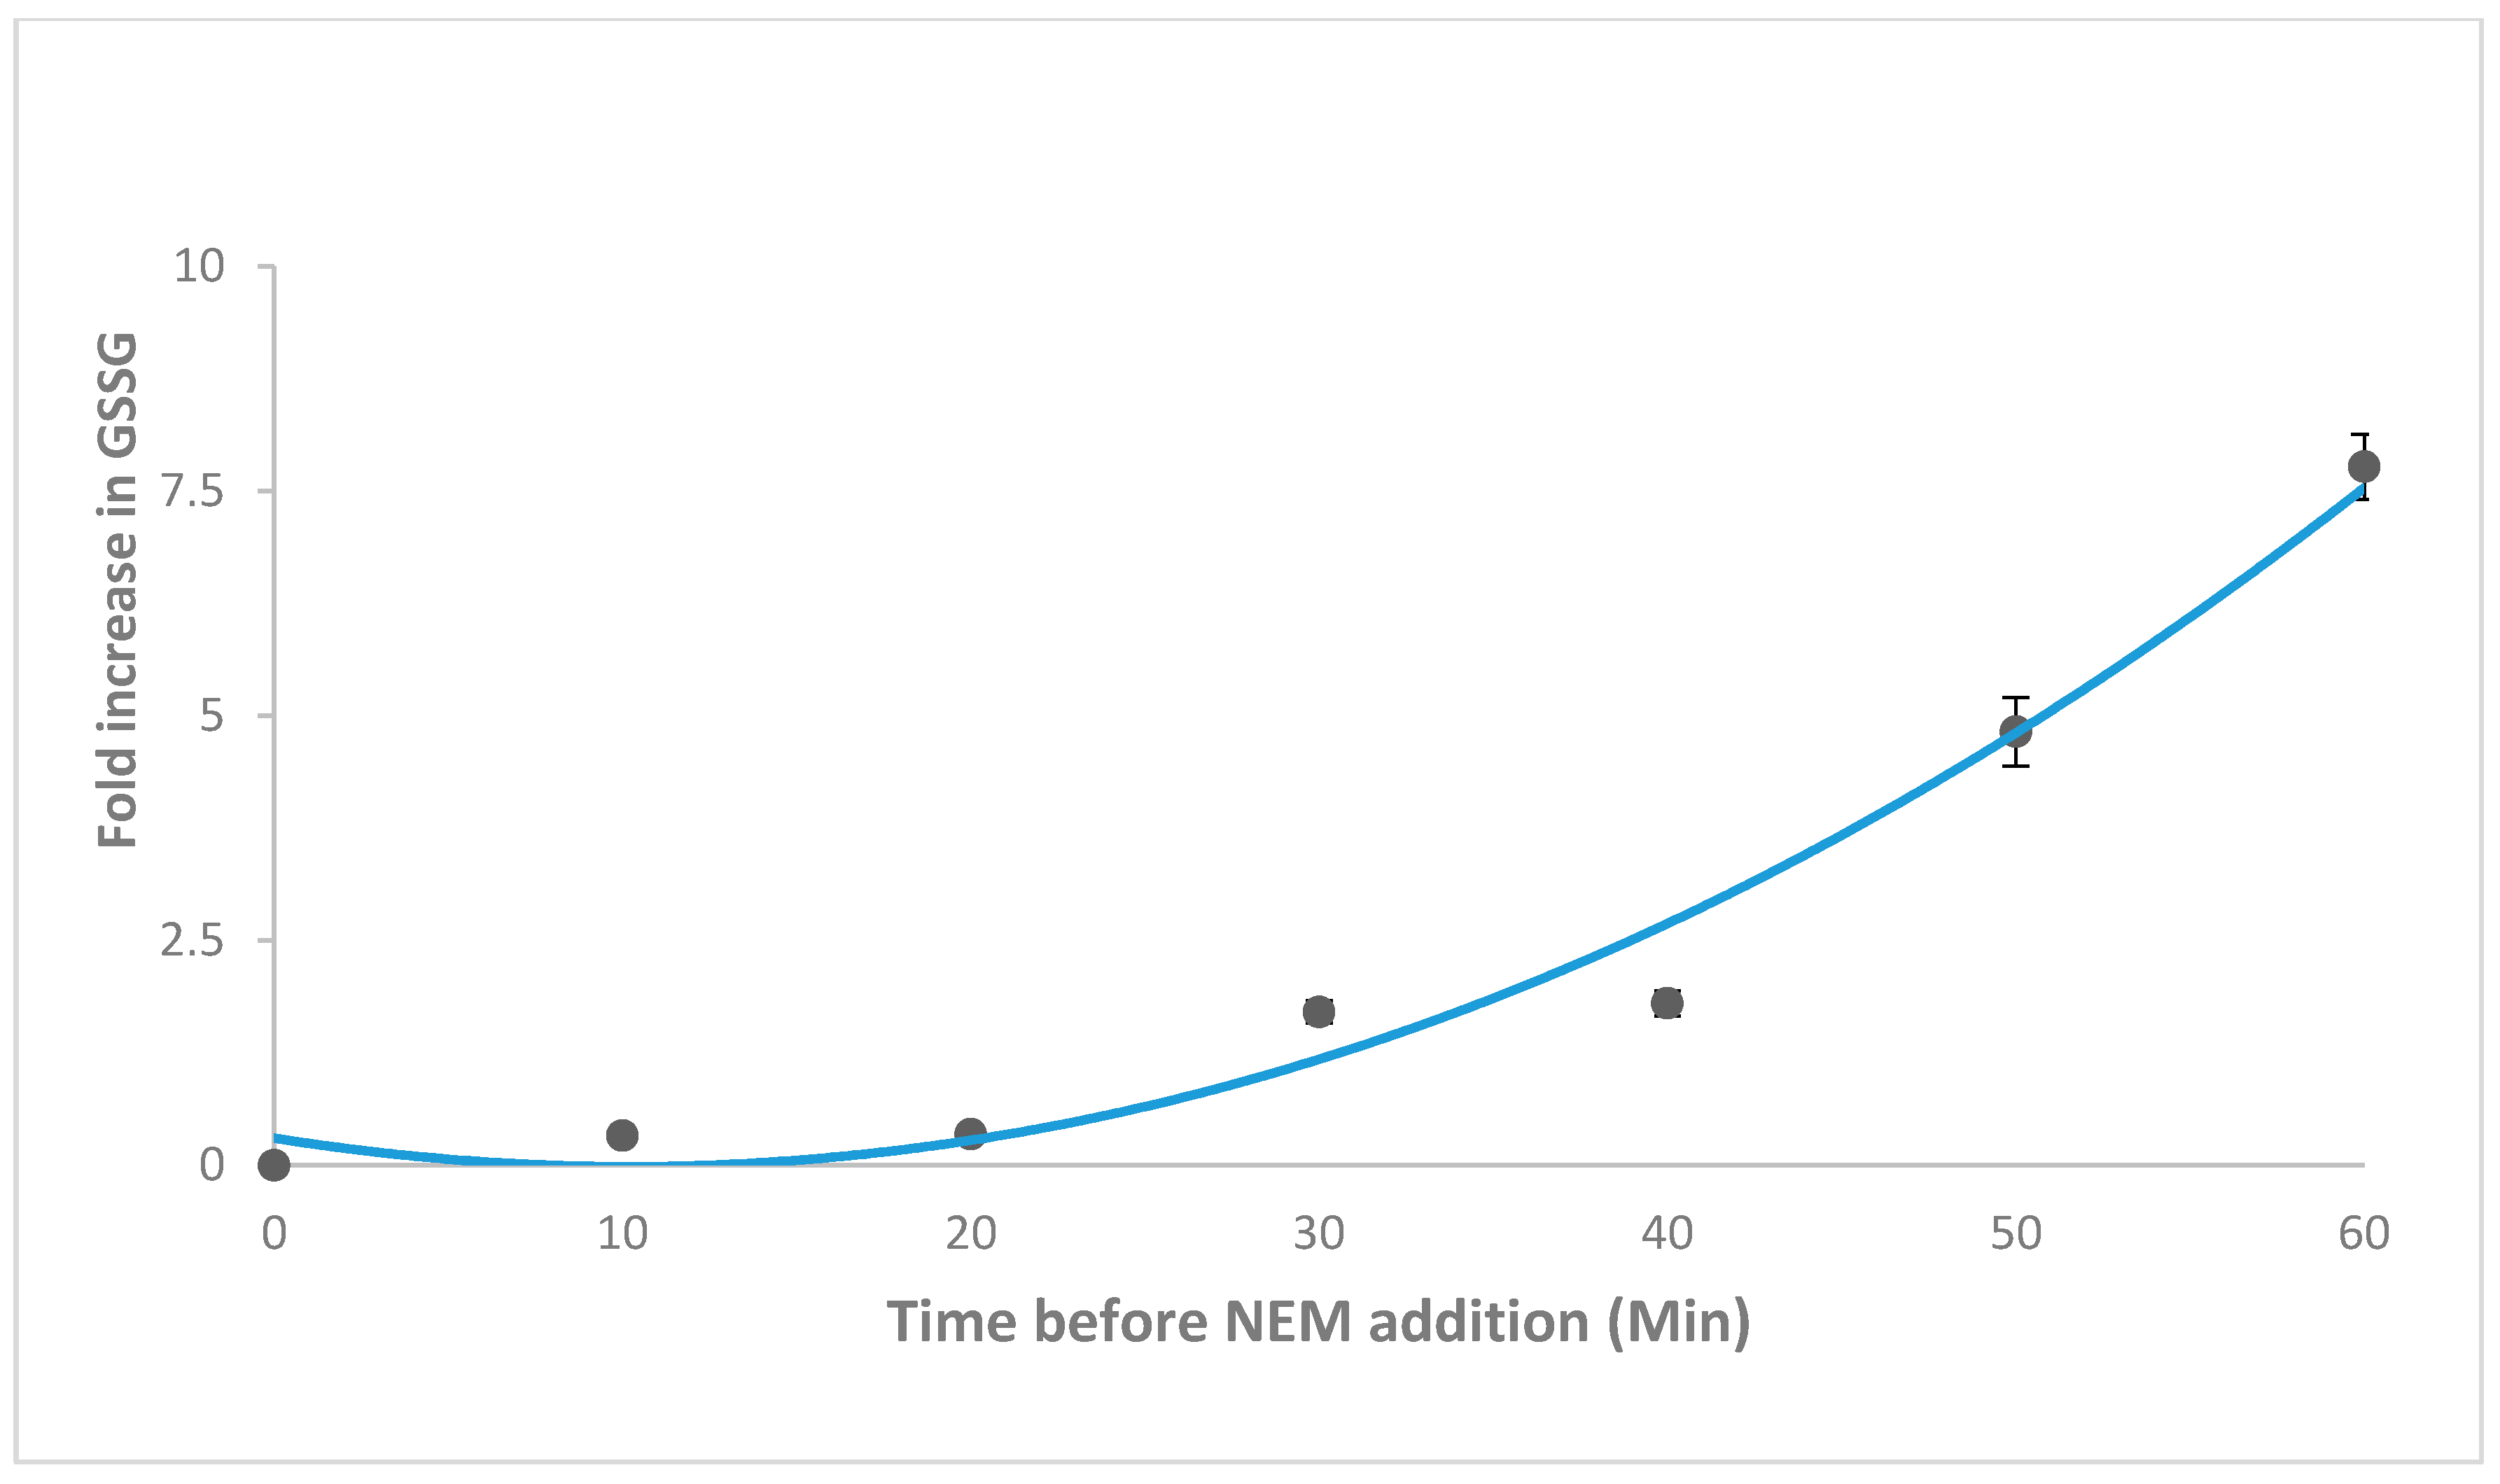
2.2. NEM Optimisation and Autoxidation
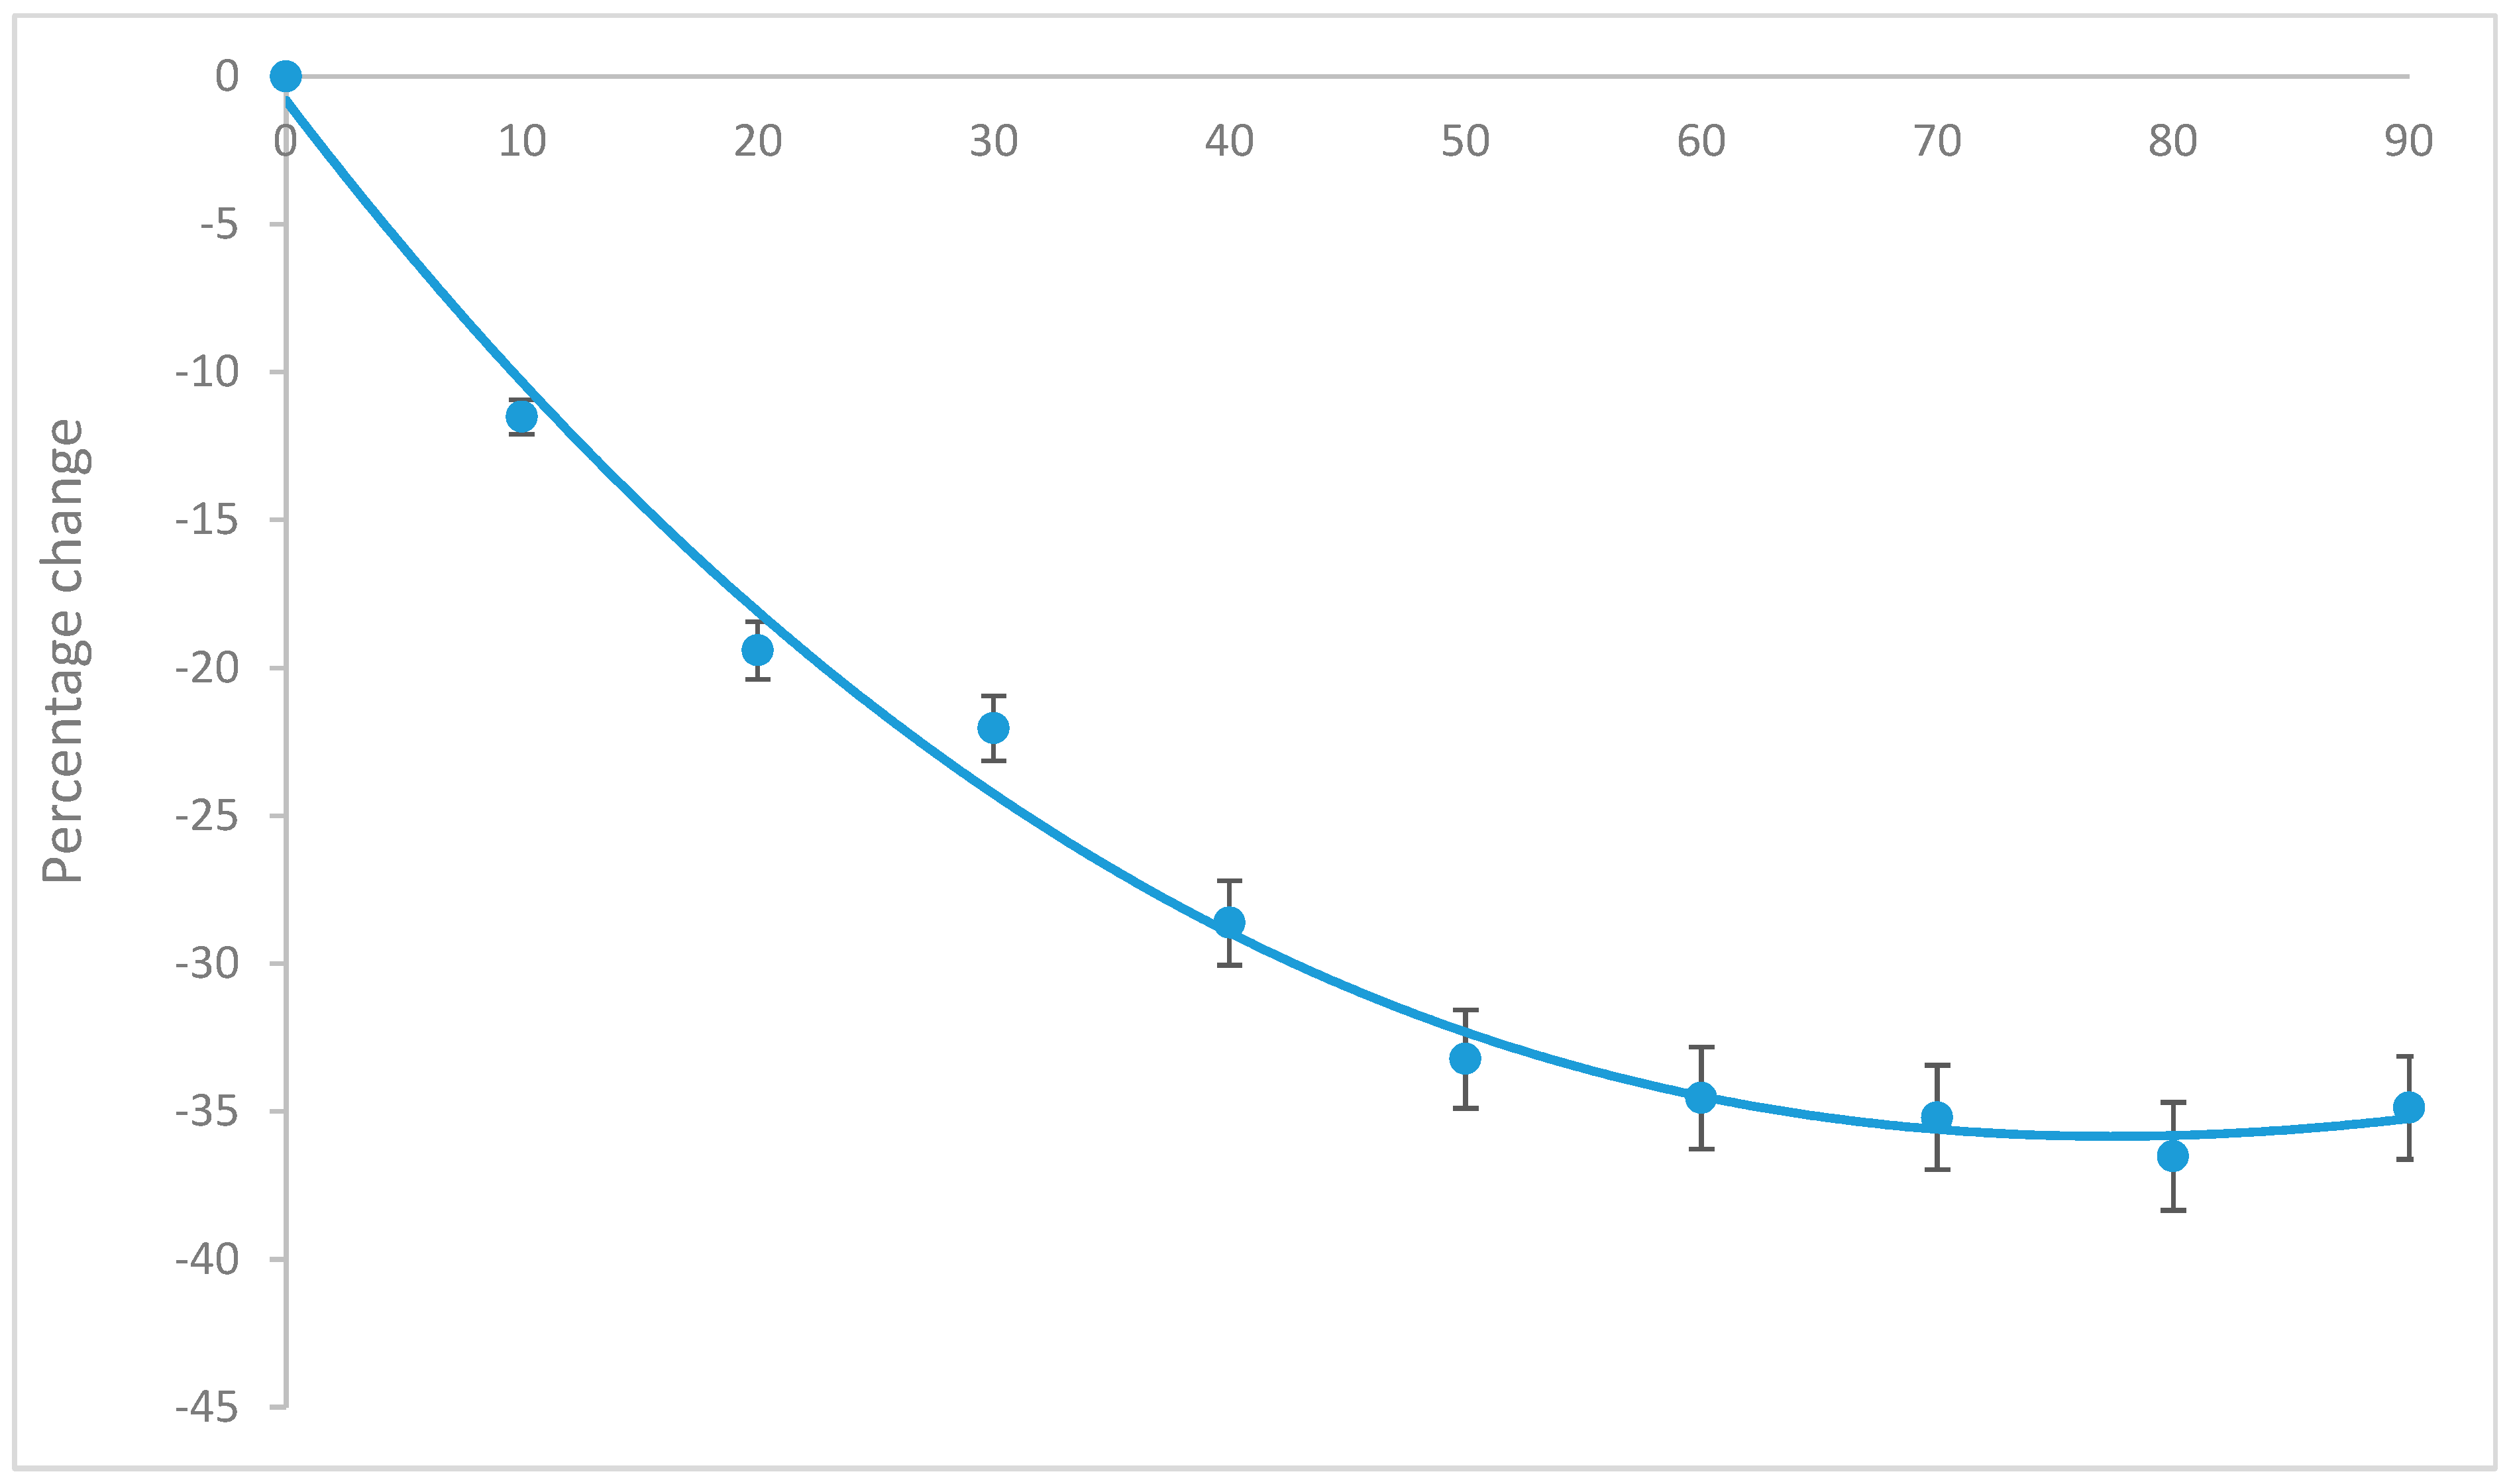
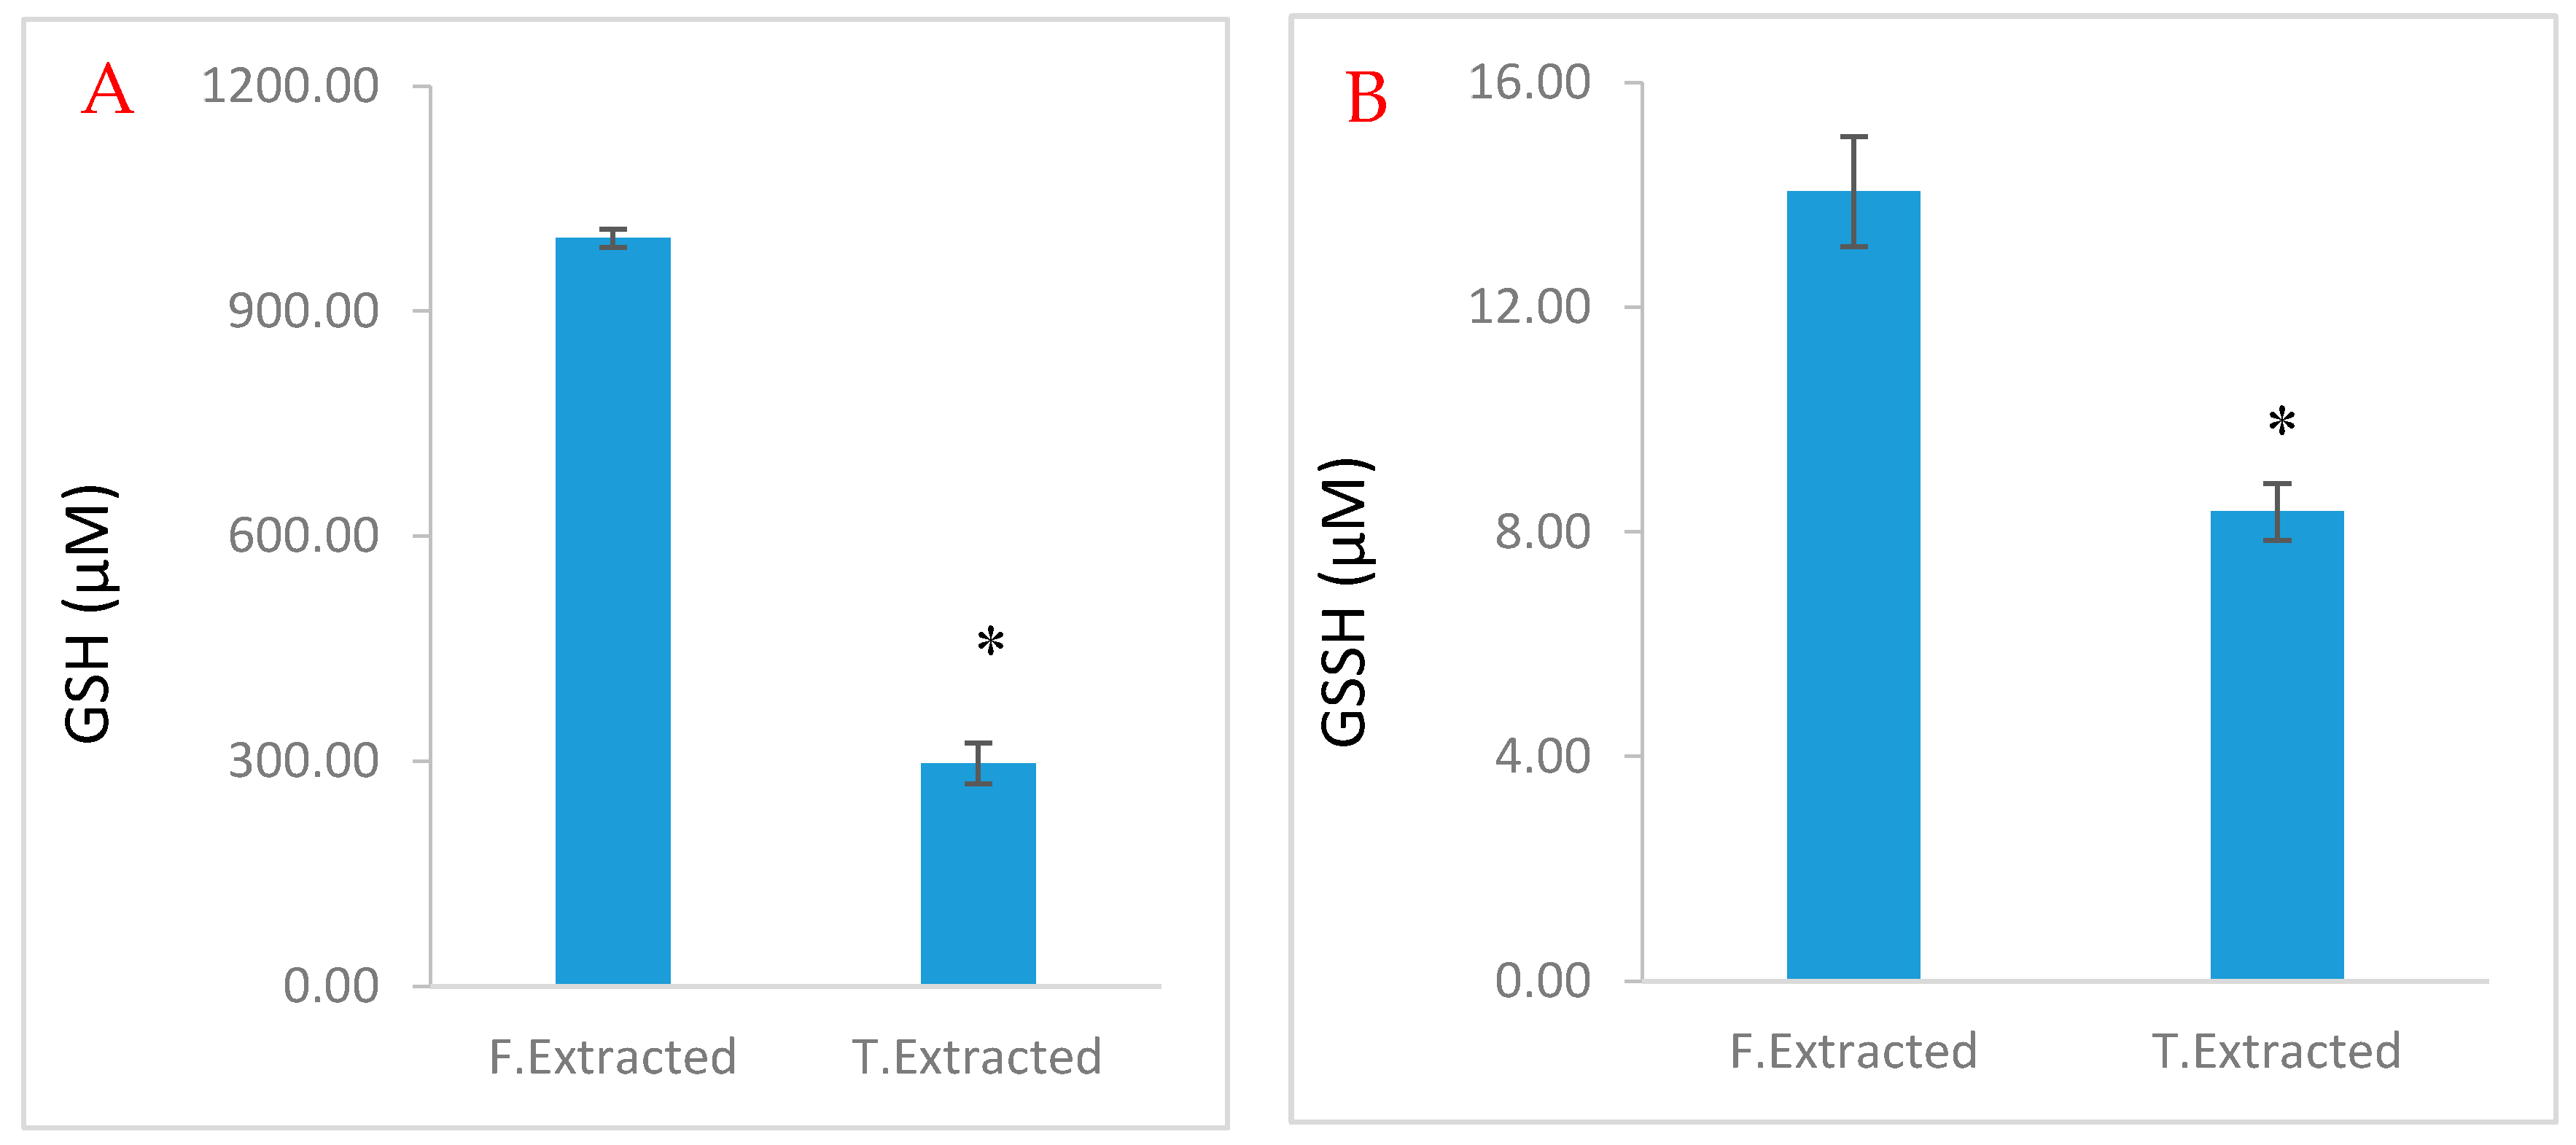
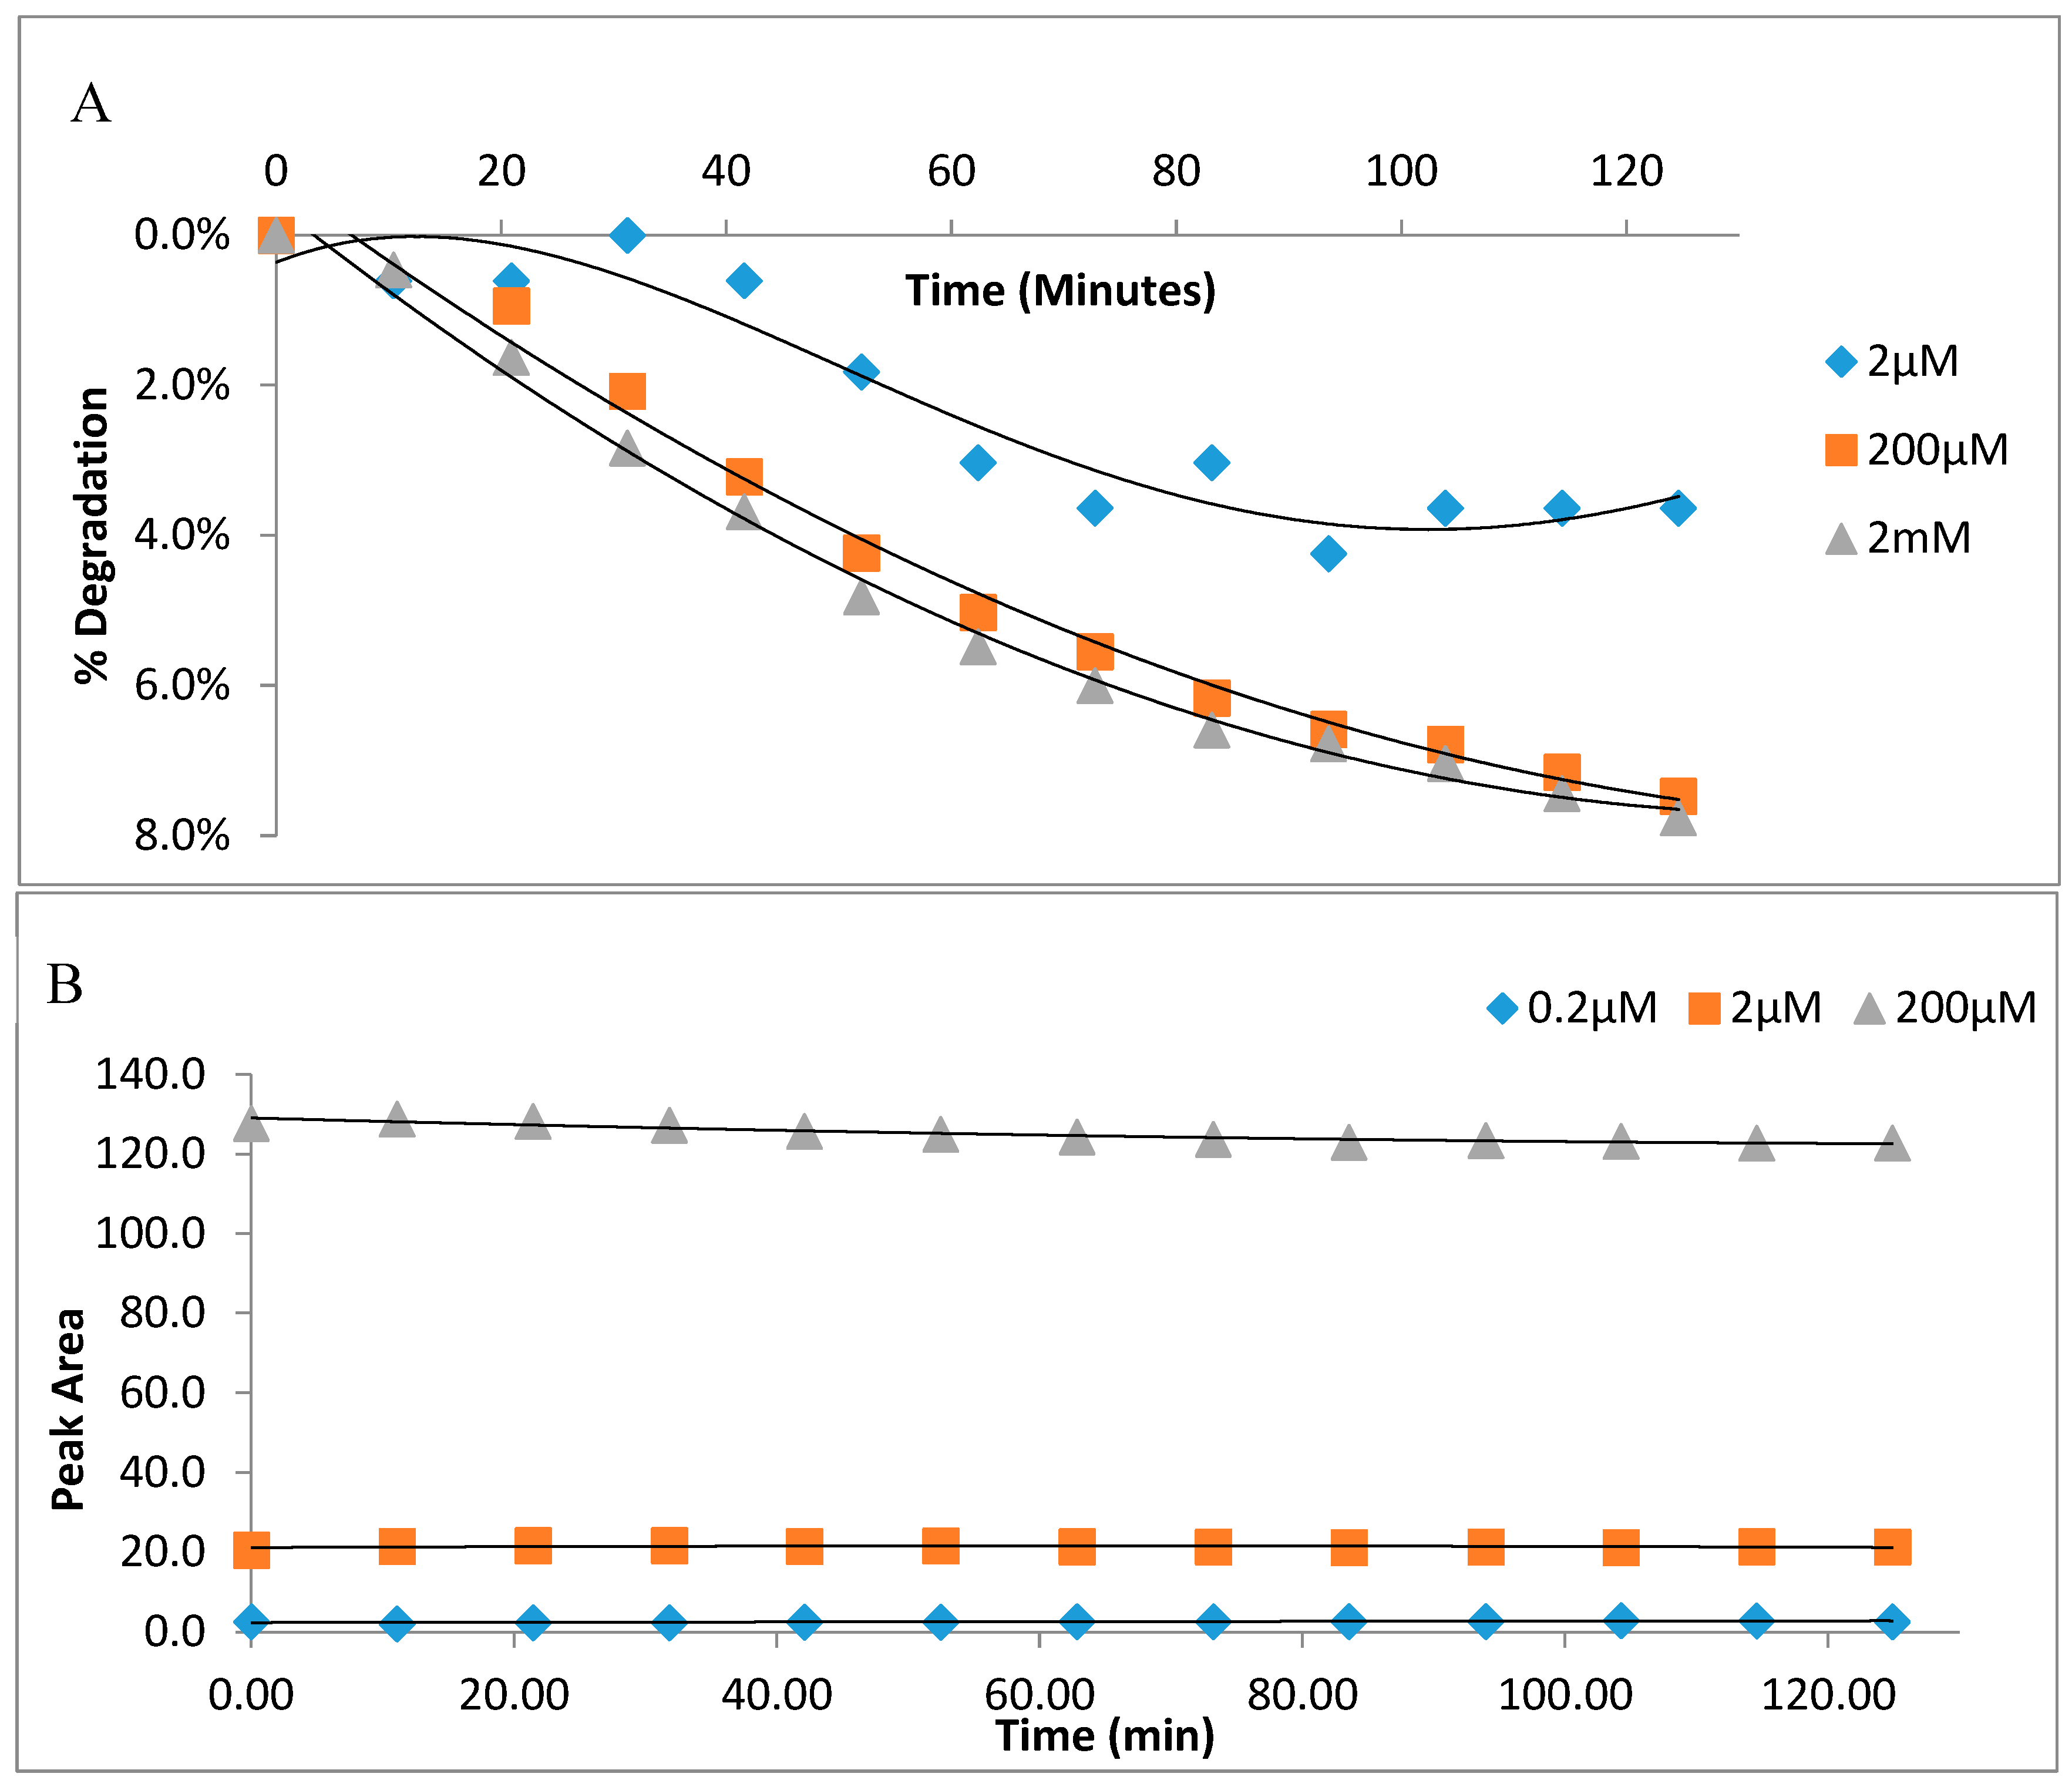
2.3. Stability of Glutathione Extract
3. Discussion
4. Materials and Methods
4.1. Materials
4.2. Method Optimisation
4.3. Sample Collection and Preparation
4.4. Sample Derivatisation
4.5. Standard Curves
4.6. Glutathione Assay
4.7. Statistical Analysis
5. Conclusions
Author Contributions
Funding
Acknowledgments
Conflicts of Interest
Compliance with Ethical Standards
Ethical Approval
References
- Nuhu, F.; Bhandari, S. Oxidative stress and cardiovascular complications in chronic kidney disease, the impact of anaemia. Pharmaceuticals 2018, 11, 103. [Google Scholar] [CrossRef] [Green Version]
- Kuo, K.; Tarng, D. Oxidative stress in chronic kidney disease. Adapt. Med. 2010, 2, 87–94. [Google Scholar]
- Nuhu, F.; Seymour, A.-M.; Bhandari, S. Impact of Intravenous Iron on Oxidative Stress and Mitochondrial Function in Experimental Chronic Kidney Disease. Antioxidants 2019, 8, 498. [Google Scholar] [CrossRef] [Green Version]
- Peoples, J.N.; Saraf, A.; Ghazal, N.; Pham, T.T.; Kwong, J.Q. Mitochondrial dysfunction and oxidative stress in heart disease. Exp. Mol. Med. 2019, 51, 1–13. [Google Scholar] [CrossRef]
- King, N.; Korolchuk, S.; McGivan, J.D.; Suleiman, M.S. A new method of quantifying glutathione levels in freshly isolated single superfused rat cardiomyocytes. J. Pharm. Toxicol. Methods 2004, 50, 215–222. [Google Scholar] [CrossRef]
- Bonora, M.; Wieckowski, M.R.; Chinopoulos, C.; Kepp, O.; Kroemer, G.; Galluzzi, L.; Pinton, P. Molecular mechanisms of cell death: Central implication of ATP synthase in mitochondrial permeability transition. Oncogene 2015, 34, 1475–1486. [Google Scholar] [CrossRef]
- Shirakawa, R.; Yokota, T.; Nakajima, T.; Takada, S.; Yamane, M.; Furihata, T.; Maekawa, S.; Nambu, H.; Katayama, T.; Fukushima, A. Mitochondrial reactive oxygen species generation in blood cells is associated with disease severity and exercise intolerance in heart failure patients. Sci. Rep. 2019, 9, 1–8. [Google Scholar] [CrossRef] [PubMed]
- Ormstad, K.; Jones, D.P.; Orrenius, S. Characteristics of Glutathione Biosynthesis by Freshly Isolated Rat Kidney Cells. J. Biol. Chem. 1980, 255, 175–181. [Google Scholar] [PubMed]
- Meredith, M.J.; Reed, D.J. Status of the mitochondrial pool of glutathione in the isolated hepatocyte. J. Biol. Chem. 1982, 257, 3747–3753. [Google Scholar] [PubMed]
- Lu, S.C. Regulation of glutathione synthesis. Mol. Asp. Med. 2009, 30, 42–59. [Google Scholar] [CrossRef] [PubMed] [Green Version]
- Lu, S.C. Glutathione synthesis. Biochim. Biophys. Acta 2013, 1830, 3143–3153. [Google Scholar] [CrossRef] [PubMed] [Green Version]
- Sutariya, V.; Wehrung, D.; Geldenhuys, W.J. Development and Validation of a Novel RP-HPLC Method for the Analysis of Reduced Glutathione. J. Chrom. Sci. 2012, 50, 271–276. [Google Scholar] [CrossRef] [PubMed] [Green Version]
- Lushchak, V.I. Glutathione Homeostasis and Functions: Potential Targets for Medical Interventions. J. Amino Acids 2012, 1–17. [Google Scholar] [CrossRef] [PubMed] [Green Version]
- Ceballos-Picot, I.; Witko-Sarsat, V.; Merad-Boudia, M.; Nguyen, A.T.; Thevenin, M.; Jaudon, M.C.; Zingraff, J.; Verger, C.; Jungers, P.; Descamps-Latscha, B. Glutathione antioxidant system as a marker of oxidative stress in chronic renal failure. Free Radic. Biol. Med. 1996, 21, 845–853. [Google Scholar] [CrossRef]
- Mytilineou, C.; Kramer, B.C.; Yabut, J.A. Glutathione depletion and oxidative stress. Parkinsonism Relat. Disord. 2002, 8, 385–387. [Google Scholar] [CrossRef]
- Circu, M.L.; Aw, T.Y. Glutathione and modulation of cell apoptosis. Biochim. Biophys. Acta 2012, 1823, 1767–1777. [Google Scholar] [CrossRef] [Green Version]
- Aquilano, K.; Baldelli, S.; Ciriolo, M.R. Glutathione: New roles in redox signaling for an old antioxidant. Front. Pharmacol. 2014, 5, 196. [Google Scholar] [CrossRef] [Green Version]
- Cole, B.F.; Kadlubar, F.F. Detoxification of electrophilic compounds by glutathione S-transferase catalysis: Determinants of individual response to chemical carcinogens and chemotherapeutic drugs? Biofactors 2003, 17, 115–130. [Google Scholar] [CrossRef]
- Tateishi, N.; Higashi, T.; Naruse, A.; Nakashima, K.; Shiozaki, H. Rat liver glutathione: Possible role as a reservoir of cysteine. J. Nutr. 1977, 107, 51–60. [Google Scholar] [CrossRef]
- Turrens, J.F. Mitochondrial formation of reactive oxygen species. J. Physiol. 2003, 552 Pt 2, 335–344. [Google Scholar] [CrossRef]
- Jastroch, M.; Divakaruni, A.S.; Mookerjee, S.; Treberg, J.R.; Brand, M.D. Mitochondrial proton and electron leaks. Essays Biochem. 2010, 47, 53–67. [Google Scholar] [PubMed] [Green Version]
- Sawyer, D.B.; Colucci, W.S. Mitochondrial Oxidative Stress in Heart Failure “Oxygen Wastage” Revisited. Circ. Res. 2000, 86, 119–120. [Google Scholar] [CrossRef] [PubMed] [Green Version]
- Birben, E.; Sahiner, U.M.; Sackesen, C.; Erzurum, S.; Kalayci, M. Oxidative Stress and Antioxidant Defense. World Allergy Organ. J. 2012, 5, 9–19. [Google Scholar] [CrossRef] [PubMed] [Green Version]
- Bai, J.; Cederbaum, A.I. Mitochondrial catalase and oxidative injury. Neurosignals 2001, 10, 189–199. [Google Scholar] [CrossRef] [PubMed]
- Vaziri, N.D.; Wang, X.Q.; Oveisi, F.; Rad, B. Induction of oxidative stress by glutathione depletion causes severe hypertension in normal rats. Hypertension 2000, 36, 142–146. [Google Scholar] [CrossRef] [PubMed] [Green Version]
- Khansari, N.; Shakiba, Y.; Mahmoudi, M. Chronic inflammation and oxidative stress as a major cause of age-related diseases and cancer. Recent Pat. Inflamm. Allergy Drug Discov. 2009, 3, 73–80. [Google Scholar] [CrossRef]
- Kumagai, S.; Jikimoto, T.; Saegusa, J. Pathological roles of oxidative stress in autoimmune diseases. Rinsho Byori 2003, 51, 126–132. [Google Scholar]
- Shah, A.A.; Sinha, A.A. Oxidative stress and autoimmune skin disease. Eur. J. Dermatol. 2013, 23, 5–13. [Google Scholar] [CrossRef]
- Li, S.; Tan, H.-Y.; Wang, N.; Zhang, Z.-J.; Lao, L.; Wong, C.-W.; Feng, Y. The Role of Oxidative Stress and Antioxidants in Liver Diseases. Int. J. Mol. Sci. 2015, 16, 26087–26124. [Google Scholar] [CrossRef] [Green Version]
- Zhang, J.; Hu, Z.; Chen, X. Quantification of glutathione and glutathione disulfide in human plasma and tobacco leaves by capillary electrophoresis with laser-induced fluorescence detection. Talanta 2005, 65, 986–990. [Google Scholar] [CrossRef]
- Kandar, R.; Zakova, P.; Lotkova, H.; Kucera, O.; Cervinkova, Z. Determination of reduced and oxidized glutathione in biological samples using liquid chromatography with fluorimetric detection. J. Pharm. Biomed. Anal. 2007, 43, 1382–1387. [Google Scholar] [CrossRef] [PubMed]
- Du Toit, W.J.; Lisjak, K.; Stander, M. Using LC-MSMS to assess glutathione levels in south African white grape juices and wines made with different levels of oxygen. J. Agric. Food Chem. 2007, 55, 2765–2769. [Google Scholar] [CrossRef] [PubMed]
- Garcia, S.C.; Schott, K.; Charao, M.; Moro, A.; Bulcao, R.; Grotto, D.; Valentini, J.; Bohrer, D.; Cardoso, S.; Pomblum, V. Quantification of reduced glutathione by HPLC-UV in erythrocytes of hemodialysis patients. Biomed. Chromatogr. 2008, 22, 460–468. [Google Scholar] [CrossRef] [PubMed]
- Yilmaz, O.; Keser, S.; Tuzcu, M.; Guvenc, M.; Cetintas, B.; Irtegun, S.; Tastan, H.; Sahin, K. A practical HPLC method to measure reduced (GSH) and oxidized (GSSG) glutathione concentrations in animal tissues. J. Anim. Vet. Adv. 2009, 8, 343–347. [Google Scholar]
- Marchand, S.; de Revel, G.A. HPLC fluorescence-based method for glutathione derivatives quantification in must and wine. Anal. Chim. Acta 2010, 660, 158–163. [Google Scholar] [CrossRef]
- Giustarini, D.; Colombo, G.; Garavaglia, M.L.; Astori, E.; Prtinaro, N.M.; Reggiani, F.; Badalamenti, S.; Aloisi, A.M.; Santucci, A.; Rossi, R.; et al. Assessment of glutathione/glutathione disulphide ratio and S-glutathionylated proteins in human blood, solid tissues, and cultured cells. Free Radic. Biol. Med. 2017, 112, 360–375. [Google Scholar] [CrossRef]
- Appala, R.N.; Chigurupati, S.; Appala, R.V.; Krishnan Selvarajan, K.; Islam Mohammad, J. A Simple HPLC-UV Method for the Determination of Glutathione in PC-12 Cells. Scientifica 2016, 1–9. [Google Scholar] [CrossRef] [Green Version]
- Yap, L.P.; Sancheti, H.; Ybanez, M.D.; Garcia, J.; Cadenas, E.; Han, D. Determination of GSH, GSSG, and GSNO using HPLC with electrochemical detection. Methods Enzymol. 2010, 473, 137–147. [Google Scholar]
- Bayram, B.; Rimbach, G.; Frank, J.; Esatbeyoglu, T. Rapid Method for Glutathione Quantitation Using High-Performance Liquid Chromatography with Coulometric Electrochemical Detection. J. Agric. Food Chem. 2014, 62, 402–408. [Google Scholar] [CrossRef]
- Seymour, A.M.; Eldar, H.; Radda, G.K. Hyperthyroidism results in increased glycolytic capacity in the rat heart. A 31P-NMR study. Biochem. Biophys. Acta 1990, 1055, 107–116. [Google Scholar] [CrossRef]
- Reuter, S.; Gupta, S.C.; Chaturvedi, M.M.; Aggarwal, B.B. Oxidative stress, inflammation, and cancer: How are they linked? Free Radic. Biol. Med. 2010, 49, 1603–1616. [Google Scholar] [CrossRef] [PubMed] [Green Version]
- Tsutsui, H.; Kinugawa, S.; Matsushima, S. Oxidative stress and heart failure. Am. J. Physiol. Heart Circ. Physiol. 2011, 301, H2181–H2190. [Google Scholar] [CrossRef] [PubMed] [Green Version]
- Kuchta, A.; Pacanis, A.; Kortas-Stempak, B.; Ćwiklińska, A.; Ziętkiewicz, M.; Renke, M.; Rutkowski, B. Estimation of Oxidative Stress Markers in Chronic Kidney Disease. Kidney Blood Press. Res. 2011, 34, 12–19. [Google Scholar] [CrossRef] [PubMed]
- Johnson, R.J.; Lovett, D.; Lehrer, R.I.; Couser, W.G.; Klebanoff, S.J. Role of oxidants and protease in glomerular injury. Kidney Int. 1994, 45, 352–359. [Google Scholar] [CrossRef] [Green Version]
- Hare, J.M. Oxidative Stress and Apoptosis in Heart Failure Progression. Circ. Res. 2001, 89, 198–200. [Google Scholar] [CrossRef] [PubMed] [Green Version]
- Gorrini, C.; Harris, I.S.; Mak, T.W. Modulation of oxidative stress as an anticancer strategy. Nat. Rev. Drug Discov. 2013, 12, 931–947. [Google Scholar] [CrossRef]
- Saydam, N.; Kirb, A.; Demir, O.; Hazan, E.; Oto, O.; Saydam, O.; Guner, G. Determination of glutathione, glutathione reductase, glutathione perooxidase glutathione S-transferase levels in human lung cancer tissue. Cancer Lett. 1997, 119, 13–19. [Google Scholar] [CrossRef]
- Tipple, T.E.; Rogers, L.K. Methods for the Determination of Plasma or Tissue Glutathione Levels. Methods Mol. Biol. 2012, 889, 315–324. [Google Scholar]
- Floreani, M.; Petrone, M.; Debetto, P.; Palatini, P. Comparison between different methods for the determination of reduced and oxidised glutathione in mammalian tissues. J. Free Radic. Res. 1997, 26, 449–455. [Google Scholar] [CrossRef]
- Mcgill, M.R.; Jaeschke, H. A direct comparison of methods used to measure oxidized glutathione in biological samples: 2-vinylpyridine and N-ethylmaleimide. Toxicol. Mech. Methods 2015, 25, 589–595. [Google Scholar] [CrossRef] [Green Version]
- Parani, R.; De Vecchi, E.; Cighetti, G.; Arcelloni, C.; Fermo, I.; Grossi, A.; Bonini, P. HPLC ophthalidehyde precolumn derivatisation to measure total, oxidised, protein bound glutathione in blood, plasma and tissue. Clin. Chem. 1995, 41, 448–454. [Google Scholar] [CrossRef]
Sample Availability: Samples of the compounds are not available or necessary from the authors. |


| Regression Analysis for the Range of GSH and GSSG Standard Curves | ||
|---|---|---|
| Linearity range | 1.2 µM–4 mM | GSH |
| 1.0 µM–0.4 mM | GSSG | |
| Slope | 0.413 | GSH |
| 1.27 | GSSG | |
| Intercept | 20.16 | GSH |
| −8.78 | GSSG | |
| Regression equation | Y = 0.413x + 21.16 | GSH |
| Y = 1.27x − 8.78 | GSSG | |
| Coefficient of Determination (r2) | 99.6% | GSH |
| 99.6% | GSSG | |
| Coefficient of correlation (R) | 1.00 | GSH |
| 1.00 | GSSG | |
| Limit of detection (LOD) | 0.34 µM | GSH |
| 0.26 µM | GSSG | |
| Limit of quantification (LOQ) | 1.14 µM | GSH |
| 0.88 µM | GSSG | |
| Time (min) | 0 | 4.0 | 4.5 | 6.0 | 6.5 | 6.51 | 8.5 |
|---|---|---|---|---|---|---|---|
| %A (phosphate buffer) | 99.5 | 98 | 98 | 65 | 65 | 99.5 | 99.5 |
| %B (ACN) | 0.5 | 2 | 2 | 35 | 35 | 0.5 | 0.5 |
| Flow Rate mL/min | 0.4 | 0.6 | 1.25 | 1.5 | 1.5 | 1.5 | 1.5 |
© 2020 by the authors. Licensee MDPI, Basel, Switzerland. This article is an open access article distributed under the terms and conditions of the Creative Commons Attribution (CC BY) license (http://creativecommons.org/licenses/by/4.0/).
Share and Cite
Nuhu, F.; Gordon, A.; Sturmey, R.; Seymour, A.-M.; Bhandari, S. Measurement of Glutathione as a Tool for Oxidative Stress Studies by High Performance Liquid Chromatography. Molecules 2020, 25, 4196. https://0-doi-org.brum.beds.ac.uk/10.3390/molecules25184196
Nuhu F, Gordon A, Sturmey R, Seymour A-M, Bhandari S. Measurement of Glutathione as a Tool for Oxidative Stress Studies by High Performance Liquid Chromatography. Molecules. 2020; 25(18):4196. https://0-doi-org.brum.beds.ac.uk/10.3390/molecules25184196
Chicago/Turabian StyleNuhu, Faisal, Andrew Gordon, Roger Sturmey, Anne-Marie Seymour, and Sunil Bhandari. 2020. "Measurement of Glutathione as a Tool for Oxidative Stress Studies by High Performance Liquid Chromatography" Molecules 25, no. 18: 4196. https://0-doi-org.brum.beds.ac.uk/10.3390/molecules25184196