Appendix A
Table A1.
Parameters used in the Ewald program.
Table A1.
Parameters used in the Ewald program.
| Crystal | Zone 1 | Number of Charges | Unit Cell Composition | Supercell | Total |
|---|
| | Composition | in Zone 2 | | “Zones 1 + 2 + 3” | Number |
|---|
| | (Number of Atoms ) | (Diameter of Zone 2) | | Dimensions | of Atoms a |
|---|
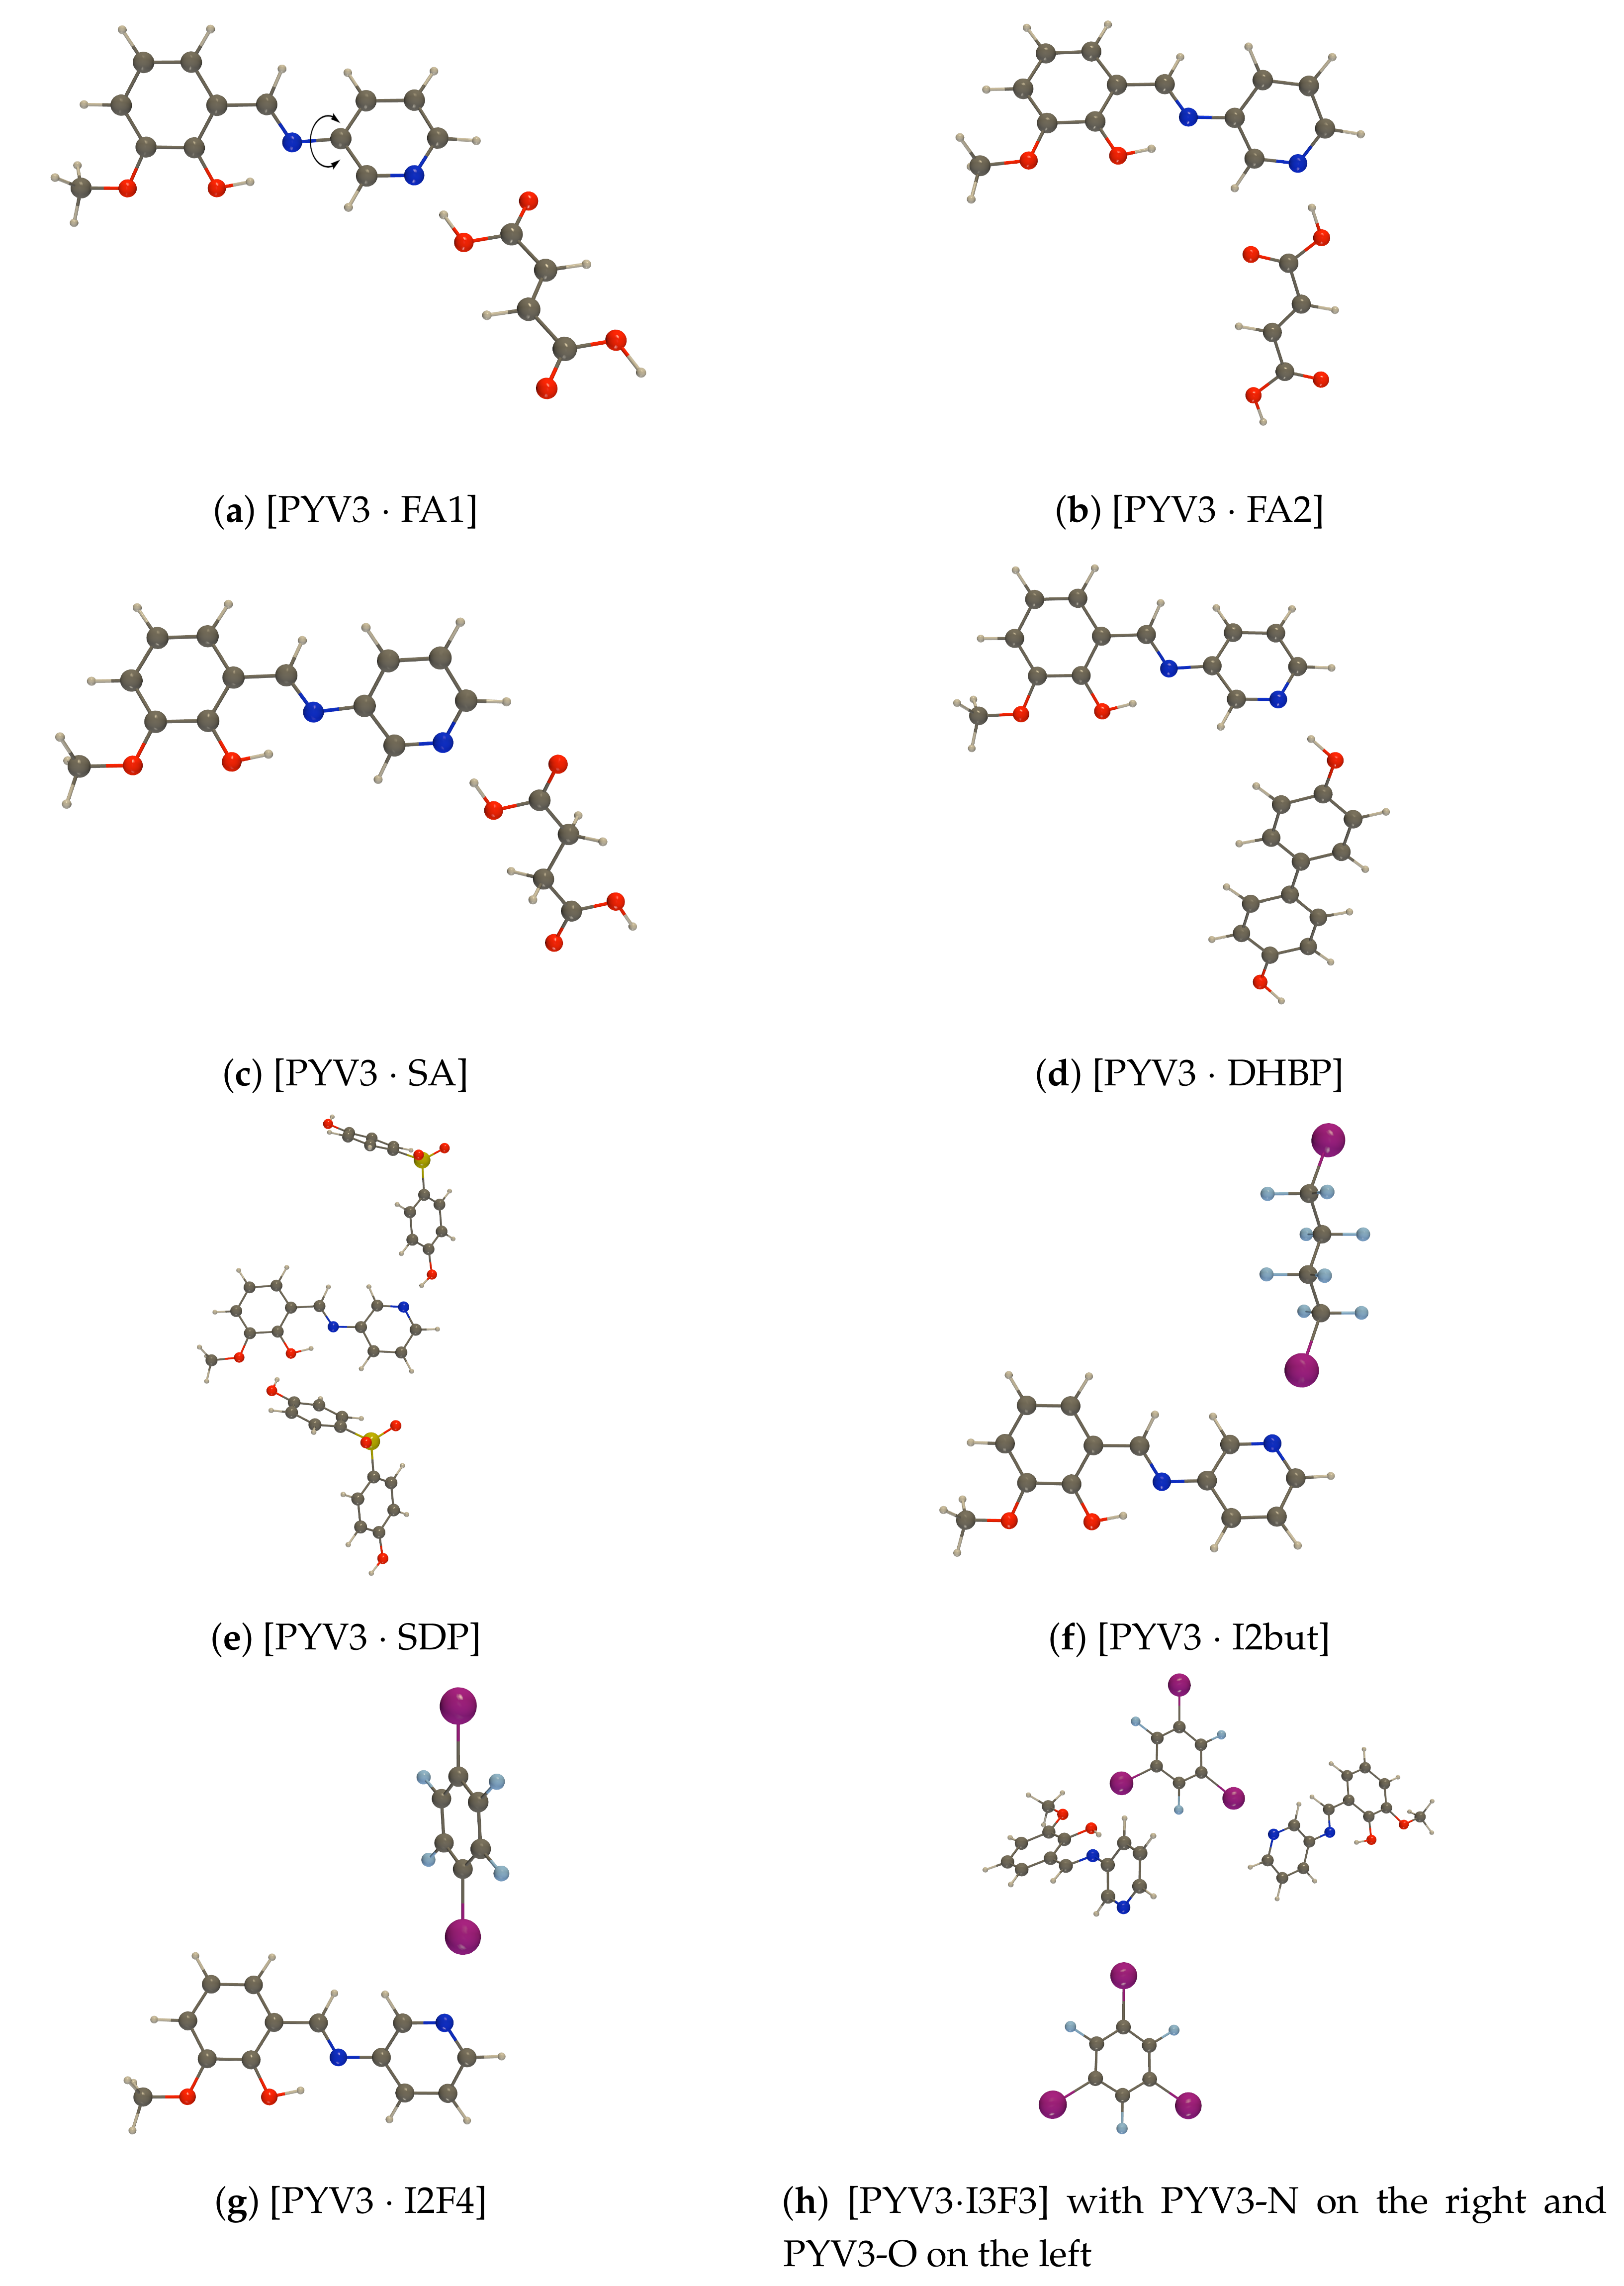
| PYV3 | PYV3 (29) | 4971 (44 Å) | 4 PYV3 | 16 × 10 × 4 | 74,240 |
| PYV3 SA | PYV3 + SA (43) | 9957 (56 Å) | 4 PYV3 + 2 SA | 20 × 4 × 10 | 115,200 |
| PYV3 FA1 | PYV3 + FA (41) | 9959 (56 Å) | 4 PYV3 + 2 FA | 20 × 4 × 10 | 112,000 |
Table A2.
Ahlrichs basis sets and their contracted compositions for the atoms in PYV3 I2but.
Table A2.
Ahlrichs basis sets and their contracted compositions for the atoms in PYV3 I2but.
| Basis Set | Composition | |
|---|
| def2-SVP | C, N, O, F | 3s 2p 1d |
| | I | 4s 4p 2d |
| | H | 2s 1p |
| def2-SVPD | C, N | 4s 2p 2d |
| | O, F | 4s 3p 2d |
| | I | 5s 5p 3d |
| | H | 2s 2p |
| def2-TZVP | C, N, O, F | 5s 3p 2d 1f |
| | I | 6s 5p 3d 2f |
| | H | 3s 1p |
| def2-TZVPP | C, N, O, F, I | def2-TZVP |
| | H | 3s 2p 1d |
| def2-TZVPD | C, N | 6s 3p 3d 1f |
| | O, F | 6s 4p 3d 1f |
| | I | 7s 6p 4d 2f |
| | H | 3s 2p |
| def2-TZVPPD | C, N, O, F, I | def2-TZVPD |
| | H | 3s 3p 1d |
| def2-QZVP | C, N, O, F | 7s 4p 3d 2f 1g |
| | I | 7s 6p 4d 4f 1g |
| | H | 4s 3p 2d 1f |
Table A3.
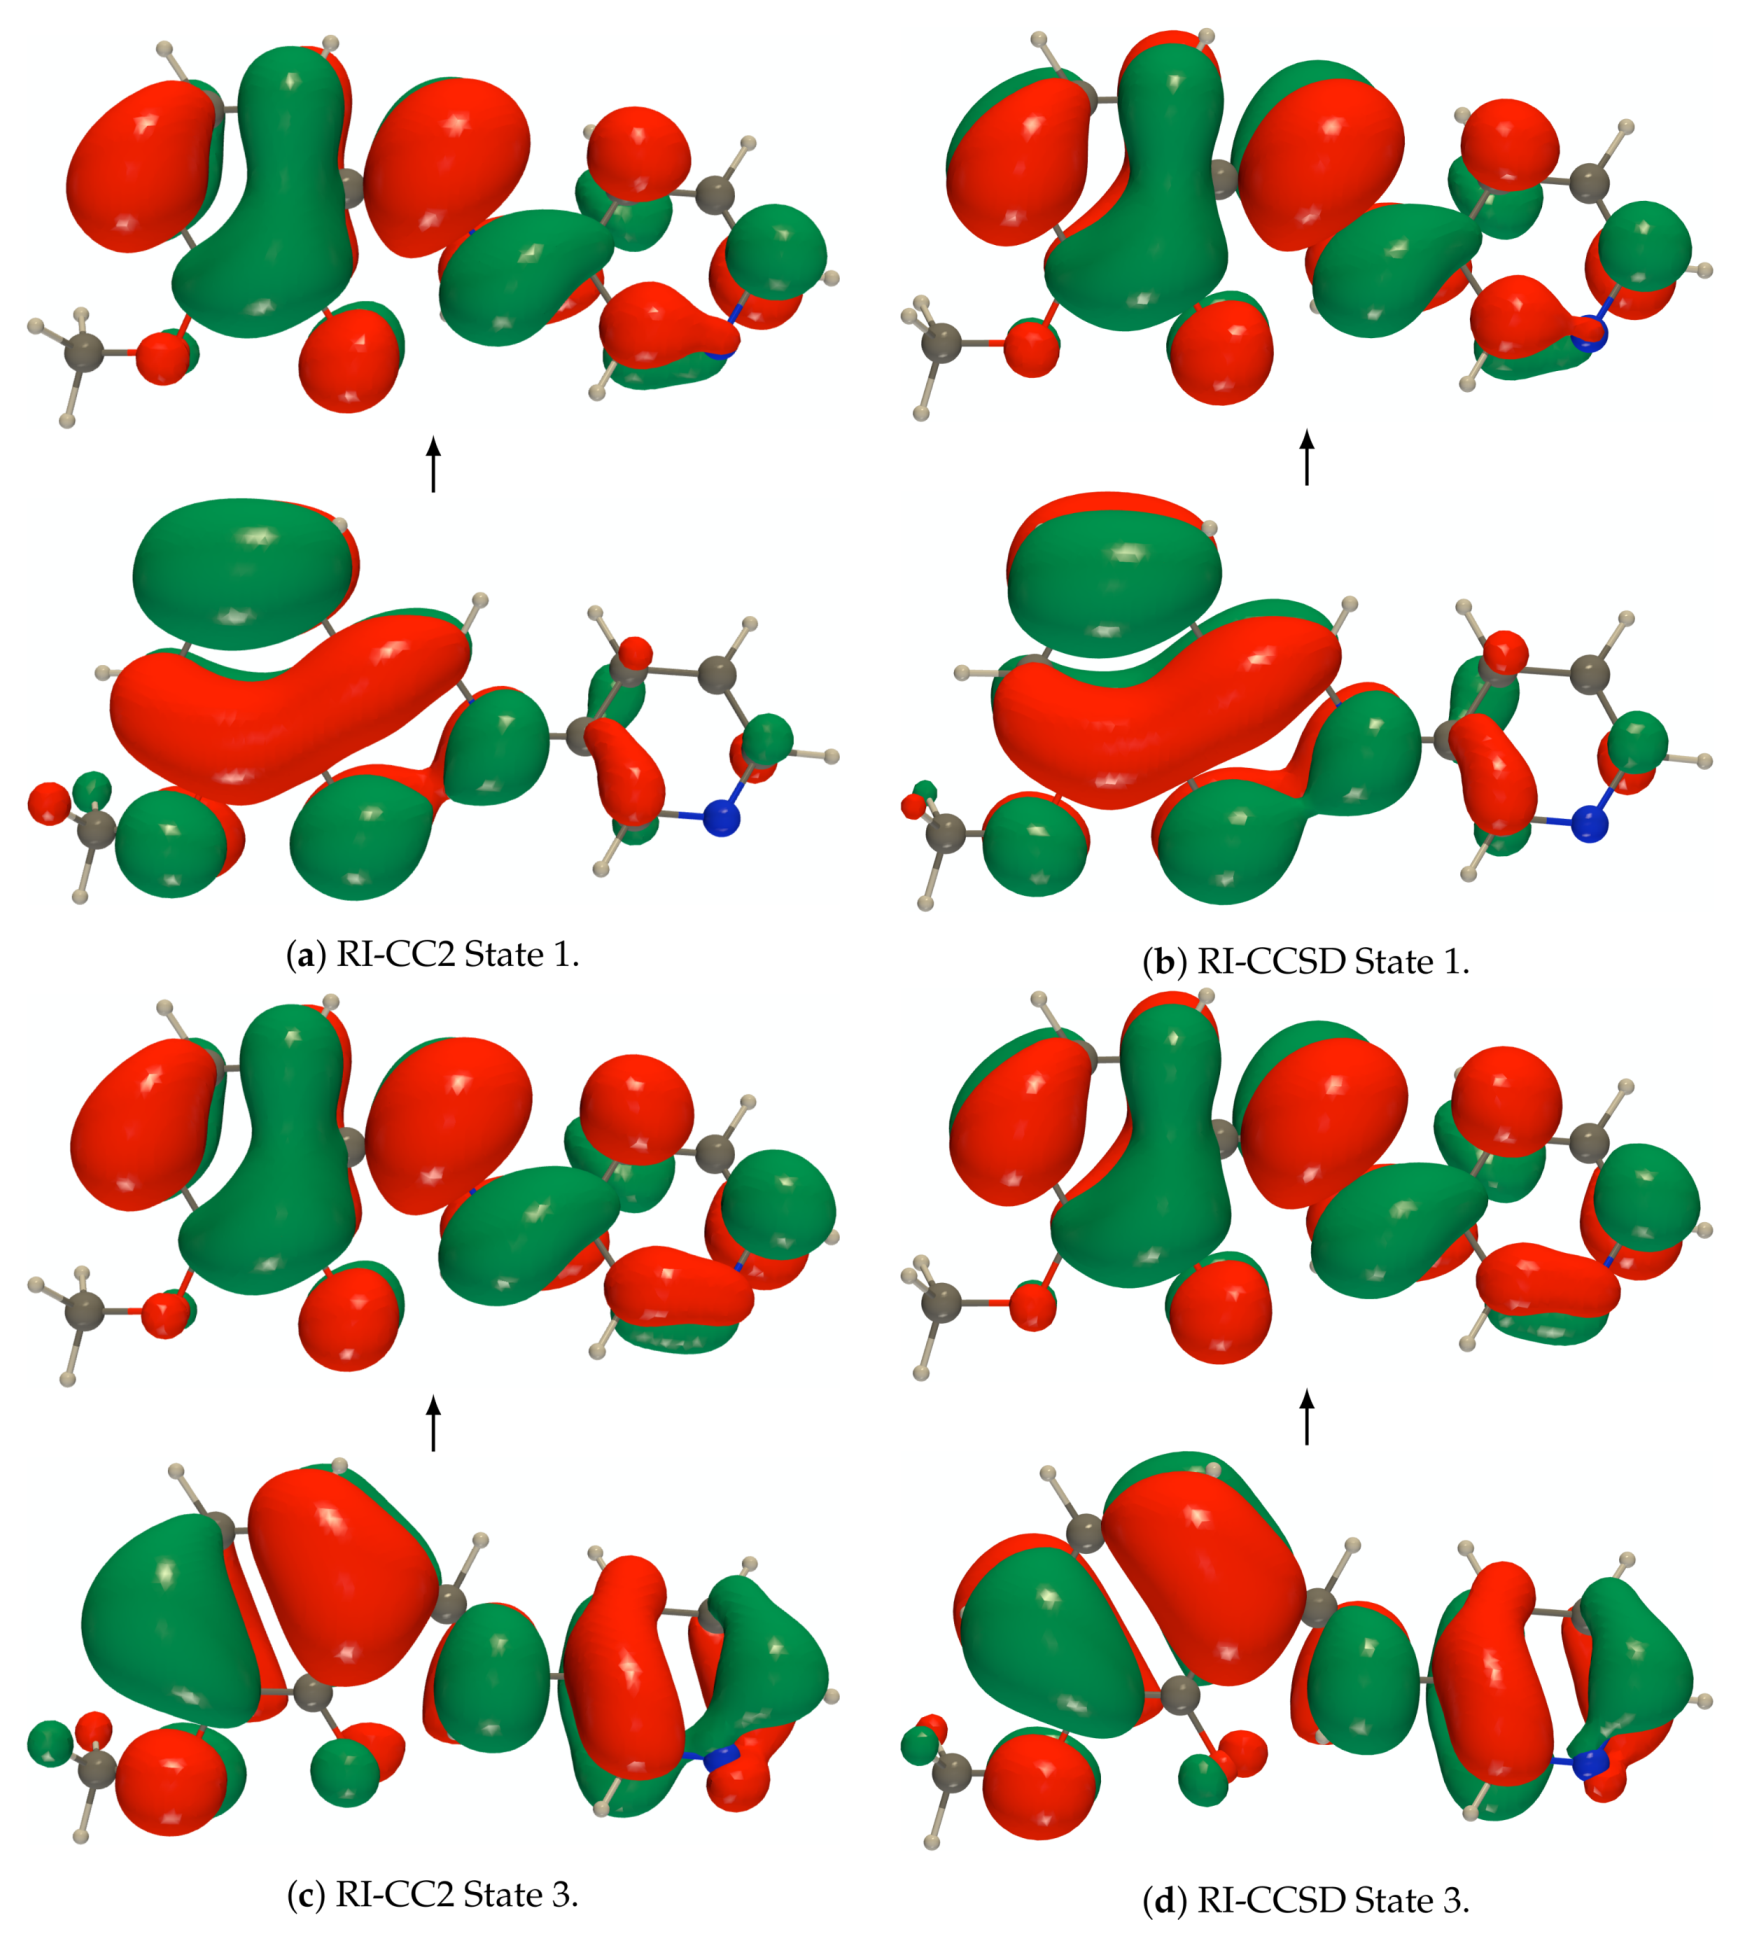
Contributions of the and clusters to the RI-CC2 and RI-CCSD excited states of the enol and keto forms of the isolated PYV3 [PYV3] molecule (in %), as calculated with the def2-TZVPD basis set.
Table A3.
Contributions of the and clusters to the RI-CC2 and RI-CCSD excited states of the enol and keto forms of the isolated PYV3 [PYV3] molecule (in %), as calculated with the def2-TZVPD basis set.
| | Enol |
|---|
| | RI-CC2 | RI-CCSD |
|---|
| State | | | | |
|---|
| 1 | 87.14 | 12.86 | 92.17 | 7.83 |
| 2 | 88.96 | 11.04 | 92.98 | 7.02 |
| 3 | 87.64 | 12.36 | 92.93 | 7.07 |
| 4 | 87.62 | 12.38 | 91.56 | 8.44 |
| 5 | 88.84 | 11.16 | 92.94 | 7.06 |
| | Keto |
| 1 | 87.38 | 12.62 | 91.79 | 8.21 |
| 2 | 85.49 | 14.51 | 92.31 | 7.69 |
| 3 | 87.62 | 12.38 | 92.42 | 7.58 |
| 4 | 86.55 | 13.45 | 91.78 | 8.22 |
| 5 | 89.25 | 10.75 | 94.45 | 5.55 |
Table A4.
RI-CC2/def2-TZVPD wavelengths of excitation, in , and oscillator strengths, f, for the enol PYV3 molecule in its crystal (PYV3 [PYV3]) and its co-crystals (PYV3 [PYV3 XXX]). For PYV3 [PYV3], the absolute values are given while for the co-crystals, the absolute variations and relative variations are given for the wavelengths and oscillator strengths, respectively.
| | 2nd Absorption Band |
|---|
| | 2nd Excitation | | 3rd Excitation |
|---|
| Crystal | | f | | | f |
|---|
| PYV3 [PYV3] | 293 | 0.466 | | 273 | 0.144 |
| PYV3 [PYV3 SA] | −3 | +10% | | +3 | −75% |
| PYV3 [PYV3 FA1] | −2 | +11% | | +4 | −73% |
| PYV3 [PYV3 FA2] | +2 | −24% | | +2 | +13% |
| PYV3 [PYV3 DHBP] | −1 | +8% | | +4 | −45% |
| PYV3 [PYV3 SDP] | −2 | +54% | | — |
| PYV3 [PYV3 I2but] | +8 | −75% | | +9 | +301% |
| PYV3 [PYV3 I2F4] | +11 | −72% | | +10 | +287% |
| PYV3-N [PYV3 I3F3] | −4 | −89% | | 0 | +356% |
| PYV3-O [PYV3 I3F3] | −11 | −75% | | −8 | +267% |
Table A5.
RI-CC2/def2-TZVPD wavelengths of excitation, in , and oscillator strengths, f, for the keto PYV3 molecule in its crystal (PYV3 [PYV3]) and its co-crystals (PYV3 [PYV3 XXX]). For PYV3 [PYV3], the absolute values are given while for the co-crystals, the absolute variations and relative variations are given for the wavelengths and oscillator strengths, respectively.
| | 2nd Absorption Band |
|---|
| | 3rd Excitation |
|---|
| | | |
| PYV3 [PYV3] | 304 | 0.476 |
| PYV3 [PYV3 SA] | −3 | −3% |
| PYV3 [PYV3 FA1] | −2 | −2% |
| PYV3 [PYV3 FA2] | 0 | 0% |
| PYV3 [PYV3 DHBP] | 0 | 0% |
| PYV3 [PYV3 SDP] | +6 | +4% |
| PYV3 [PYV3 I2but] | +4 | +1% |
| PYV3 [PYV3 I2F4] | +3 | +1% |
| PYV3-N [PYV3 I3F3] | 0 | +1% |
| PYV3-O [PYV3 I3F3] | −11 | −3% |
Table A6.
RI-CC2/def2-TZVPD wavelengths of excitation, in , and oscillator strengths, f, for the enol forms of isolated PYV3 (PYV3 [PYV3]) and the heteromers of its co-crystals (PYV3 + XXX [PYV3 XXX]). For PYV3 [PYV3], the absolute values are given while for the co-crystals, the absolute variations and relative variations are given for the wavelengths and oscillator strengths, respectively.
| | 2nd Absorption Band |
|---|
| | 2nd Excitation | | 3rd Excitation |
|---|
| Crystal | | f | | | f |
|---|
| PYV3 [PYV3] | 293 | 0.466 | | 273 | 0.144 |
| PYV3 + SA [PYV3 SA] | −3 | +30% | | −6 | −8% |
| PYV3 + FA [PYV3 FA1] a | −2 | +33% | | −6 | −12% |
Table A7.
RI-CC2/def2-TZVPD wavelengths of excitation, in , and oscillator strengths, f, for the keto forms of isolated PYV3 (PYV3 [PYV3]) and the heteromers of its co-crystals (PYV3 + XXX [PYV3 XXX]). For PYV3 [PYV3], the absolute values are given while for the co-crystals, the absolute variations and relative variations are given for the wavelengths and oscillator strengths, respectively.
| | 2nd Absorption Band |
|---|
| | 3rd Excitation |
|---|
| Crystal | | f |
|---|
| PYV3 [PYV3] | 304 | 0.476 |
| PYV3 + SA [PYV3 SA] | 0 | 0% |
| PYV3 + FA [PYV3 FA1] | 0 | 0% |
Table A8.
RI-CC2/def2-TZVPD wavelengths of excitation ( in ) and oscillator strengths (f) for the enol forms of the isolated and embedded PYV3 (PYV3 [PYV3]) and the embedded heteromers of its co-crystals (PYV3 + XXX [PYV3 XXX]). For PYV3 [PYV3], the absolute values are given while for the co-crystals the absolute variations and relative variations with respect to the embedded PYV3 are given for the wavelengths and oscillator strengths, respectively.
| | | 2nd Absorption Band |
|---|
| | | 2nd Excitation | | 3rd Excitation |
|---|
| Crystal | | | f | | | f |
|---|
| PYV3 [PYV3] | (iso) | 293 | 0.466 | | 273 | 0.144 |
| PYV3 [PYV3] | (emb) | 287 | 0.495 | | 264 | 0.214 |
| PYV3 + SA [PYV3 SA] | (emb) | −1 | +26% | | 0 | −22% |
| PYV3 + FA [PYV3 FA1] a | (emb) | 0 | +27% | | 0 | −22% |
Table A9.
RI-CC2/def2-TZVPD wavelengths of excitation (, in ) and oscillator strengths (f) for the keto forms of the isolated and embedded PYV3 (PYV3 [PYV3]) and the embedded heteromers of its co-crystals (PYV3 + XXX [PYV3 XXX]). For PYV3 [PYV3], the absolute values are given while for the co-crystals the absolute variations and relative variations with respect to the embedded PYV3 are given for the wavelengths and oscillator strengths, respectively.
| | | 2nd Absorption Band |
|---|
| | | 3rd Excitation | | 4th Excitation |
|---|
| Crystal | | | f | | | f |
|---|
| PYV3 [PYV3] | (iso) | 304 | 0.476 | | — |
| PYV3 [PYV3] | (emb) | 299 | 0.536 | | — |
| PYV3 + SA [PYV3 SA] | (emb) | +1 | −33% | | −6 | −61% |
| PYV3 + FA [PYV3 FA1] | (emb) | +2 | −38% | | −5 | −54% |
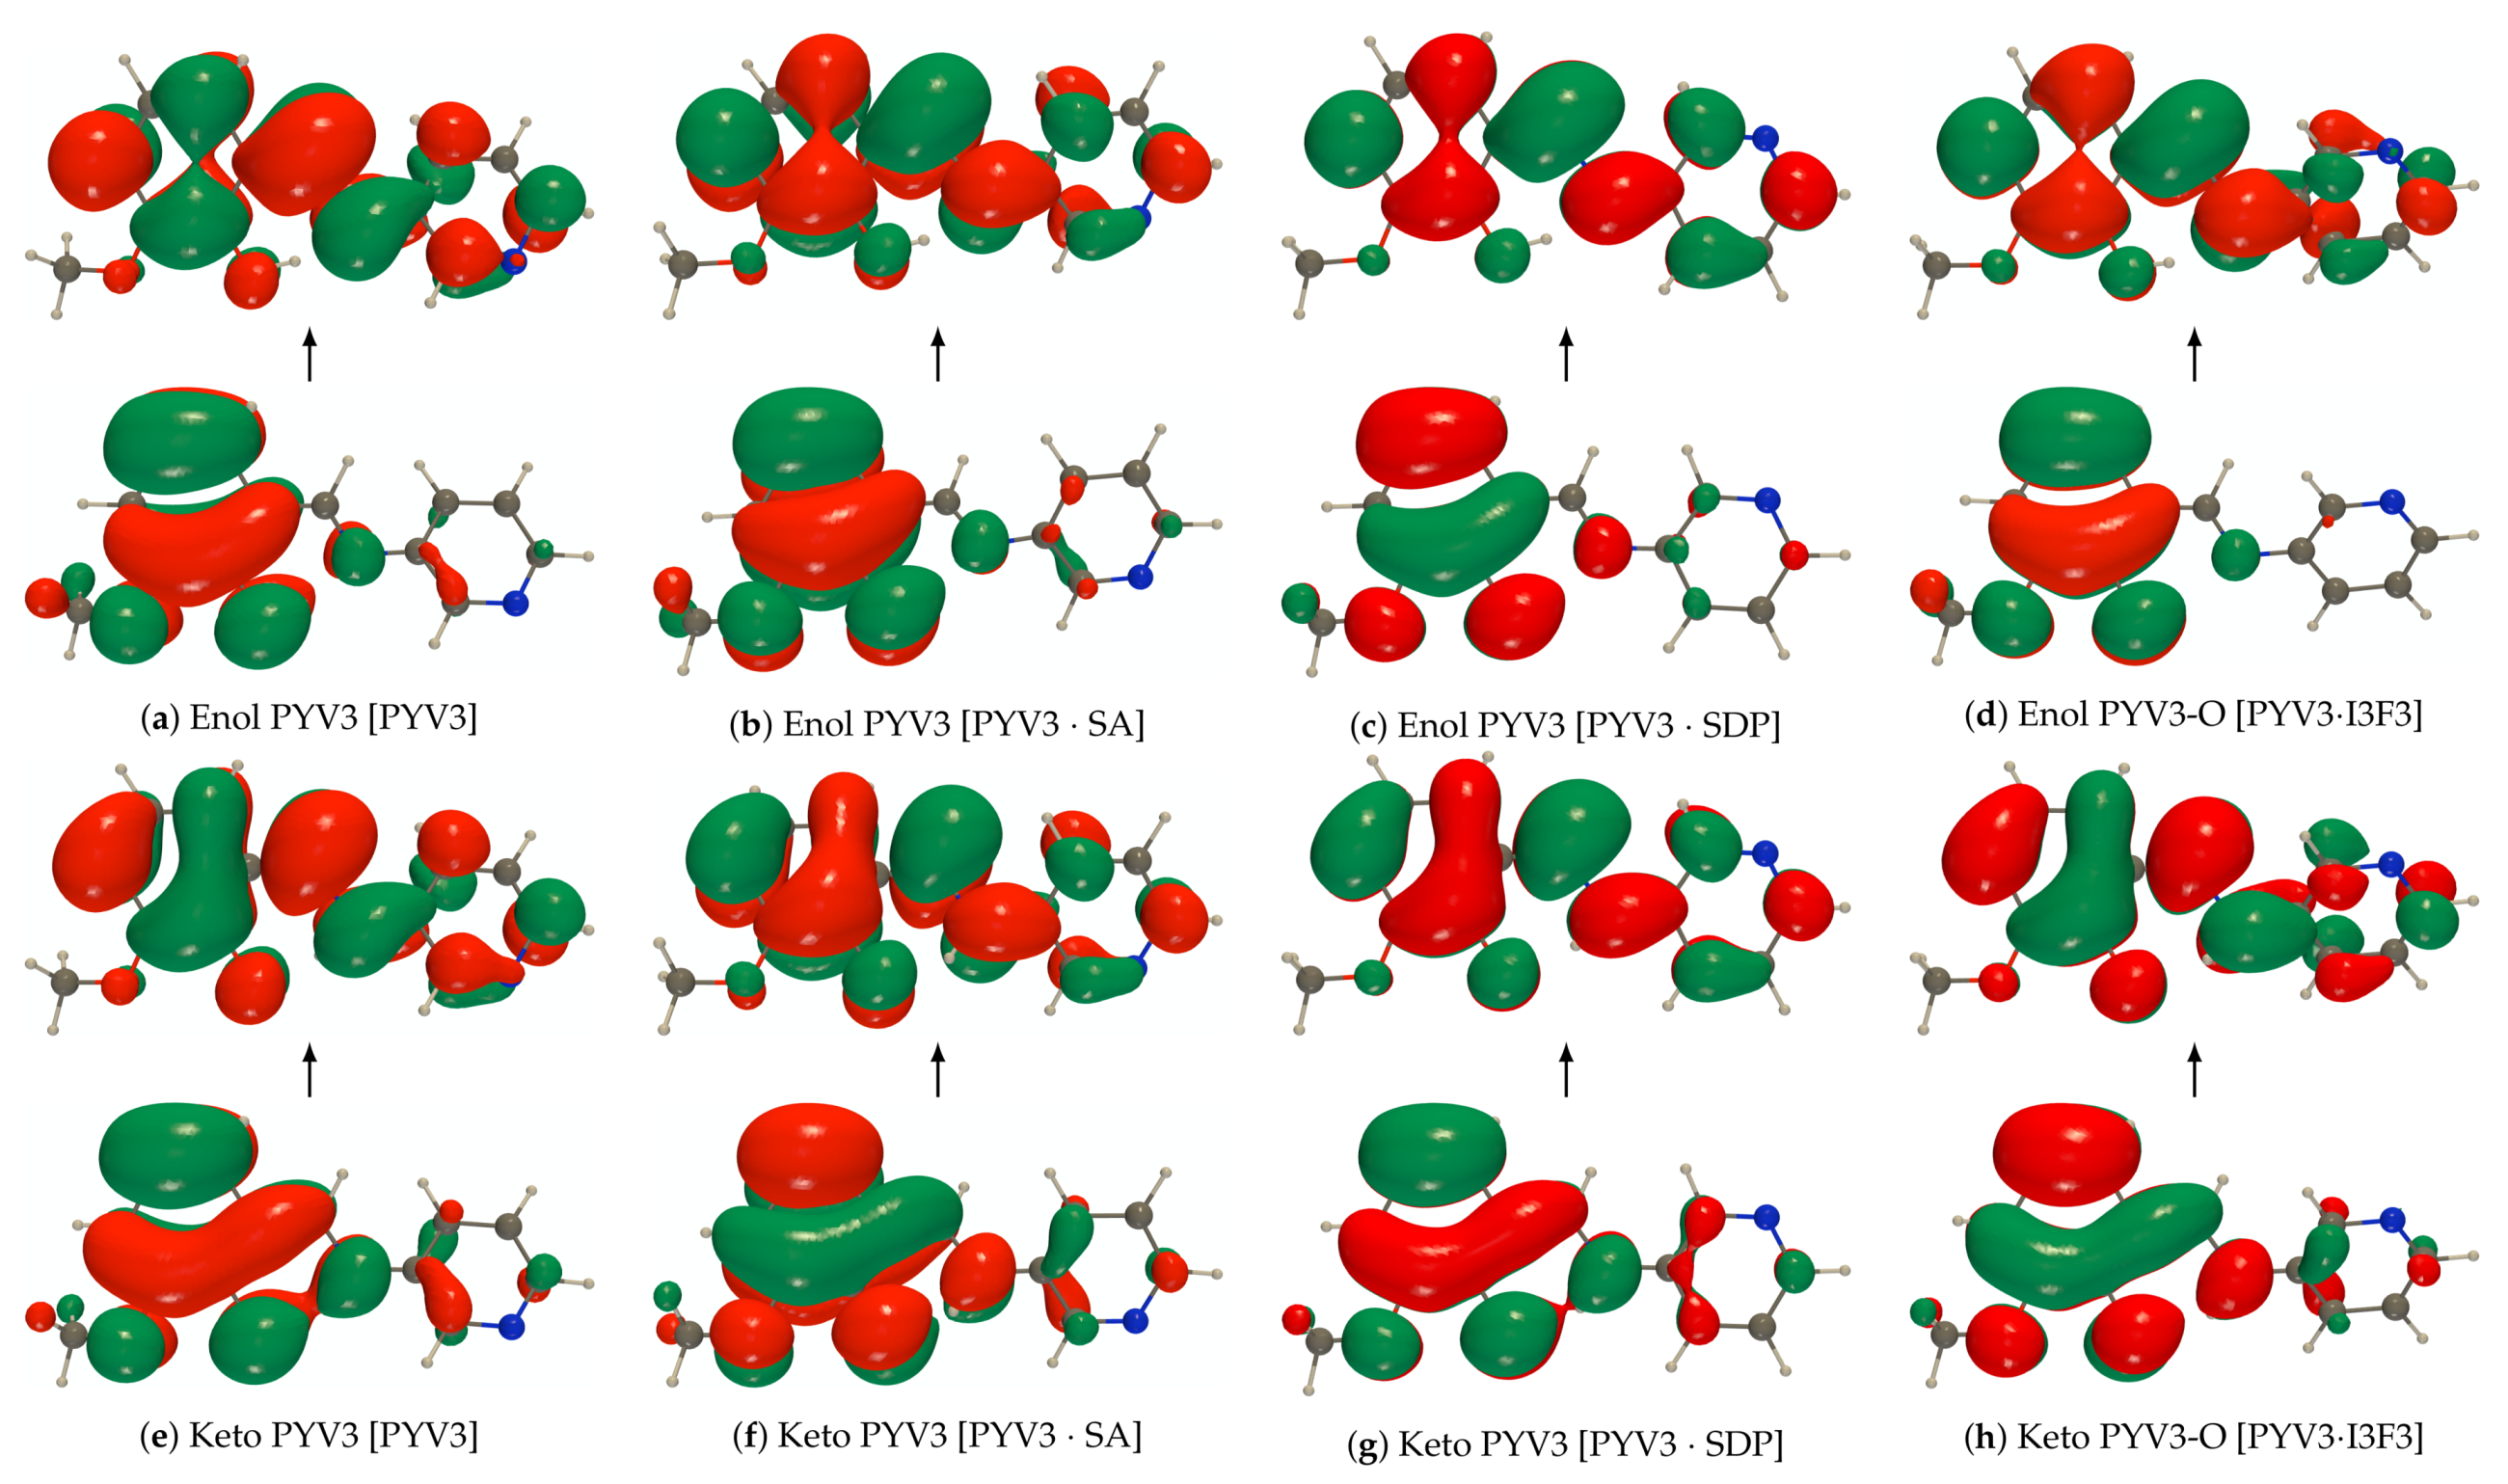
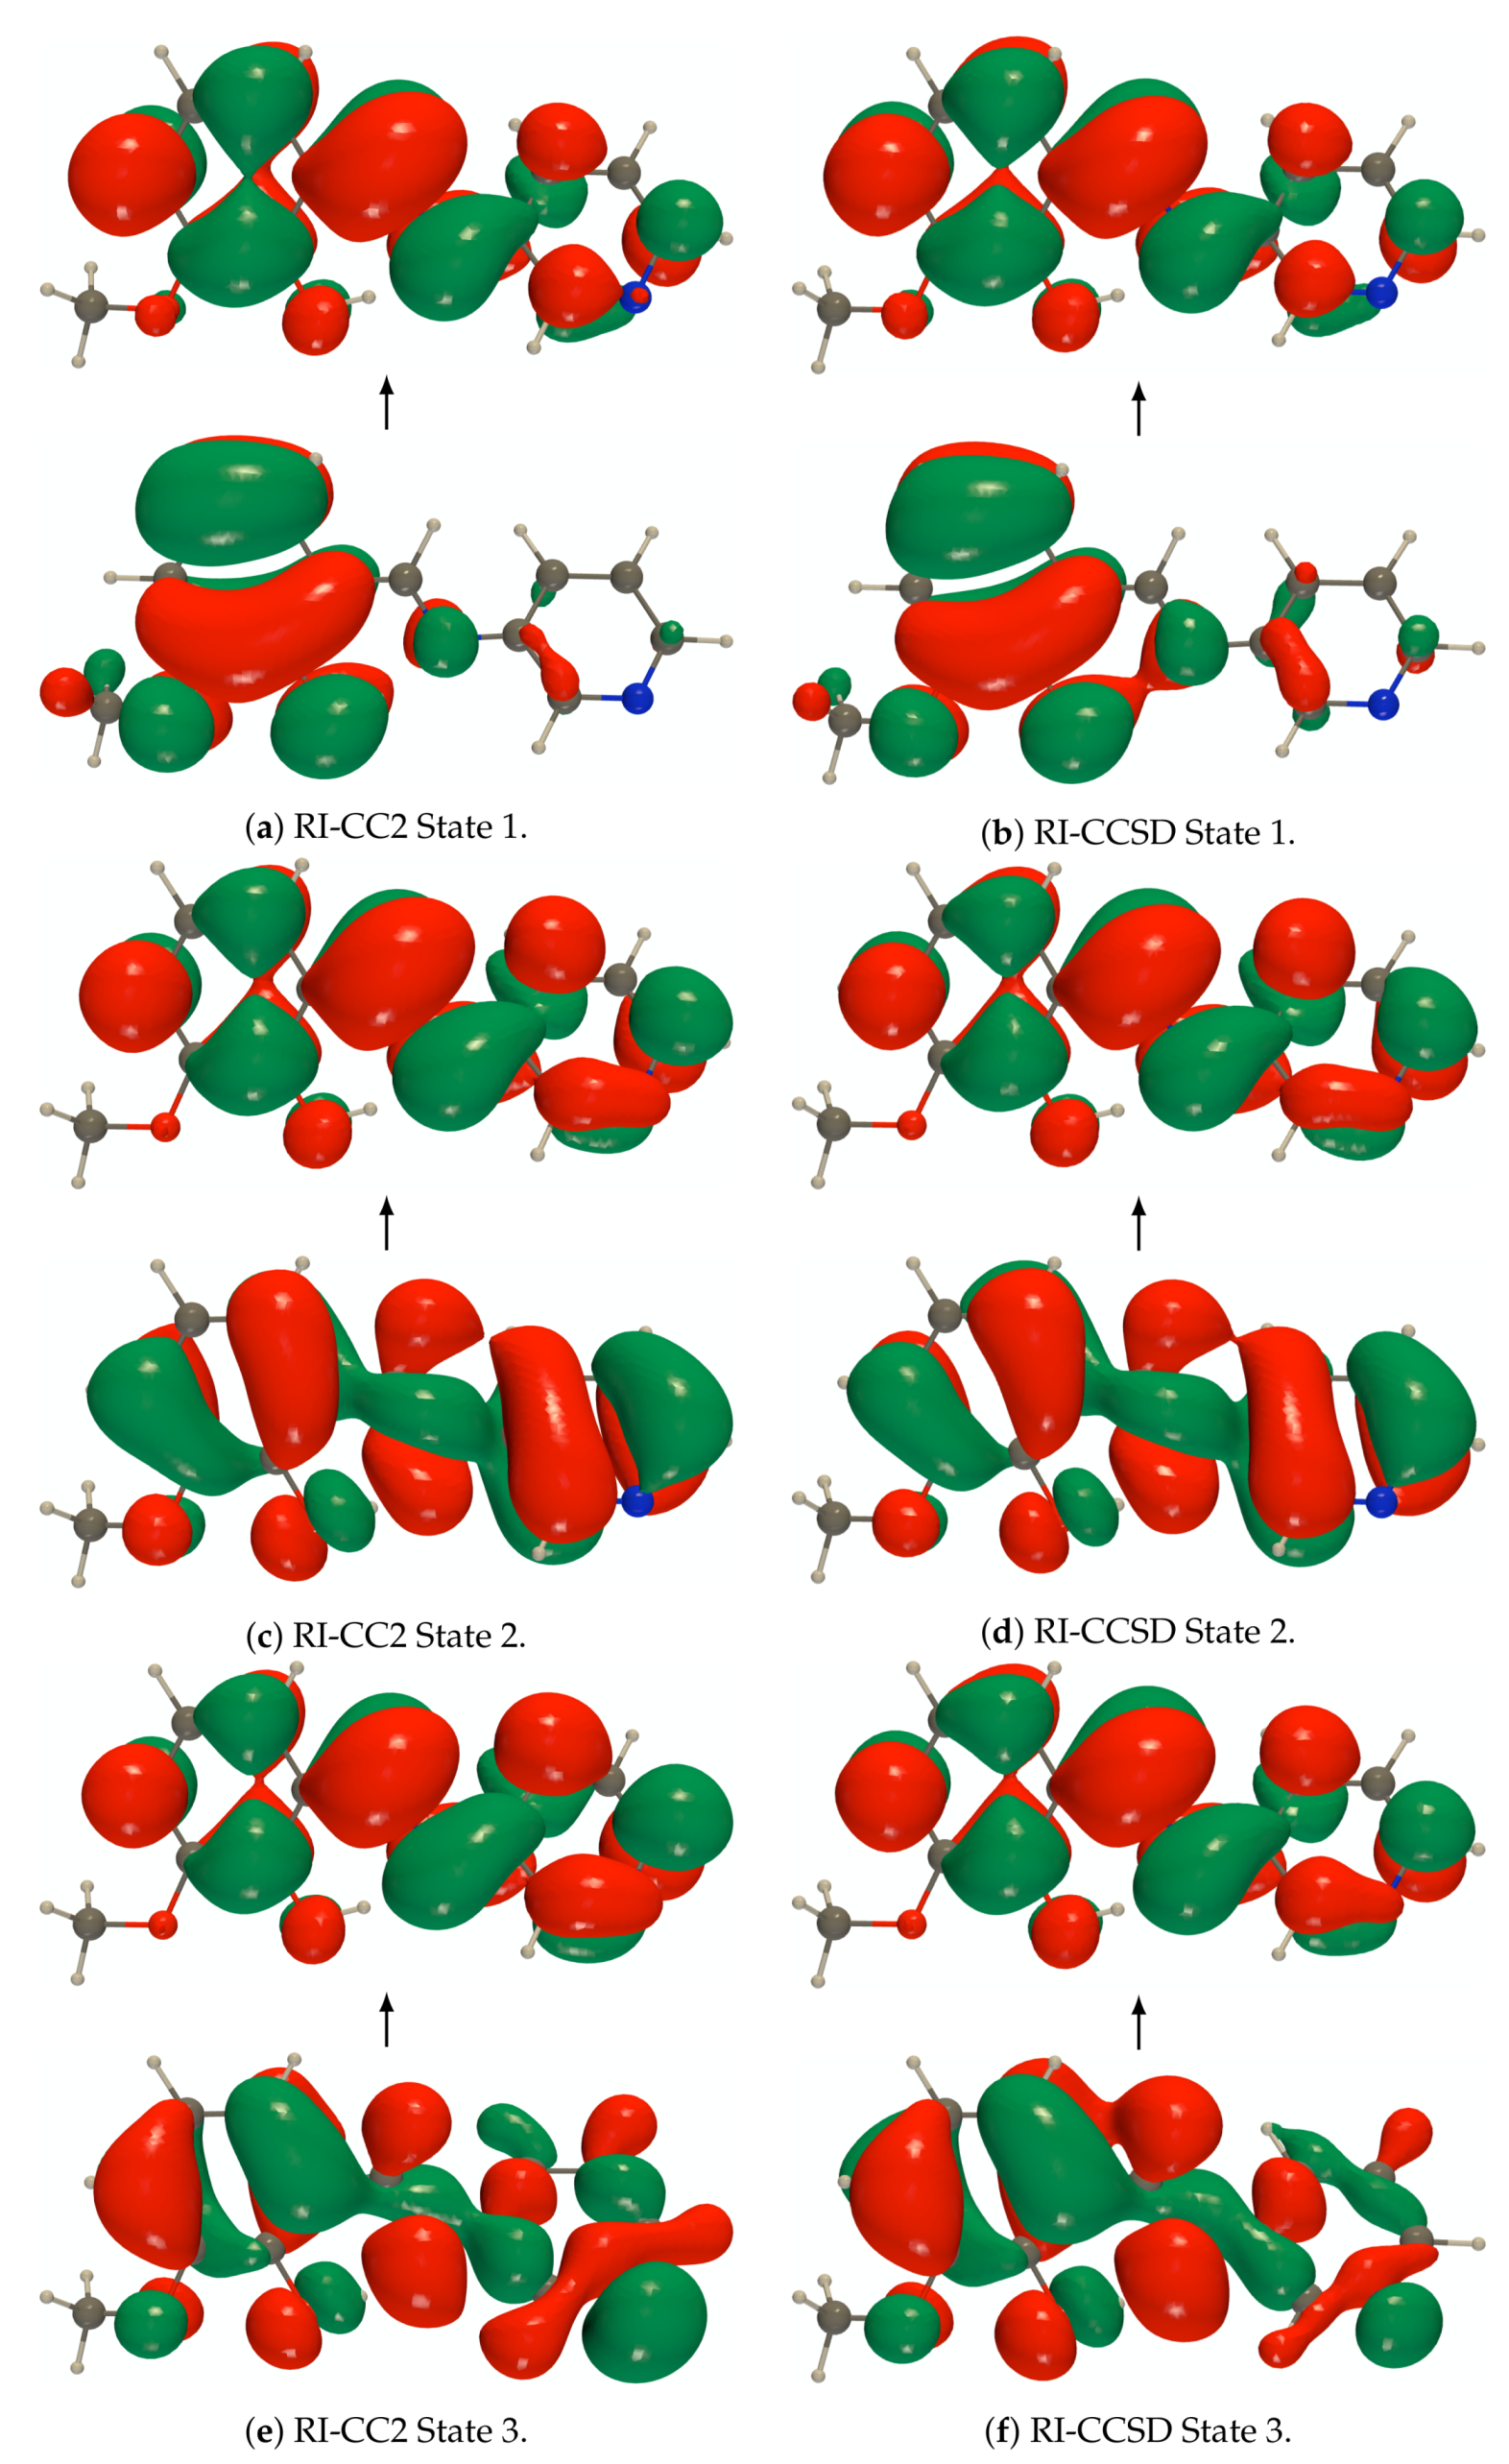
Figure A1.
def2-TZVPD NTOs (holes below the arrows and particles above them, the red (green) lobes
are the positive (negative) ones) of the isolated PYV3 [PYV3] enol form (isovalue of 0.02 a.u.).
Figure A1.
def2-TZVPD NTOs (holes below the arrows and particles above them, the red (green) lobes
are the positive (negative) ones) of the isolated PYV3 [PYV3] enol form (isovalue of 0.02 a.u.).
Figure A2.
def2-TZVPD NTOs (holes below the arrows and particles above them, the red (green) lobes
are the positive (negative) ones) of the isolated PYV3 [PYV3] keto form (isovalue of 0.02 a.u.).
Figure A2.
def2-TZVPD NTOs (holes below the arrows and particles above them, the red (green) lobes
are the positive (negative) ones) of the isolated PYV3 [PYV3] keto form (isovalue of 0.02 a.u.).
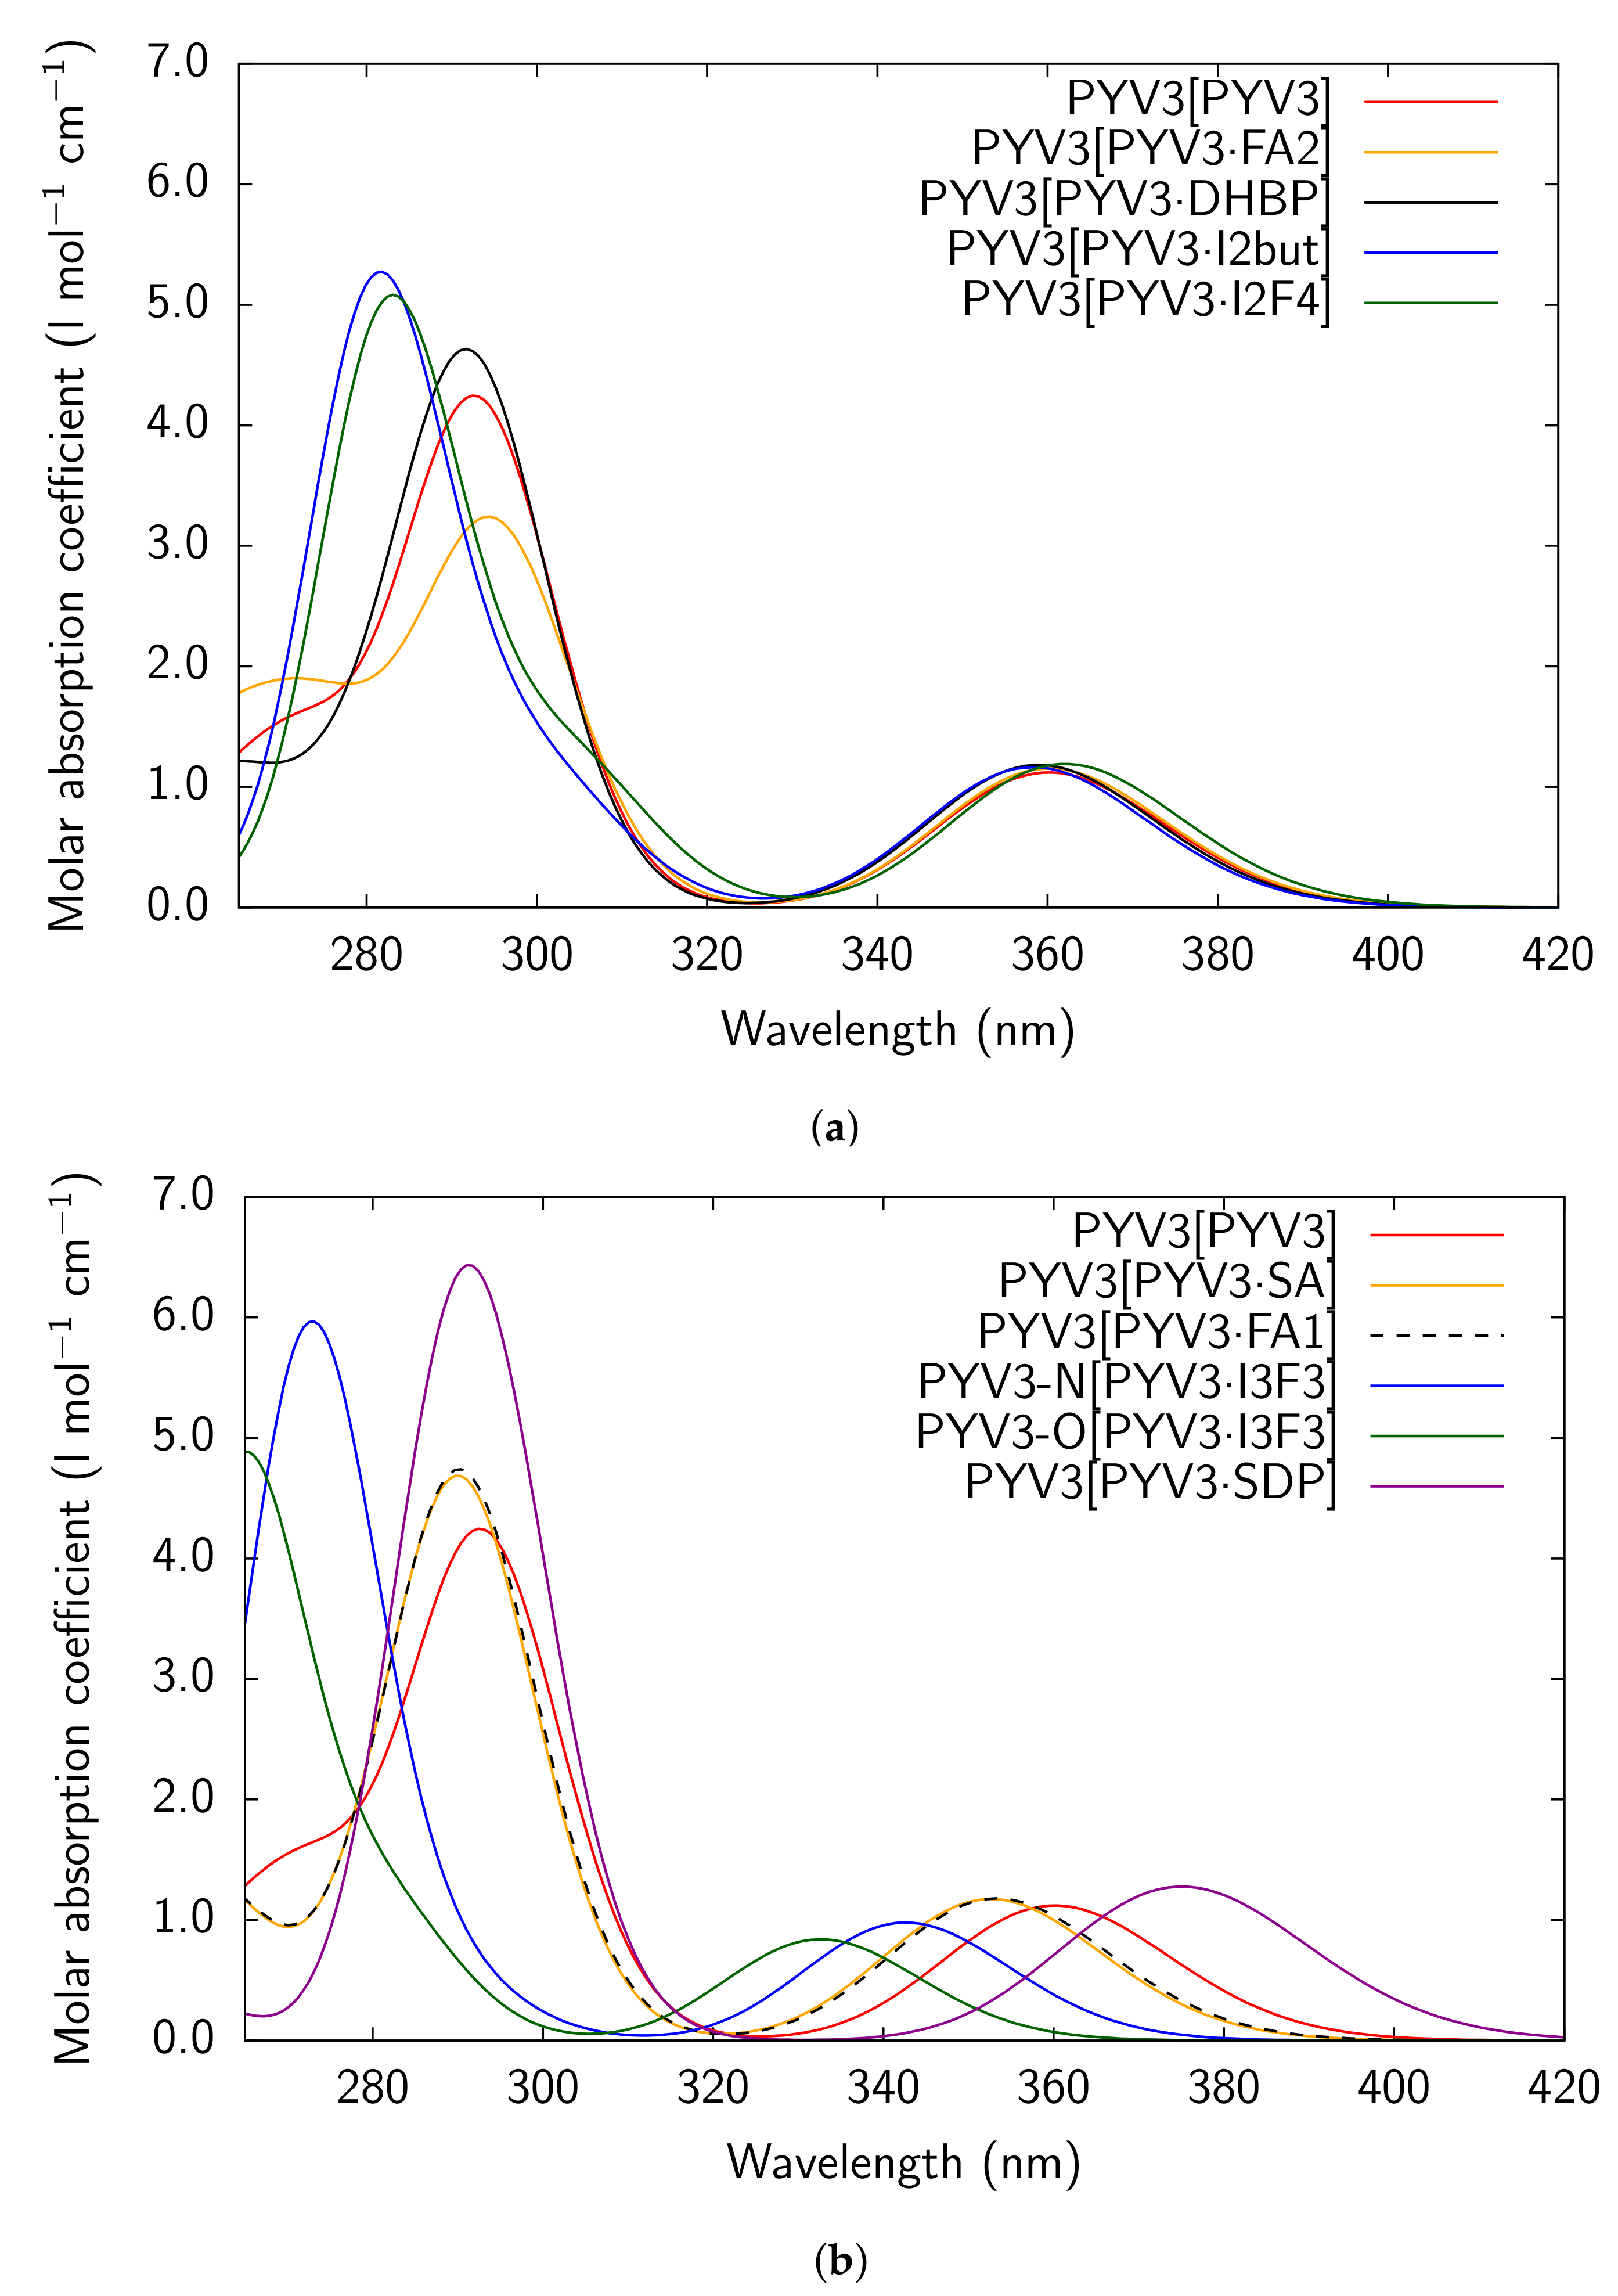
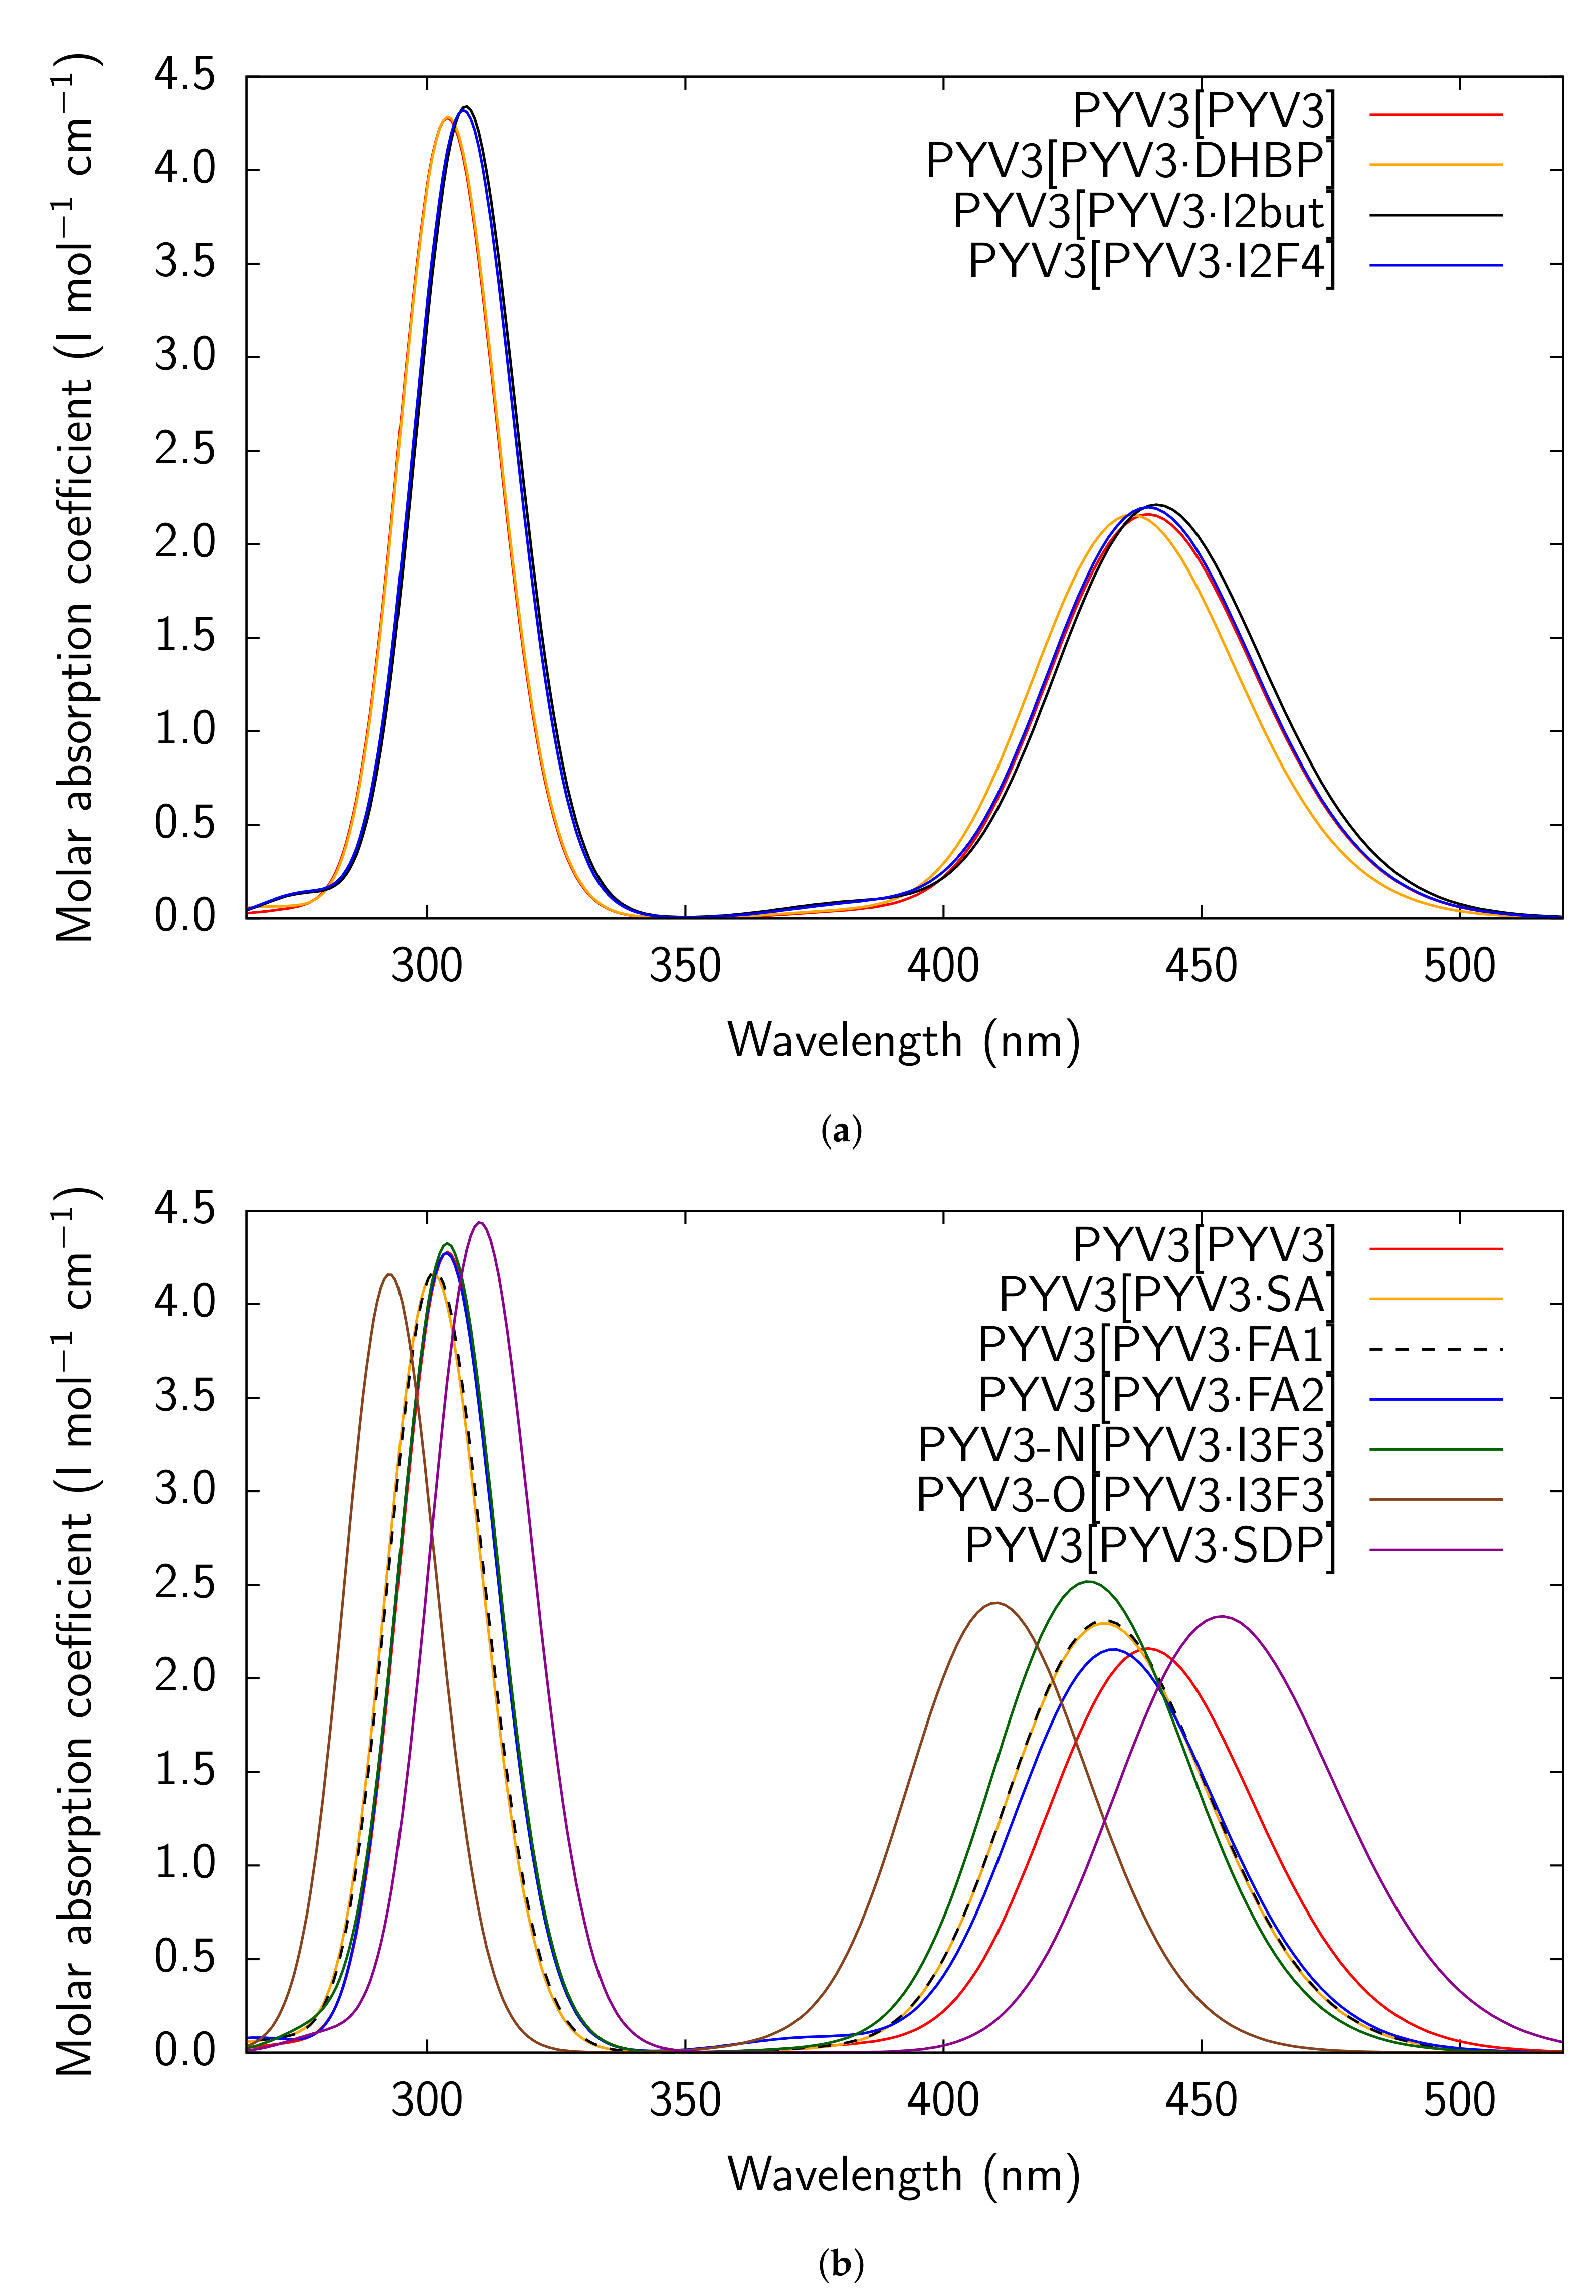
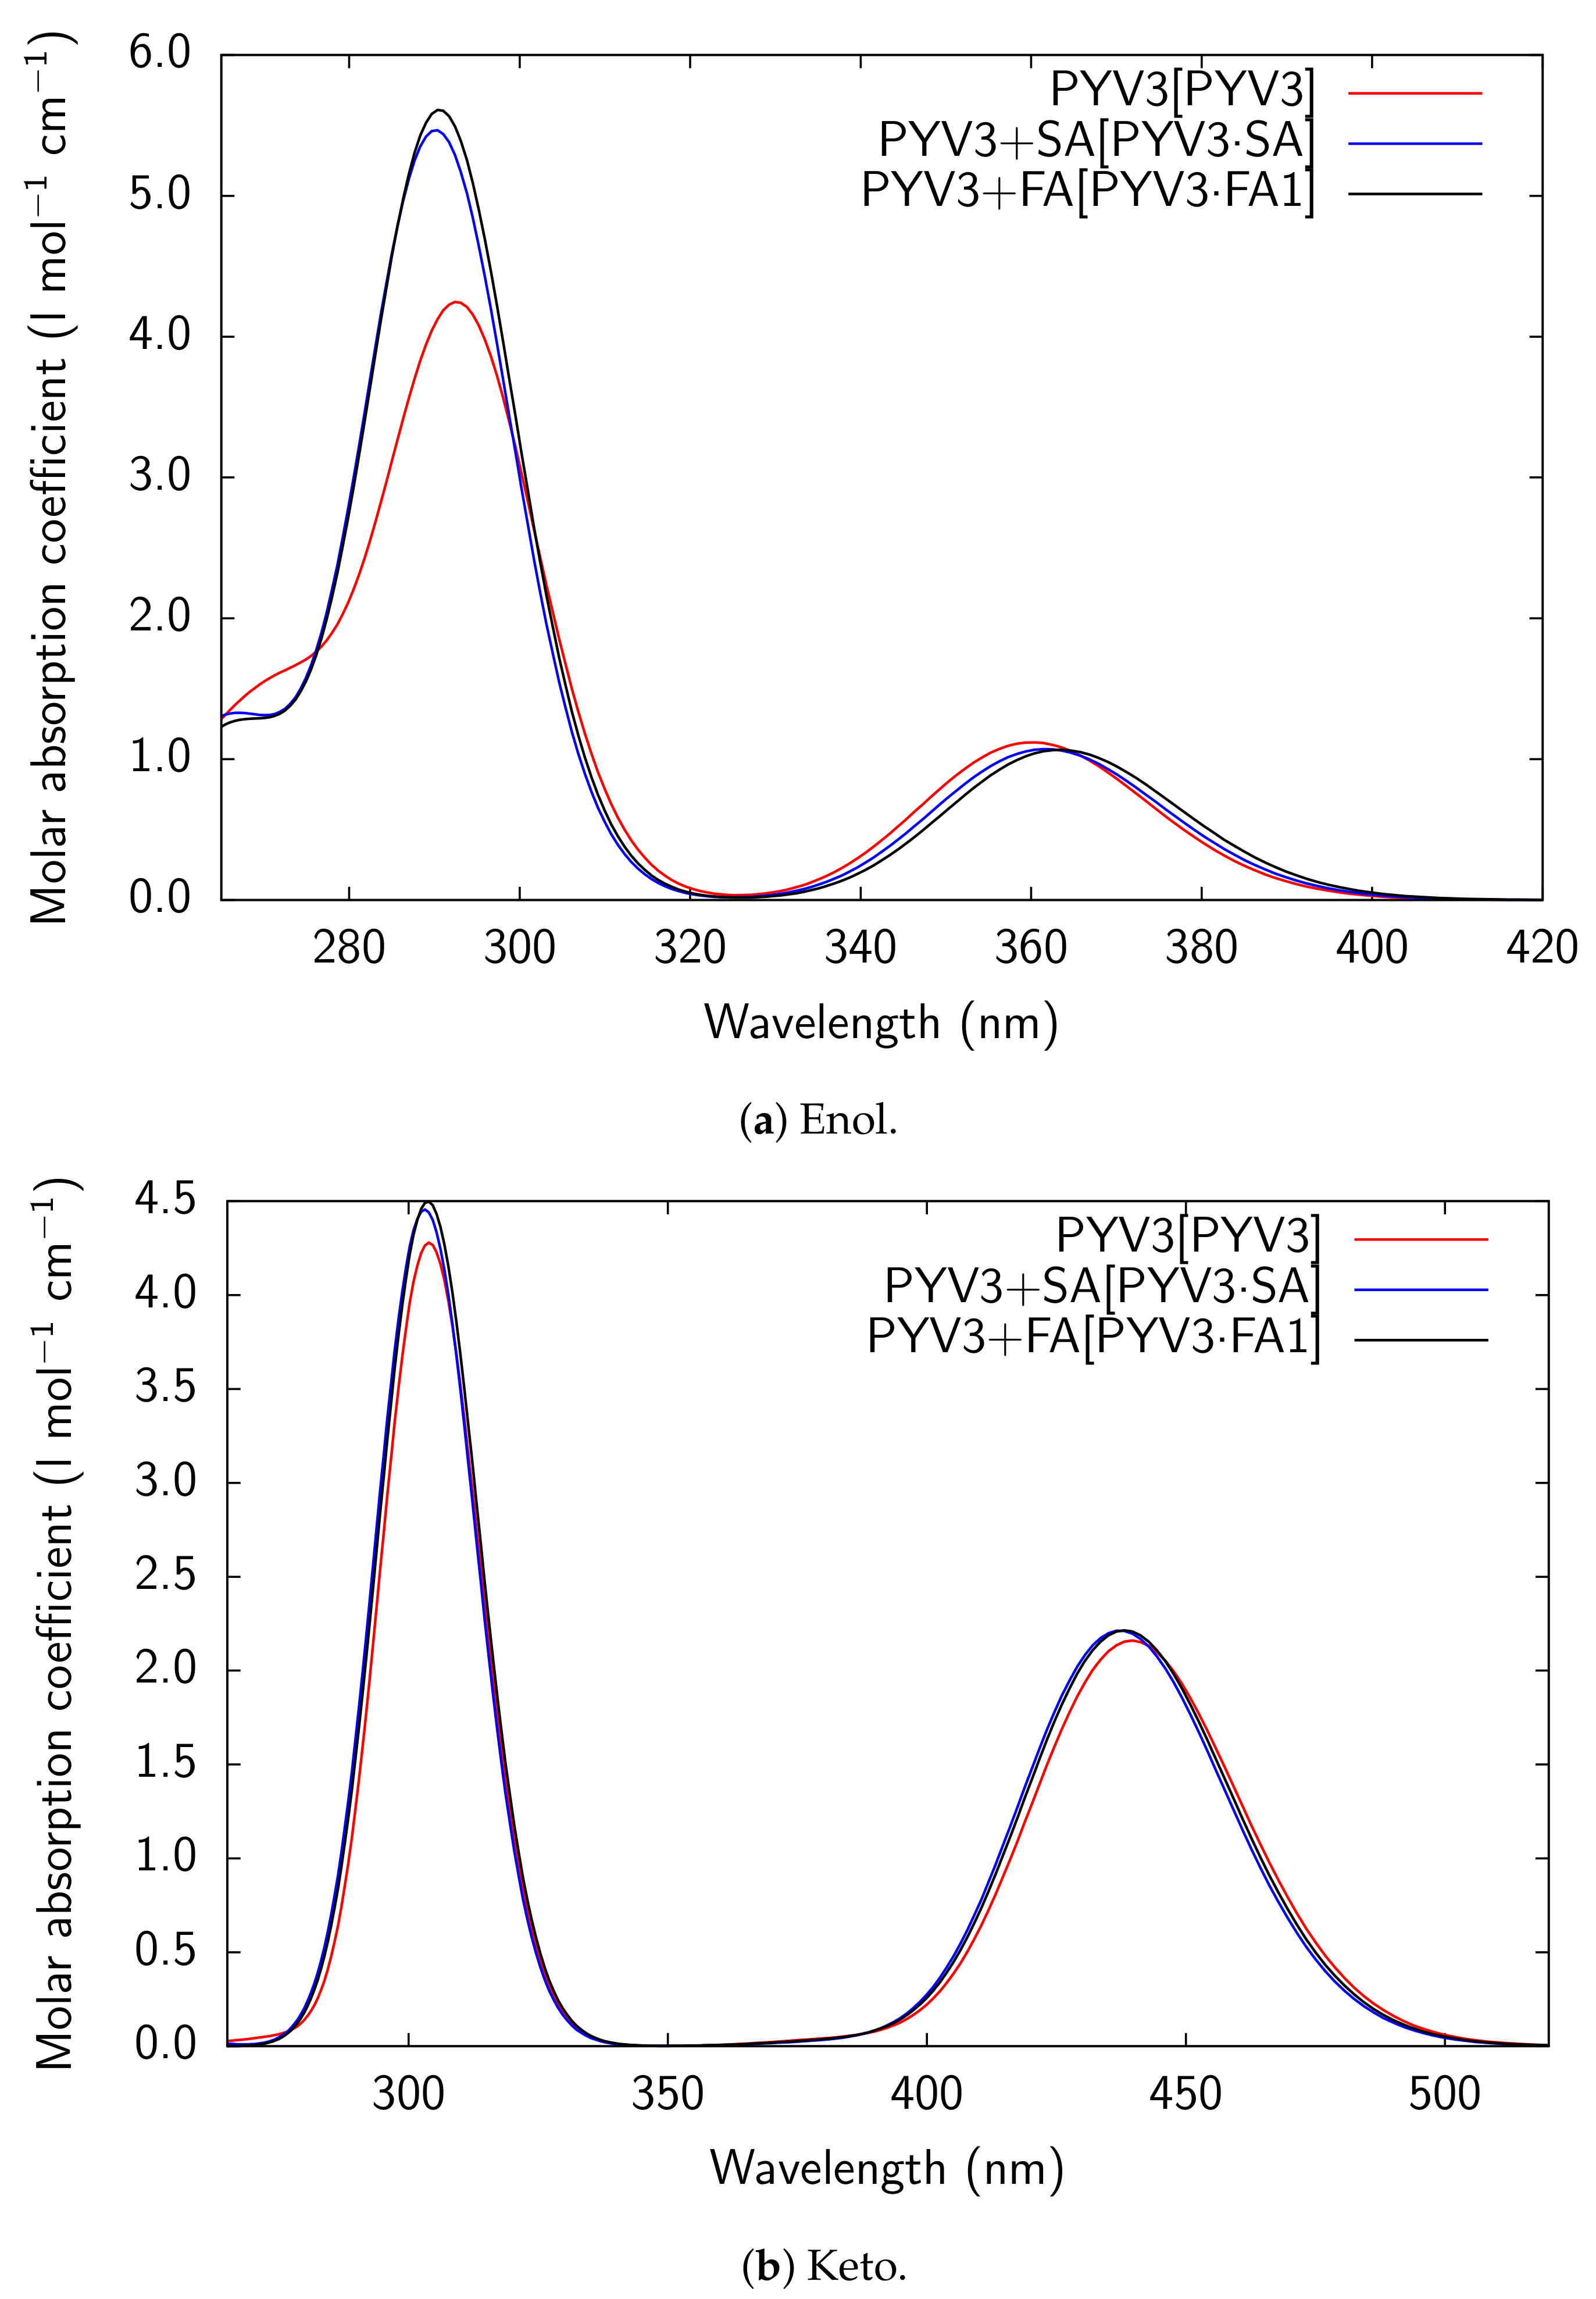
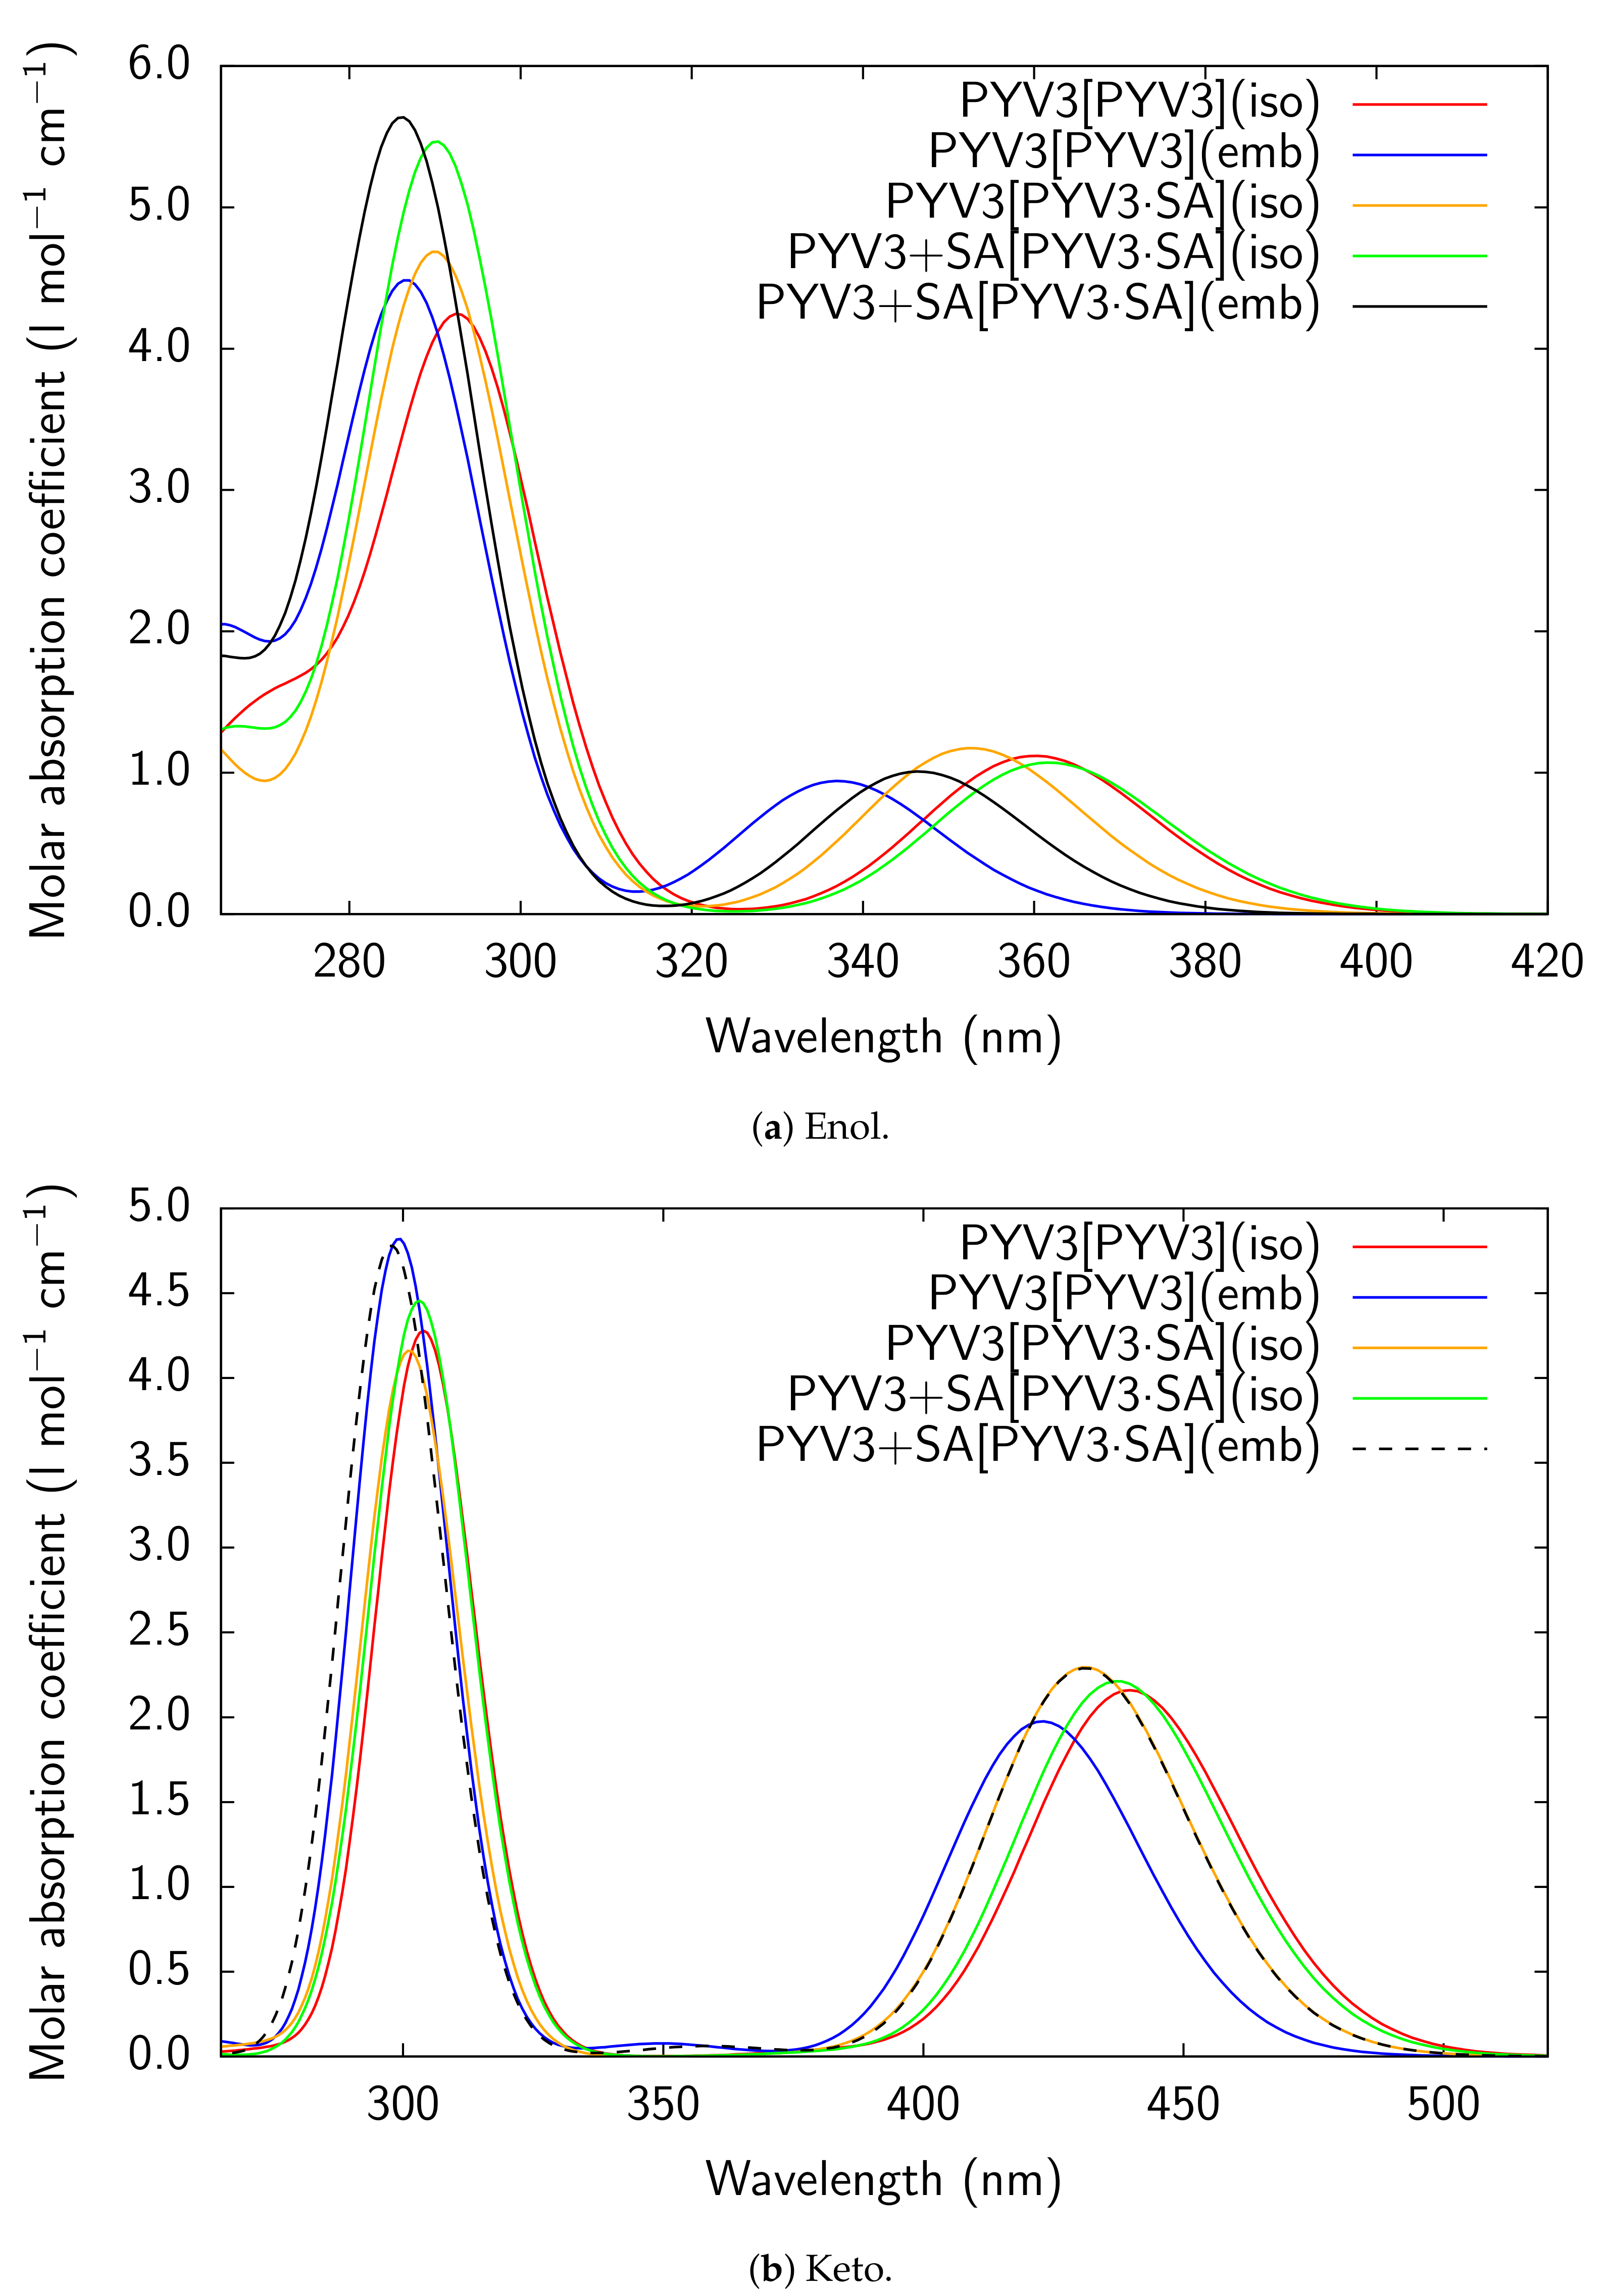
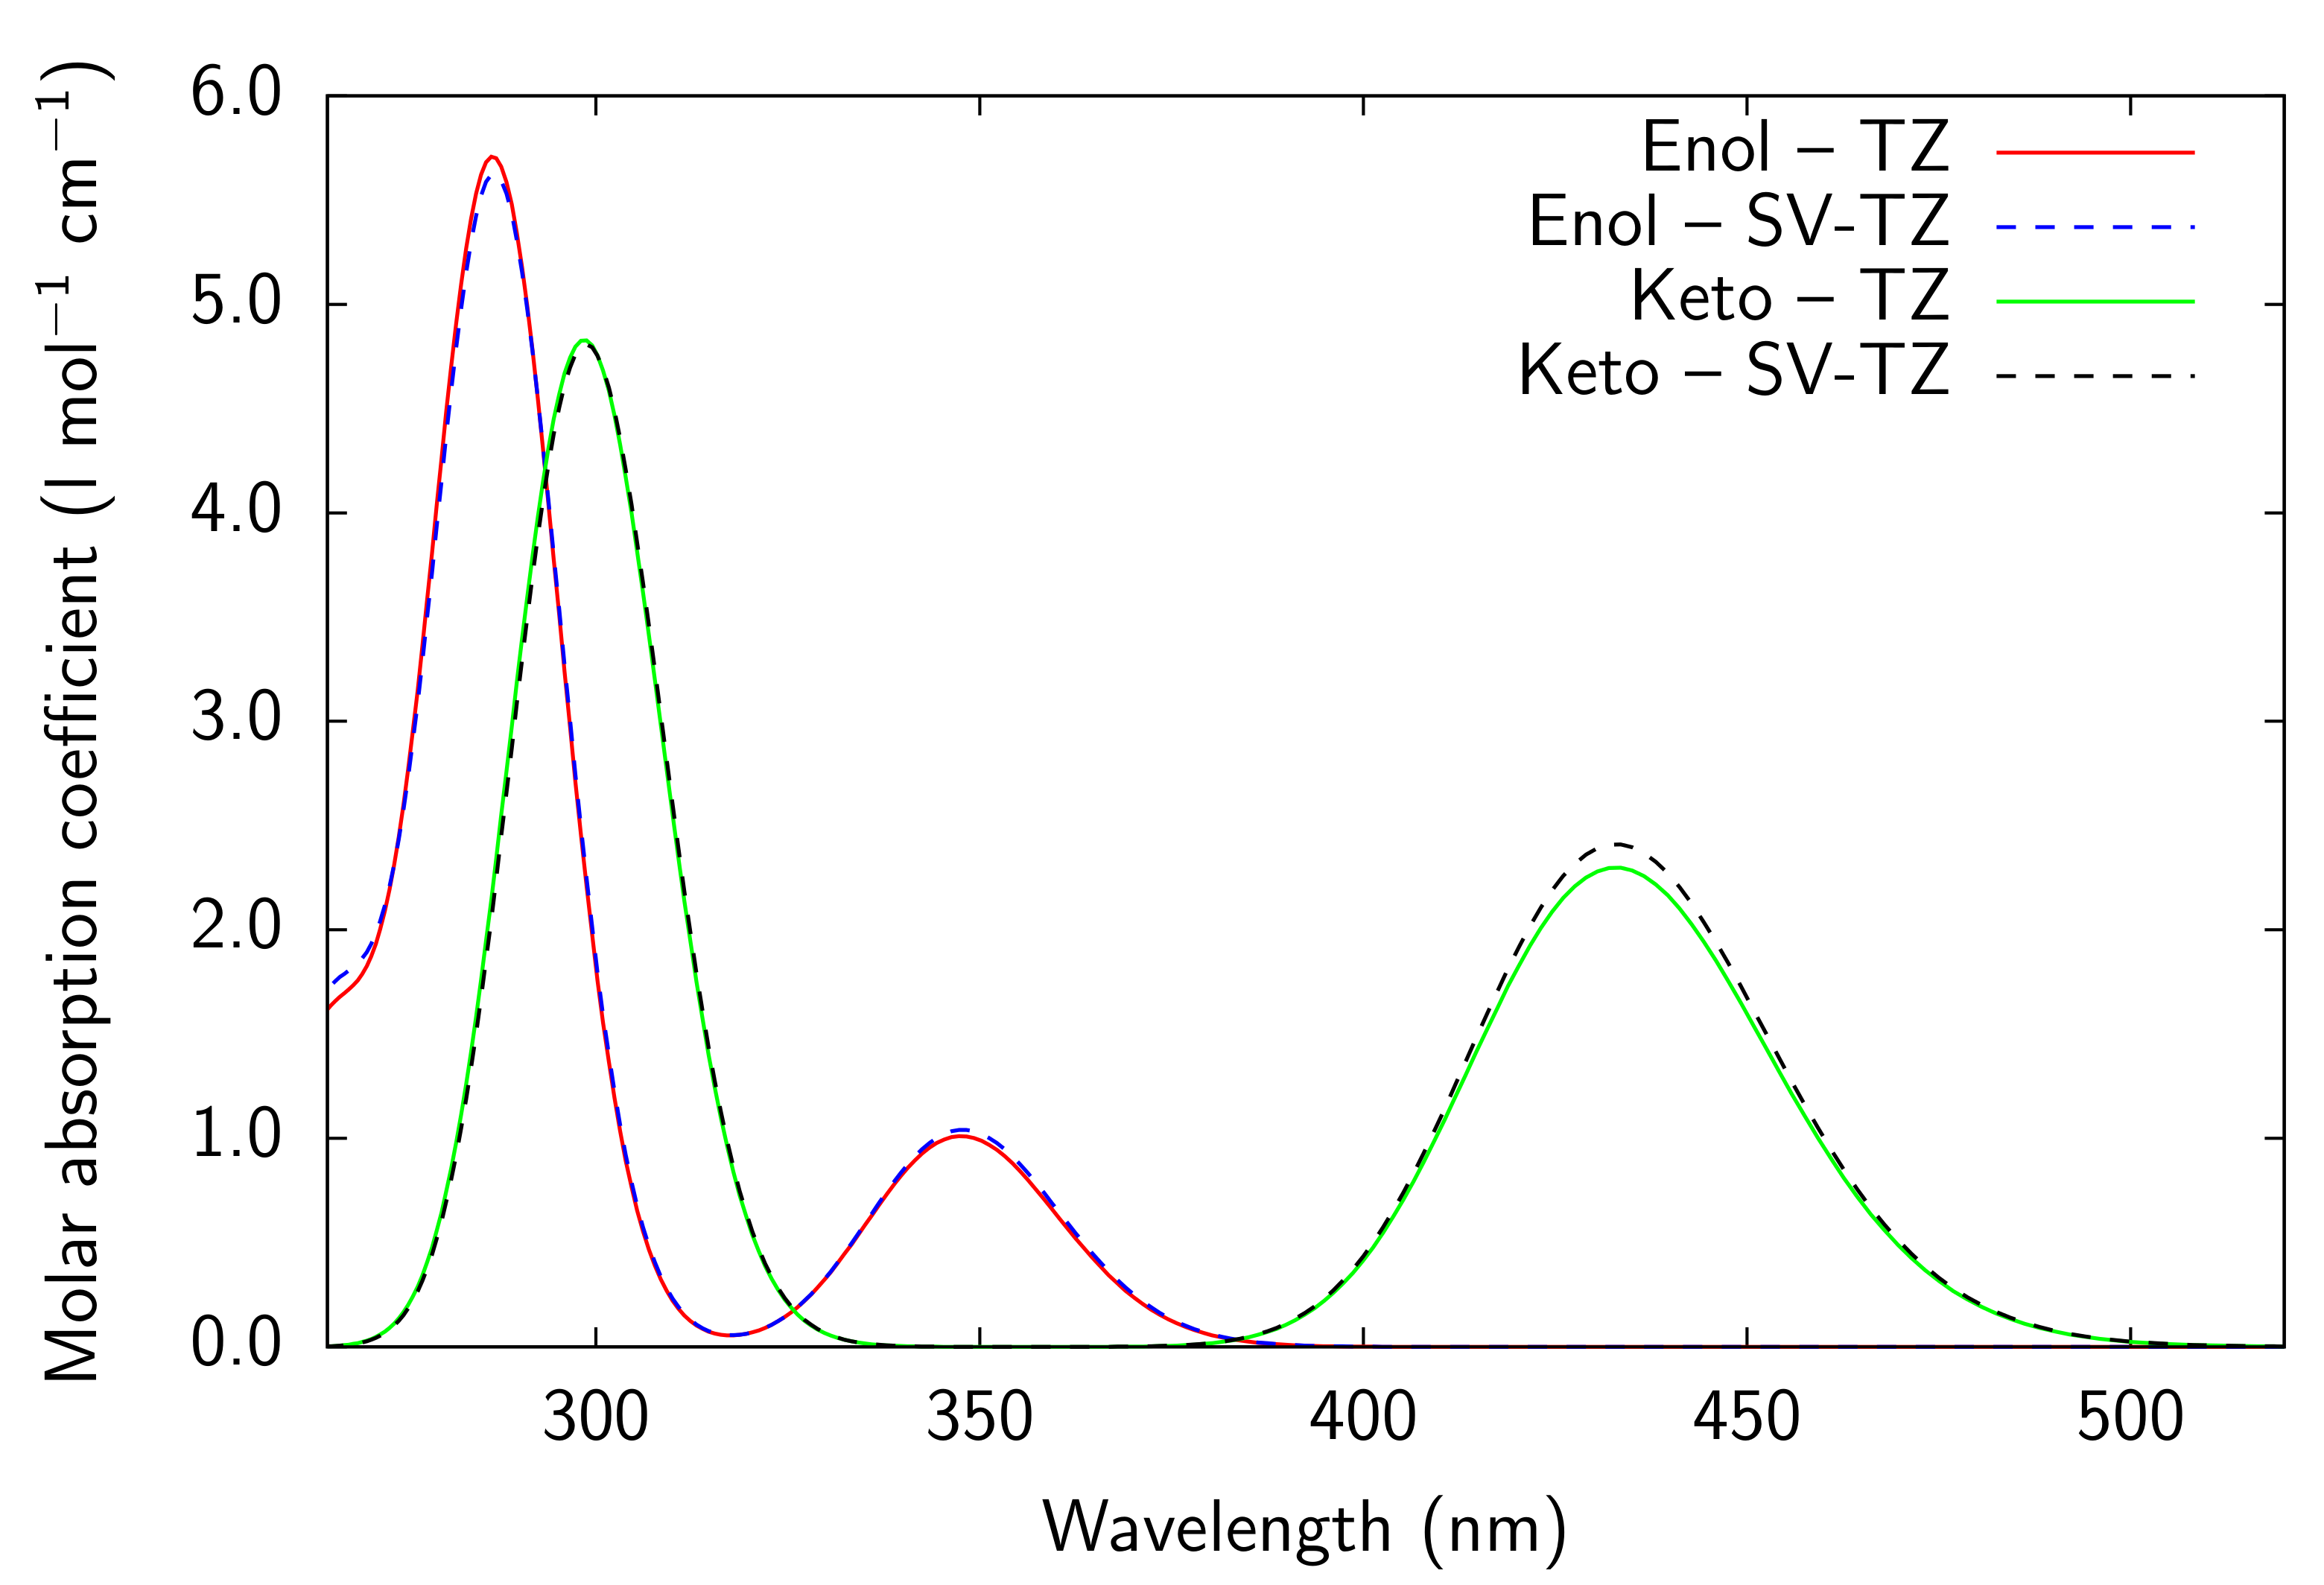
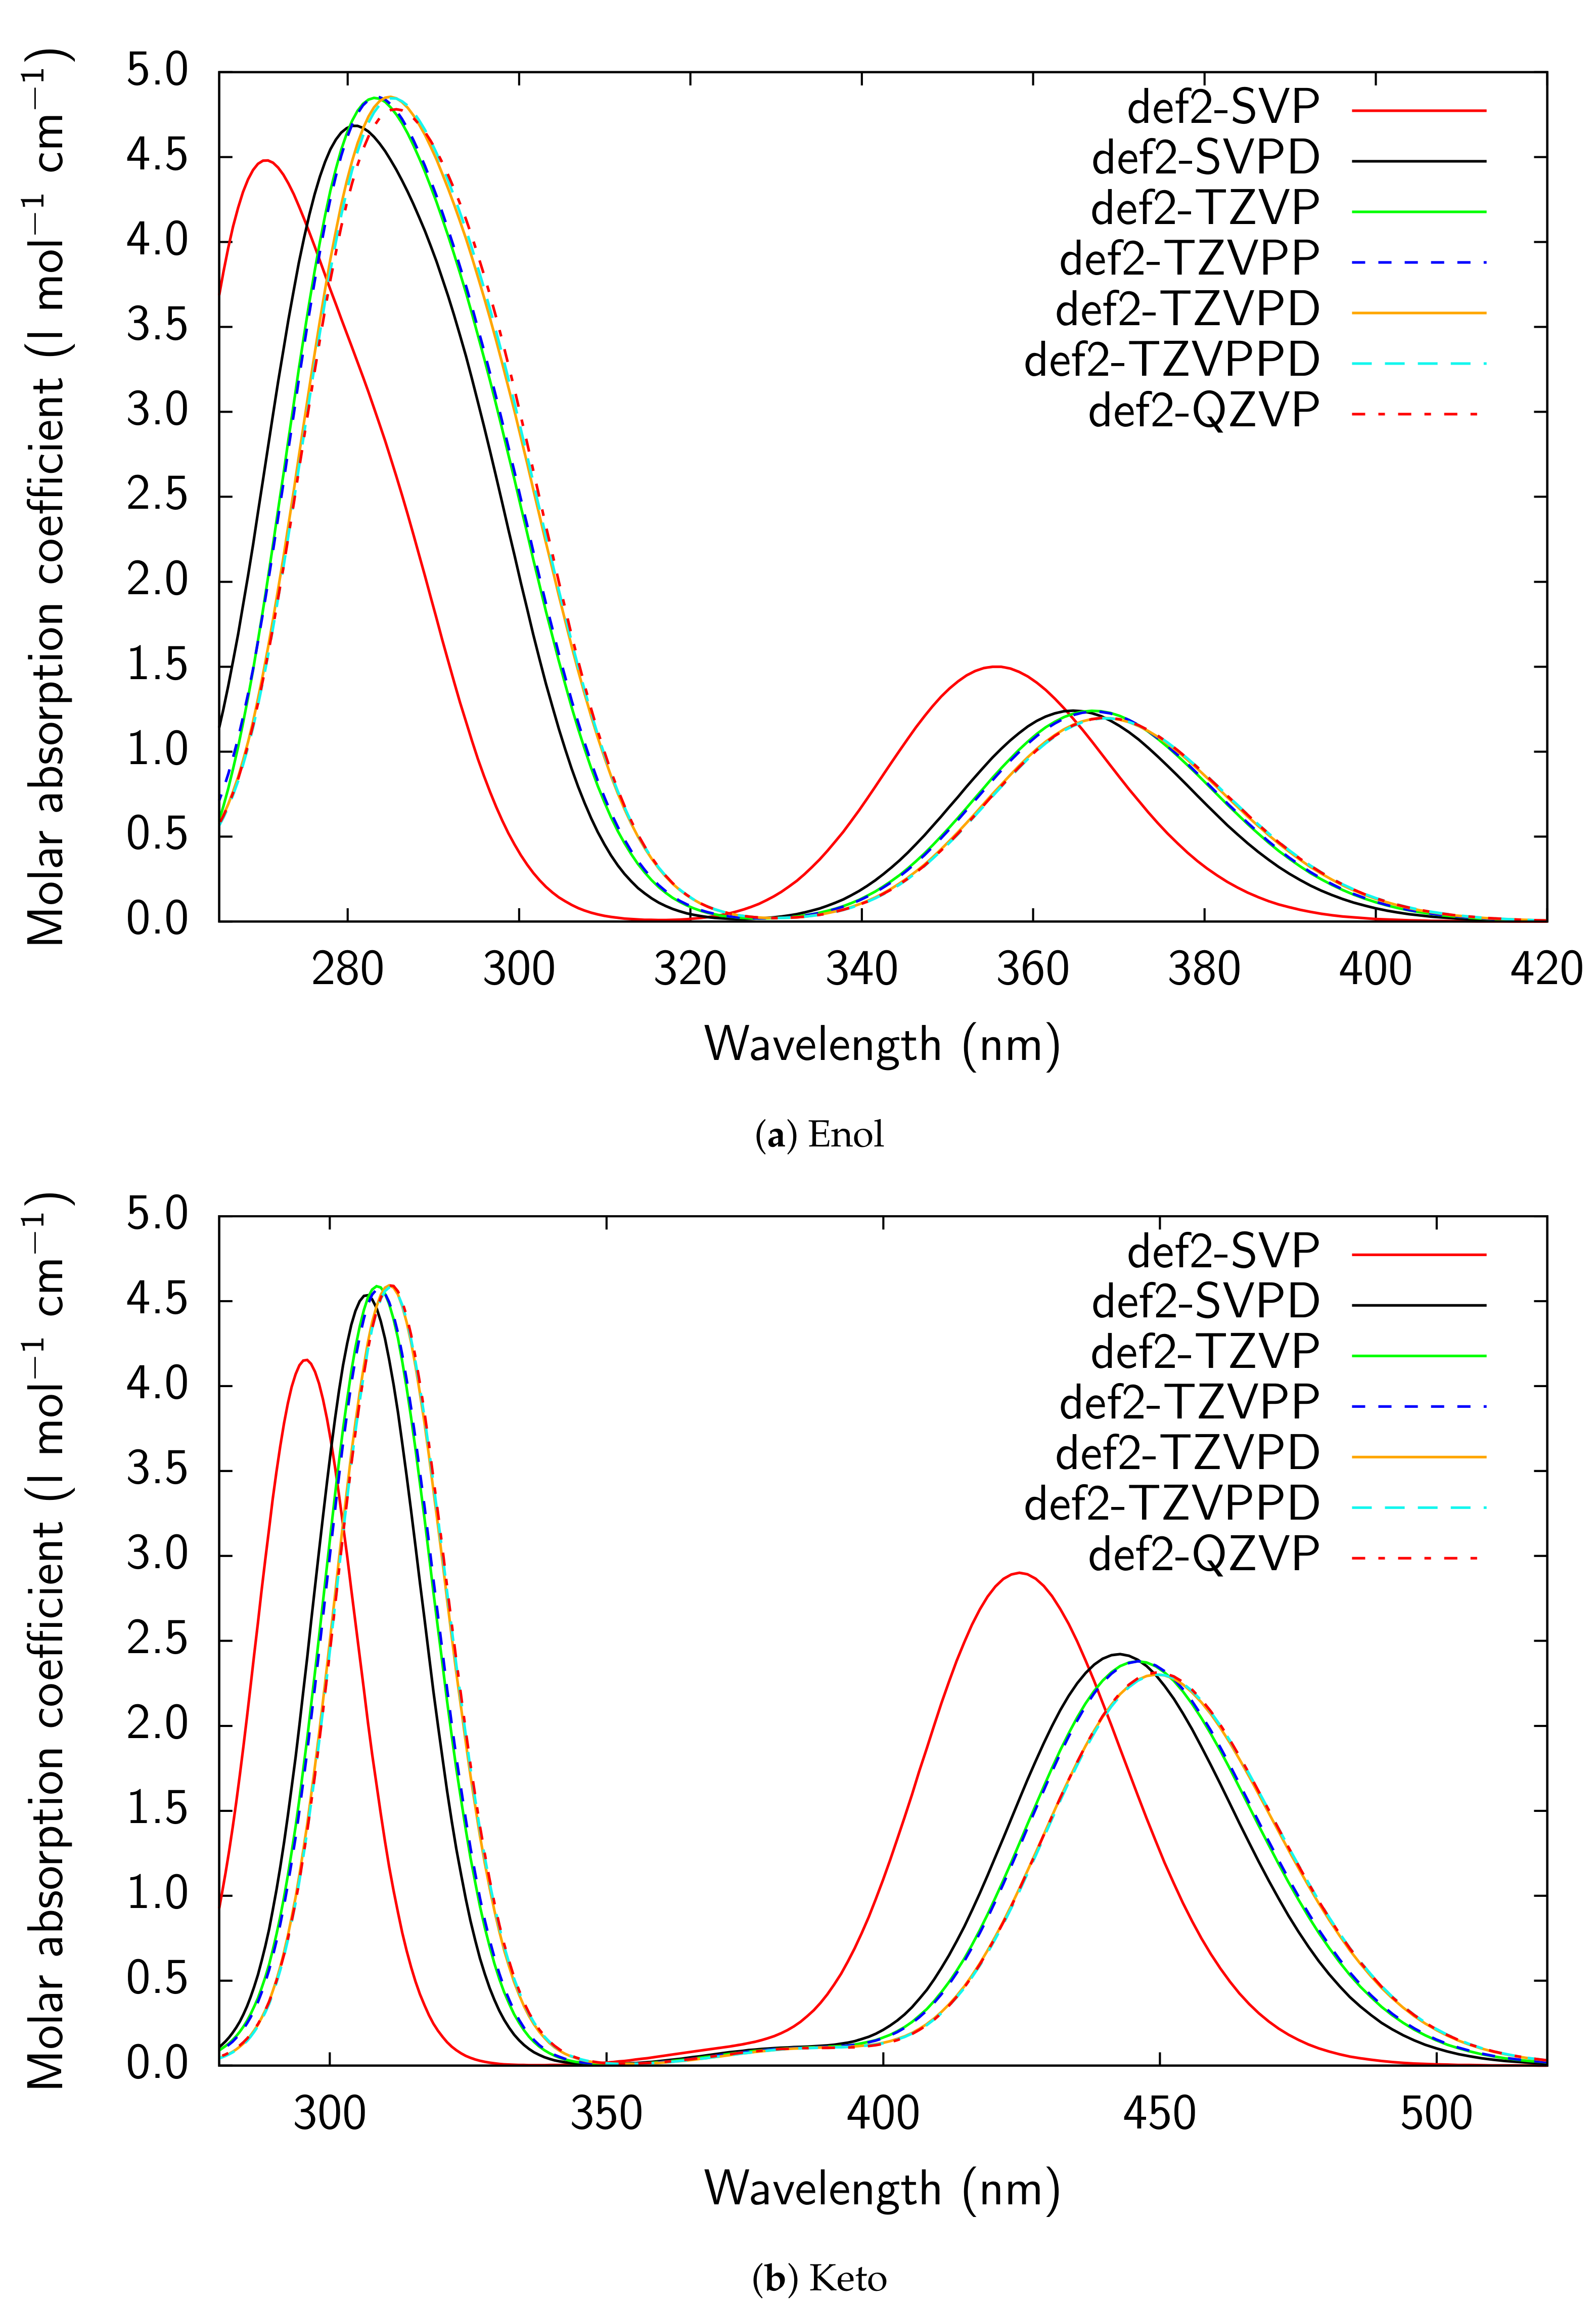
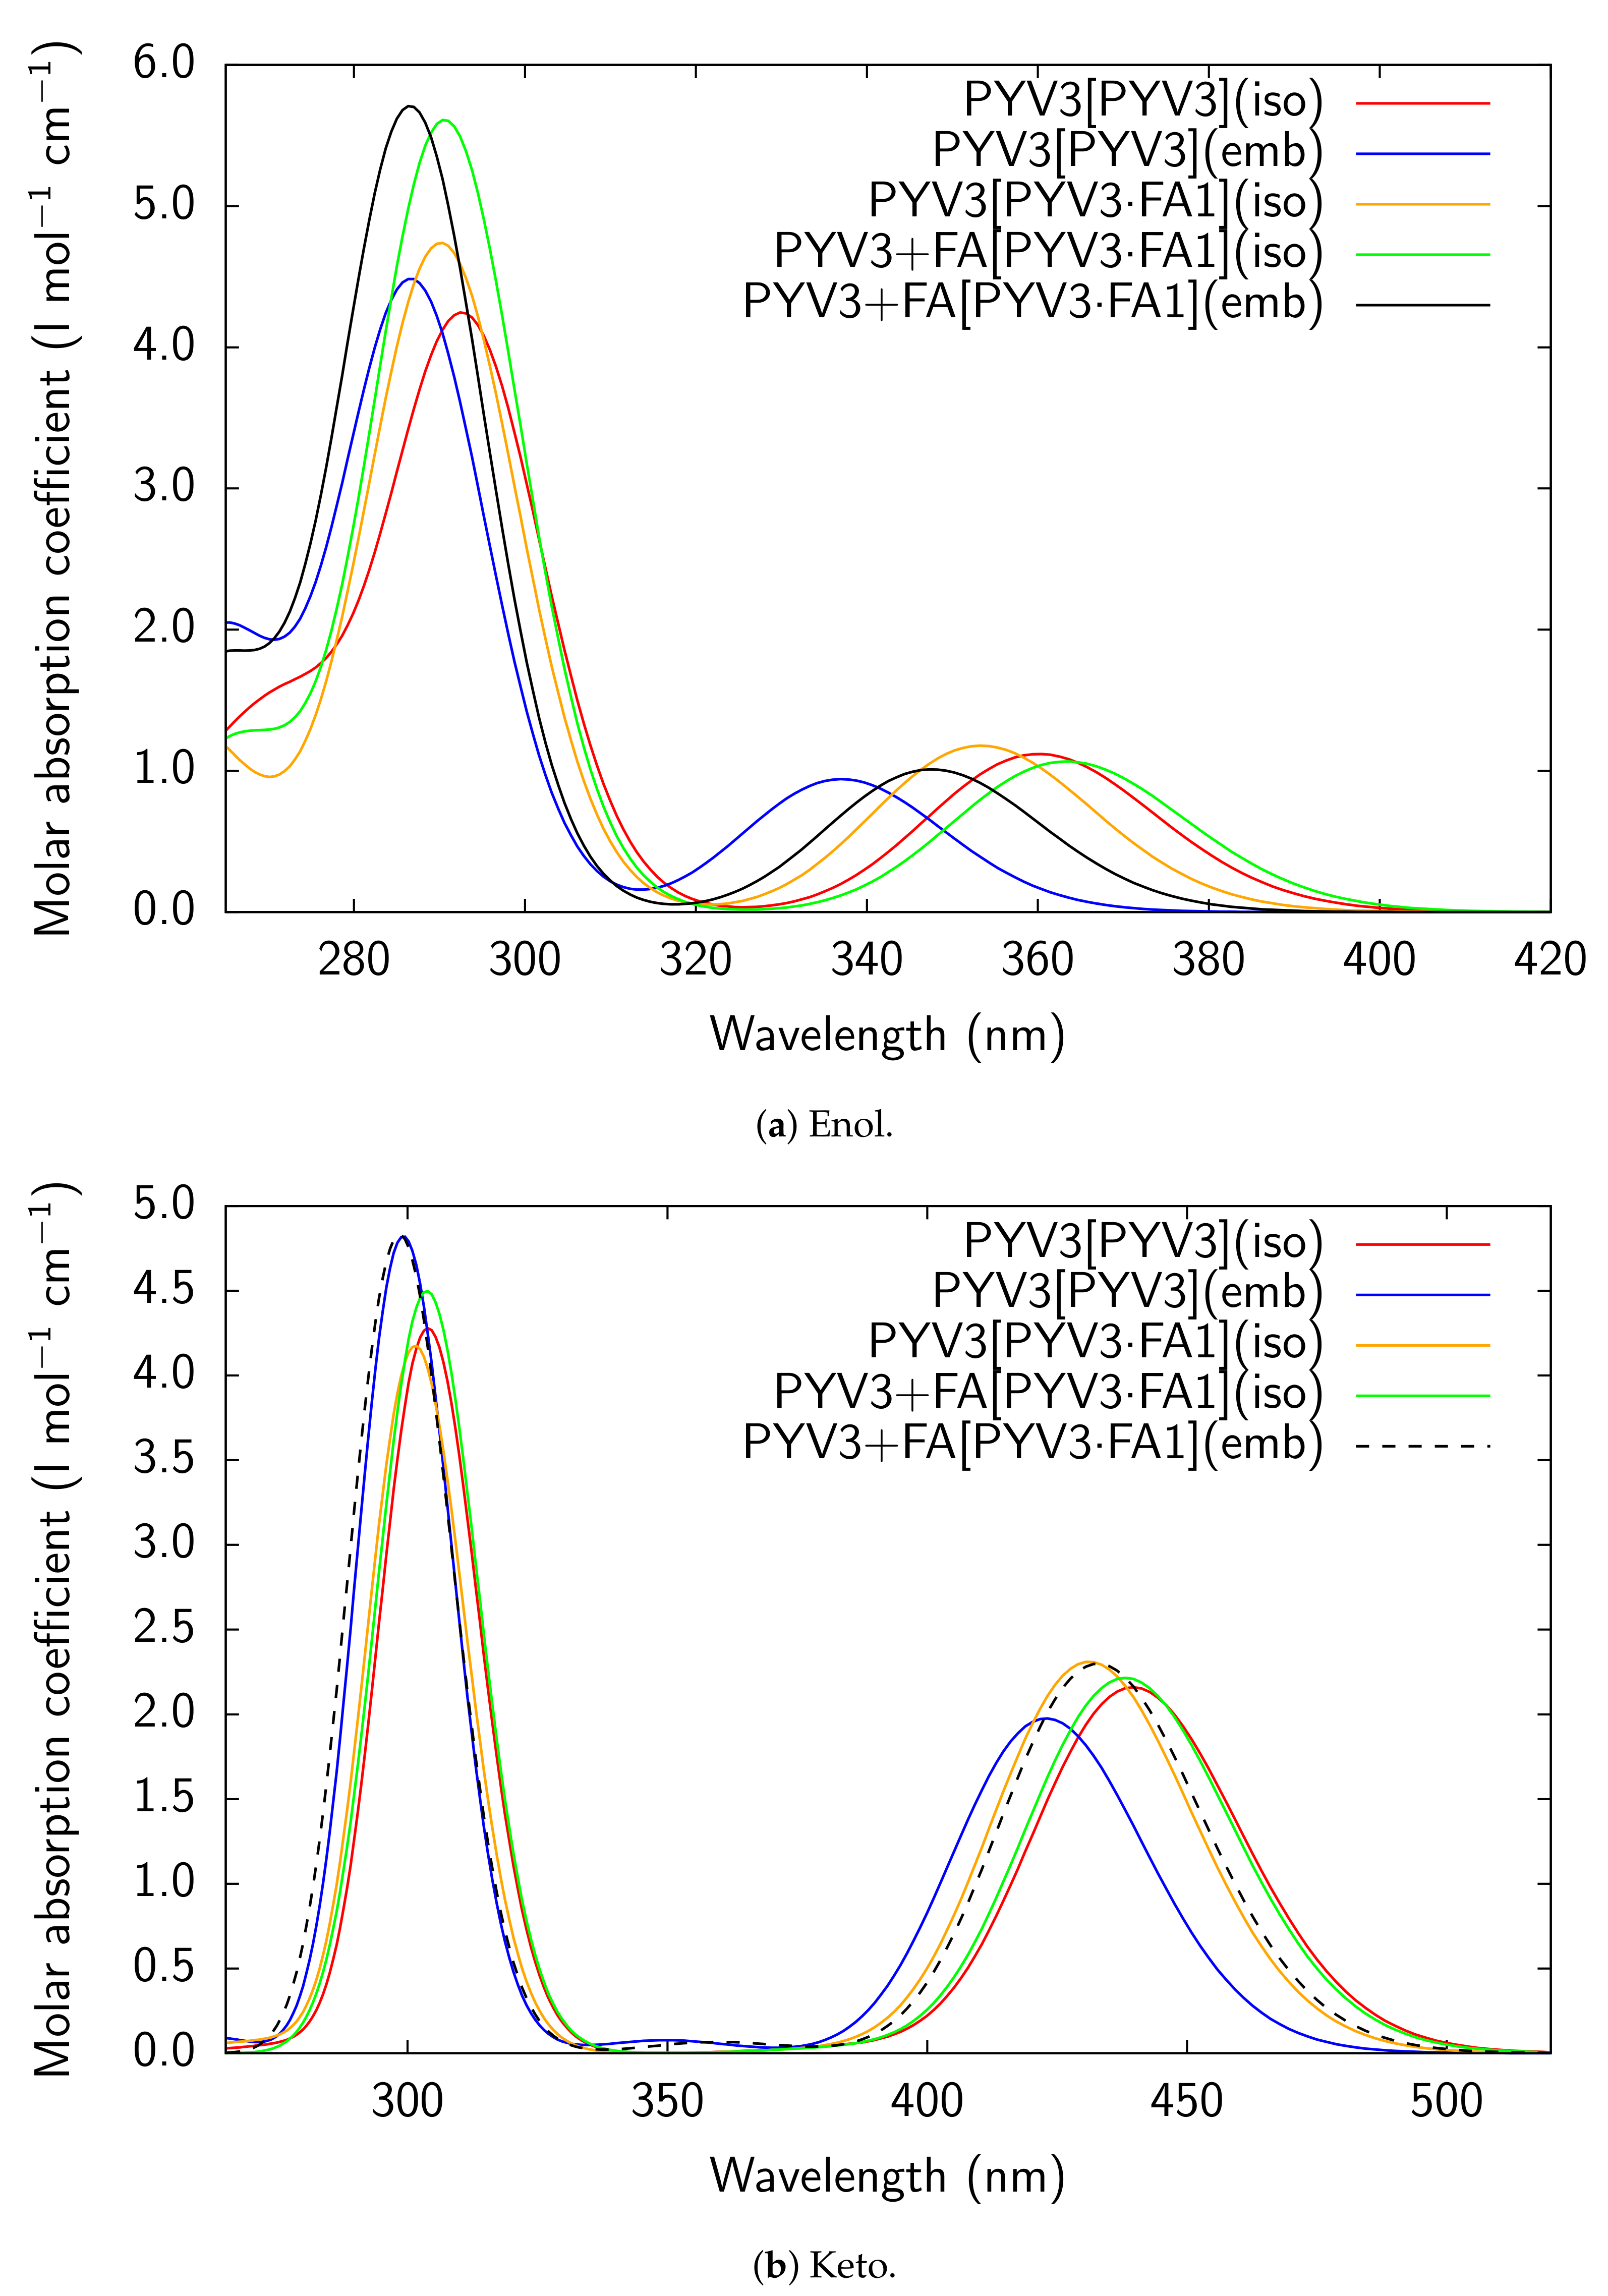
Figure A3.
RI-CC2/def2-TZVPD UV/Vis absorption spectra of all models considered for PYV3 and
PYV3 FA1.
Figure A3.
RI-CC2/def2-TZVPD UV/Vis absorption spectra of all models considered for PYV3 and
PYV3 FA1.
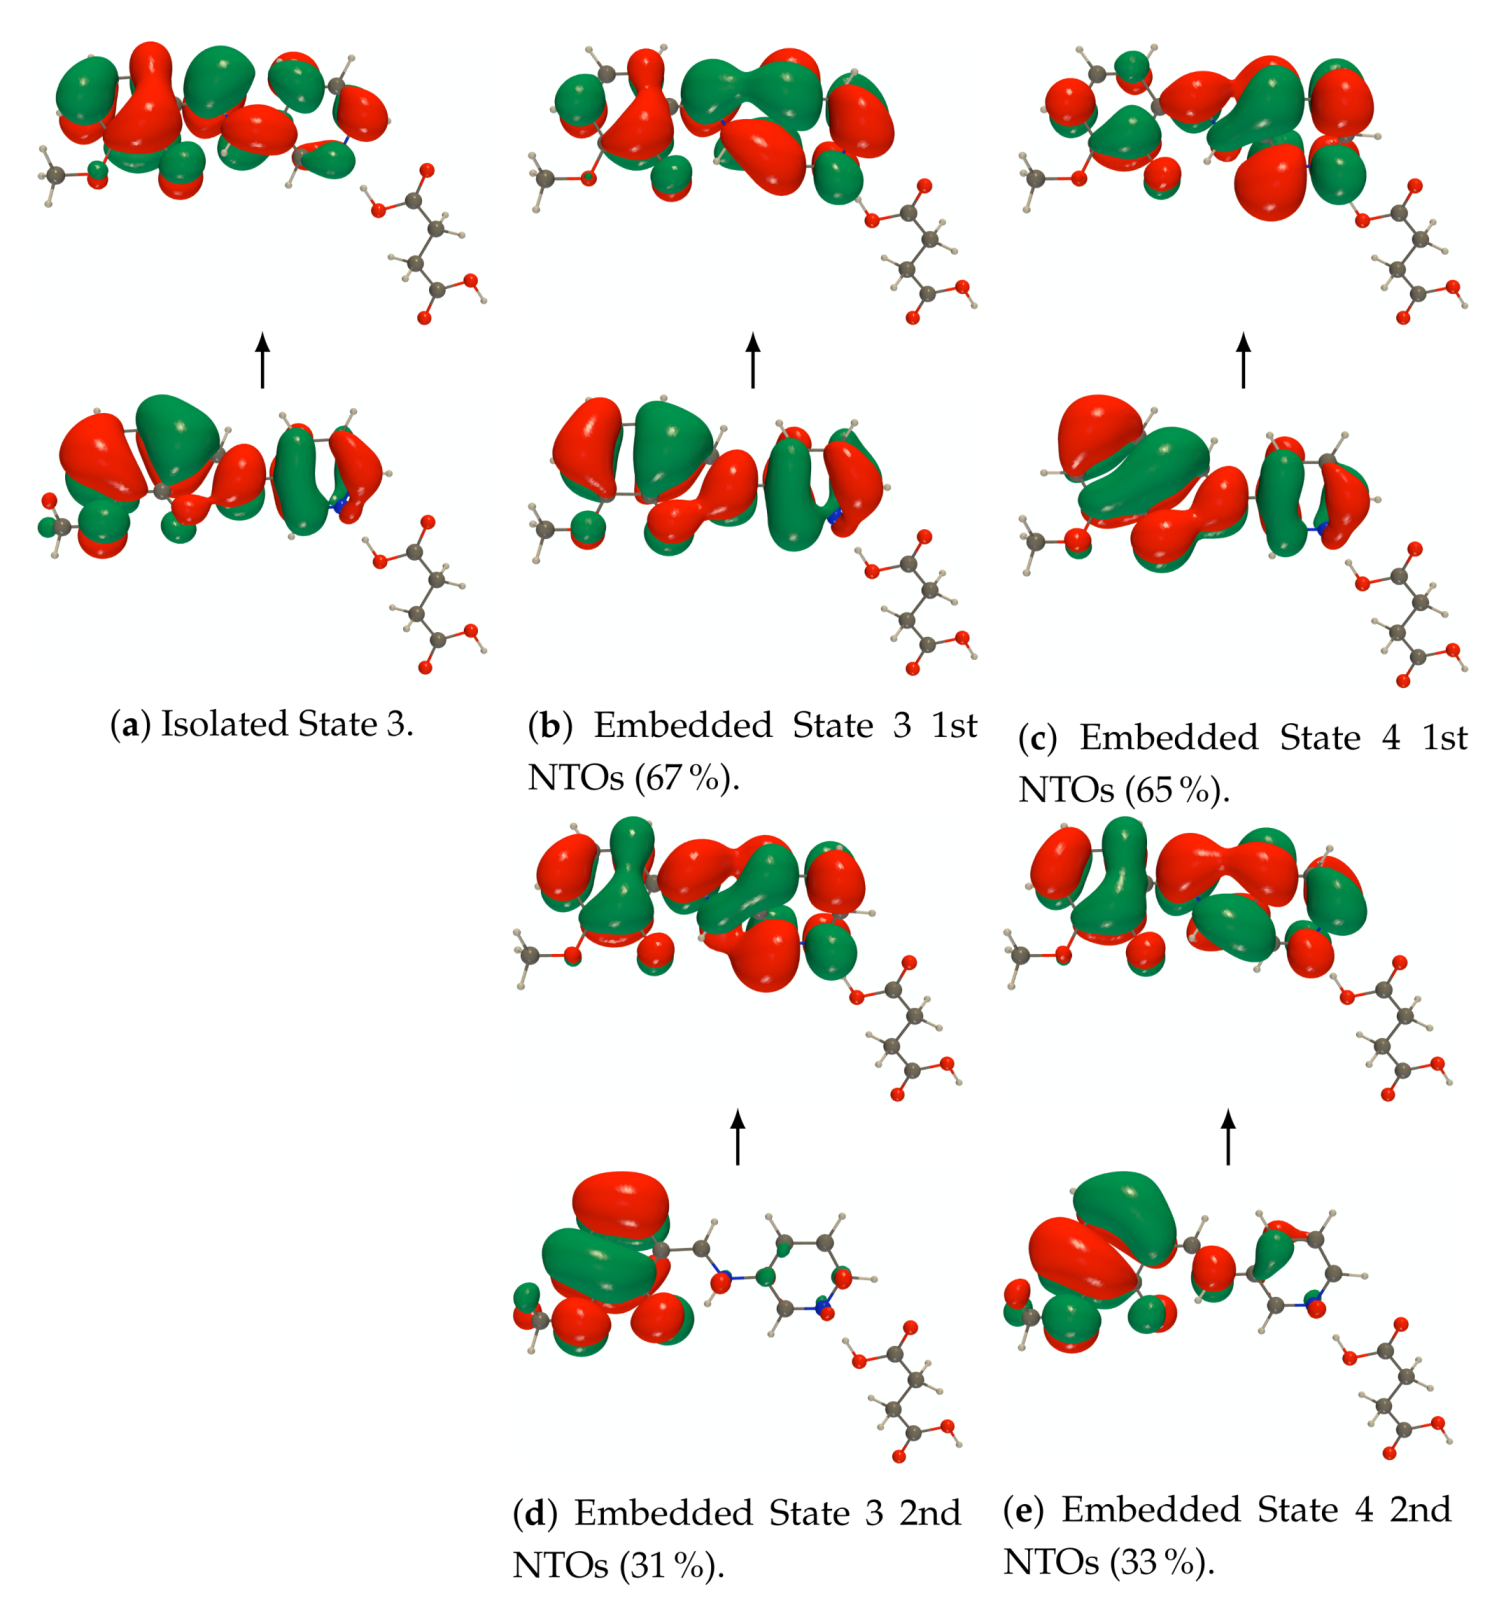
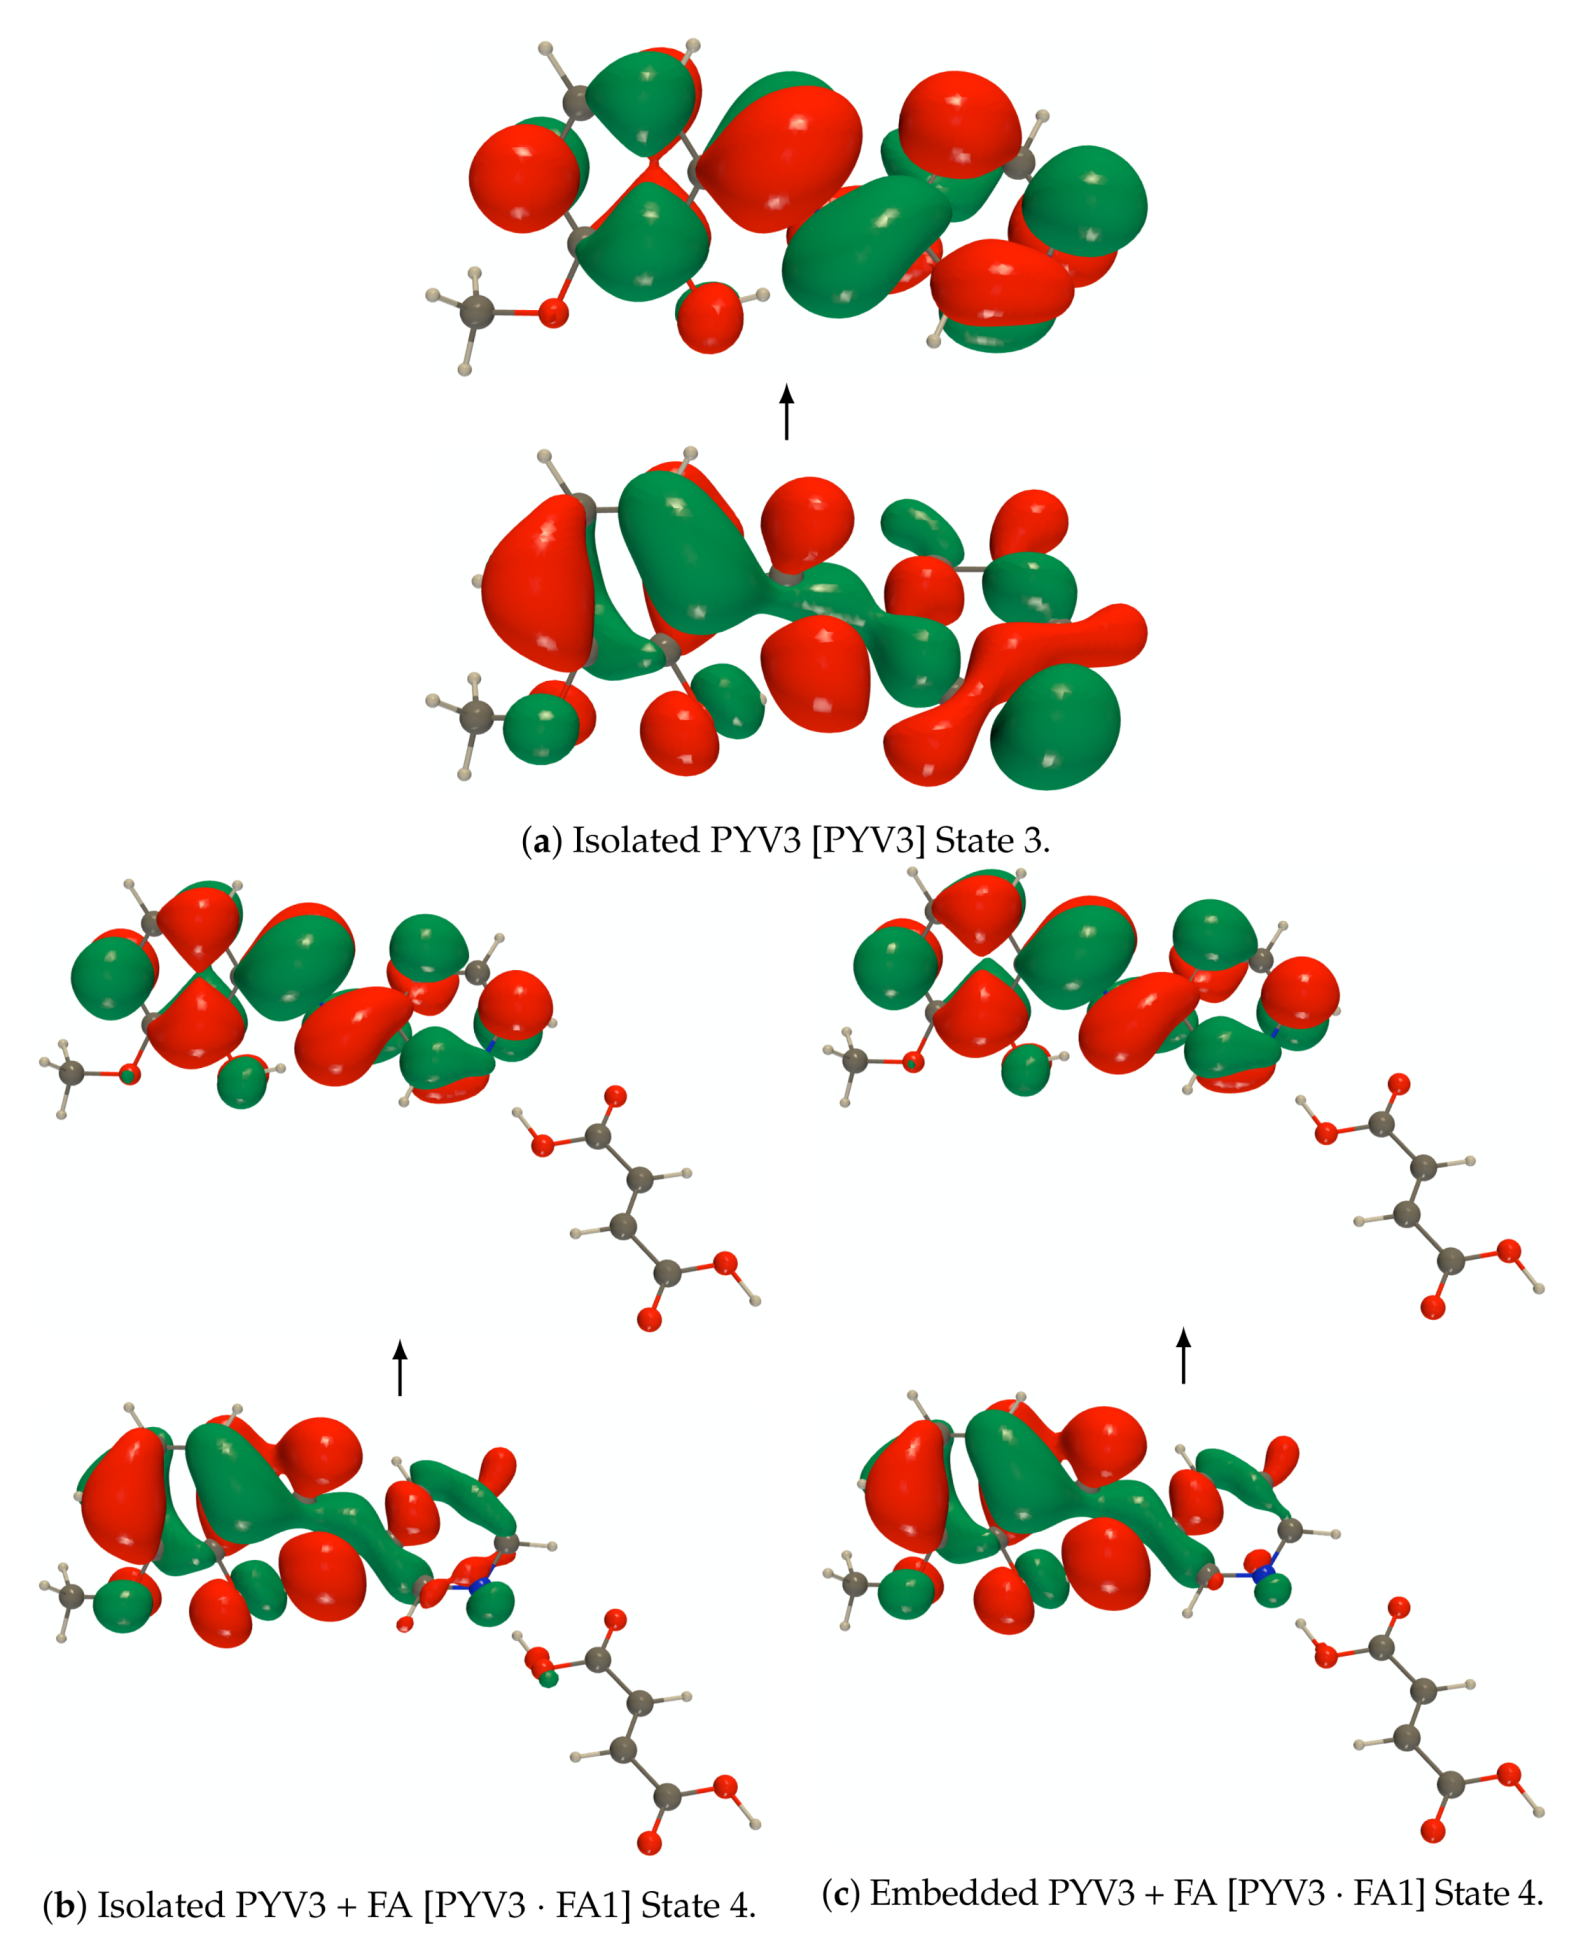
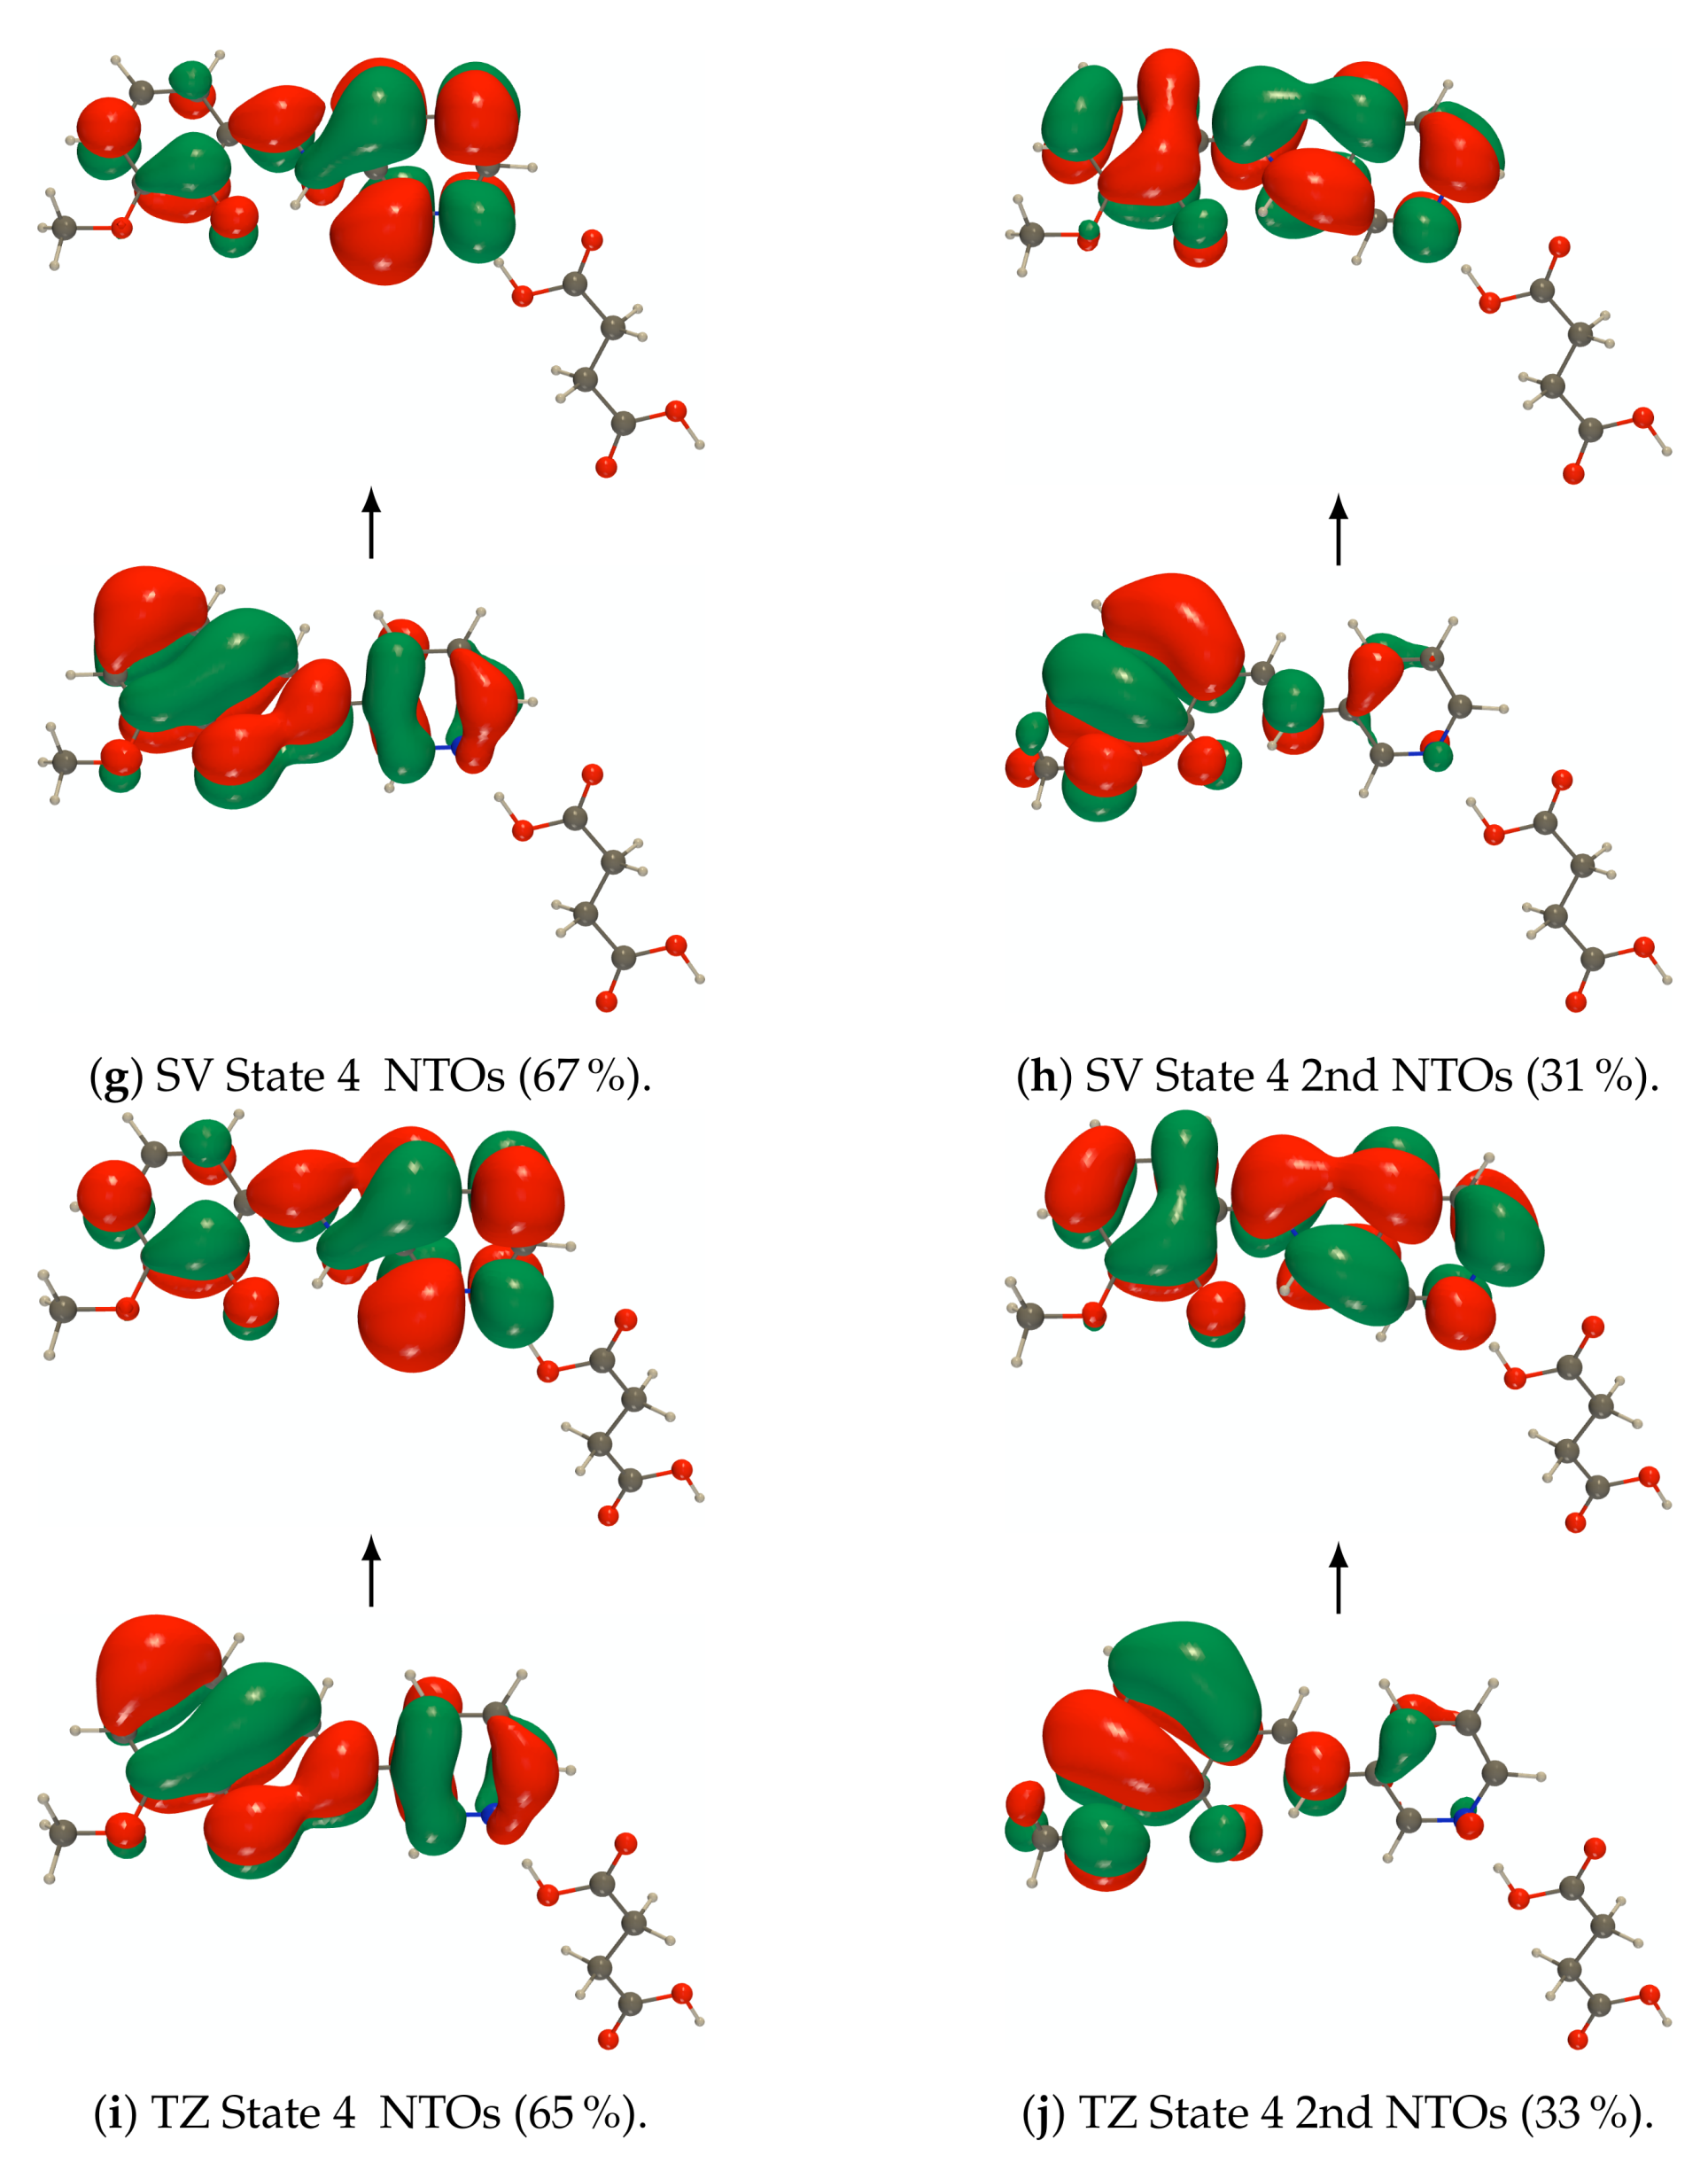
Figure A4.
RI-CC2/def2-TZVPD NTOs (holes below the arrows and particles above them, the red
(green) lobes are the positive (negative) ones) of the 3rd excited state of the isolated PYV3 [PYV3] enol
form and of the 4th excited state of the isolated and embedded PYV3 + FA [PYV3 FA1] (isovalue
of 0.02 a.u.).
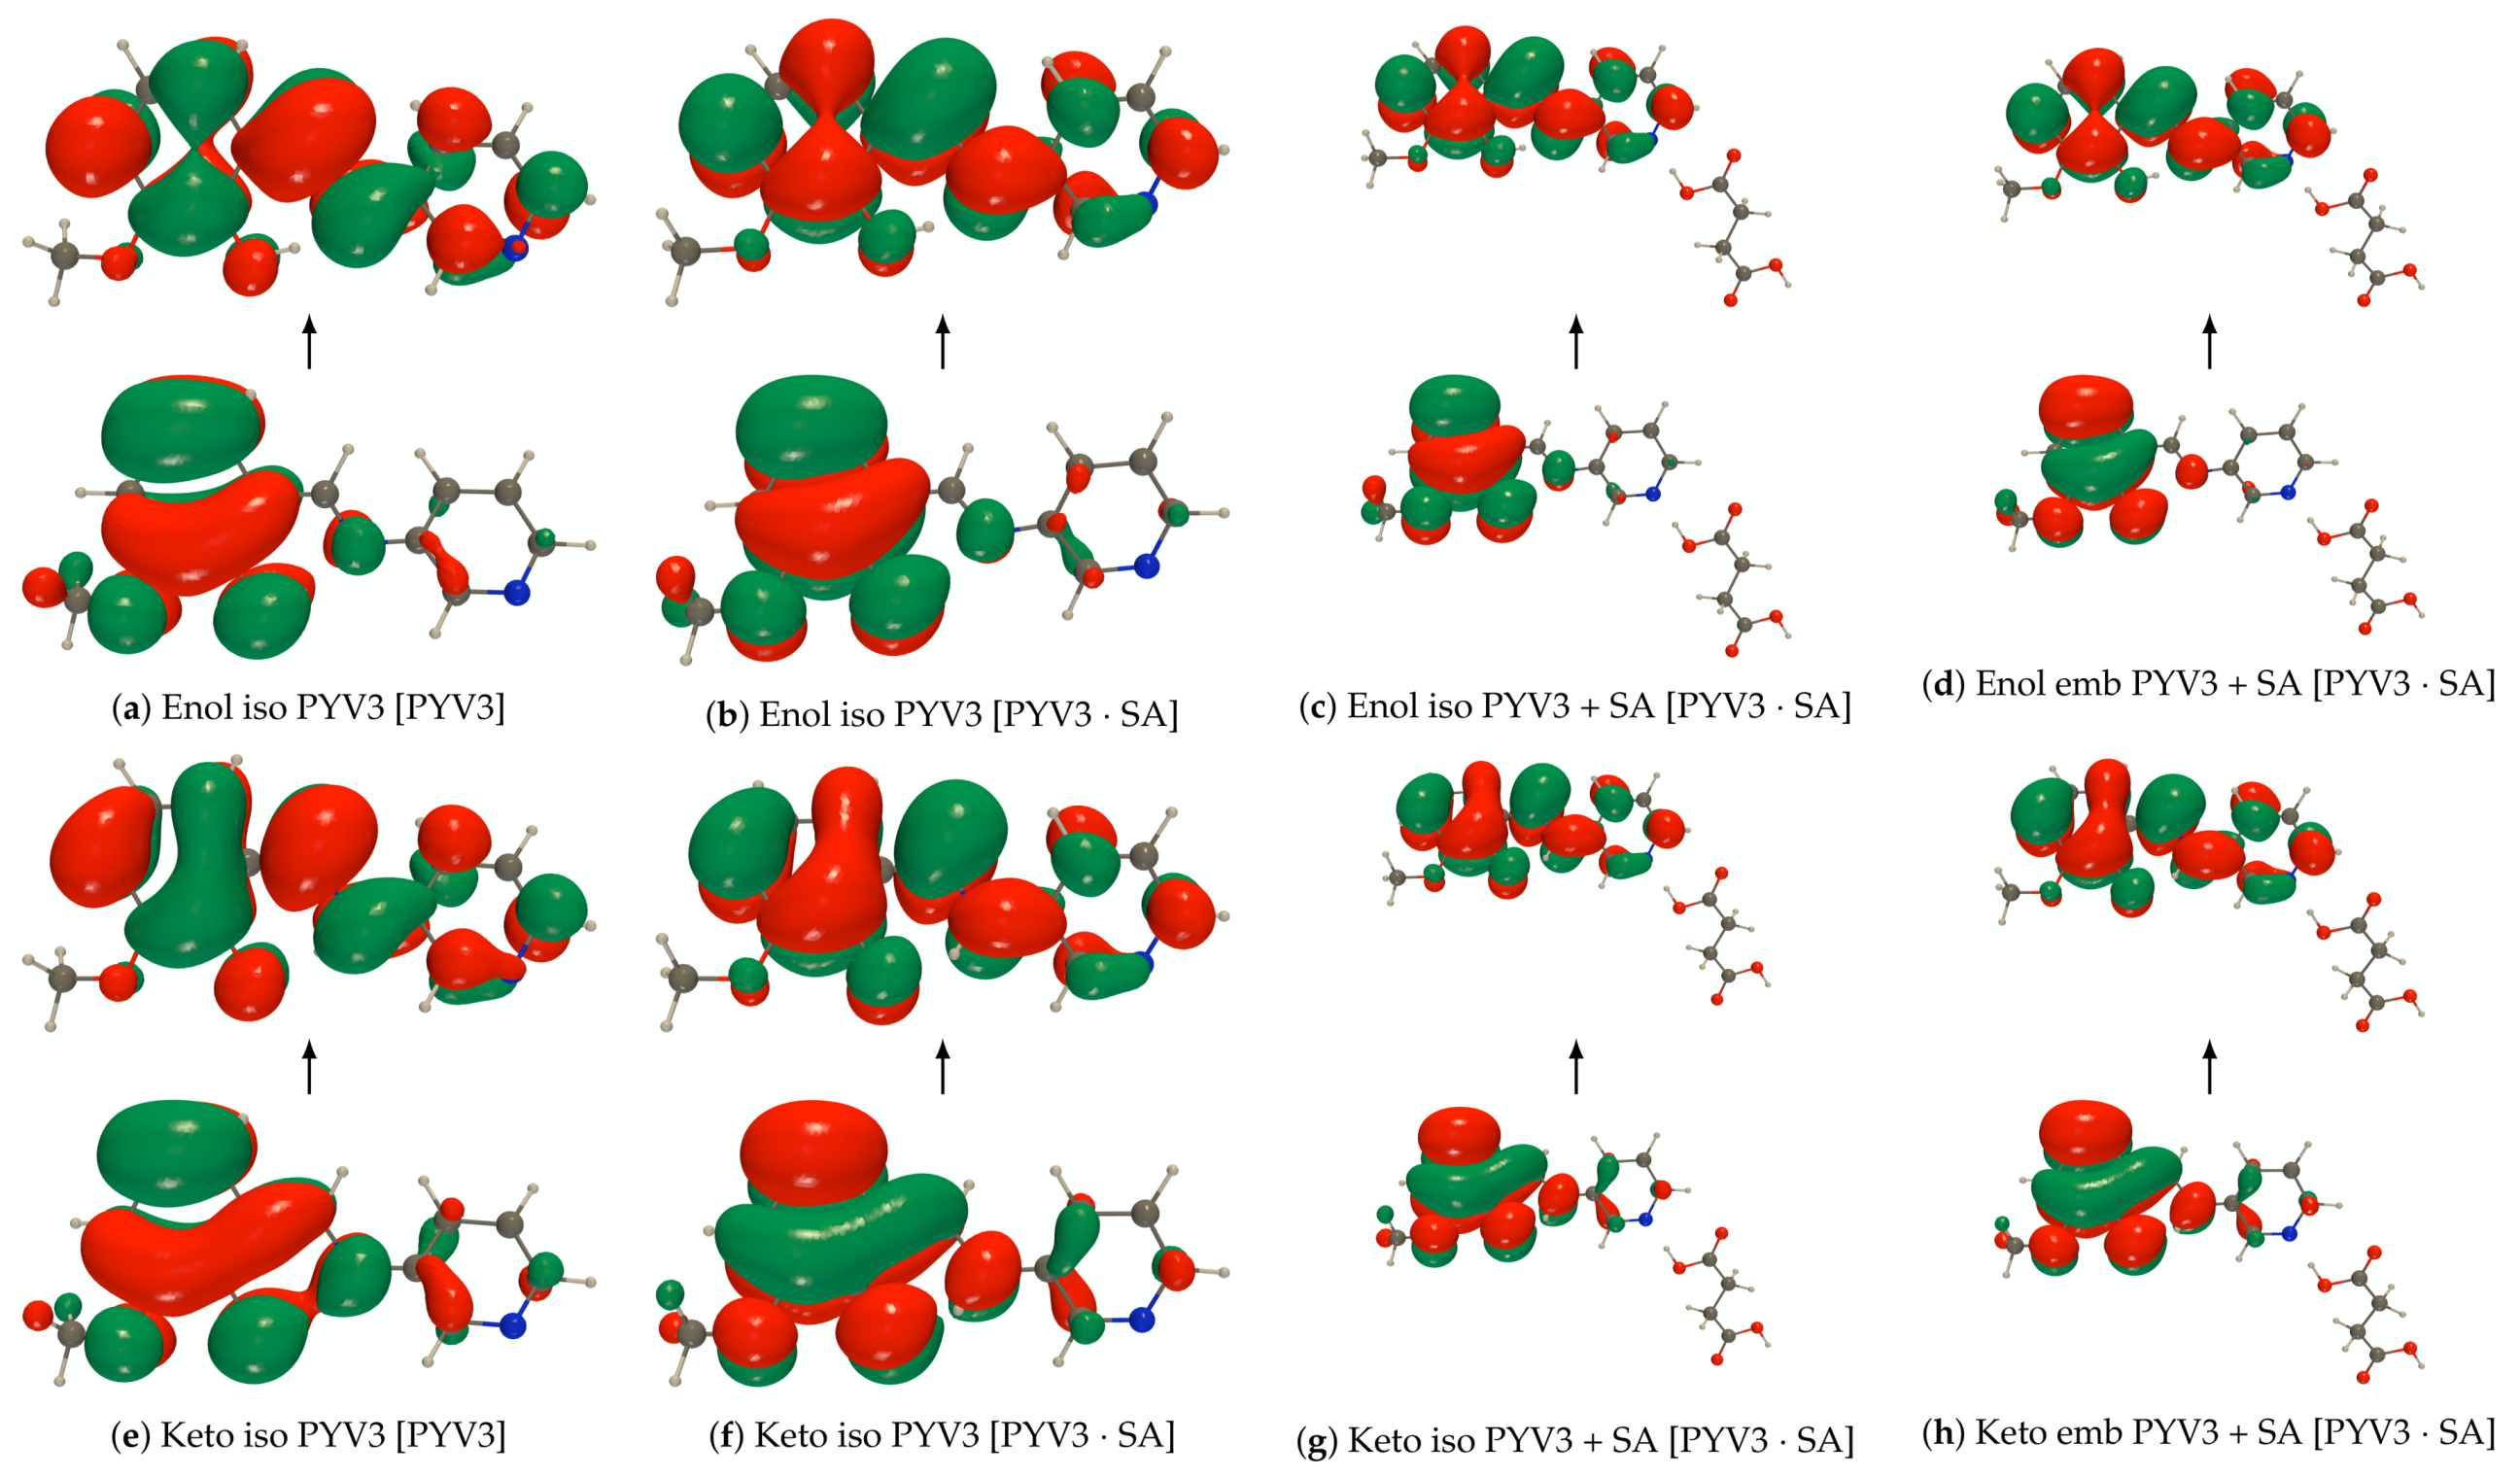
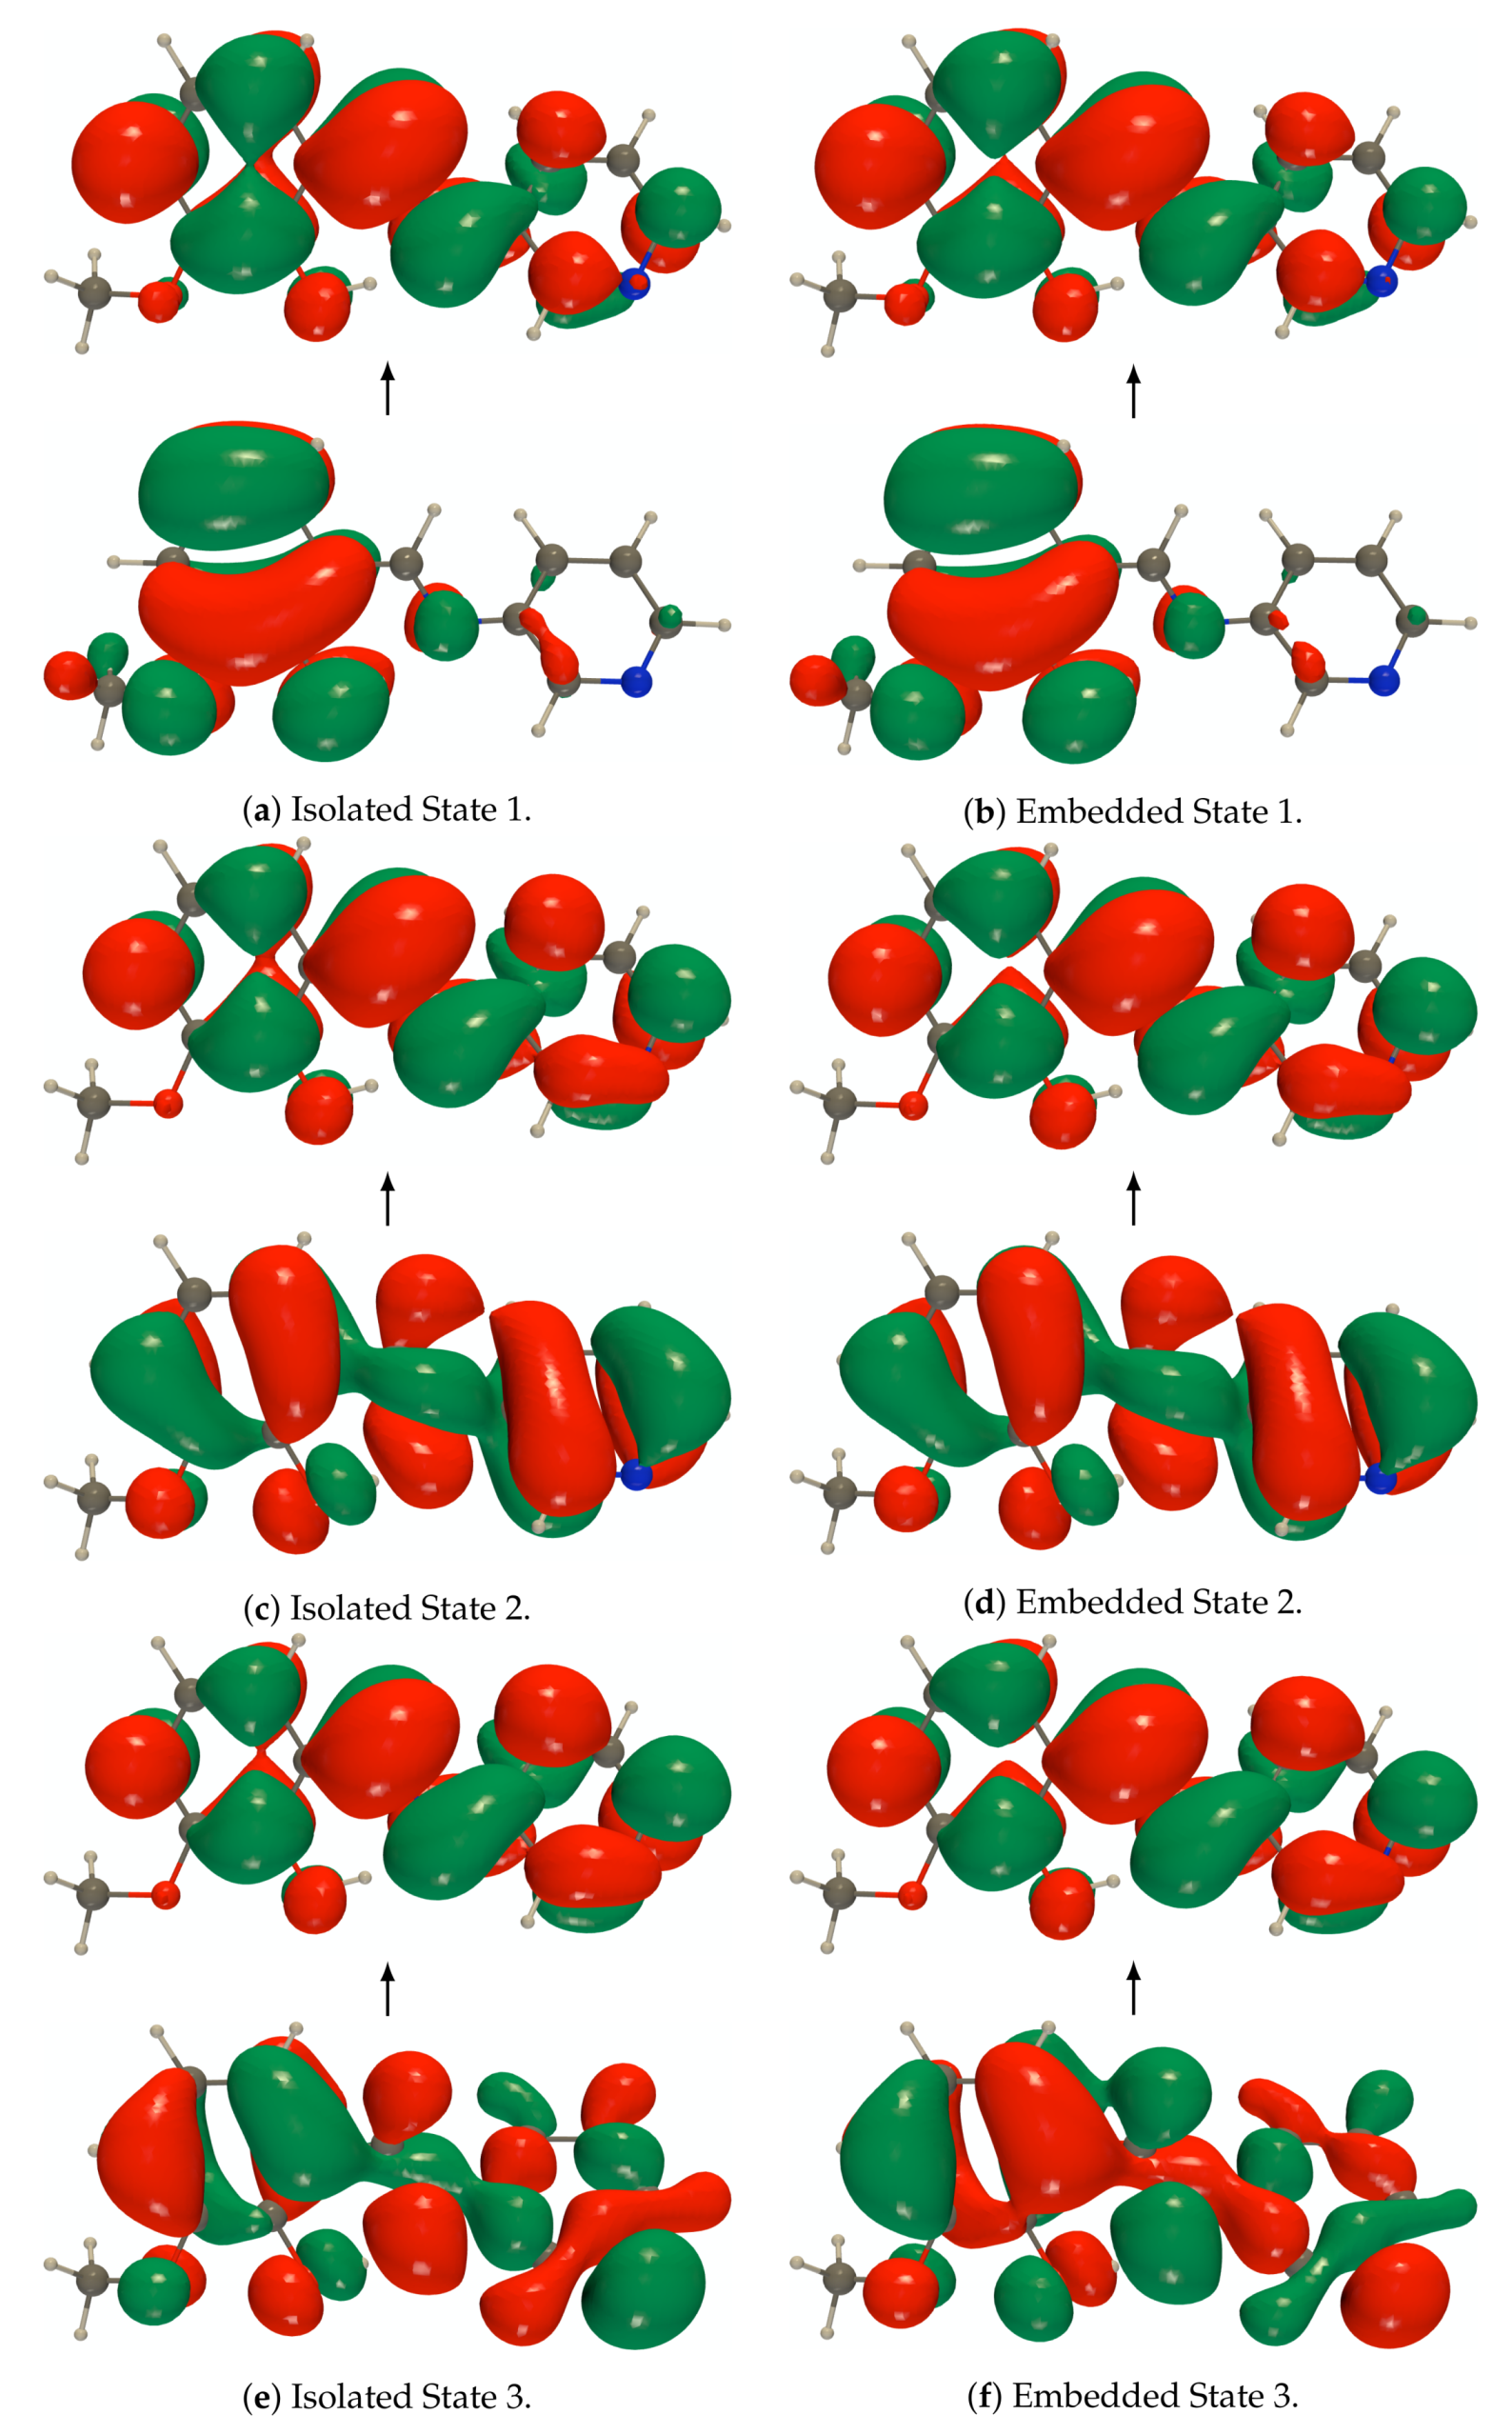
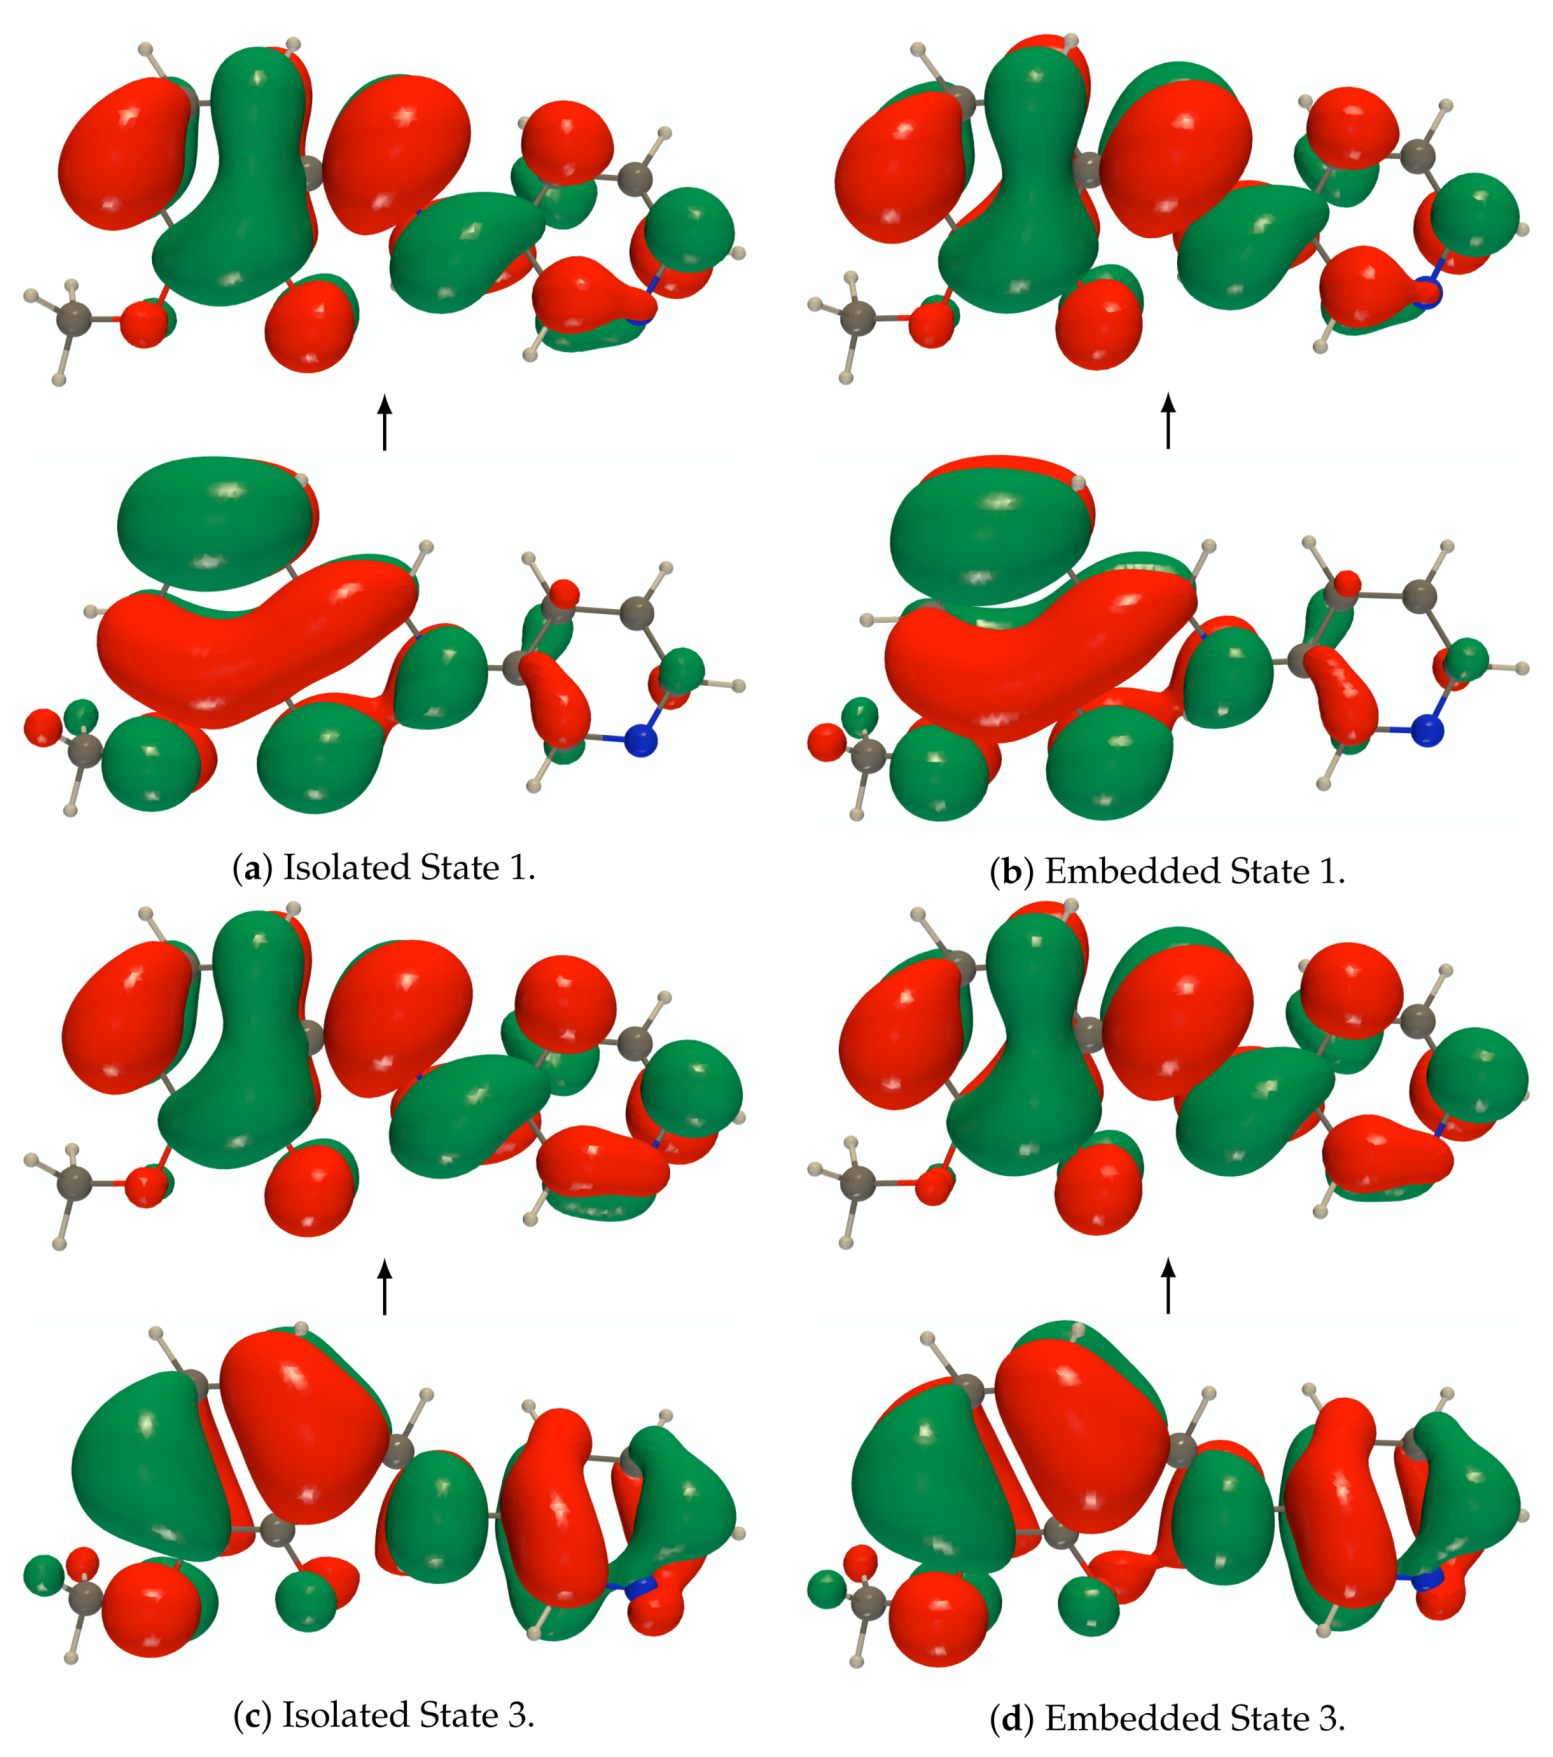
Figure A5.
RI-CC2/def2-TZVPD NTOs (holes below the arrows and particles above them, the red
(green) lobes are the positive (negative) ones) of the isolated and embedded PYV3 [PYV3] enol form
(isovalue of 0.02 a.u.).
Figure A5.
RI-CC2/def2-TZVPD NTOs (holes below the arrows and particles above them, the red
(green) lobes are the positive (negative) ones) of the isolated and embedded PYV3 [PYV3] enol form
(isovalue of 0.02 a.u.).
Figure A6.
RI-CC2/def2-TZVPD NTOs (holes below the arrows and particles above them, the red
(green) lobes are the positive (negative) ones) of the isolated and embedded PYV3 [PYV3] keto form
(isovalue of 0.02 a.u.).
Figure A6.
RI-CC2/def2-TZVPD NTOs (holes below the arrows and particles above them, the red
(green) lobes are the positive (negative) ones) of the isolated and embedded PYV3 [PYV3] keto form
(isovalue of 0.02 a.u.).
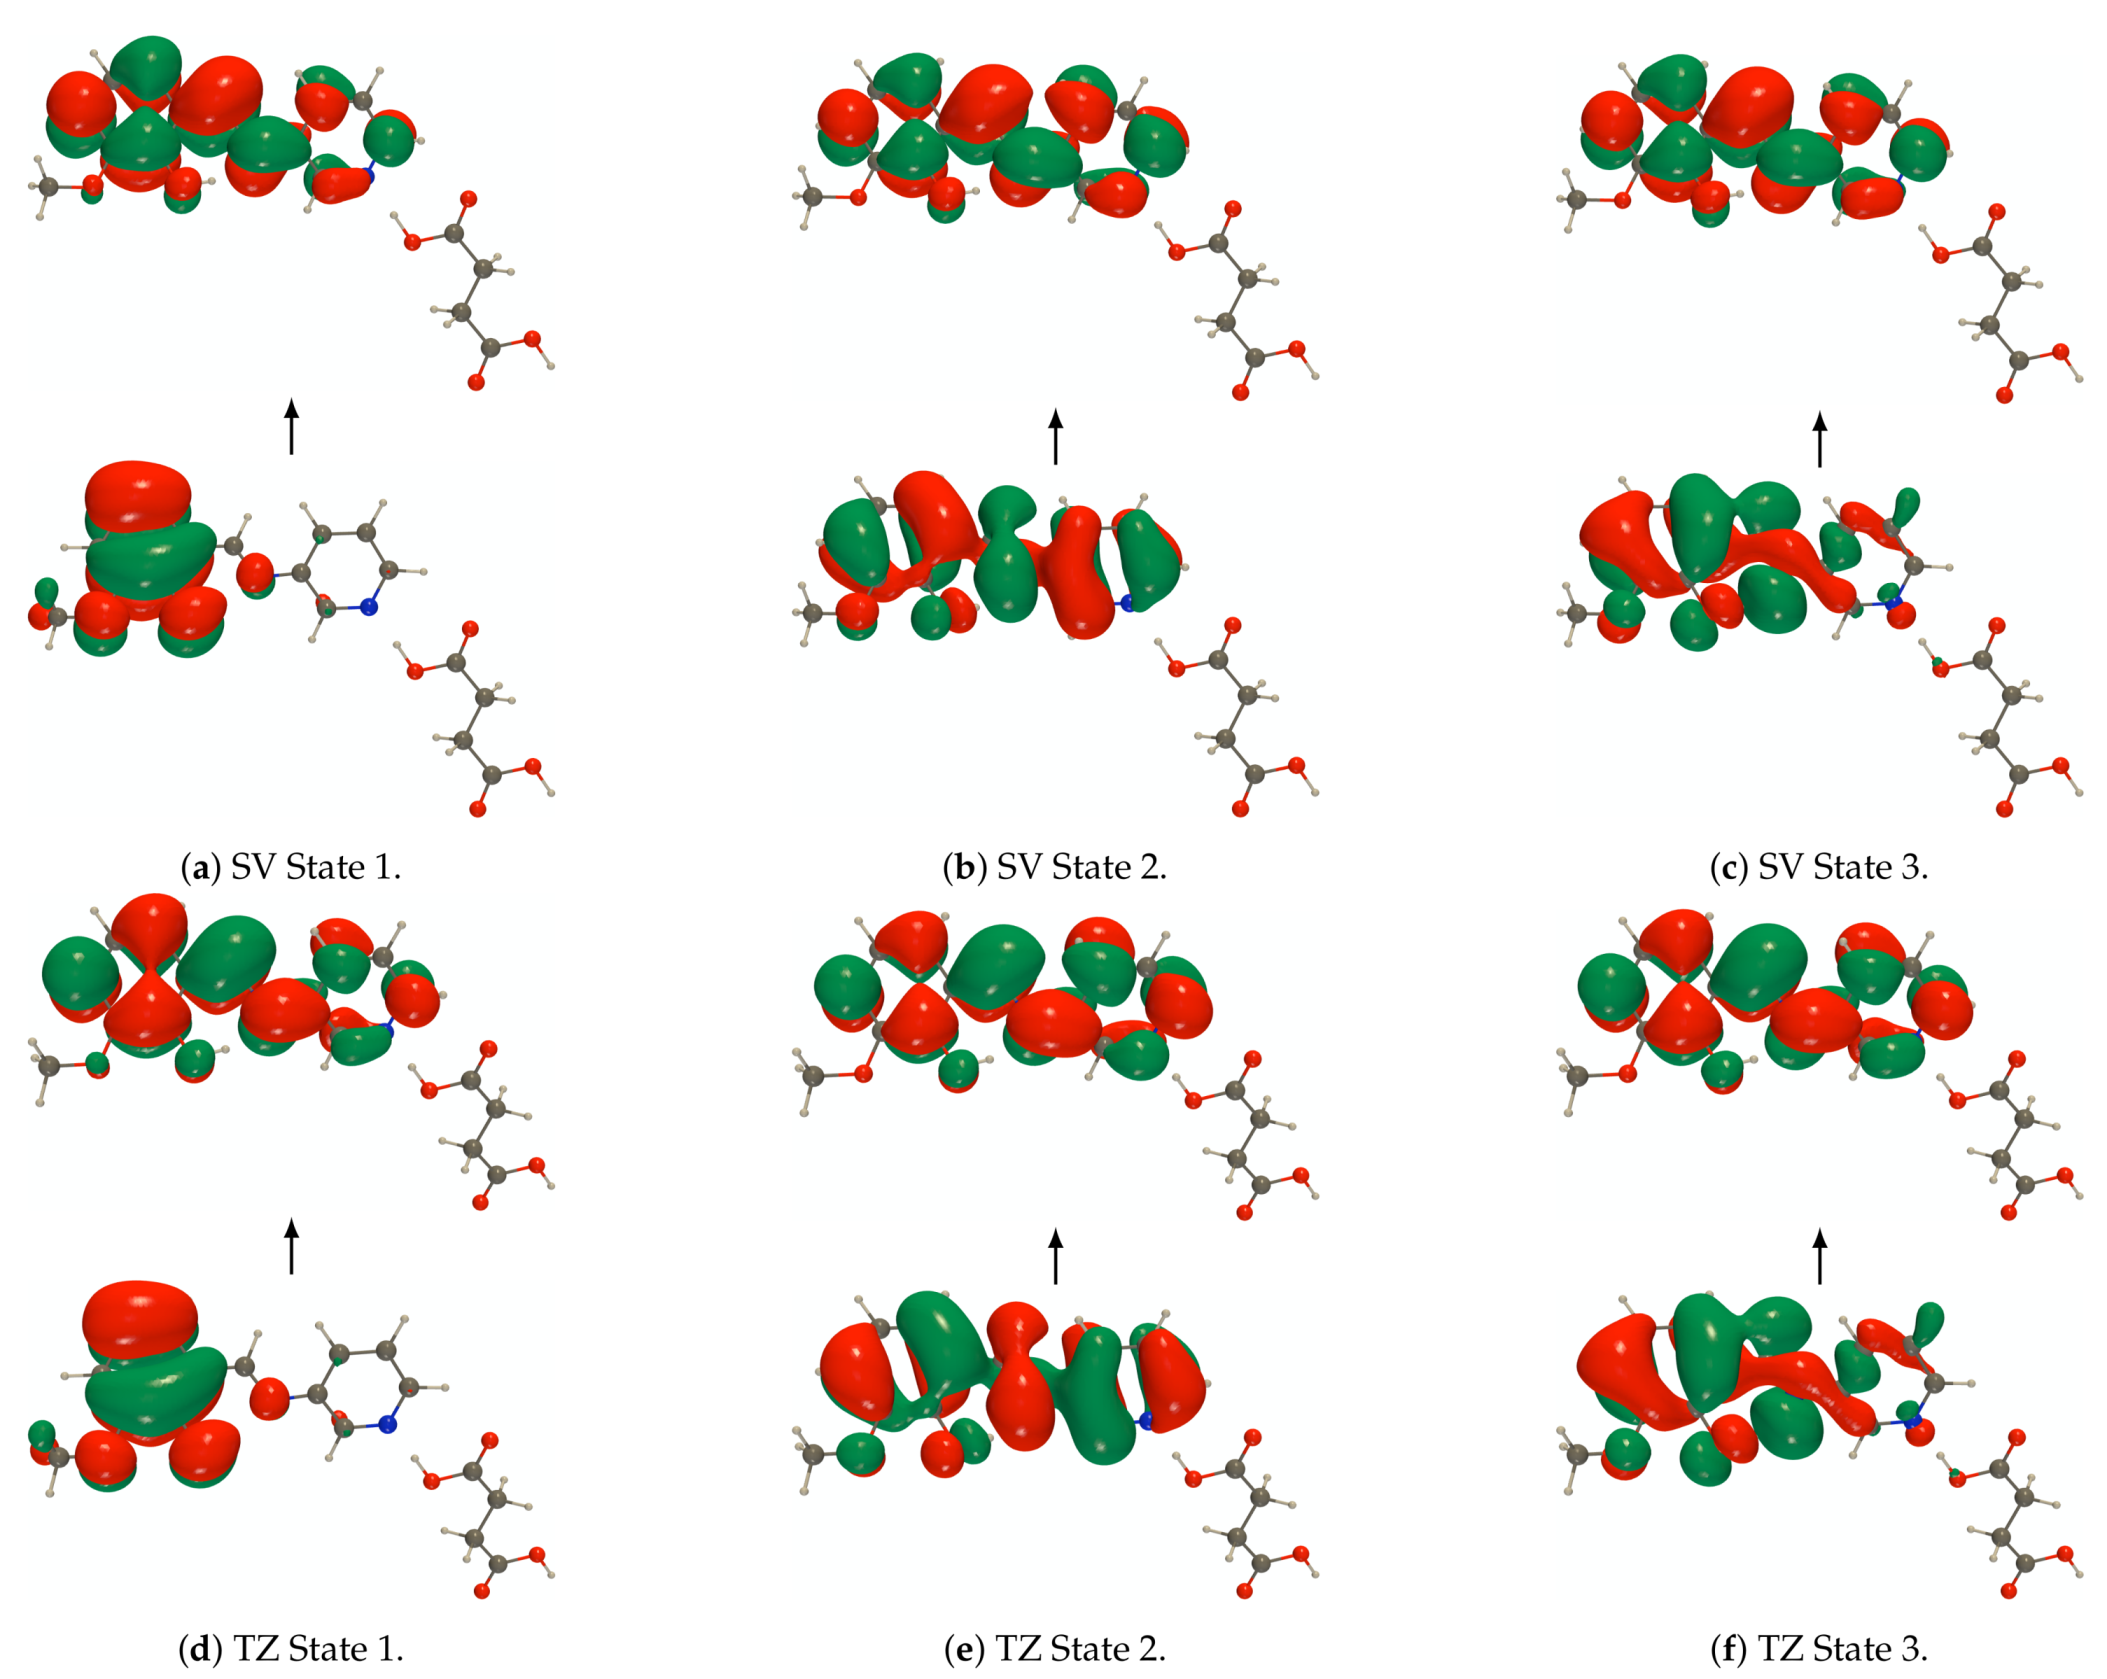
Figure A7.
RI-CC2 def2-SVPD (SV) and def2-TZVPD (TZ) NTOs (holes below the arrows and particles above them, the red (green) lobes are the positive (negative)
ones) of the embedded PYV3 + SA [PYV3 SA] enol form (isovalue of 0.02 a.u.).
Figure A7.
RI-CC2 def2-SVPD (SV) and def2-TZVPD (TZ) NTOs (holes below the arrows and particles above them, the red (green) lobes are the positive (negative)
ones) of the embedded PYV3 + SA [PYV3 SA] enol form (isovalue of 0.02 a.u.).
Figure A8.
RI-CC2 def2-SVPD (SV) and def2-TZVPD (TZ) NTOs (holes below the arrows and particles above them, the red (green) lobes are the positive (negative)
ones) of the embedded PYV3 + SA [PYV3 SA] keto form (isovalue of 0.02 a.u.).
Figure A8.
RI-CC2 def2-SVPD (SV) and def2-TZVPD (TZ) NTOs (holes below the arrows and particles above them, the red (green) lobes are the positive (negative)
ones) of the embedded PYV3 + SA [PYV3 SA] keto form (isovalue of 0.02 a.u.).


