
Computational and Experimental 1H-NMR Study of Hydrated Mg-Based Minerals


1
Department of Organic Material Sciences, Sandia National Laboratories, Albuquerque, NM 87185, USA
2
Department of Geochemistry, Sandia National Laboratories, Albuquerque, NM 87185, USA
*
Author to whom correspondence should be addressed.
Molecules 2020, 25(4), 933; https://0-doi-org.brum.beds.ac.uk/10.3390/molecules25040933
Submission received: 12 November 2019
/
Revised: 13 February 2020
/
Accepted: 14 February 2020
/
Published: 19 February 2020
(This article belongs to the Special Issue Solid-State NMR Spectroscopy in Materials Chemistry)
Abstract
:Magnesium oxide (MgO) can convert to different magnesium-containing compounds depending on exposure and environmental conditions. Many MgO-based phases contain hydrated species allowing 1H-nuclear magnetic resonance (NMR) spectroscopy to be used in the characterization and quantification of proton-containing phases; however, surprisingly limited examples have been reported. Here, 1H-magic angle spinning (MAS) NMR spectra of select Mg-based minerals are presented and assigned. These experimental results are combined with computational NMR density functional theory (DFT) periodic calculations to calibrate the predicted chemical shielding results. This correlation is then used to predict the NMR shielding for a series of different MgO hydroxide, magnesium chloride hydrate, magnesium perchlorate, and magnesium cement compounds to aid in the future assignment of 1H-NMR spectra for complex Mg phases.
1. Introduction
Magnesium oxide (MgO) is used in many engineering applications because of its unique material properties. For example, its high thermal conductivity contributes to its use as a stable refractory material [1], and its structure makes it an ideal basic oxide model [2,3]. MgO has also been used for construction [4,5], optics [6,7], medicine [8,9], fertilizers [10], electronics [11,12], catalysis [13], chemical warfare agent decontamination [14], high temperature super conductors [15], hydrogen storage [16,17], and nuclear waste storage [18,19]. For many of these applications, the performance of MgO depends on property reproducibility that may be impacted by impurities or defects formed from the conversion of MgO to other magnesium-containing phases due to environmental exposure. In many cases, the resulting MgO conversion phases are disordered or amorphous in nature, making their characterization by scattering techniques challenging. For example, our interest is the identification of protonated impurities in MgO [20]: a material that is currently used as an engineered barrier for carbon remediation at the DOE Waste Isolation Pilot Plant (WIPP) located near Carlsbad, New Mexico.
Nuclear magnetic resonance (NMR) spectroscopy is a powerful technique for characterizing disordered solids where diffraction methods may fail. Despite its usefulness, only a few publications have reported solid state 1H-NMR spectra for MgO-based compounds [3,20,21,22,23,24,25,26]. Previous studies noted that the 1H chemical shifts in basic environments are shifted to lower frequencies (~0 ppm), while acidic environments exhibit higher frequency chemical shifts (~4.5 ppm) [27]. In a previous study, at least six different proton environments were observed (but not fully assigned) in nominally pure MgO between 1.2 and −1.8 ppm [3]. Extensive NMR characterization (including 1H-NMR) of hydrous ringwoodite (γ-Mg2SiO4) [28], hydroxyl-clinohumite (4Mg2SiO4·Mg(OH)2) [29], and hydrous wadsleyite (β-Mg2SiO4) have also been published [30,31,32]. Most computational NMR efforts on MgO-related phases have focused on 25Mg and 17O, but for low concentration impurity or defect phases these nuclei can be difficult to address experimentally. There has been at least one thorough computational effort using density functional theory (DFT) to model OH groups on irregularities in MgO surface states [2]. In this work, we report the 1H magic angle spinning (MAS) NMR spectra for a set of MgO-based minerals, which are reaction products of MgO with different environmental constituents. Using computational NMR methods, the correlation between the predicted NMR chemical shielding and the experimental NMR chemical shift is developed to allow 1H-NMR chemical shift referencing in Mg oxide compounds. These computational NMR methods are then extended to develop a starting database of 1H-NMR chemical shifts of proton-containing Mg phases not readily isolated or available.
2. Results and Discussion
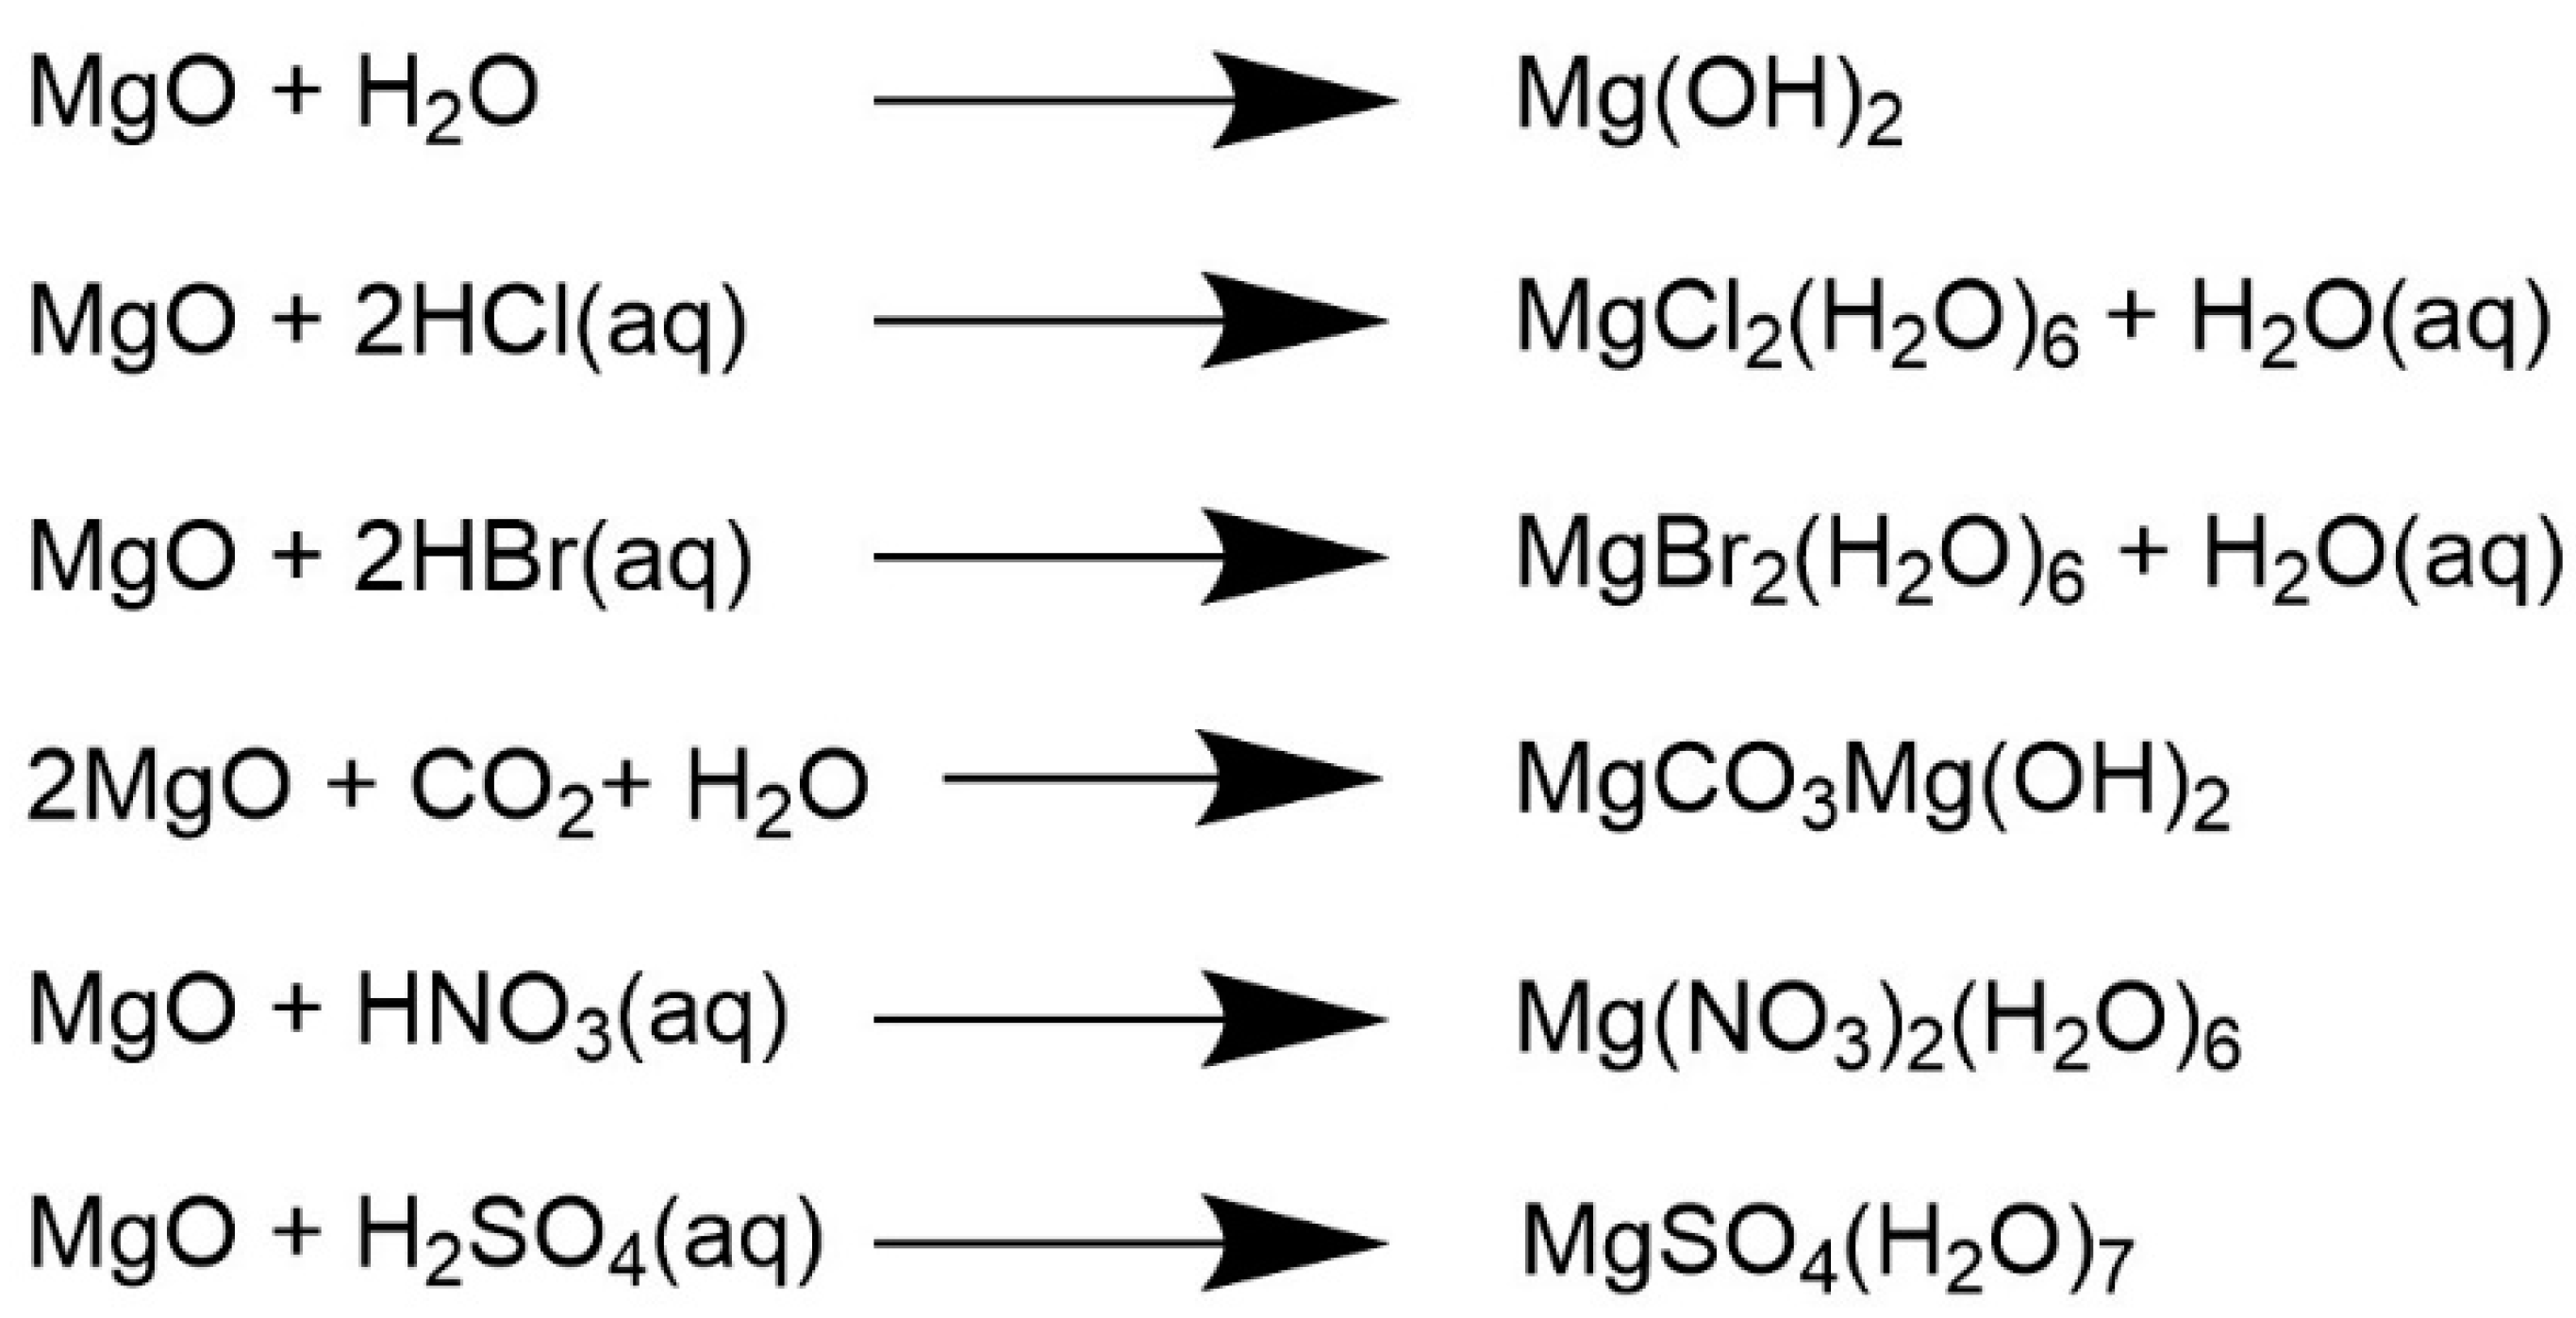
MgO can convert to a variety of different compounds, including naturally occurring minerals, by incorporating new coordinating species during environmental exposure. These include hydroxylated, hydrated, nitrated, and sulfonated magnesium phases derived from either MgO or MgCO3 through simple conversion reactions (Scheme 1). These new Mg-containing species may act as impurities or defects within the original bulk materials, which could ultimately impact the targeted material performance.
2.1. Model Hydroxylated and Hydrated Magnesium Compounds
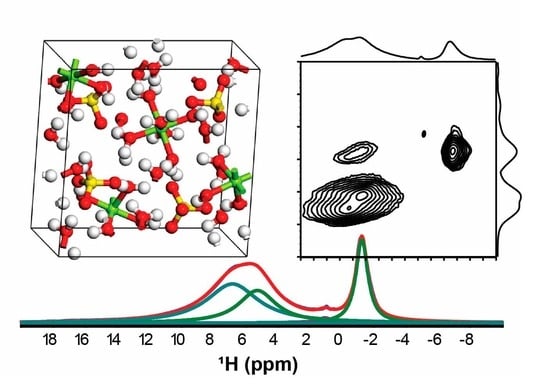
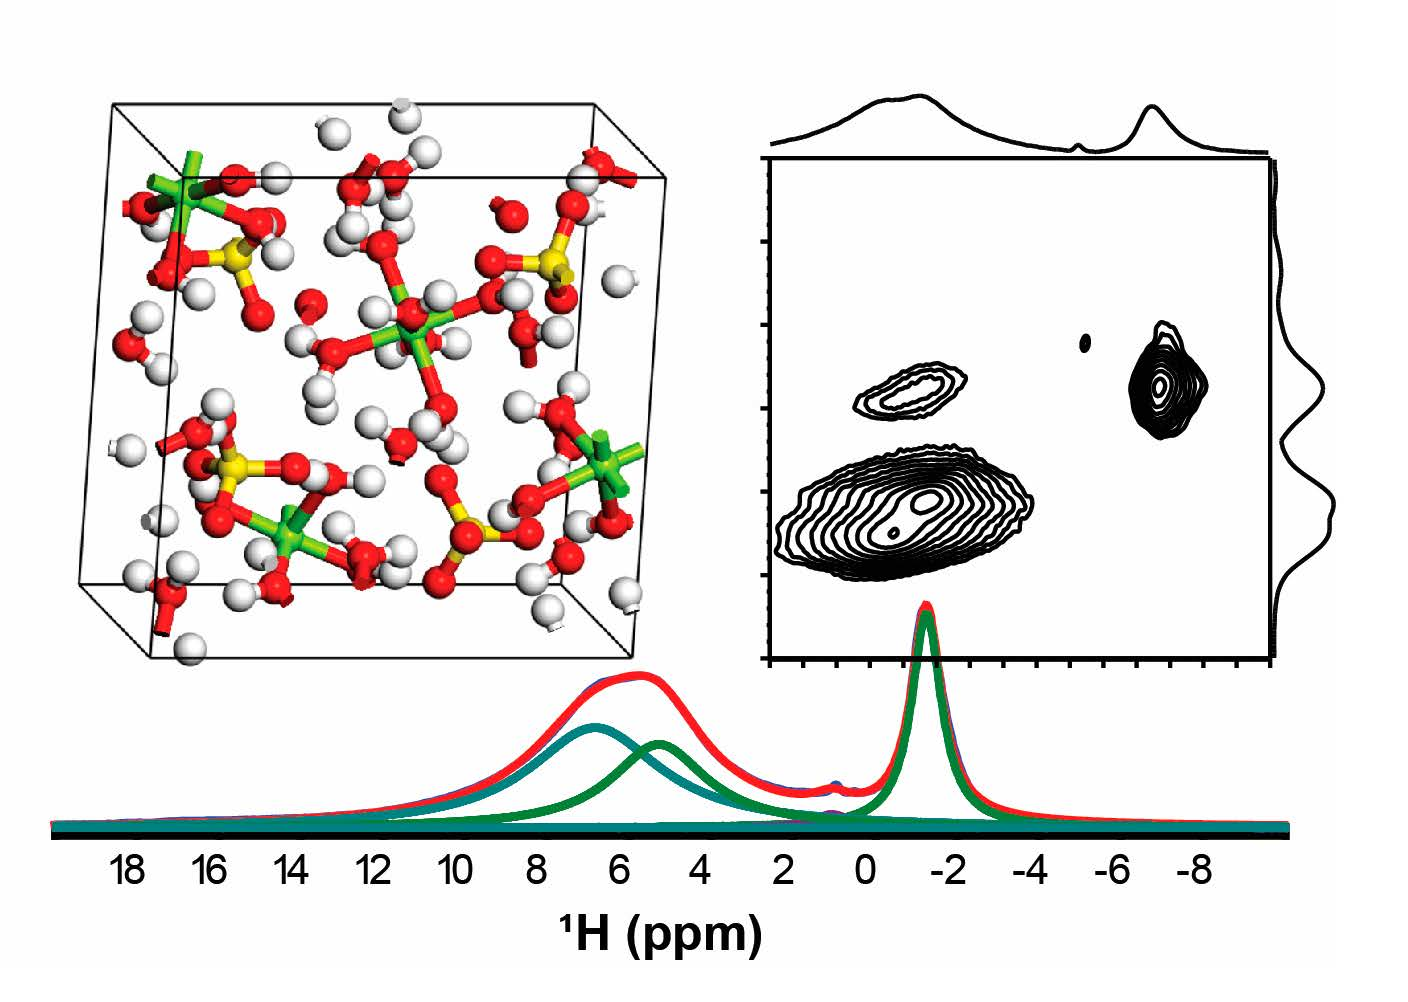
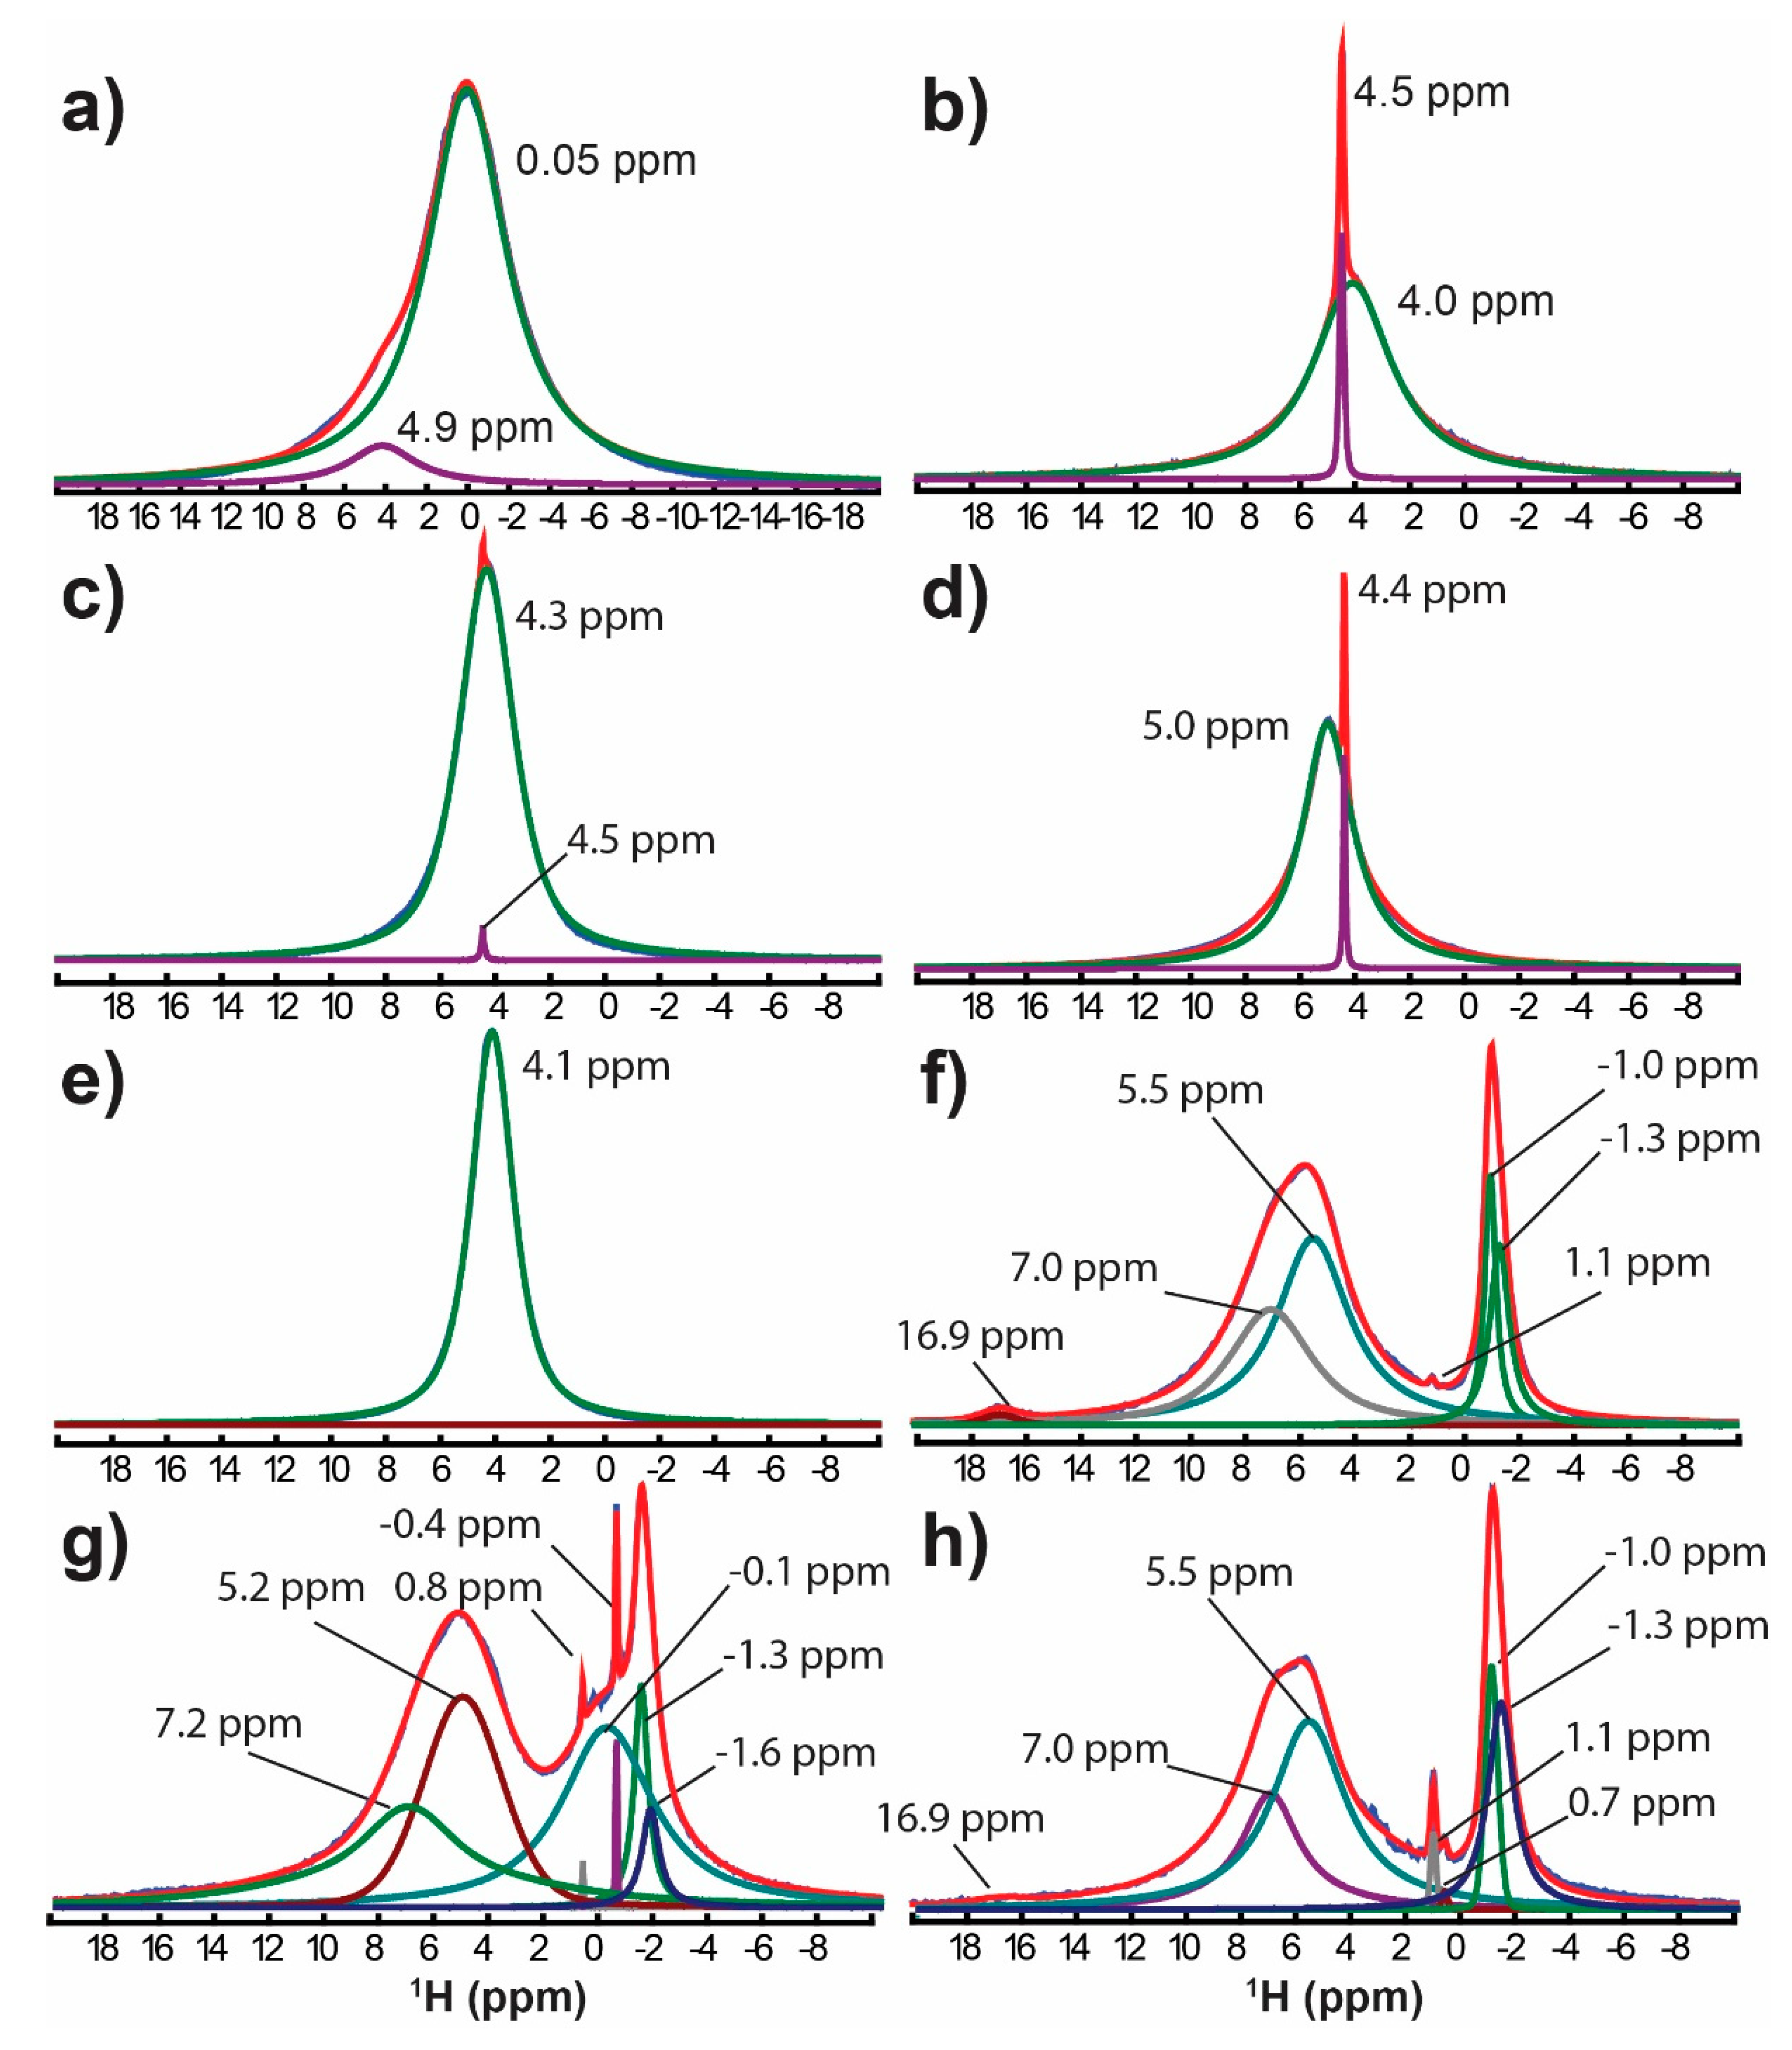
The 1H-MAS-NMR spectra for a series of different Mg minerals is shown in Figure 1 with the experimental chemical shifts summarized in Table 1. Brucite, Mg(OH)2, is formed from the absorption of water by MgO and is a common hydrogen-containing phase observed in environmentally exposed materials [20]. The 1H NMR spectrum of Mg(OH)2 is shown in Figure 1a. The dominant resonance at δ = +0.05 ppm (93%) is assigned to the hydroxyl proton in Mg(OH)2, while the minor resonance at δ = +4.9 ppm (7%) is attributed to a water containing phase in this material. In cement applications, Mg(OH)2 may cause structural expansions inducing stress, cracking, and failure in concrete and is therefore important to identify [5]. Nitromagnesite, MgNO3·6H2O, is a highly water-soluble magnesium salt and can be formed by mixing magnesium sulfate with calcium nitrate, or by simply exposing MgO, Mg(OH)2, or magnesium carbonate (MgCO3) to nitric acid [33]. The 1H-MAS-NMR spectrum of nitromagnesite is shown in Figure 1b, with the major resonance at δ = +4.0 ppm assigned to the bound water protons, while the small sharp resonance at δ = +4.5 ppm results from mobile surface adsorbed water in this sample. Heating nitromagnesite leads to decomposition of the salt rather than dehydrating it, producing undesirable NO3. Bischofite, MgCl2·6H2O, can be formed by the neutralization of dilute HCl by MgO. The 1H-NMR spectrum of bischofite is shown in Figure 1c with the bound water protons observed at δ = +4.3 ppm. The formation of bischofite phases may impact the refractory application of MgO, since MgCl2 has a melting point (987 K) almost three times lower than MgO [33]. Epsomite, MgSO4·7H2O, can be formed by the reaction of MgO with dilute sulfuric acid to produce MgSO4, which is stable in the heptahydrate form up to 48 °C in air and high relative humidity (RH). Above this temperature (or in low RH), dehydration occurs to form the hexahydrate, until finally heating between 200–300 °C produces an anhydrous phase [33]. The loss of water during dehydration changes the crystal structure (i.e., the heptahydrate’s orthorhombic structure evolves to a monoclinic structure in the hexahydrate). The 1H-NMR spectrum of epsomite is shown in Figure 1d, with the bound water proton environment assigned to the δ = +5.0 ppm resonance. A mobile surface adsorbed water environment is observed at δ = +4.4 ppm. Magnesium bromide, MgBr2·6H2O, is produced by reacting MgCO3 with HBr and can form both anhydrous and hexahydrate forms [33]. The 1H-NMR spectrum of the hexahydrate phase is shown in Figure 1d, with the water proton resonance at δ = +4.1 ppm. Magnesium carbonate can exist in many forms, including multiple minerals. The most common is the anhydrous salt magnesite MgCO3. The 1H-NMR spectra of several common hydrated magnesium carbonate salts are shown, including hydromagnesite (4MgCO3·Mg(OH)2·4H2O, Figure 1f, artinite (MgCO3·Mg(OH)2·3H2O, Figure 1g, and dypingite (4MgCO3·Mg(OH)2·5H2O, Figure 1h. These NMR spectra show a hydroxyl proton environment at δ ~ −1.3 ppm along with multiple water proton species between +5.0 and +7.0 ppm. The multiple overlapping water proton environments are further characterized using two-dimensional (2D) double quantum (DQ)-single quantum (SQ) NMR correlation experiments discussed in a later section. The hydroxyl resonance was asymmetric such that two different hydroxyl environments were included to improve the deconvolution of this spectral region. There is no clear resolution of the different hydroxyl environment, though the 2D DQ-SQ NMR correlation experiments also supports the argument of overlapping hydroxyl species. For artinite (MgCO3·Mg(OH)2·3H2O, an additional hydroxyl environment at δ = −0.1 ppm was also observed and is clearly identified in the 2D DQ-SQ correlation experiments (see below). Two different commercial sources of dypingite were analyzed and produced equivalent NMR spectra (Supplementary Materials, Figure S1, electronic supplementary information ESI). An acidic proton at δ = 16.9 ppm was seen for hydromagnesite and dypingite (<1%). Minor unidentified impurity phases between δ = +0.7 and +1.1 ppm were also present [30]. While the NMR spectra for these three carbonates phases are similar, the ratio of the hydroxyl and hydrating water proton concentration might also be used to support the proposed structure. Artinite (MgCO3·Mg(OH)2·3H2O) has the largest [OH]/[H2O] ratio of 2/6 (25%/75%) and compares to the 22%/73% ratio observed experimentally (Figure S3, ESI). Hydromagnesite (4MgCO3·Mg(OH)2·4H2O) should have a [OH]/[H2O] ratio of 2/8 = (20%/80%), which is consistent with the 19%/81% ratio measured (Figure S3). Dypingite (4MgCO3·Mg(OH)2·5H2O has the lowest [OH]/[H2O] ratio of 2/10 (16.7%/83.3%), comparable to the 18%/82% observed. The error inherent in the deconvolution of multiple overlapping resonances, along with the error resulting from differential spin-spin (T2) relaxation on the water and hydroxyl protons and the need to extrapolate to zero echo time (ESI) make assignments based simply on the [OH]/H2O] intensity ratio difficult. Currently, there are no crystal structures available for these hydrated magnesium carbonate phases, but the NMR results reveal the different structural motifs and relative concentrations present.
The experimental NMR results for all the compounds listed in Table 1 represent only two major types of proton environments (hydroxyl and coordinating water) with subtle differences in the coordination environments giving rise to small changes in the 1H-NMR chemical shifts. The very small variations further support the argument that computational NMR efforts are needed to help characterize proton containing magnesium phases (Section 2.2).
Two-Dimensional Double Quantum NMR
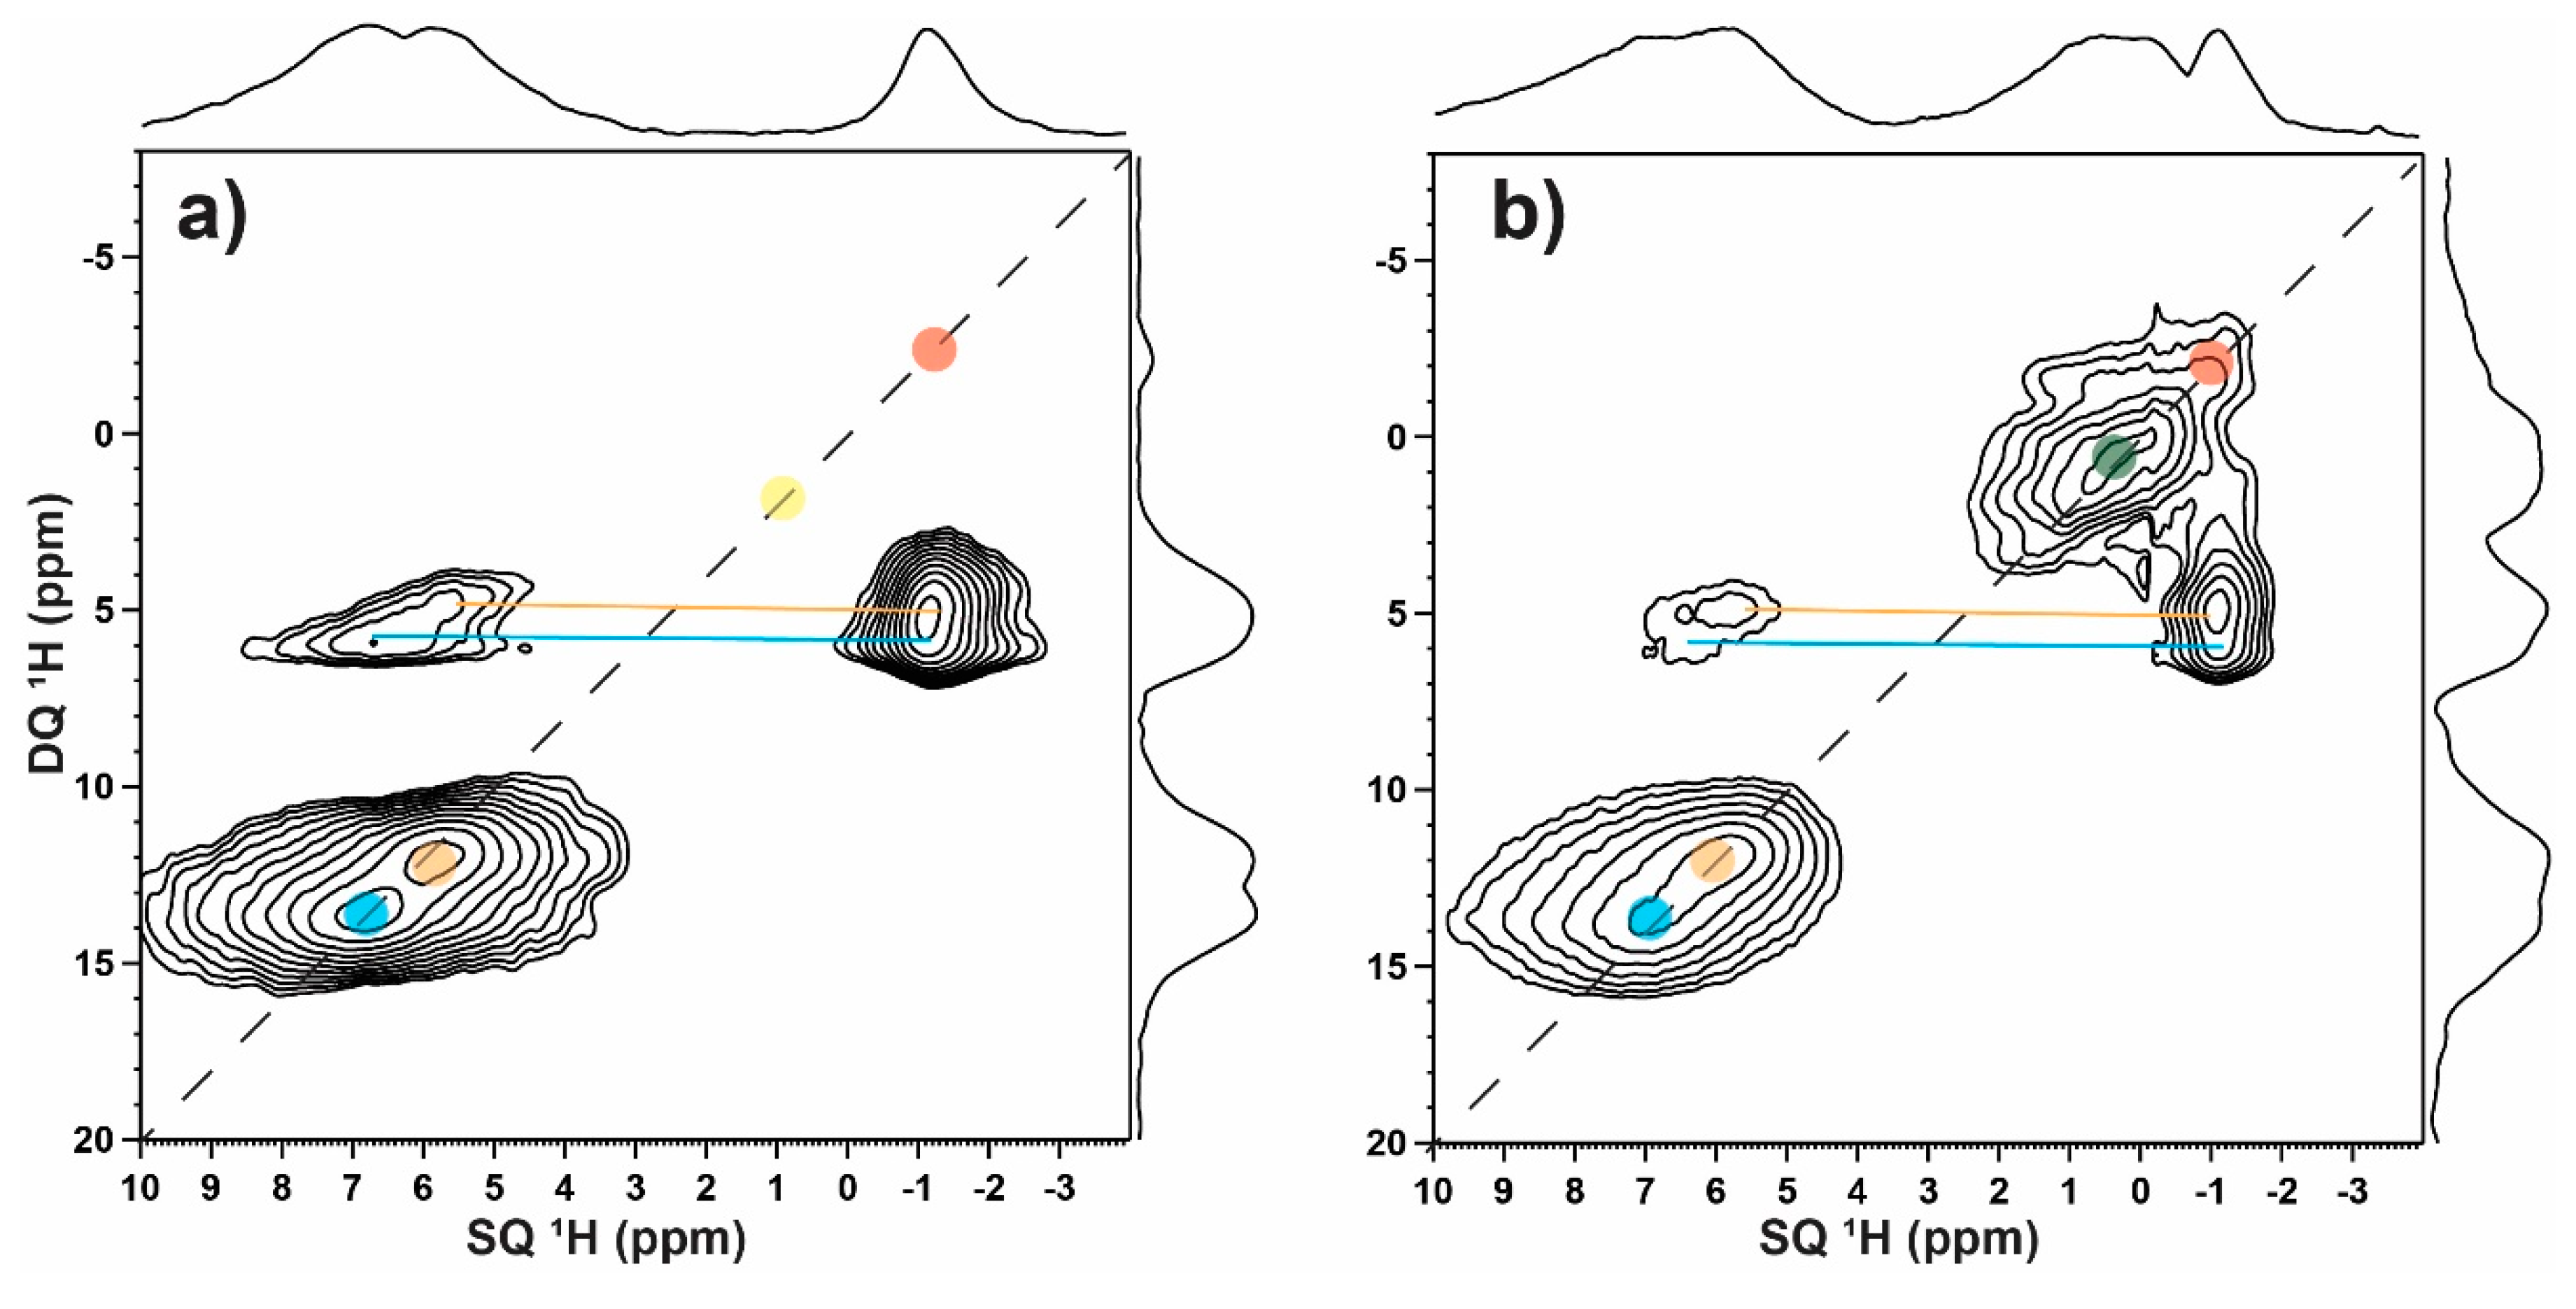
To further characterize the multiple proton environments in the carbonate series 4MgCO3·Mg(OH)2·4H2O, MgCO3·Mg(OH)2·3H2O, and 4MgCO3·Mg(OH)2·5H2O, 2D DQ-SQ NMR correlation spectra were obtained. As an example, Figure 2a is the 2D DQ-SQ NMR spectrum for hydromagnesite (4MgCO3·Mg(OH)2·4H2O), while Figure 2b in the DQ-SQ spectrum for artinitie (MgCO3·Mg(OH)2·3H2O). The 2D DQ-SQ NMR correlation spectrum for dypingite (4MgCO3·Mg(OH)2·5H2O) was very similar to the hydromagnesite spectrum (Figure 2a) and is provided in Figure S2 for comparison (ESI). In these 2D-NMR correlation experiments, cross peaks are observed at spectral frequencies for protons that are spatially near each other with significant 1H-1H dipolar coupling to produce the DQ coherence. Cross peaks on the diagonal (filled circles) are auto-correlation resonances and arise from dipolar coupling (spatially near each other) between equivalent 1H environments. Off diagonal cross peaks (solid lines) result from dipolar coupling between two different 1H environments. The 2D DQ-SQ NMR correlation spectra show multiple cross peaks and allow for improved spectral separation between the different 1H environments.
For hydromagnesite (Figure 2a), two water resonances are more clearly observed at δ = +5.5 ppm and + 7.0 ppm, with both water environments having auto-correlation peaks (solid blue and orange circles). This means that the water protons are spatially close to other water protons in equivalent environments (as expected). There is also some off-diagonal intensity between these two water resonances, suggesting that the water environments are spatially near each other but are not in rapid exchange on the NMR time scale (chemical shift difference). The water and hydroxyl protons (δ = −1.2 ppm) also reveal a strong off-diagonal correlation peak (solid blue and orange lines), confirming that the water and hydroxyl proton environments are spatially near each other (i.e., dipolar coupled). Note that the hydroxyl cross peak reveals slightly different hydroxyl chemical shifts (minor slope in DQ dimension) but is not resolved in the 2D projections or the one dimensional (1D) 1H-MAS-NMR spectra (Figure 1f). The hydroxyl protons (δ ~ −1.3 ppm) also show a weak auto-correlation peak (solid red circle) but can be seen in the DQ projection, demonstrating that these hydroxyl protons have limited spatial interactions with equivalent hydroxyl proton environments. Finally, the small sharp resonance at δ ~ +1 ppm shows a vanishing weak auto-correlation peak (yellow solid circle) but reveals no other cross peaks. This means that this proton environment is spatially near similar protons but is spatially isolated from all the other protons in these materials. A minor isolated unidentified phase has been observed in previous studies on Mg silicates [30,32], while a δ = +1.1 ppm resonance has been reported for hydrous Chondrodite, Mg5Si2O8(OH)2 [25], as well as Talc, Mg3Si4O10(OH)2 [26]. The existence of this auto-correlation peak in the 2D DQ-SQ NMR correlation spectrum also argues that this proton is not simply probe background but is indeed a unique proton containing phase. Similarly, for artinite (Figure 2b), two water environments are observed at δ = 7.1 and δ = + 5.2 ppm with strong auto-correlation peaks (solid blue and orange circles). The off-diagonal cross peaks between the water and hydroxyl protons (δ = −1.4 ppm) are also observed (solid blue and orange lines), confirming these proton environments are spatially near each other. Unique to artinite is the presence of a strong auto-correlation peak neat δ ~0.0 ppm (green circle) arising from isolated hydroxyl protons. The hydroxyl protons are only spatially near equivalent hydroxyl protons (giving rise to an auto-correlation peak) but show no dipolar coupling to water proton environments. This contrasts with the hydromagnesite (Figure 2a) and dypingite (Figure S2) spectra, where the hydroxyl environments are isolated from each other and are instead dipolar coupled to nearby water protons. These 2D 1H-DQ-SQ-NMR correlation experiments reveal how it is possible to improve resolution between different proton species as well as probe the spatial arrangement of the different proton environments.
2.2. Computational 1H-NMR
2.2.1. Chemical Shift Referencing
To compare NMR results, both the experimental and calculated chemical shifts are defined with respect to the isotropic trace of the chemical shielding tensor .
where is the chemical shielding tensor for a reference compound. It has been established that the DFT gauge-including projector augmented wave (GIPAW) method (used here) has a linear relationship between the variation in the experimental and calculated chemical shifts [36], and that and are not necessarily equivalent. This linear variation is given by
This leads to the correlation relationships between the calculated and experimental values for systems where a structure is available
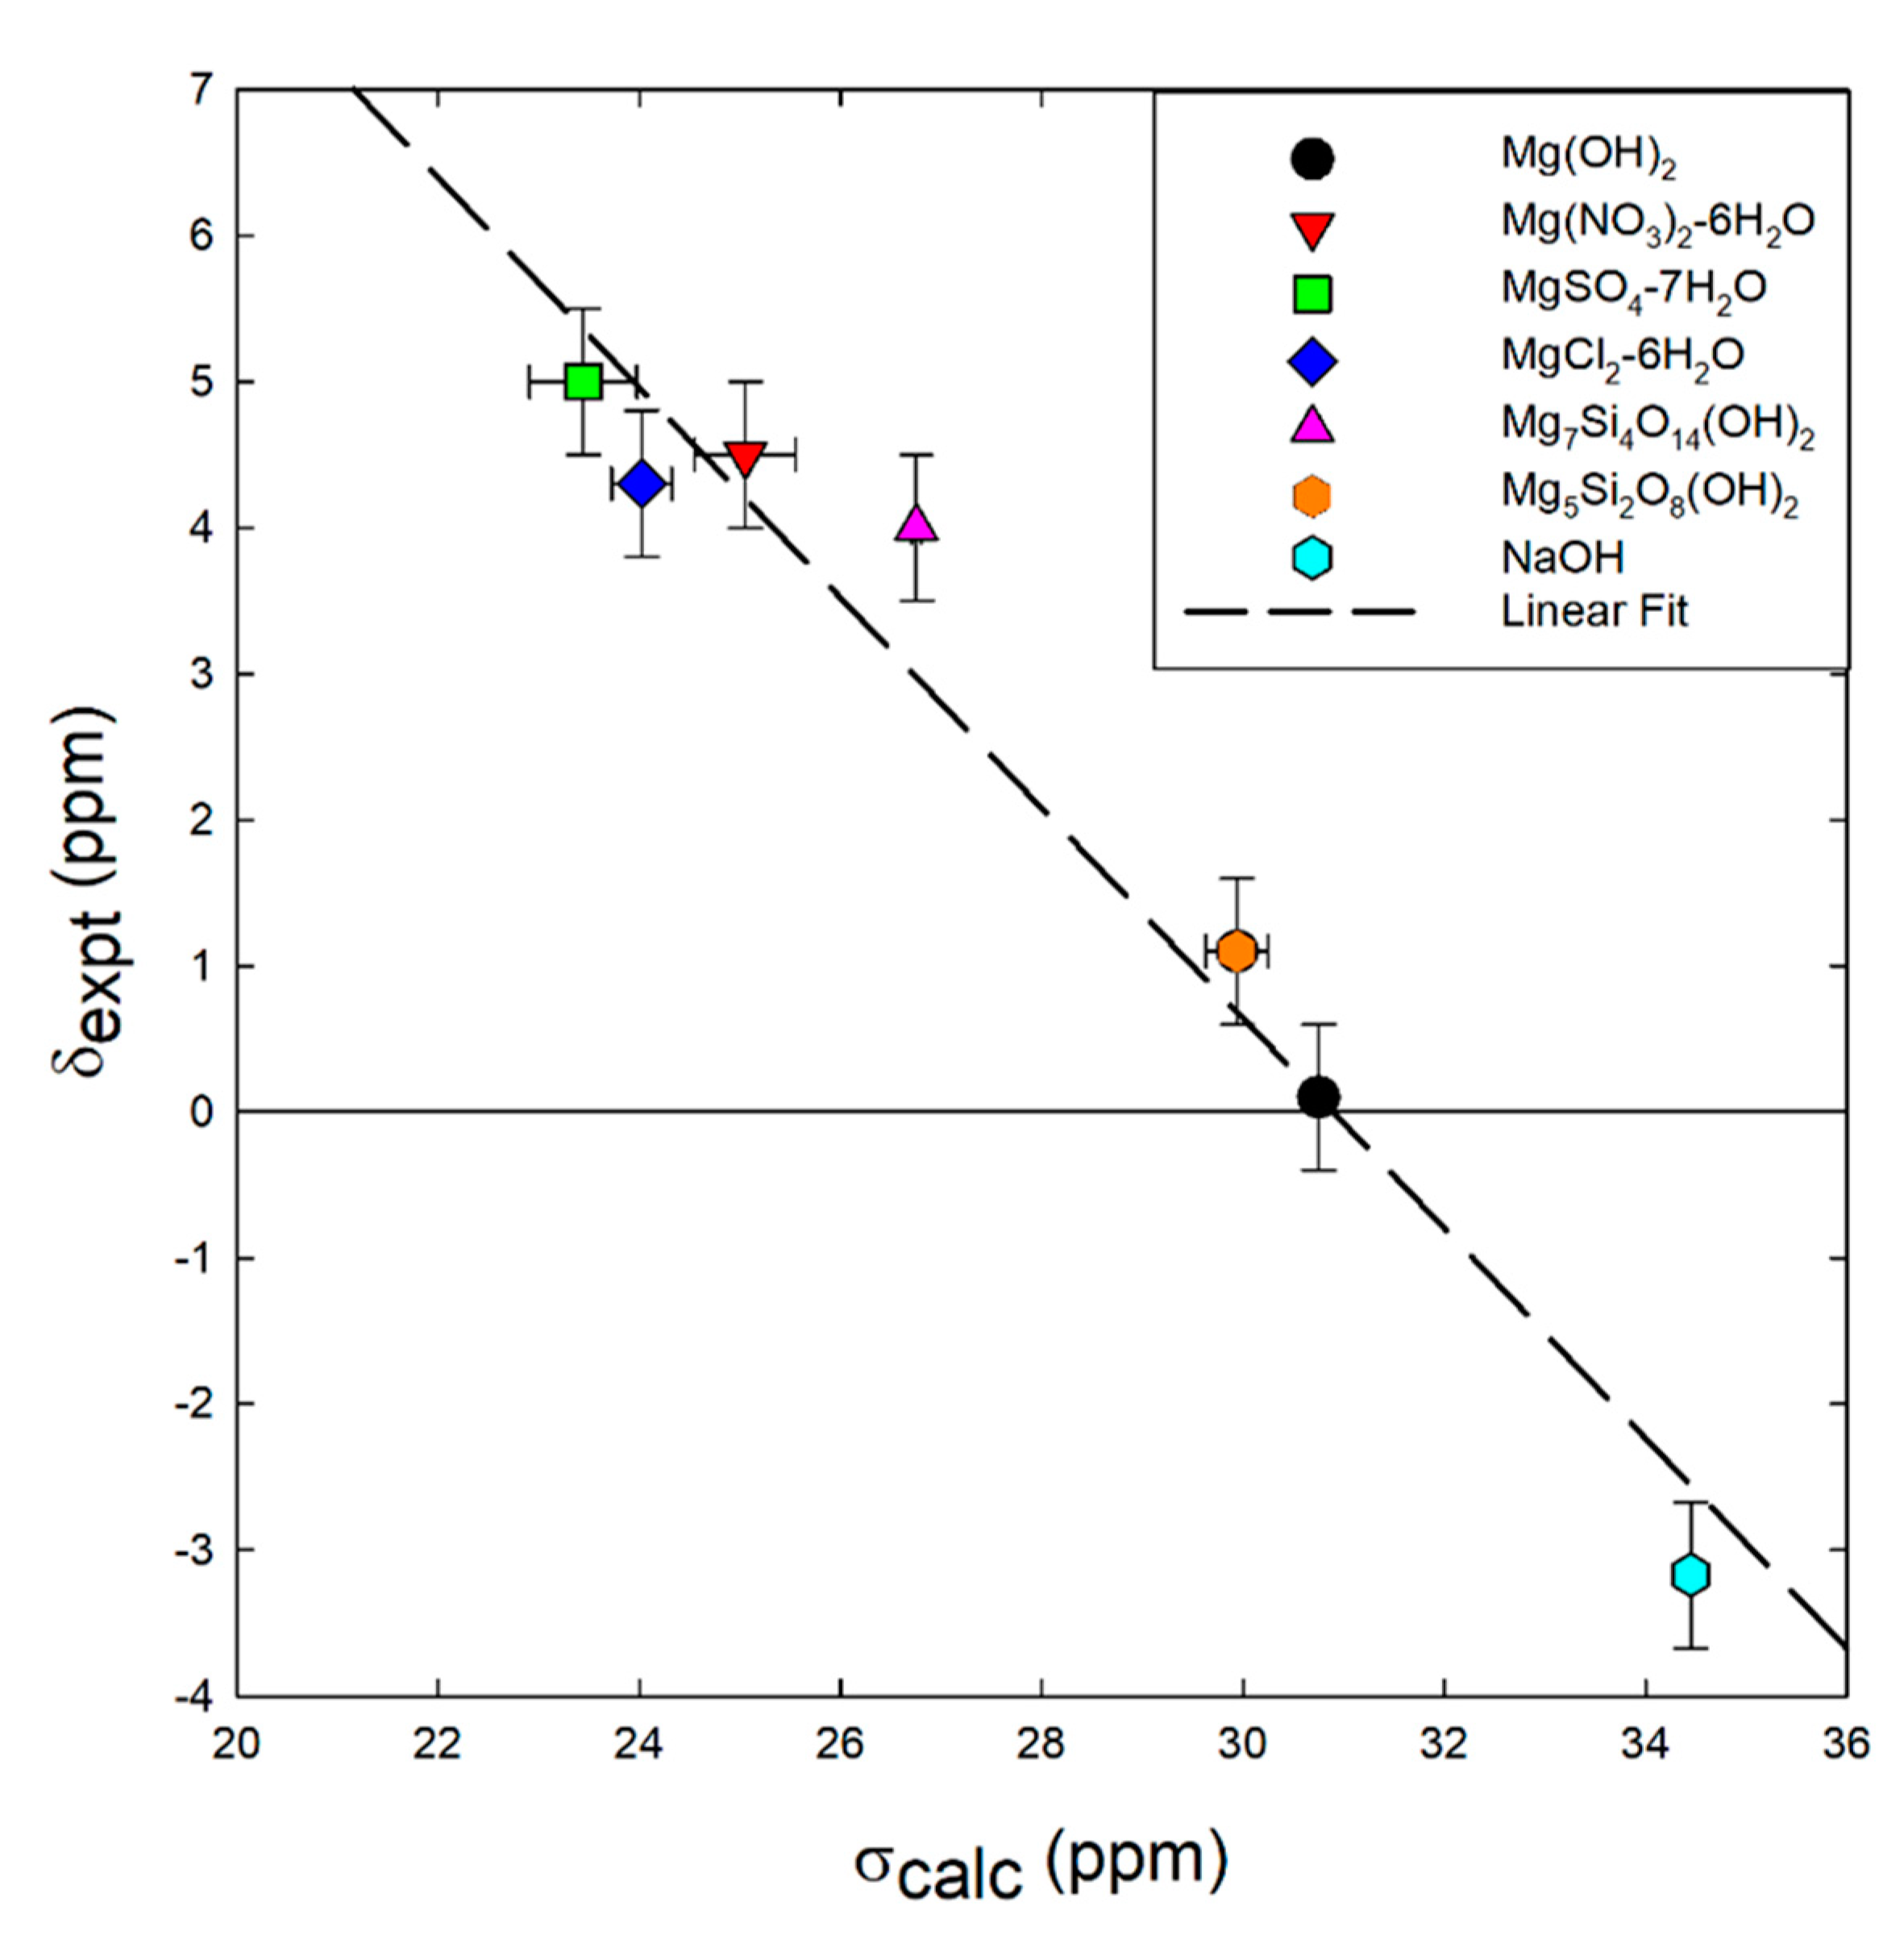
with Because our research interest is the formation of secondary and intermediate phases of MgO during interaction with water [20], we have focused on reference compounds containing both Mg and either OH- or H2O components. NaOH was included because, in some applications, exposure to sodium chloride containing solutions (e.g., ground or seawater) may allow for the formation of solid NaOH during the MgO hydration reaction. For calibration of the chemical shift referencing, MgCl2·6H2O (bischofite), Mg(OH)2 (brucite), MgSO4·7H2O (epsomite), Mg7Si4O14(OH)2 (wadsleyite), MgNO3·6H2O (nitromagnesite), OH-chondrodite (Mg5Si2O8(OH)2), and crystalline NaOH were used. See structural snapshots of selected Mg minerals in Figure 3. The experimental 1H-MAS-NMR chemical shifts along with the computed average chemical shieldings are included in Table 1 (bold) and are plotted in Figure 4. Table S1 provides the complete list of predicted 1H-NMR chemical shieldings and shifts for the reference compounds. The range from −3.2 ppm (NaOH) to +5.0 ppm (MgSO4·7H2O), while the range from +34.5 to +22.9 ppm. Using Equation (3), α = 0.701, = 21.52 ppm, and = 30.7 ppm. This compares well with the of + 31.0 ppm reported based on referencing to the single Mg(OH)2 chemical shift [31], and to the +29.76 ppm and +29.59 ppm recently reported for semi- and fully-hydrated wadsleyite [32]. In the future, this chemical shielding correlation could be improved by including experimental NMR for additional compounds with an isolated hydroxyl proton environment (δ < 0 ppm).
Additionally, the selected reference compounds include hydrogen bond lengths from 1.62Å (nitromagnesite and bischofite) to 2.53Å (brucite). The relationship between hydrogen bond length (OH…O) and δ has been previously noted by Pourpoint et al. [37] and Xue and Kanzaki [38], with increasing hydrogen bond lengths resulting in a decrease in the calculated δ value. Our results indicate the same trend (Figure 5) and compounds with isolated hydroxyls exhibit lower δ values than those that contain molecular water. Because the referenced compounds include such a large range of hydrogen bonding lengths, the fitting discussed above can be applied to a variety of materials with proton containing phases.
2.2.2. Predicted Chemical Shifts for Hydrogen Containing MgO Phases
In addition to the MgO minerals used for the development of the chemical shift/shielding correlation above (Figure 4), the predicted 1H-NMR chemical shielding and chemical shifts of multiple Mg-O-H, Mg-Cl-O-H, and Na-O-H phases are shown in Table 2. These compounds have all been suggested as conversion species of MgO and therefore could be probed by 1H-MAS-NMR. Unfortunately, samples of these phases were not readily available, precluding experimental measurements of their chemical shifts. As expected, 1H chemical shifts of the Mg hydroxides are predicted to fall into a very narrow range between δ = 0.0 and +0.8 ppm, while the MgCl2 hydrate water protons have chemical shifts that are predominantly in the δ = +4.0 to +5.0 range. The 1H environments in the Mg perchlorates are predicted to have unique chemical shifts in the δ ~ +3 ppm range. The Mg-cements and layered NaOH compounds are predicted to have very complex and rich chemical shift signatures ranging from δ = −2.3 to 11.6 ppm. The small 1H chemical shifts ranges will make it difficult to uniquely identify a given phase based simply on 1D 1H-NMR spectra, but 2D NMR correlation experiments will improve the resolution while also providing the means to identify the multiple 1H environments arising from a single compound. These results also allow one to quantify the different general proton environments (i.e., hydroxyl, hydrating water, acidic, etc.) that exist in a material. It is hoped that future research into different MgO phases may benefit from these calculated 1H-NMR shieldings and shifts for spectral assignment.
3. Materials and Methods
3.1. Materials
Mg-based compounds were used as-received except where otherwise stated with the purity provided by the vendor. Reagent grade brucite Mg(OH)2, (Sigma Aldrich, St. Louis, MO, USA, 95% pure) was acquired in 2011 and had been stored under laboratory conditions. Prior to the NMR analysis, the brucite was dried under vacuum in the presence of P2O5 for 24 h. Nitromagnesite MgNO3·6H2O (Fisher Scientific, Waltham, MA, USA, 98% pure), bischofite MgCl2·6H2O (Sigma Aldrich, 98% pure), epsomite MgSO4·7H2O (Sigma Aldrich, >98% pure), magnesium bromide MgBr2·6H2O (Alfa Aesar, Haverhill, MA, USA, >98% pure), hydromagnesite 4MgCO3·Mg(OH)2·4H2O (Alfa Aesar, 99.996% pure), artinite MgCO3·Mg(OH)2·3H2O (Arcos Organics, 98% pure), and dypingite 4MgCO3·Mg(OH)2·5H2O (Sigma Aldrich and Fisher Scientific for vendor comparison, >98% pure) were used as received without further purification.
3.2. Experimental NMR
The solid state 1H- magic angle spinning (MAS) NMR experiments were performed on a Bruker Avance III spectrometer (Bruker, Billerica, MA, USA) at a proton observation frequency of 600.1 MHz, using a 2.5 mm broadband MAS probe spinning at 30 kHz. Spectra were obtained using a rotor-synchronized Hahn Echo pulse sequence with a 4 s recycle delay and a π/2 pulse length of 2.5 µs. To assure quantitative spectra, the recycle delay was chosen to allow for complete spin lattice (T1) relaxation. To correct for the impact of spin-spin relaxation (T2) on the Hahn Echo spectra, the signal intensity for the zero-time echo delay (τ = 0) was obtained from the S(τ) versus τ correlations, as shown in Figure S3. For the samples reported here, the impact of differential T2 relaxation was most notable when comparing multiple water and hydroxyl environments, such as observed in the Mg carbonate series of materials. Due to frictional heating, the sample temperature was nominally 325 K. The 2D DQ-SQ 1H-MAS-NMR correlation spectra were obtained at a 25 kHz spinning speed using an offset compensated back-to-back (BaBa) multiple pulse sequence for excitation and reconversion of the multiple quantum coherences [39], using a single rotor-period rotor period excitation (τDQ = 40 μs, Nc = 1), with phase-sensitive detection in the F1 dimension via the States time-proportional phase incrementation method. 1H-NMR chemical shifts were referenced to the secondary standard adamantane (δ = +0.8 ppm) with respect to TMS (δ = 0 ppm). The DMFIT software was used for all NMR spectral deconvolutions [40].
3.3. Computational NMR
Crystal structures were imported from the Crystallography Open Database (COD) [41], and structural relaxation was performed using periodic density functional theory (DFT) calculations with the Quantum Espresso [42] open source electronic structure code. Norm-conserving pseudopotentials [43] with the generalized gradient approximation in the form of Perdew, Burke, and Ernzerhof (PBE) [44] were implemented. An energy cut-off of 90 Ry and a 6x6x6 k-point matrix were used with high levels of convergence (total energy convergence threshold = 4 × 10⁻⁸, force convergence threshold = 2 × 10⁻⁵, self-consistent energy threshold = 1 × 10⁻¹⁰). Dispersion corrections were not included in the simulations. Tests indicated that the computational 1H-NMR isotropic chemical shifts were not impacted by the dispersion correction, changing between 0.1 to 0.5 ppm for the crystal structures studied here when it was included. For the initial identification of low-energy structures, the lattice parameters were changed iteratively to identify the lowest energy structure, which was then used as the starting point for a variable cell relaxation. Computational NMR chemical shifts were calculated using the gauge-including projector augmented wave (GIPAW) method [45], which has been proven successful at investigating 1H-NMR chemical shifts in proton containing MgO phases [2,23,46]. Refer to [47,48] for a more thorough description of the GIPAW method and its application to different oxide and ceramic systems. Absolute shielding tensors for the computational crystalline systems were calculated from fully converged all-electron calculations.
4. Conclusions
The 1H-MAS-NMR spectra of crystalline Mg-based phases was combined with periodic DFT NMR calculations to produce a correlation between the computed chemical shielding tensor and the experimental chemical shift to be used for referencing hydroxylated and hydrated Mg materials. This correlation was used to predict 1H-NMR chemical shifts for multiple Mg- and Na-based proton containing phases that have been proposed in literature, as a demonstration that computational NMR methods provide a powerful tool for the assignment of solid state 1H-NMR spectra. The small 1H chemical shifts range for these materials and significant spectral overlap hampers the identification of unique species in complex phases, but the development of very high-speed MAS-NMR and improved homonuclear decoupling techniques will continue to improve spectral resolution. In addition, the introduction of 2D heteronuclear NMR correlation experiments (1H-17O, 1H-23Na etc.) would also prove beneficial in separating different proton species in complex proton containing Mg phases and is being pursued.
Supplementary Materials
The following are available online, Figure S1: 1H-MAS-NMR spectra of dypingite from two different commercial sources, Figure S2: 2D DQ-SQ 1H-MAS-NMR correlation experiments for dypingite, Figure S3: The variation of water and hydroxyl intensity for the Mg carbonate series of minerals, Table S1: Computational 1H-NMR chemical shieldings (σ) and chemical shifts (δ) for 7 proton containing reference structures along with the atomic coordinates for reference minerals: brucite, nitromagnesite, epsomite, bischofite, wadsleyite, OH-chondrodite, and sodium hydroxide.
Author Contributions
Project conceptualization, J.M.R. and T.M.A.; methodology, E.G.S.; software, J.M.R.; formal analysis, E.G.S., T.M.A., and J.M.R.; NMR investigation, E.G.S., and T.M.A.; NMR calculations, J.M.R.; resources, T.M.A. and J.M.R.; data curation, E.G.S., J.M.R. and T.M.A.; writing—original draft preparation, E.G.S. and T.M.A.; writing—review and editing, T.M.A. and J.M.R.; project administration, T.M.A.; funding acquisition, J.M.R. All authors have read and agreed to the published version of the manuscript.
Funding
This work was fully supported by the Laboratory Directed Research and Development (LDRD) program of Sandia National Laboratories.
Acknowledgments
Sandia National Laboratories is a multi-mission laboratory managed and operated by National Technology and Engineering Solutions of Sandia, LLC., a wholly owned subsidiary of Honeywell International, Inc., for the U.S. Department of Energy’s National Nuclear Security Administration under contract DE-NA0003525. This paper describes objective technical results and analysis. Any subjective views or opinions that might be expressed in the paper do not necessarily represent the views of the U.S. Department of Energy or the United States Government.
Conflicts of Interest
The authors declare no conflict of interest.
References
- Amaral, L.; Oliveira, I.; Salomao, R.; Frollini, E.; Pandolfelli, V. Temperature and Common-Ion Effect on Magnesium Oxide (MgO) Hydration. Ceram. Int. 2010, 36, 1047–1054. [Google Scholar] [CrossRef]
- Chizallet, C.; Costentin, G.; Lauron-Pernot, H.; Che, M.; Bonhomme, C.; Maquet, J.; Delbecq, F.; Sautet, P. Study of the Structure of OH Groups on MgO by 1D and 2D 1H MAS NMR Combined with DFT Cluster Calculations. J. Phys. Chem. C 2007, 111, 18279–18287. [Google Scholar] [CrossRef]
- Chizallet, C.; Costentin, G.; Lauron-Pernot, H.; Maquet, J.; Che, M. 1H MAS NMR Study of the Coordination of Hydroxyl Groups Generated Upon Adsorption of H2O and CD3OH on Clean MgO Surfaces. Appl. Catal. A 2006, 307, 239–244. [Google Scholar] [CrossRef]
- Arenas, C.G.; Marrero, M.; Leiva, C.; Solís-Guzmán, J.; Arenas, L.F.V. High Fire Resistance in Blocks Containing Coal Combustion Fly Ashes and Bottom Ash. Waste Manag. 2011, 31, 1783–1789. [Google Scholar] [CrossRef] [PubMed]
- Liu, Z.; De Schutter, G.; Deng, D.; Yu, Z. Micro-Analysis of the Role of Interfacial Transition Zone in “Salt Weathering” on Concrete. Constr. Build. Mater. 2010, 24, 2052–2059. [Google Scholar] [CrossRef]
- Stankic, S.; Müller, M.; Diwald, O.; Sterrer, M.; Knözinger, E.; Bernardi, J. Size-Dependent Optical Properties of MgO Nanocubes. Angew. Chem. Int. Ed. 2005, 44, 4917–4920. [Google Scholar] [CrossRef]
- Abrinaei, F. Nonlinear Optical Response of Mg/MgO Structures Prepared by Laser Ablation Method. J. Eur. Opt. Soc. Rapid Publ. 2017, 13, 15. [Google Scholar] [CrossRef] [Green Version]
- Ponnuvelu, D.V.; Selvaraj, A.; Suriyaraj, S.P.; Selvakumar, R.; Pulithadathail, B. Ultrathin Hexagonal MgO Nanoflakes Coated Medical Textiles and Their Enhanced Antibacterial Activity. Mater. Res. Express 2016, 3, 105005. [Google Scholar] [CrossRef]
- Bindhu, M.R.; Umadevi, M.; Kavin Micheal, M.; Arasu, M.V.; Abdullah Al-Dhabi, N. Structural, Morphological and Optical Properties of MgO Nanoparticles for Antibacterial Applications. Mater. Lett. 2016, 166, 19–22. [Google Scholar] [CrossRef]
- Senbayram, M.; Gransee, A.; Wahle, V.; Thiel, H. Role of Magnesium Fertilisers in Agriculture: Plant–Soil Continuum. Crop. Pasture Sci. 2015, 66, 1219–1229. [Google Scholar] [CrossRef]
- Hayashi, K.; Matsuishi, S.; Kamiya, T.; Hirano, M.; Hosono, H. Light-Induced Conversion of an Insulating Refractory Oxide into a Persistent Electronic Conductor. Nature 2002, 419, 462–465. [Google Scholar] [CrossRef] [PubMed]
- Kim, J.; Gila, B.; Mehandru, R.; Johnson, J.W.; Shin, J.H.; Lee, K.P.; Luo, B.; Onstine, A.; Abernathy, C.R.; Pearton, S.J.; et al. Electrical Characterization of GaN Metal Oxide Semiconductor Diodes Using MgO as the Gate Oxide. J. Electrochem. Soc. 2002, 149, G482–G484. [Google Scholar] [CrossRef]
- Selvamani, T.; Sinhamahapatra, A.; Bhattacharjya, D.; Mukhopadhyay, I. Rectangular MgO Microsheets with Strong Catalytic Activity. Mater. Chem. Phys. 2011, 129, 853–861. [Google Scholar] [CrossRef]
- Singh, B.; Prasad, G.K.; Pandey, K.S.; Danikhel, R.K.; Vijayaraghavan, R. Decontamination of Chemical Warfare Agents. Def. Sci. J. 2010, 60, 428–441. [Google Scholar] [CrossRef]
- Yang, P.; Lieber, C.M. Nanorod-Superconductor Composites: A Pathway to Materials with High Critical Current Densities. Science 1996, 273, 1836–1840. [Google Scholar] [CrossRef]
- Wan, L.F.; Liu, Y.-S.; Cho, E.S.; Forster, J.D.; Jeong, S.; Wang, H.-T.; Urban, J.J.; Guo, J.; Prendergast, D. Atomically Thin Interfacial Suboxide Key to Hydrogen Storage Performance Enhancements of Magnesium Nanoparticles Encapsulated in Reduced Graphene Oxide. Nano Lett. 2017, 17, 5540–5545. [Google Scholar] [CrossRef]
- Mojica-Sánchez, J.P.; Zarate-López, T.I.; Flores-Álvarez, J.M.; Reyes-Gómez, J.; Pineda-Urbina, K.; Gómez-Sandoval, Z. Magnesium Oxide Clusters as Promising Candidates for Hydrogen Storage. Phys. Chem. Chem. Phys. 2019, 21, 23102–23110. [Google Scholar] [CrossRef]
- Helton, J.; Anderson, D.; Jow, H.-N.; Marietta, M.; Basabilvazo, G. Performance Assessment in Support of the 1996 Compliance Certification Application for the Waste Isolation Pilot Plant. Risk Anal. 1999, 19, 959–986. [Google Scholar] [CrossRef]
- Xiong, Y.; Deng, H.; Nemer, M.; Johnsen, S. Experimental Determination of the Solubility Constant for Magnesium Chloride Hydroxide Hydrate (Mg3Cl(OH)5·4H2O, phase 5) at Room Temperature, and its Importance to Nuclear Waste Isolation in Geological Repositories in Salt Formations. Geochim. Cosmochim. Acta 2010, 74, 4605–4611. [Google Scholar] [CrossRef]
- Rimsza, J.M.; Sorte, E.G.; Alam, T.M. Hydration and Hydroxylation of MgO in Solution: NMR Identification of Proton-Containing Intermediate Phases. ACS Omega 2019, 4, 1033–1044. [Google Scholar] [CrossRef]
- Aramendía, M.A.; Benítez, J.A.; Borau, V.; Jiménez, C.; Marinas, J.M.; Ruiz, J.R.; Urbano, F. Study of MgO and Pt/MgO Systems by XRD, TPR, and 1H MAS NMR. Langmuir 1999, 15, 1192–1197. [Google Scholar] [CrossRef]
- Aramendía, M.A.; Benítez, J.A.; Borau, V.; Jiménez, C.; Marinas, J.M.; Ruiz, J.R.; Urbano, F. Characterization of Various Magnesium Oxides by XRD and 1H MAS NMR Spectroscopy. J. Solid State Chem. 1999, 144, 25–29. [Google Scholar] [CrossRef]
- Chizallet, C.; Petitjean, H.; Costentin, G.; Lauron-Pernot, H.; Maquet, J.; Bonhomme, C.; Che, M. Identification of the OH Groups Responsible for Kinetic Basicity on MgO Surfaces by 1H MAS NMR. J. Catal. 2009, 268, 175–179. [Google Scholar] [CrossRef]
- Xue, X.; Kanzaki, M.; Shatskiy, A. Dense Hydrous Magnesium Silicates, Phase D, and Superhydrous B: New Structural Constraints from One- and Two-Dimensional 29Si and 1H NMR. Am. Mineral. 2008, 93, 1099–1111. [Google Scholar] [CrossRef]
- Phillips, B.L.; Burnley, P.C.; Worminghaus, K.; Navrotsky, A. 29Si and 1H NMR Spectroscopy of High-Pressure Hydrous Magnesium Silicates. Phys. Chem. Miner. 1997, 24, 179–190. [Google Scholar] [CrossRef]
- Yesinowski, J.P.; Eckert, H.; Rossman, G.R. Characterization of Hydrous Species in Minerals by High-Speed Proton MAS-NMR. J. Am. Chem. Soc. 1988, 110, 1367–1375. [Google Scholar] [CrossRef]
- Aramendía, M.A.; Borau, V.; Jiménez, C.; Marinas, J.M.; Ruiz, J.R.; Urbano, F.J. XRD and 1H MAS NMR Spectroscopic Study of Mixed Oxides Obtained by Calcination of Layered-Double Hydroxides. Mater. Lett. 2000, 46, 309–314. [Google Scholar] [CrossRef]
- Grüninger, H.; Schmutzler, A.; Siegel, R.; Armstrong, K.; Frost, D.J.; Senker, J. Quantitative Description of 1H SQ and DQ Coherences for the Hydroxyl Disorder within Hydrous Ringwoodite. Phys. Chem. Chem. Phys. 2018, 20, 15098–15105. [Google Scholar] [CrossRef]
- Griffin, J.M.; Miller, A.J.; Berry, A.J.; Wimperis, S.; Ashbrook, S.E. Dynamics on the Microsecond Timescale in Hydrous Silicates Studied by Solid-State 2H NMR Spectroscopy. Phys. Chem. Chem. Phys. 2010, 12, 2989–2998. [Google Scholar] [CrossRef]
- Griffin, J.M.; Berry, A.J.; Frost, D.J.; Wimperis, S.; Ashbrook, S.E. Water in the Earth’s Mantle: A Solid-State NMR Study of Hydrous Wadsleyite. Chem. Sci. 2013, 4, 1523–1538. [Google Scholar] [CrossRef] [Green Version]
- Moran, R.F.; McKay, D.; Pickard, C.J.; Berry, A.J.; Griffin, J.M.; Ashbrook, S.E. Hunting for Hydrogen: Random Structure Searching and Prediction of NMR Parameters of Hydrous Wadsleyite. Phys. Chem. Chem. Phys. 2016, 18, 10173–10181. [Google Scholar] [CrossRef] [PubMed] [Green Version]
- McKay, D.; Moran, R.F.; Dawson, D.M.; Griffin, J.M.; Sturniolo, S.; Pickard, C.J.; Berry, A.J.; Ashbrook, S.E. A Picture of Disorder in Hydrous Wadsleyite—Under the Combined Microscope of Solid-State NMR Spectroscopy and Ab Initio Random Structure Searching. J. Am. Chem. Soc. 2019, 141, 3024–3036. [Google Scholar] [CrossRef] [PubMed] [Green Version]
- Lide, D.R. CRC Handbook of Chemistry and Physics; CRC press: Boca Raton, FL, USA, 1998. [Google Scholar]
- Sears, R.; Kaliaperumal, R.; Manogaran, S. 1H Shielding Anisotropy in Mg(OH)2: The Isolated OH− Group. J. Chem. Phys. 1988, 88, 2284–2288. [Google Scholar] [CrossRef]
- Xue, X.; Kanzaki, M. High-Pressure δ-Al(OH)3 and δ-AlOOH Phases and Isostructural Hydroxides/Oxyhydroxides: New Structural Insights from High-Resolution 1H and 27Al NMR. J. Phys. Chem. B 2007, 111, 13156–13166. [Google Scholar] [CrossRef]
- Vasconcelos, F.; Cristol, S.; Paul, J.F.; Montagne, L.; Mauri, F.; Delevoye, L. First-Principles Calculations of NMR Parameters for Phosphate Materials. Magn. Reson. Chem. 2010, 48, S142–S150. [Google Scholar] [CrossRef]
- Pourpoint, F.; Gervais, C.; Bonhomme-Coury, L.; Azaïs, T.; Coelho, C.; Mauri, F.; Alonso, B.; Babonneau, F.; Bonhomme, C. Calcium Phosphates and Hydroxyapatite: Solid-State NMR Experiments and First-Principles Calculations. Appl. Magn. Reson. 2007, 32, 435–457. [Google Scholar] [CrossRef]
- Xue, X.; Kanzaki, M. Proton Distributions and Hydrogen Bonding in Crystalline and Glassy Hydrous Silicates and Related Inorganic Materials: Insights from High-Resolution Solid-State Nuclear Magnetic Resonance Spectroscopy. J. Am. Ceram. Soc. 2009, 92, 2803–2830. [Google Scholar] [CrossRef]
- Schnell, I.; Spiess, H.W. High-Resolution 1H NMR Spectroscopy in the Solid State: Very Fast Sample Rotation and Multiple-Quantum Coherences. J. Magn. Reson. 2001, 151, 153–227. [Google Scholar] [CrossRef]
- Massiot, D.; Fayon, F.; Capron, M.; King, I.; Le Calvé, S.; Alonso, B.; Durand, J.O.; Bujoli, B.; Gan, Z.; Hoatson, G. Modelling One and Two-Dimensional Solid-State NMR Spectra. Magn. Reson. Chem. 2002, 40, 70–76. [Google Scholar] [CrossRef]
- Gražulis, S.; Chateigner, D.; Downs, R.T.; Yokochi, A.; Quirós, M.; Lutterotti, L.; Manakova, E.; Butkus, J.; Moeck, P.; Le Bail, A. Crystallography Open Database–An Open-Access Collection of Crystal Structures. J. Appl. Crystallogr. 2009, 42, 726–729. [Google Scholar] [CrossRef]
- Giannozzi, P.; Baroni, S.; Bonini, N.; Calandra, M.; Car, R.; Cavazzoni, C.; Ceresoli, D.; Chiarotti, G.L.; Cococcioni, M.; Dabo, I. QUANTUM ESPRESSO: A Modular and Open-Source Software Project for Quantum Simulations of Materials. J. Phys. Condens. Matter 2009, 21, 395502. [Google Scholar] [CrossRef]
- Kresse, G.; Hafner, J. Norm-Conserving and Ultrasoft Pseudopotentials for First-Row and Transition Elements. J. Phys. Condens. Matter 1994, 6, 8245. [Google Scholar] [CrossRef]
- Perdew, J.P.; Burke, K.; Ernzerhof, M. Generalized Gradient Approximation Made Simple. Phys. Rev. Lett. 1996, 77, 3865. [Google Scholar] [CrossRef] [Green Version]
- Pickard, C.J.; Mauri, F. All-Electron Magnetic Response with Pseudopotentials: NMR Chemical Shifts. Phys. Rev. B 2001, 63, 245101. [Google Scholar] [CrossRef] [Green Version]
- Pedone, A.; Palazzetti, F.; Barone, V. Models of Aged Magnesium-Silicate-Hydrate Cements Based on the Lizardite and Talc Crystals: A Periodic DFT-GIPAW Investigation. J. Phys. Chem. C 2017, 121, 7319–7330. [Google Scholar] [CrossRef]
- Charpentier, T. The PAW/GIPAW Approach for Computing NMR Parameters: A New Dimension Added to NMR Study of Solids. Solid State Nucl. Magn. Reson. 2011, 40, 1–20. [Google Scholar] [CrossRef]
- Ashbrook, S.E.; McKay, D. Combining Solid-State NMR Spectroscopy with First-Principles Calculations—A Guide to NMR Crystallography. Chem. Commun. 2016, 52, 7186–7204. [Google Scholar] [CrossRef] [Green Version]
Sample Availability: Not available. |
Scheme 1.
Examples of different MgO conversion reactions.

Figure 1.
Deconvolution of the 1H- magic angle spinning (MAS) nuclear magnetic resonance (NMR) spectra for (a) brucite, Mg(OH)2, (b) nitromagnesite, Mg(NO3)2·6H2O, (c) bischofite, MgCl2·6H2O, (d) epsomite, MgSO4·7H2O, (e) magnesium bromide, MgBr2·6H2O, (f) hydromagnesite, 4MgCO3·Mg(OH)2·4H2O, (g) artinite, MgCO3·Mg(OH)2·3H2O, and (h) dypingite, 4MgCO3·Mg(OH)2·5H2O.

Figure 2.
2D double quantum (DQ)-single quantum (SQ) 1H-MAS-NMR correlation spectra for (a) hydromagnesite, 4MgCO3·Mg(OH)2·4H2O and (b) artinite, MgCO3·Mg(OH)2·3H2O. The auto-correlation peaks between protons in the same environment (chemical shift) are identified by solid circles, and the colored lines identify correlation between different proton environments.

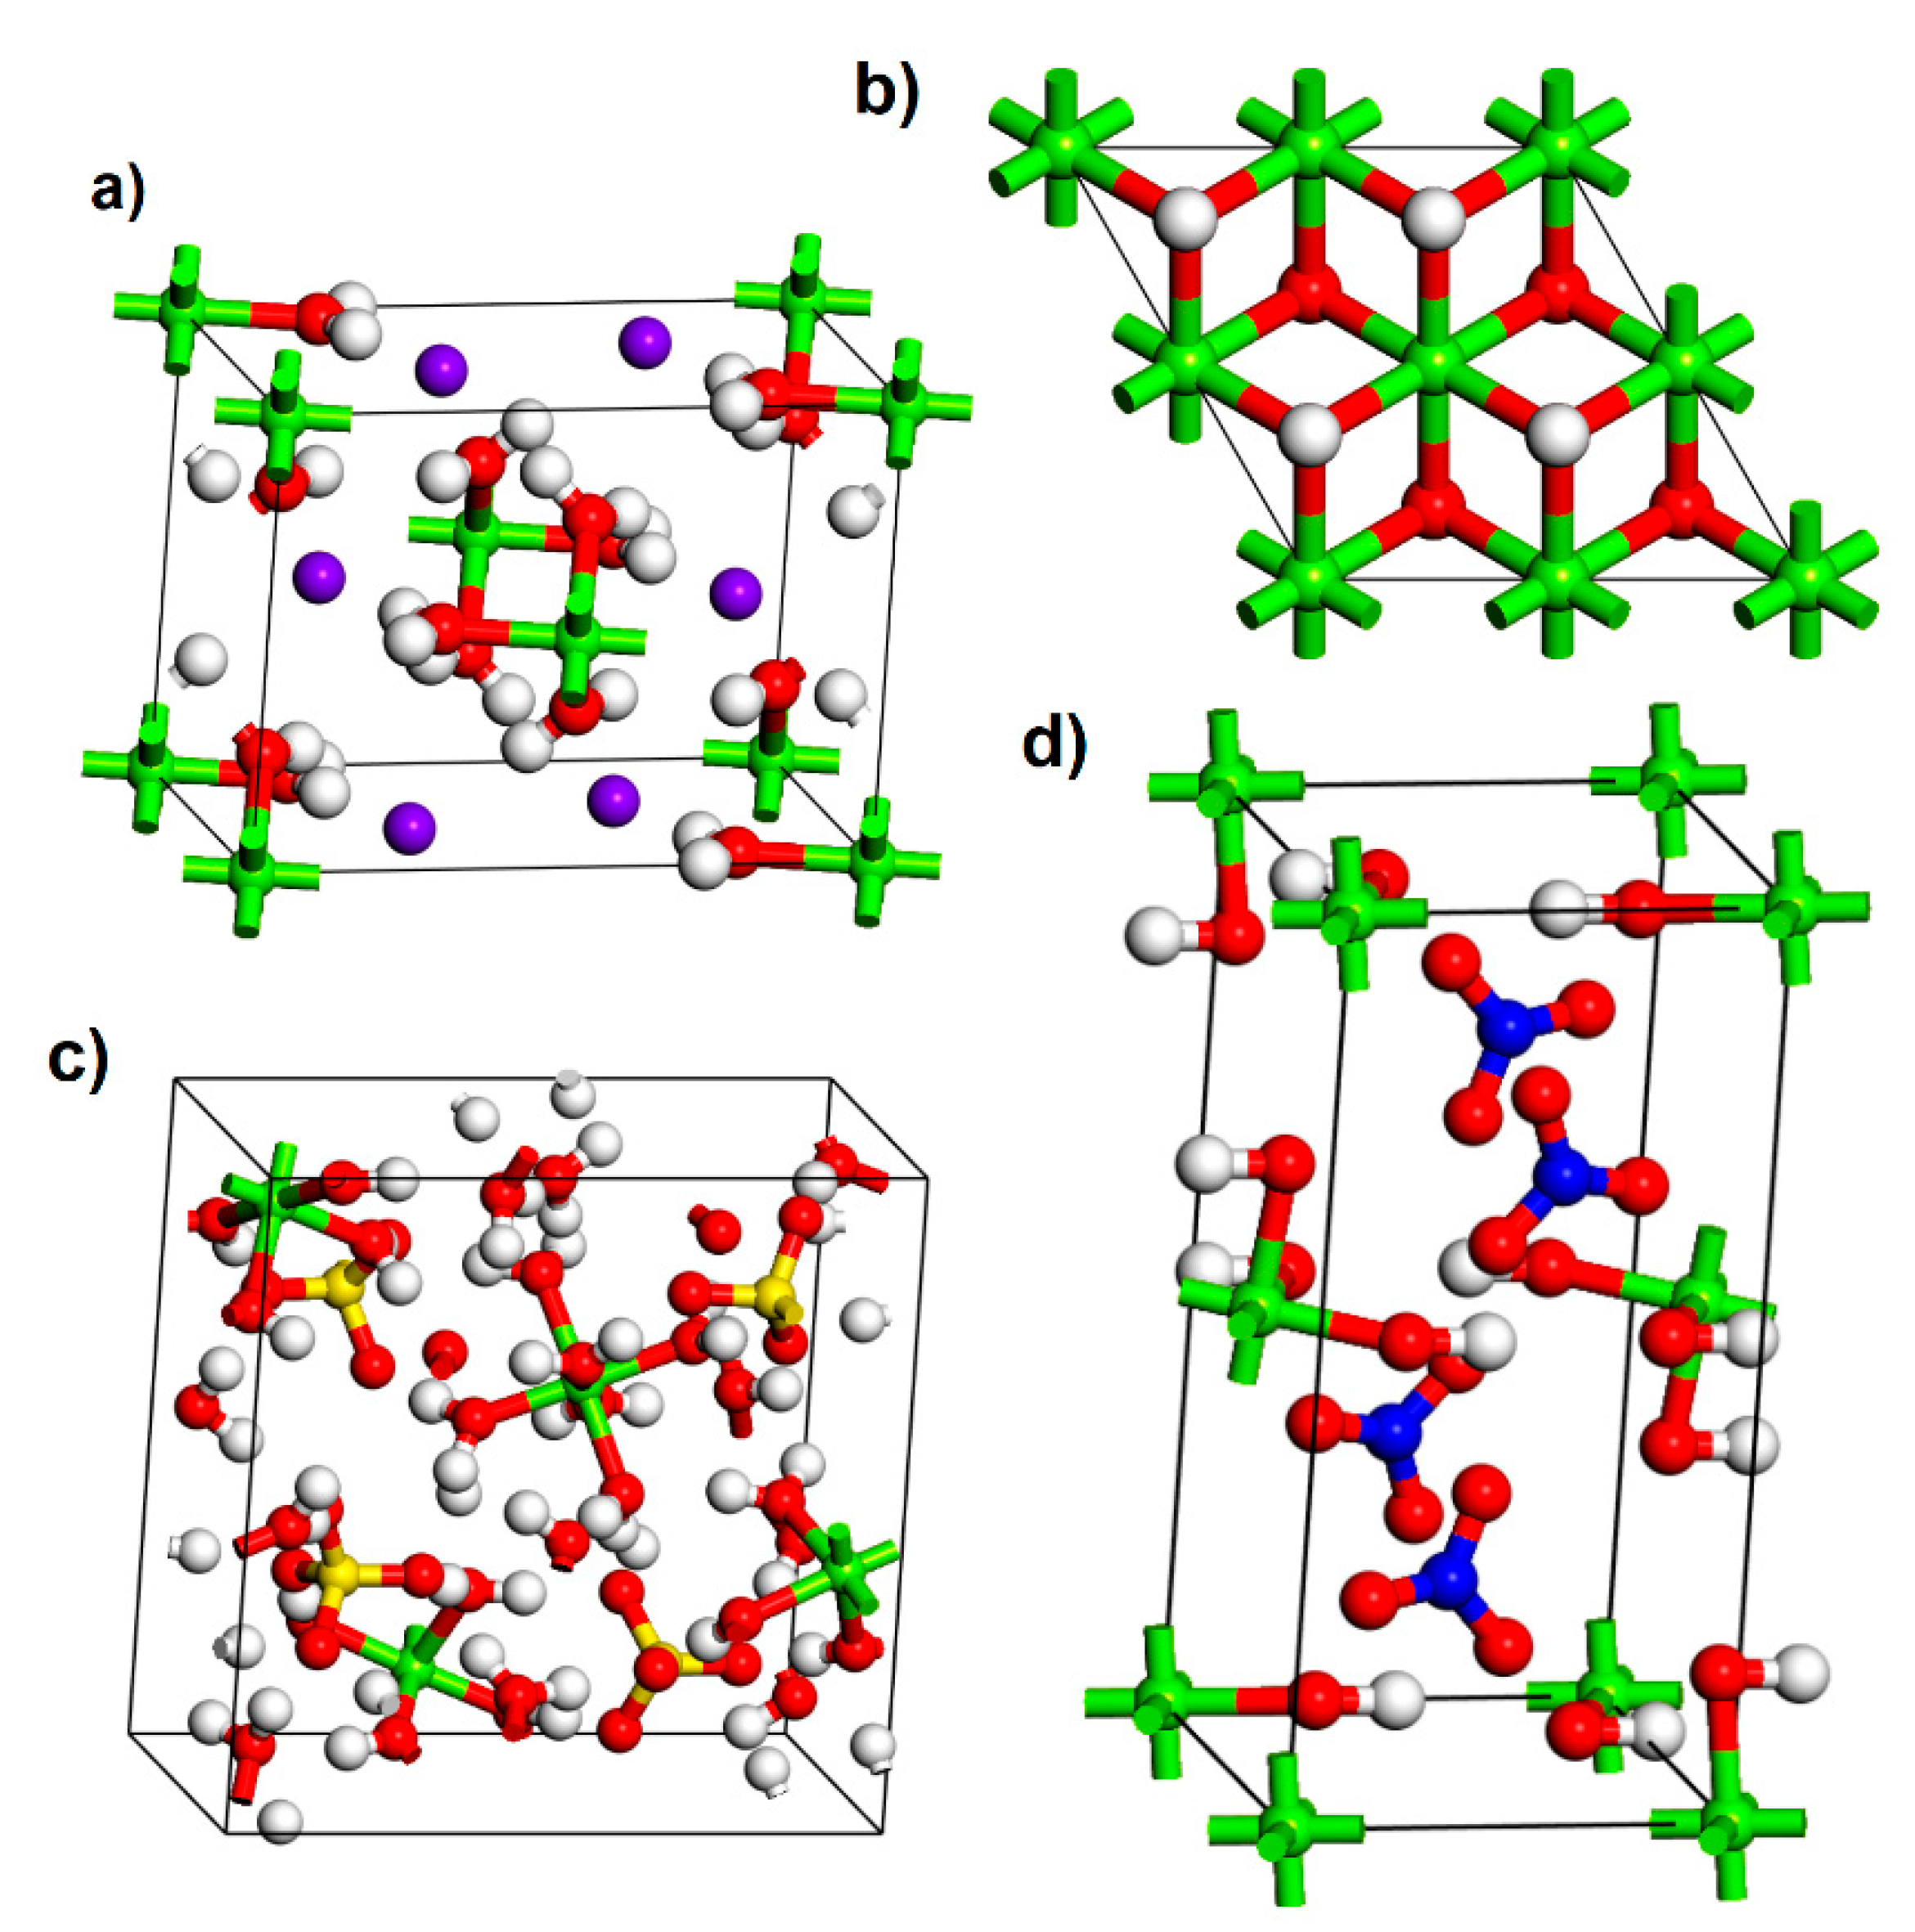
Figure 3.
Snapshots of four different MgO-containing crystal structures (a) MgCl2·6H2O, (b) Mg(OH)2, (c) MgSO4·7H2O, and (d) MgNO3·6H2O. Atom colors: Mg (green), O (red), H (white), Cl (purple), S (yellow), and N (blue).
Figure 3.
Snapshots of four different MgO-containing crystal structures (a) MgCl2·6H2O, (b) Mg(OH)2, (c) MgSO4·7H2O, and (d) MgNO3·6H2O. Atom colors: Mg (green), O (red), H (white), Cl (purple), S (yellow), and N (blue).

Figure 4.
Correlation (R2 = 0.9268) between the average computational 1H-NMR shielding and experimental chemical shift for select MgO crystalline structures.
Figure 4.
Correlation (R2 = 0.9268) between the average computational 1H-NMR shielding and experimental chemical shift for select MgO crystalline structures.

Figure 5.
Calculated 1H-NMR isotropic chemical shift (δ) values versus OH…O hydrogen bond lengths (Å) for refence compounds. The dashed line serves as a guide line to the reader.
Figure 5.
Calculated 1H-NMR isotropic chemical shift (δ) values versus OH…O hydrogen bond lengths (Å) for refence compounds. The dashed line serves as a guide line to the reader.


Table 1.
1H-NMR chemical shifts (δ), relative concentration (%), and computational chemical shielding (σ) of proton environments in select Mg-containing materials. Reference compounds shown in bold.
Table 1.
1H-NMR chemical shifts (δ), relative concentration (%), and computational chemical shielding (σ) of proton environments in select Mg-containing materials. Reference compounds shown in bold.
| System | 1H-NMR (ppm) [Experimental] | Conc. (%) | Average 1H-NMR [Computational] | ||
|---|---|---|---|---|---|
| σ (ppm) | δ (ppm) a | COD ID c,d | |||
| Mg(OH)2 | 0.05 | 93.2% | 30.75 | −0.31 | 1000054(ND) |
| 4.9 b | 6.8% | ||||
| −0.5 to 0.0 ± 2 Refs. [34,35,36] | |||||
| Mg(NO3)2·6H2O | 4.5 | 4.6% | 25.1 ± 0.5 | 4.6 ± 0.4 | 9011207(XD) |
| 4.0 | 95.4% | ||||
| MgCl2·6H2O | 4.5 | 2.0% | 24.0 ± 0.3 | 5.1 ± 0.2 | 9011352(ND) |
| 4.3 | 98.0% | ||||
| MgSO4·7H2O | 5.0 | 97.1% | 23.4 ± 0.5 | 5.55 ± 0.4 | 9010743(ND) |
| 4.4 b | 2.9% | ||||
| Mg7Si4O14(OH)2 | 3.9 Ref. [30] | 26.75 ± 0.04 | 2.76 ± 0.03 | 1534957(M) | |
| 4.1 Ref. [30] | |||||
| Mg5Si2O8(OH)2 | 1.1 Ref. [25] | 29.9 ± 0.3 | 0.3 ± 0.2 | 9016666(XD) | |
| MgBr2·6H2O | 4.1 | 100% | |||
| hydromagnesite [4MgCO3·Mg(OH)2·4H2O] | −1.4 | 10.6% | |||
| −1.0 | 8.5% | ||||
| 1.1 | 0.1% | ||||
| 5.5 | 48.3% | ||||
| 7.0 | 31.6% | ||||
| 16.9 | 0.9% | ||||
| artinite [MgCO3·Mg(OH)2·3H2O] | −1.6 | 1.8% | |||
| −1.3 | 3.3% | ||||
| −0.4 | 0.6% | ||||
| −0.1 | 16.9% | ||||
| 0.8 | 0.1% | ||||
| 5.2 | 39.8% | ||||
| 7.0 | 37.5% | ||||
| dypingite [4MgCO3·Mg(OH)2·5H2O] | −1.4 | 13.2% | |||
| −1.1 | 5.1% | ||||
| 0.7 | 0.2% | ||||
| 1.1 | 1.0% | ||||
| 5.5 | 52.9% | ||||
| 7.0 | 27.1% | ||||
| 16.9 | 0.5% | ||||
| NaOH | −3.2 | 72.9% | 34.5 | −3.1 | 2310820(XD) |
| 0.8 b | 20.5% | ||||
| 4.8 b | 3.0% | ||||
| 8.6 b | 3.5% | ||||
a Chemical shift referenced using Equation (3). b Assigned to residual surface adsorbed water. c COD ID = Crystallography Open Database ID number, d ND = neutron diffraction, XD = X-Ray diffraction, M = Model.
Table 2.
Computational 1H-NMR chemical shieldings (σ) and chemical shifts (δ) for 17 Mg-O-H, Mg-Cl-O-H, and Na-O-H containing compounds.
Table 2.
Computational 1H-NMR chemical shieldings (σ) and chemical shifts (δ) for 17 Mg-O-H, Mg-Cl-O-H, and Na-O-H containing compounds.
| System | 1H-NMR [Computational] | COD ID b | |
|---|---|---|---|
| σ (ppm) | δ (ppm) a | ||
| MgO Hydroxides | |||
| Mg5O4(OH)2 | 30.50 | 0.01 | 1531159 |
| Mg4O3(OH)2 | 29.56 | 0.74 | 1531161 |
| Mg3O2(OH)2 | 29.53, 30.49 | 0.02, 0.78 | 1531164 |
| Mg2O(OH)2 | 30.43 | 0.07 | 1531167 |
| Mg3O(OH)4 | 29.90, 30.25 | 0.21, 0.49 | 1531171 |
| Mg5O(OH)8 | 29.55, 29.56, 29.88, 30.25 | 0.21, 0.50, 0.76, 0.77 | 1531175 |
| Magnesium Chloride Hydrates | |||
| MgCl2·6H2O | 23.25, 23.32, 23.73, 24.15, 25.01, 25.36 | 5.69, 5.63, 5.31, 4.98, 4.31, 4.04 | 9011352 |
| MgCl2·4H2O | 24.69, 24.99, 25.08, 25.12 | 4.30, 4.33, 4.40, 4.64 | 2018339 |
| MgCl2·2H2O | 24.92 | 4.41 | 2102790 |
| MgCl2·H2O | 25.44, 25.15 | 4.05, 4.28 | 2102791 |
| Magnesium Perchlorate | |||
| Mg(ClO4)2·4H2O | 25.01, 25.02, 26.66, 26.67 | 3.07, 4.39 | 2104832 |
| Mg(ClO4)2·2H2O | 26.34 | 3.33 | 2104833 |
| Mg-Cements | |||
| 3Mg(OH)2·MgCl2·8H2O | 15.96, 22.51, 22.89, 23.27, 25.10, 25.66, 26.00, 26.16, 30.19, 30.32, 30.68 | 11.61, 6.38, 6.08, 5.78, 4.32, 3.87, 3.60, 3.47, 0.26, 0.15, −0.13 | 9010975 |
| 5Mg(OH)2·MgCl2·8H2O | 20.18, 24.20, 24.49, 24.61, 28.10, 28.32, 28.55, 28.99, 29.71, 33.42 | 8.24, 5.03, 4.80, 4.71, 1.92, 1.75, 1.56, 1.21, 0.64, −2.32 | 2103035 |
| Hydrated NaOH (Layered) | |||
| NaOH·H2O | 20.28, 20.8, 27.14 | 8.15, 7.78, 2.69 | 1532133 |
| α-NaOH·4H2O | 16.01, 18.15, 20.84, 21.03, 21.77, 25.32, 25.63, 27.67, 29.59 | 11.57, 9.86, 7.71, 7.56, 6.97, 4.14, 3.89, 2.27, 0.74 | 1532135 |
| β-NaOH·4H2O | 18.95, 21.46, 22.44, 24.13, 24.64, 26.65, 27.27, 30.33 | 9.29, 7.24, 6.45, 5.13, 4.69, 3.00, 2.60, 0.16 | 1532136 |
a Referenced using Equation (3). b Crystallography Open Database ID number.
© 2020 by the authors. Licensee MDPI, Basel, Switzerland. This article is an open access article distributed under the terms and conditions of the Creative Commons Attribution (CC BY) license (http://creativecommons.org/licenses/by/4.0/).
Share and Cite
MDPI and ACS Style
Sorte, E.G.; Rimsza, J.M.; Alam, T.M. Computational and Experimental 1H-NMR Study of Hydrated Mg-Based Minerals. Molecules 2020, 25, 933. https://0-doi-org.brum.beds.ac.uk/10.3390/molecules25040933
AMA Style
Sorte EG, Rimsza JM, Alam TM. Computational and Experimental 1H-NMR Study of Hydrated Mg-Based Minerals. Molecules. 2020; 25(4):933. https://0-doi-org.brum.beds.ac.uk/10.3390/molecules25040933
Chicago/Turabian StyleSorte, Eric G., Jessica M. Rimsza, and Todd M. Alam. 2020. "Computational and Experimental 1H-NMR Study of Hydrated Mg-Based Minerals" Molecules 25, no. 4: 933. https://0-doi-org.brum.beds.ac.uk/10.3390/molecules25040933